










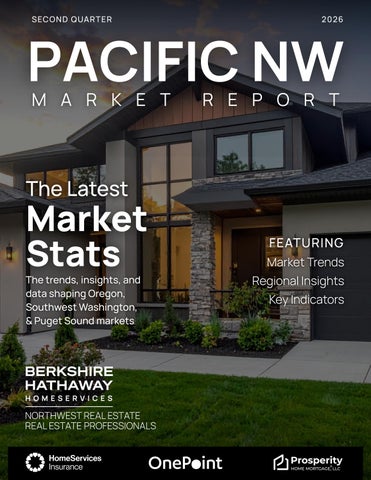
The Berkshire Hathaway HomeServices Pacific NW Market Report provides a comprehensive look at residential real estate activity across the region, featuring the latest MLS data, local market statistics, and year-over-year trends Through key performance indicators and market summaries, this report offers valuable insights into the markets we serve throughout the Pacific Northwest, including:
• Greater Portland Metro Area
• Southwest Washington (Vancouver Metro Area)
• Greater Seattle Metro Area (King, Pierce, Snohomish, & Thurston)
• Mid-Willamette Valley (Marion, Polk, Linn, & Benton)
• Central Oregon
• Eugene, Coastal, & Southern Oregon (Lane, Tillamook, & Douglas)
Explore the trends shaping today's housing market, uncover key regional insights, and stay informed with the knowledge you need to navigate real estate across the Pacific Northwest.
Since 1942, we’ve helped people buy and sell homes throughout Oregon and Washington. Today, with 30 offices and a growing network of nearly 1,000 real estate professionals, we continue to lead the Northwest by combining exceptional service with the market expertise and data-driven insights featured throughout this report
For more information and guidance in successfully navigating today’s ever-changing real estate market, contact your local Berkshire Hathaway HomeServices broker We are
All statistics are based upon MLS data for the period of April 1, 2026 – June 30, 2026

The second quarter of 2026 reflected a housing market moving toward greater balance across Oregon and Washington. While conditions varied by region, the data reinforced an encouraging theme: buyers remained engaged, inventory improved in many markets, and home prices demonstrated notable stability despite a more measured pace of activity
Market performance reflected the distinct dynamics of communities throughout the Pacific Northwest. Greater Portland built on positive momentum with gains in both pending and closed sales, while the Greater Seattle Metro Area experienced a more measured quarter as inventory expanded and buyers became increasingly selective Southwest Washington also demonstrated steady buyer engagement These regional differences are an important reminder that real estate is inherently local, with each market responding to its own combination of inventory, buyer demand, pricing, and economic conditions.
Across much of the region, longer market times gave buyers additional opportunities to evaluate their options and negotiate favorable terms For sellers, success increasingly depended on strategic pricing, strong presentation, and a clear understanding of current conditions. As the market moves toward greater balance, opportunities continue to exist for buyers and sellers who approach their decisions with preparation and a well-informed strategy
While this report provides valuable insight into regional trends, every real estate decision is local Conditions can vary significantly from one community, neighborhood, and price point to the next. A knowledgeable Berkshire Hathaway HomeServices real estate professional can help you interpret today’s market, develop a strategy tailored to your goals, and guide you through your next move with confidence


Melanie Weidenbach, President & CEO
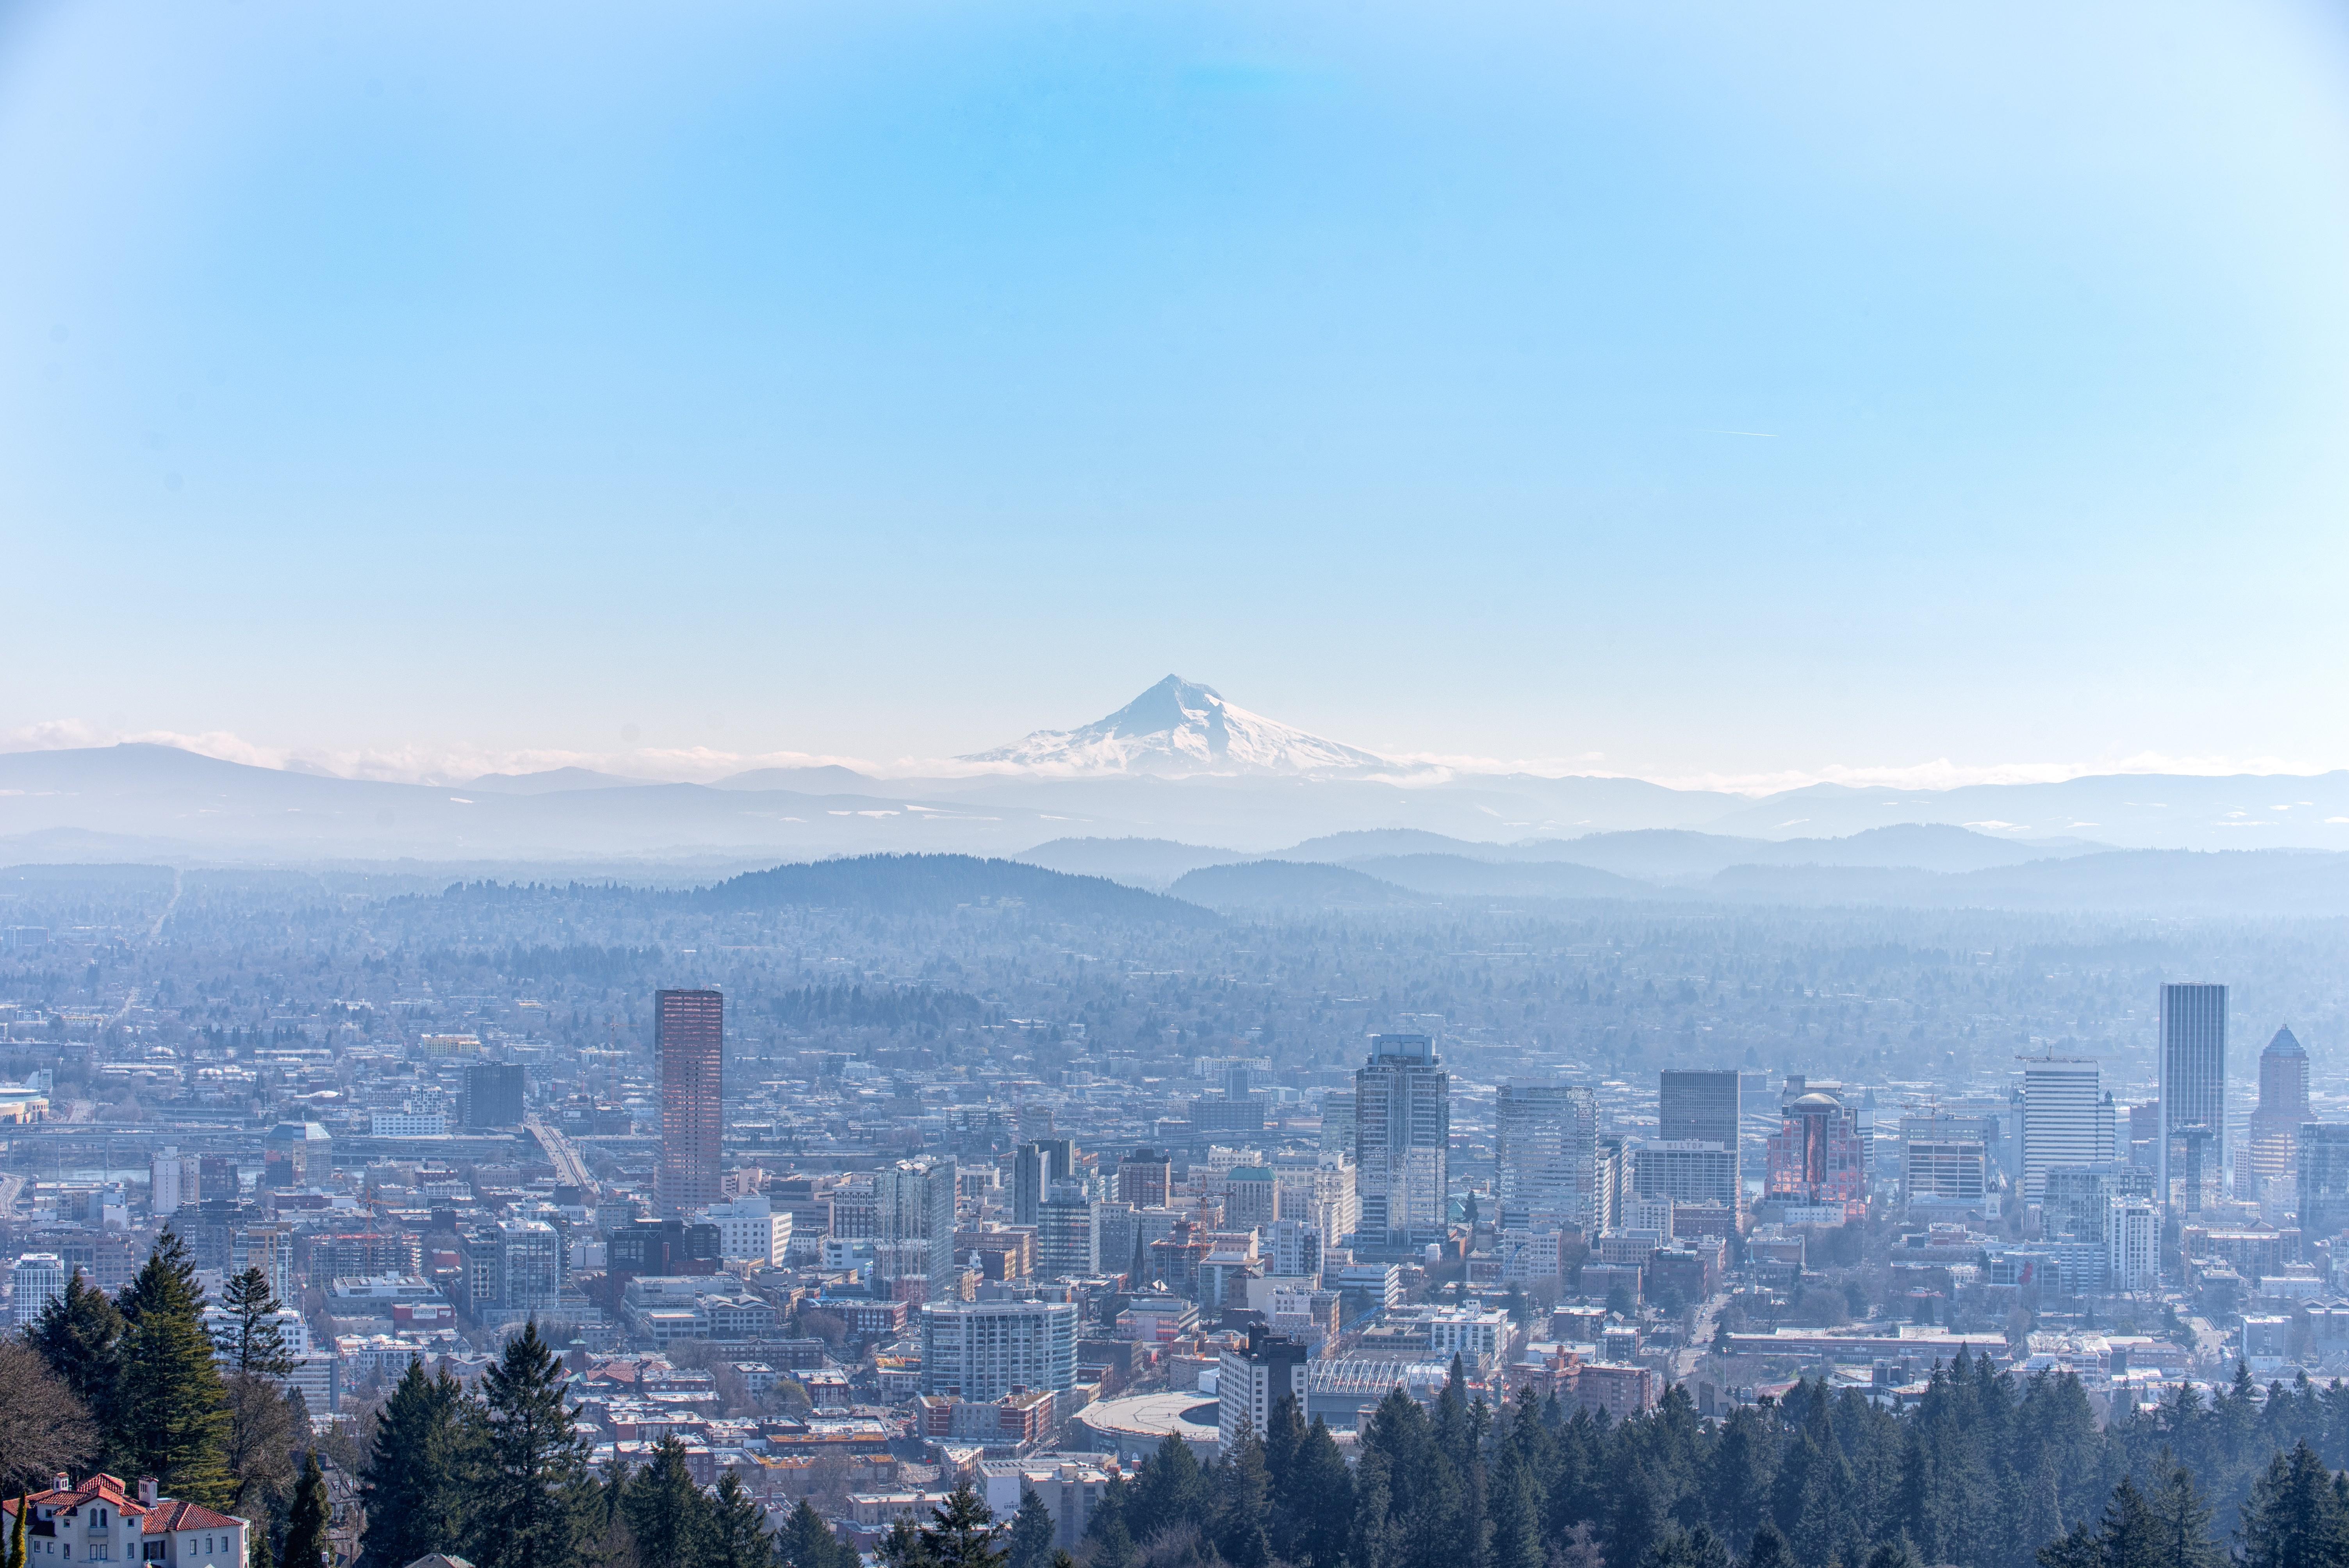
The Greater Portland Metro market showed steady momentum during Q2 2026 Increases in both pending and closed sales reflected healthy buyer activity, while modest price appreciation and slightly longer marketing times pointed to a market becoming more balanced for both buyers and sellers
51 Day Average
Homes spent slightly more time on the market, giving buyers additional time to make informed decisions while reinforcing the importance of thoughtful pricing for sellers ↑ 6% Year-Over-Year
New Listings ↓ 5%
Pending Sales ↑ 7%
Although fewer homes came to market than a year ago, pending sales increased, indicating buyers remained active despite more limited new inventory
$633,640
Average Sales Price ↑2% Year-Over-Year
Average home prices continued to show modest appreciation, reflecting steady demand and a stable pricing environment
6,665 Closed Sales ↑ 5% Year-Over-Year
Closed sales increased from the prior year, signaling continued strength in buyer activity across the Greater Portland Metro Area
LAKE OSWEGO
GRESHAM/ TROUTDALE
OREGON CITY
WILSONVILLE
HILLSBORO/



The Southwest Washington market remained resilient during the second quarter Buyer activity continued to strengthen, while stable home prices and longer marketing times reflected a market offering greater balance and increased opportunities for buyers
year ago, pare
New Listings ↓ 1%
Pending Sales ↑ 7%
New listing activity remained essentially unchanged, while stronger pending sales reflected continued buyer engagement.
HOME PRICES
$634,835
Average Sales Price ↓ 1% Year-Over-Year
Average pricing remained relatively stable, with only a slight year-over-year adjustment
1,897Closed Sales ↑ 7% Year-Over-Year
Closed transactions increased, reflecting solid demand throughout the Vancouver metro area.


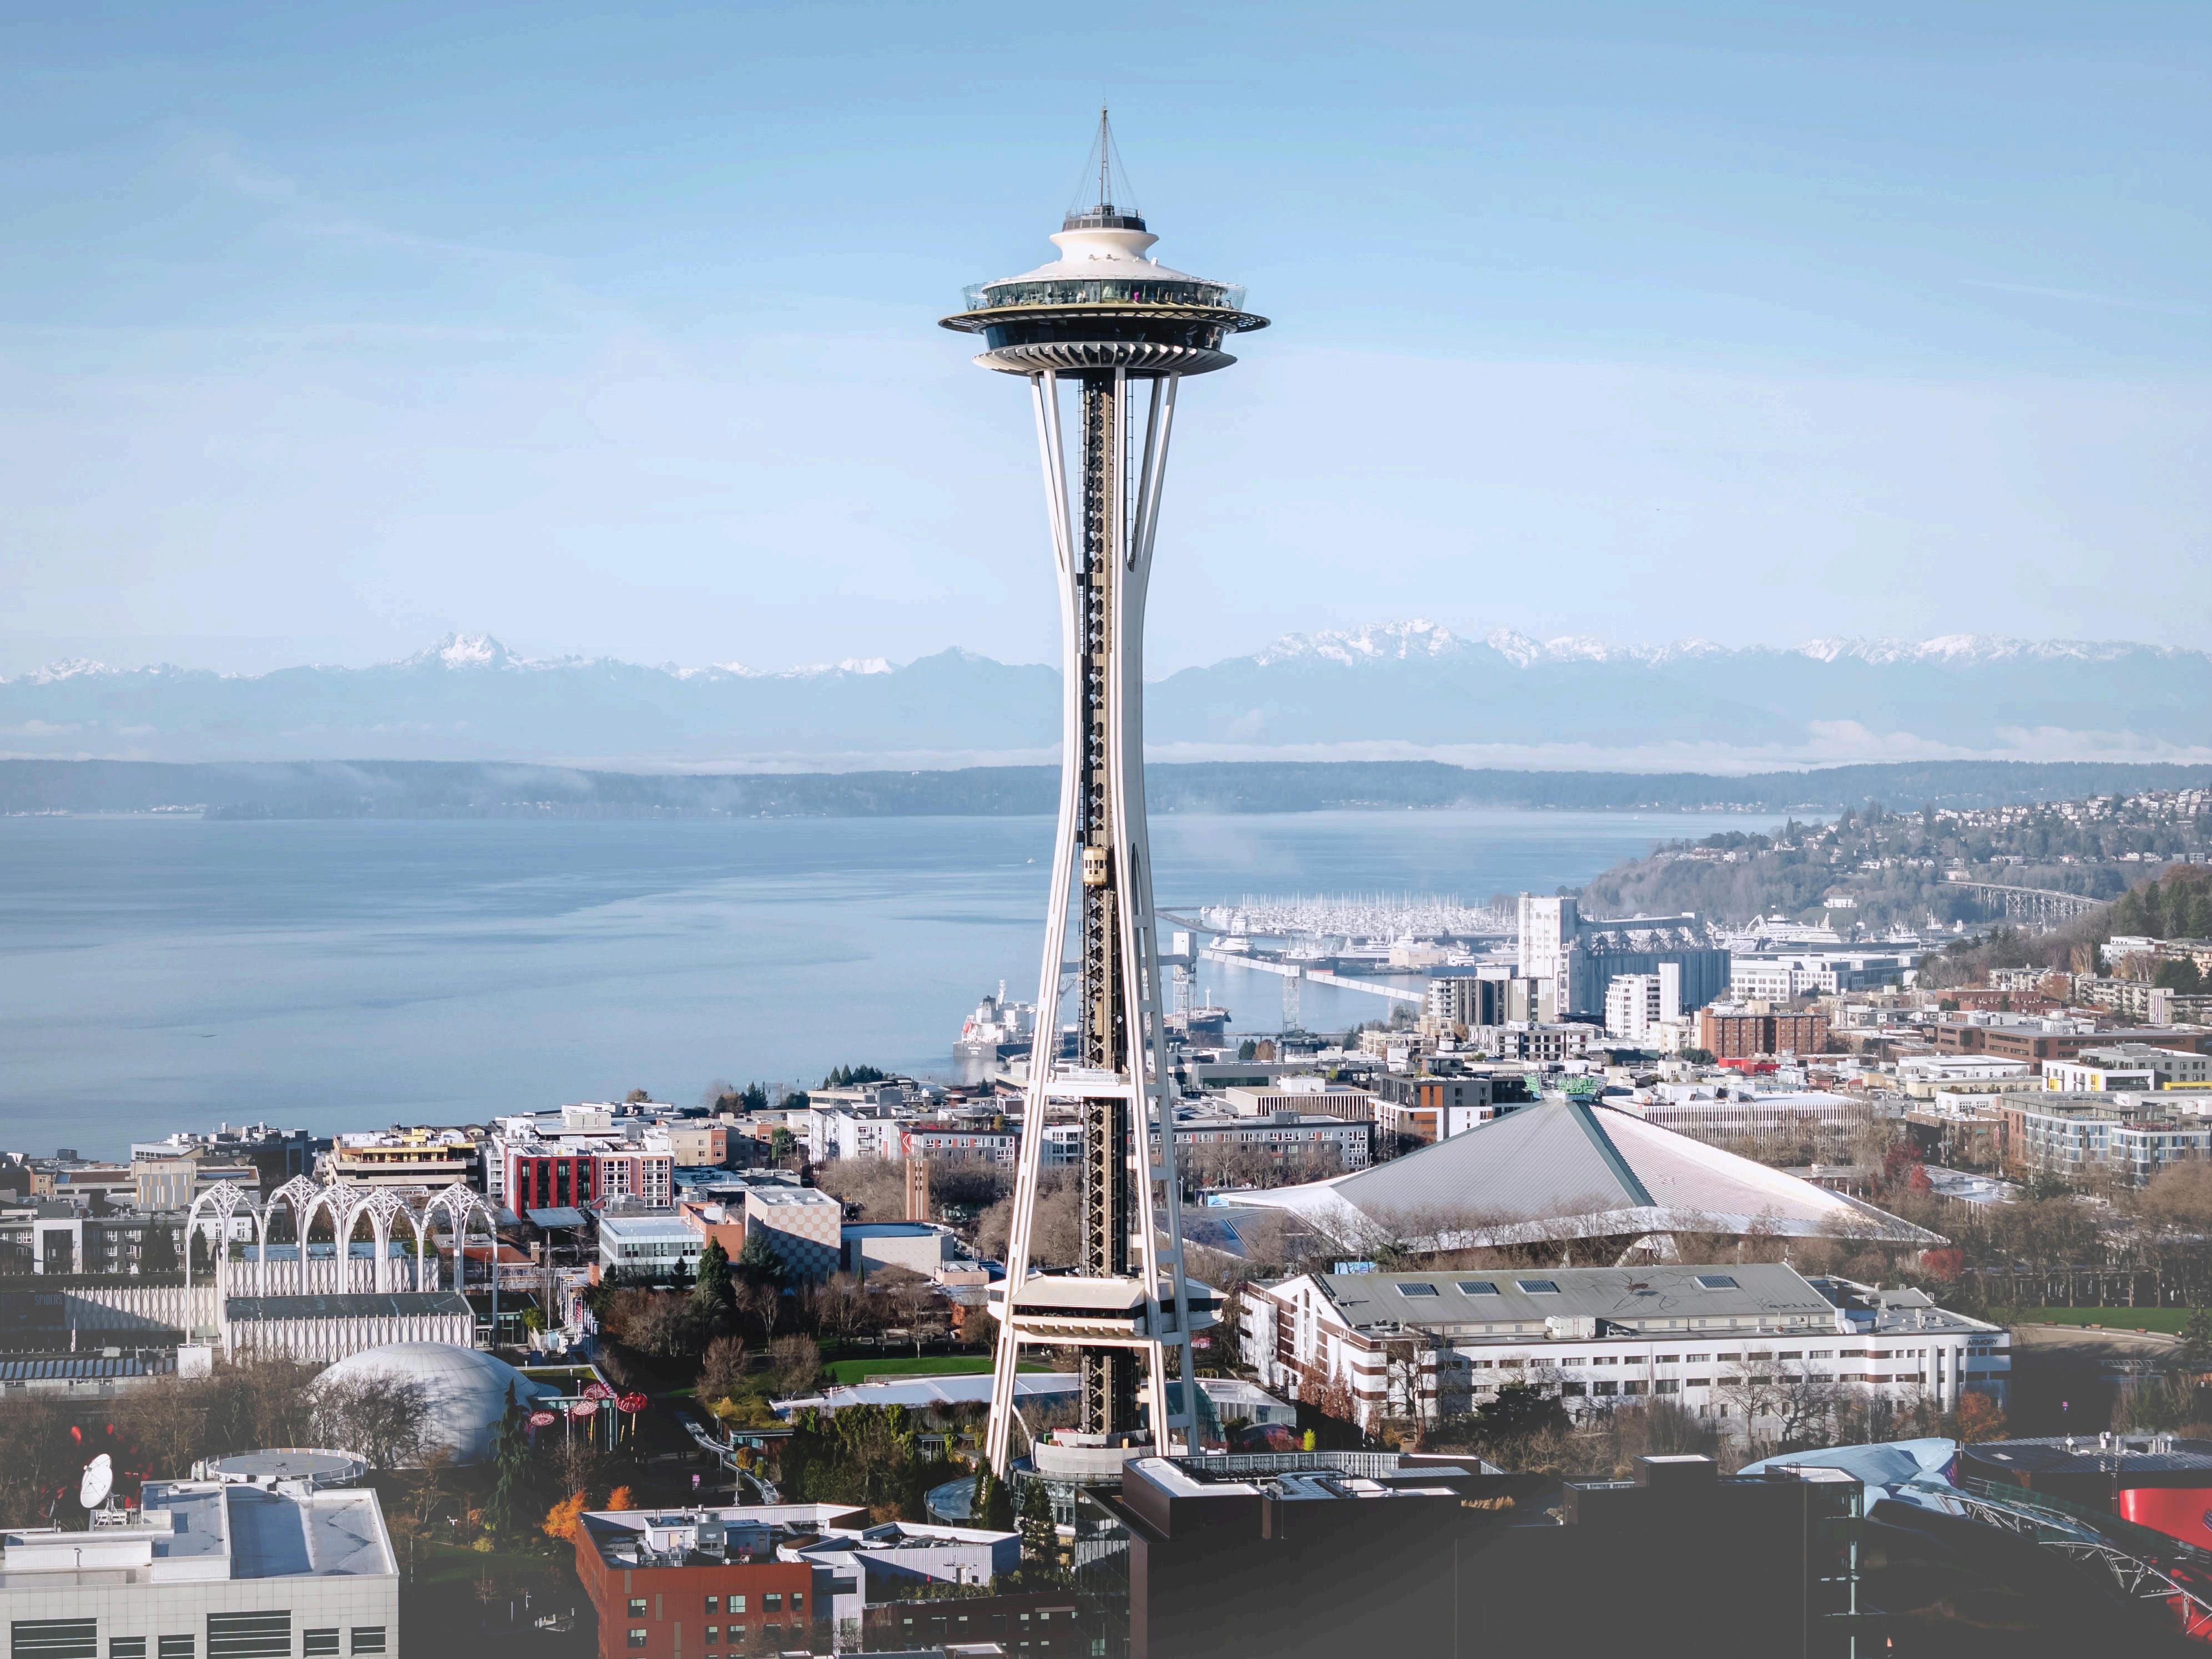
The Greater Seattle Metro Area experienced a more measured second quarter as inventory expanded and buyers became increasingly selective While prices, pending sales, and closed transactions softened modestly compared with last year, the region continued to show resilience
33 Day Average ↑ 22% Year-Over-Year
Homes generally remained on the market longer, creating a more deliberate pace for buyers and sellers
INVENTORY & DEMAND
New Listings ↑ 2%
Pending Sales ↓ 1%
Additional new listings increased available choices, while pending activity remained close to Q2 2025 levels
HOME PRICES
$915,717
Average Sales Price ↓ 2% Year-Over-Year
The regional average sales price eased modestly while remaining the highest among the major markets covered in this report.
SALES ACTIVITY
14,299 Closed Sales ↓ 4%Year-Over-Year
More than 14,000 homes closed during the quarter, demonstrating continued market demand despite a slower pace than the previous year


The Mid-Willamette Valley recorded modest growth in pricing and closed sales during Q2 2026 Pending activity increased notably, even as fewer new listings and longer market times contributed to more measured conditions
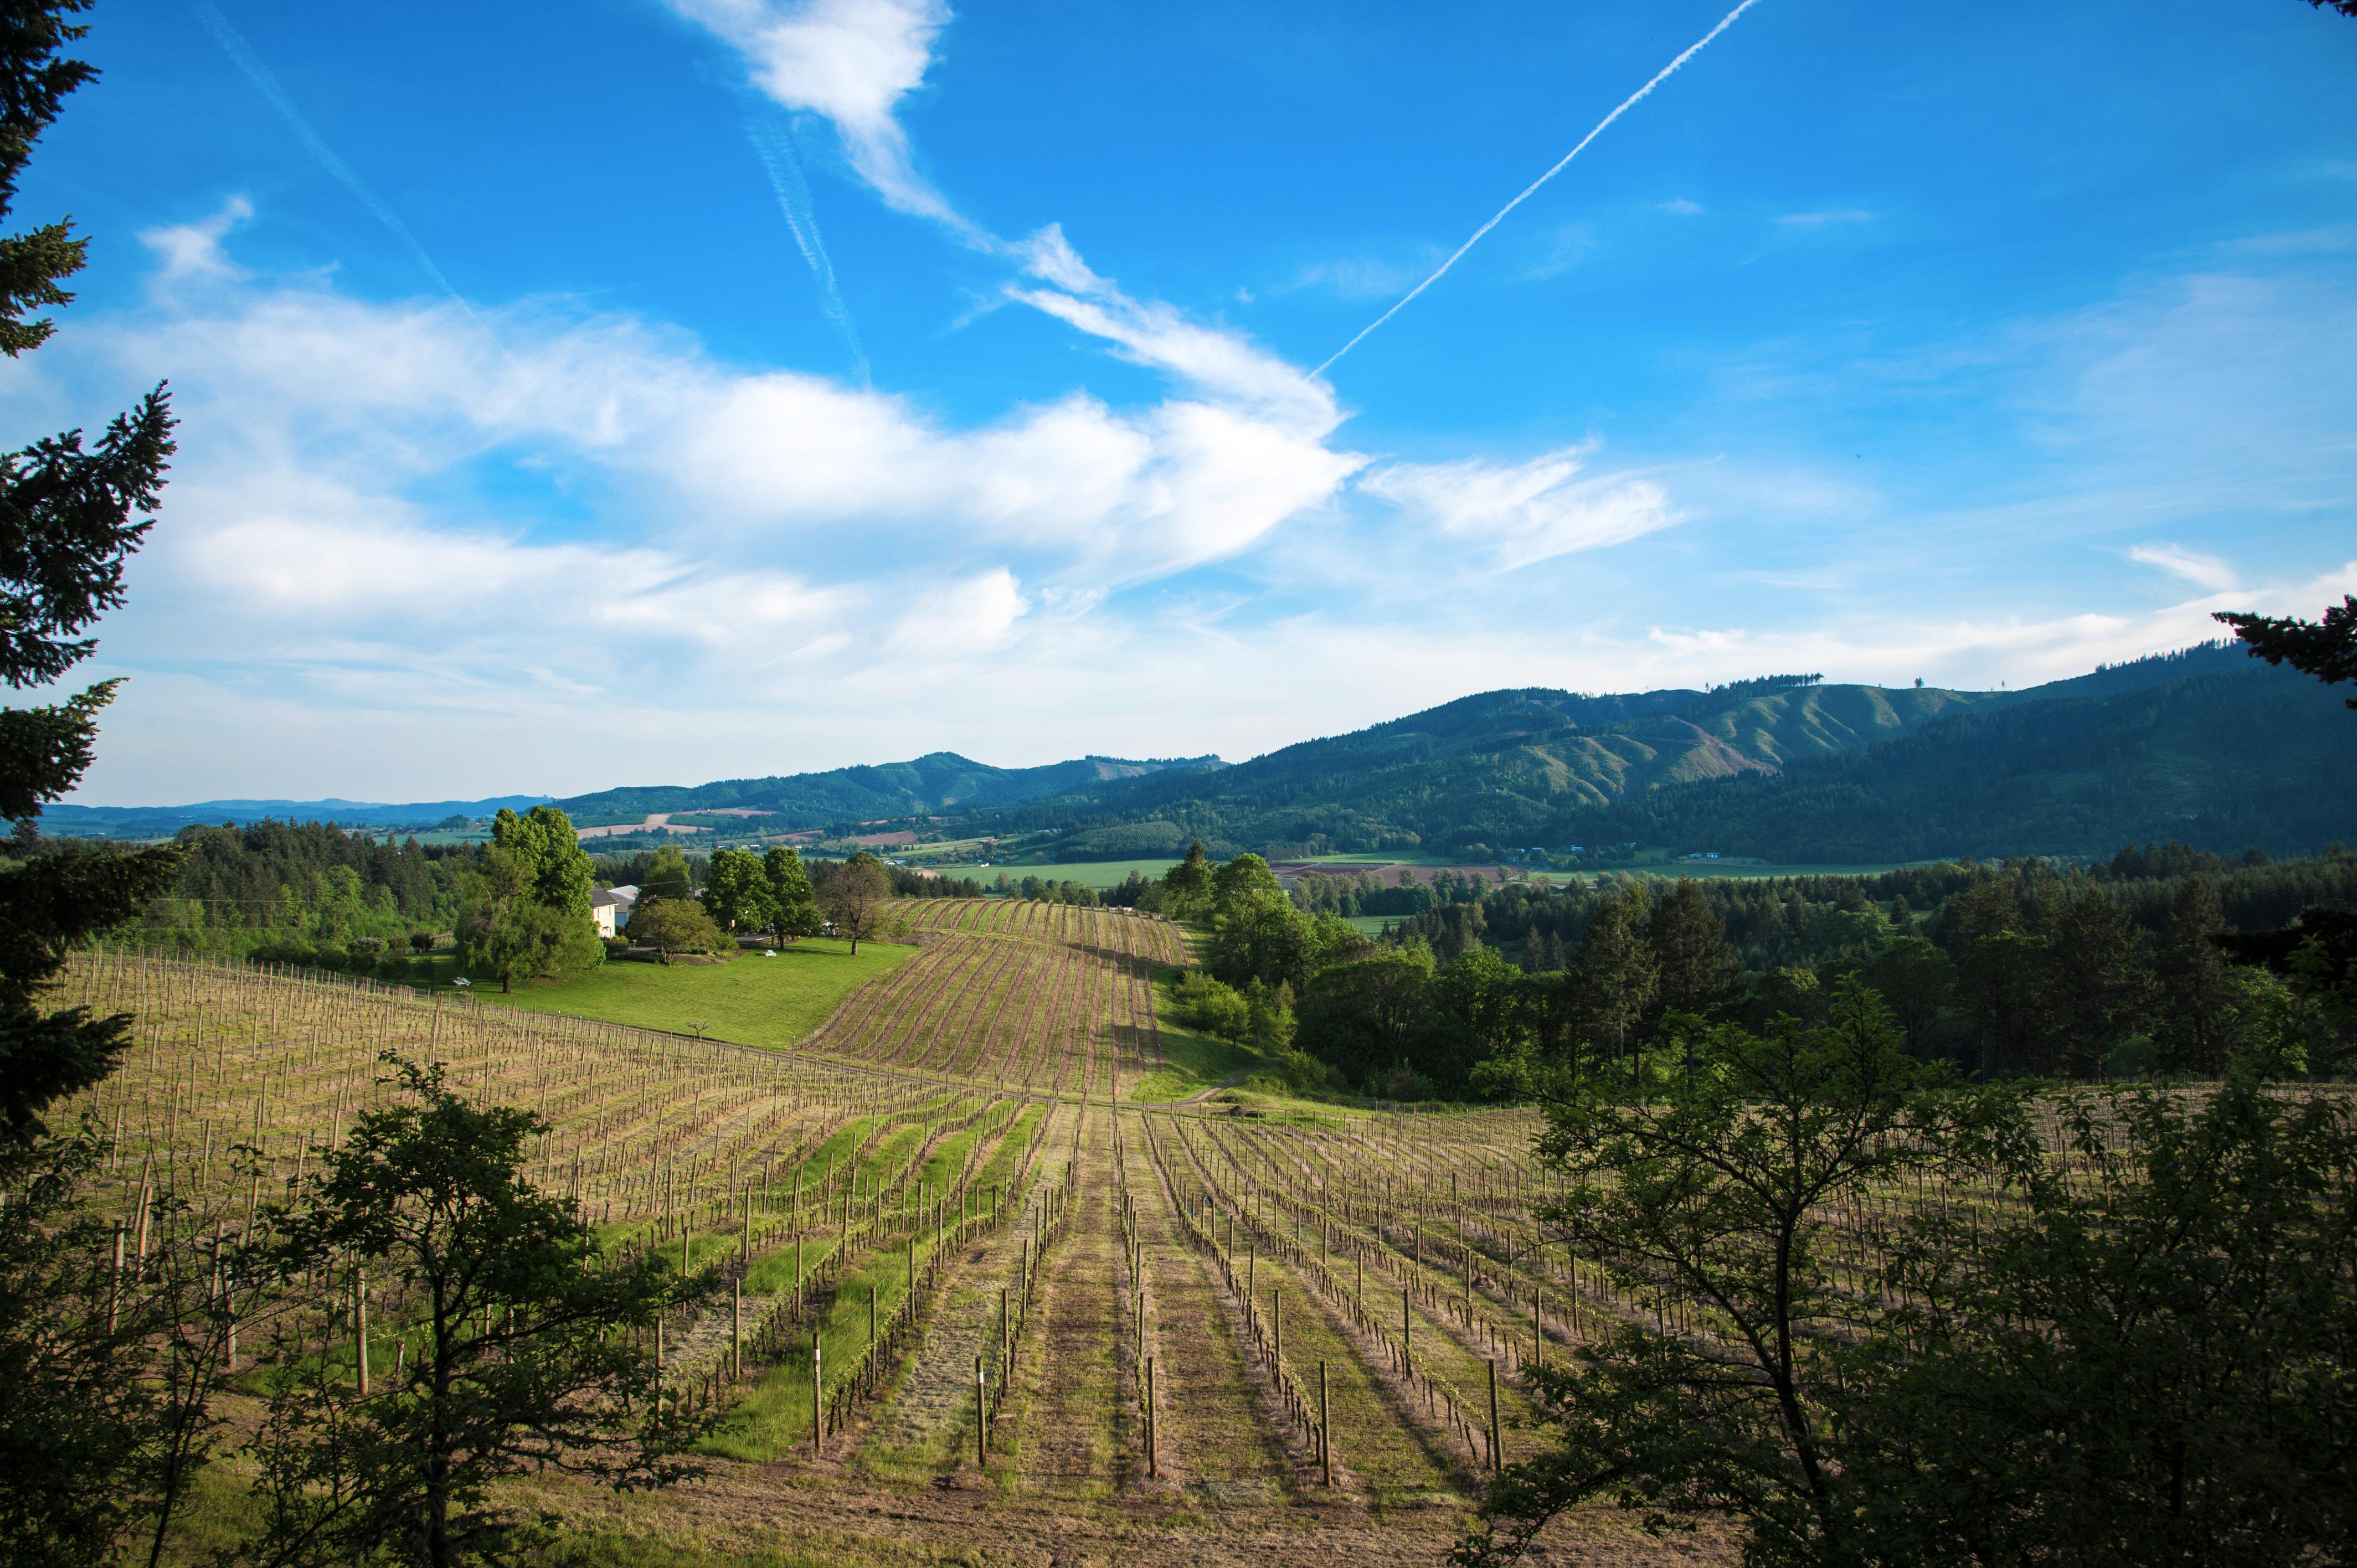
Longer marketing times gave buyers additional time to evaluate homes while reinforcing the importance of preparation and pricing for sellers
Despite fewer new listings, the increase in pending sales indicated healthy buyer interest across the region
Average home prices remained stable, with a modest increase compared with Q2 2025
1,186 Closed Sales ↑ 2% Year-Over-Year
Closed sales edged higher, demonstrating continued market resilience throughout the valley

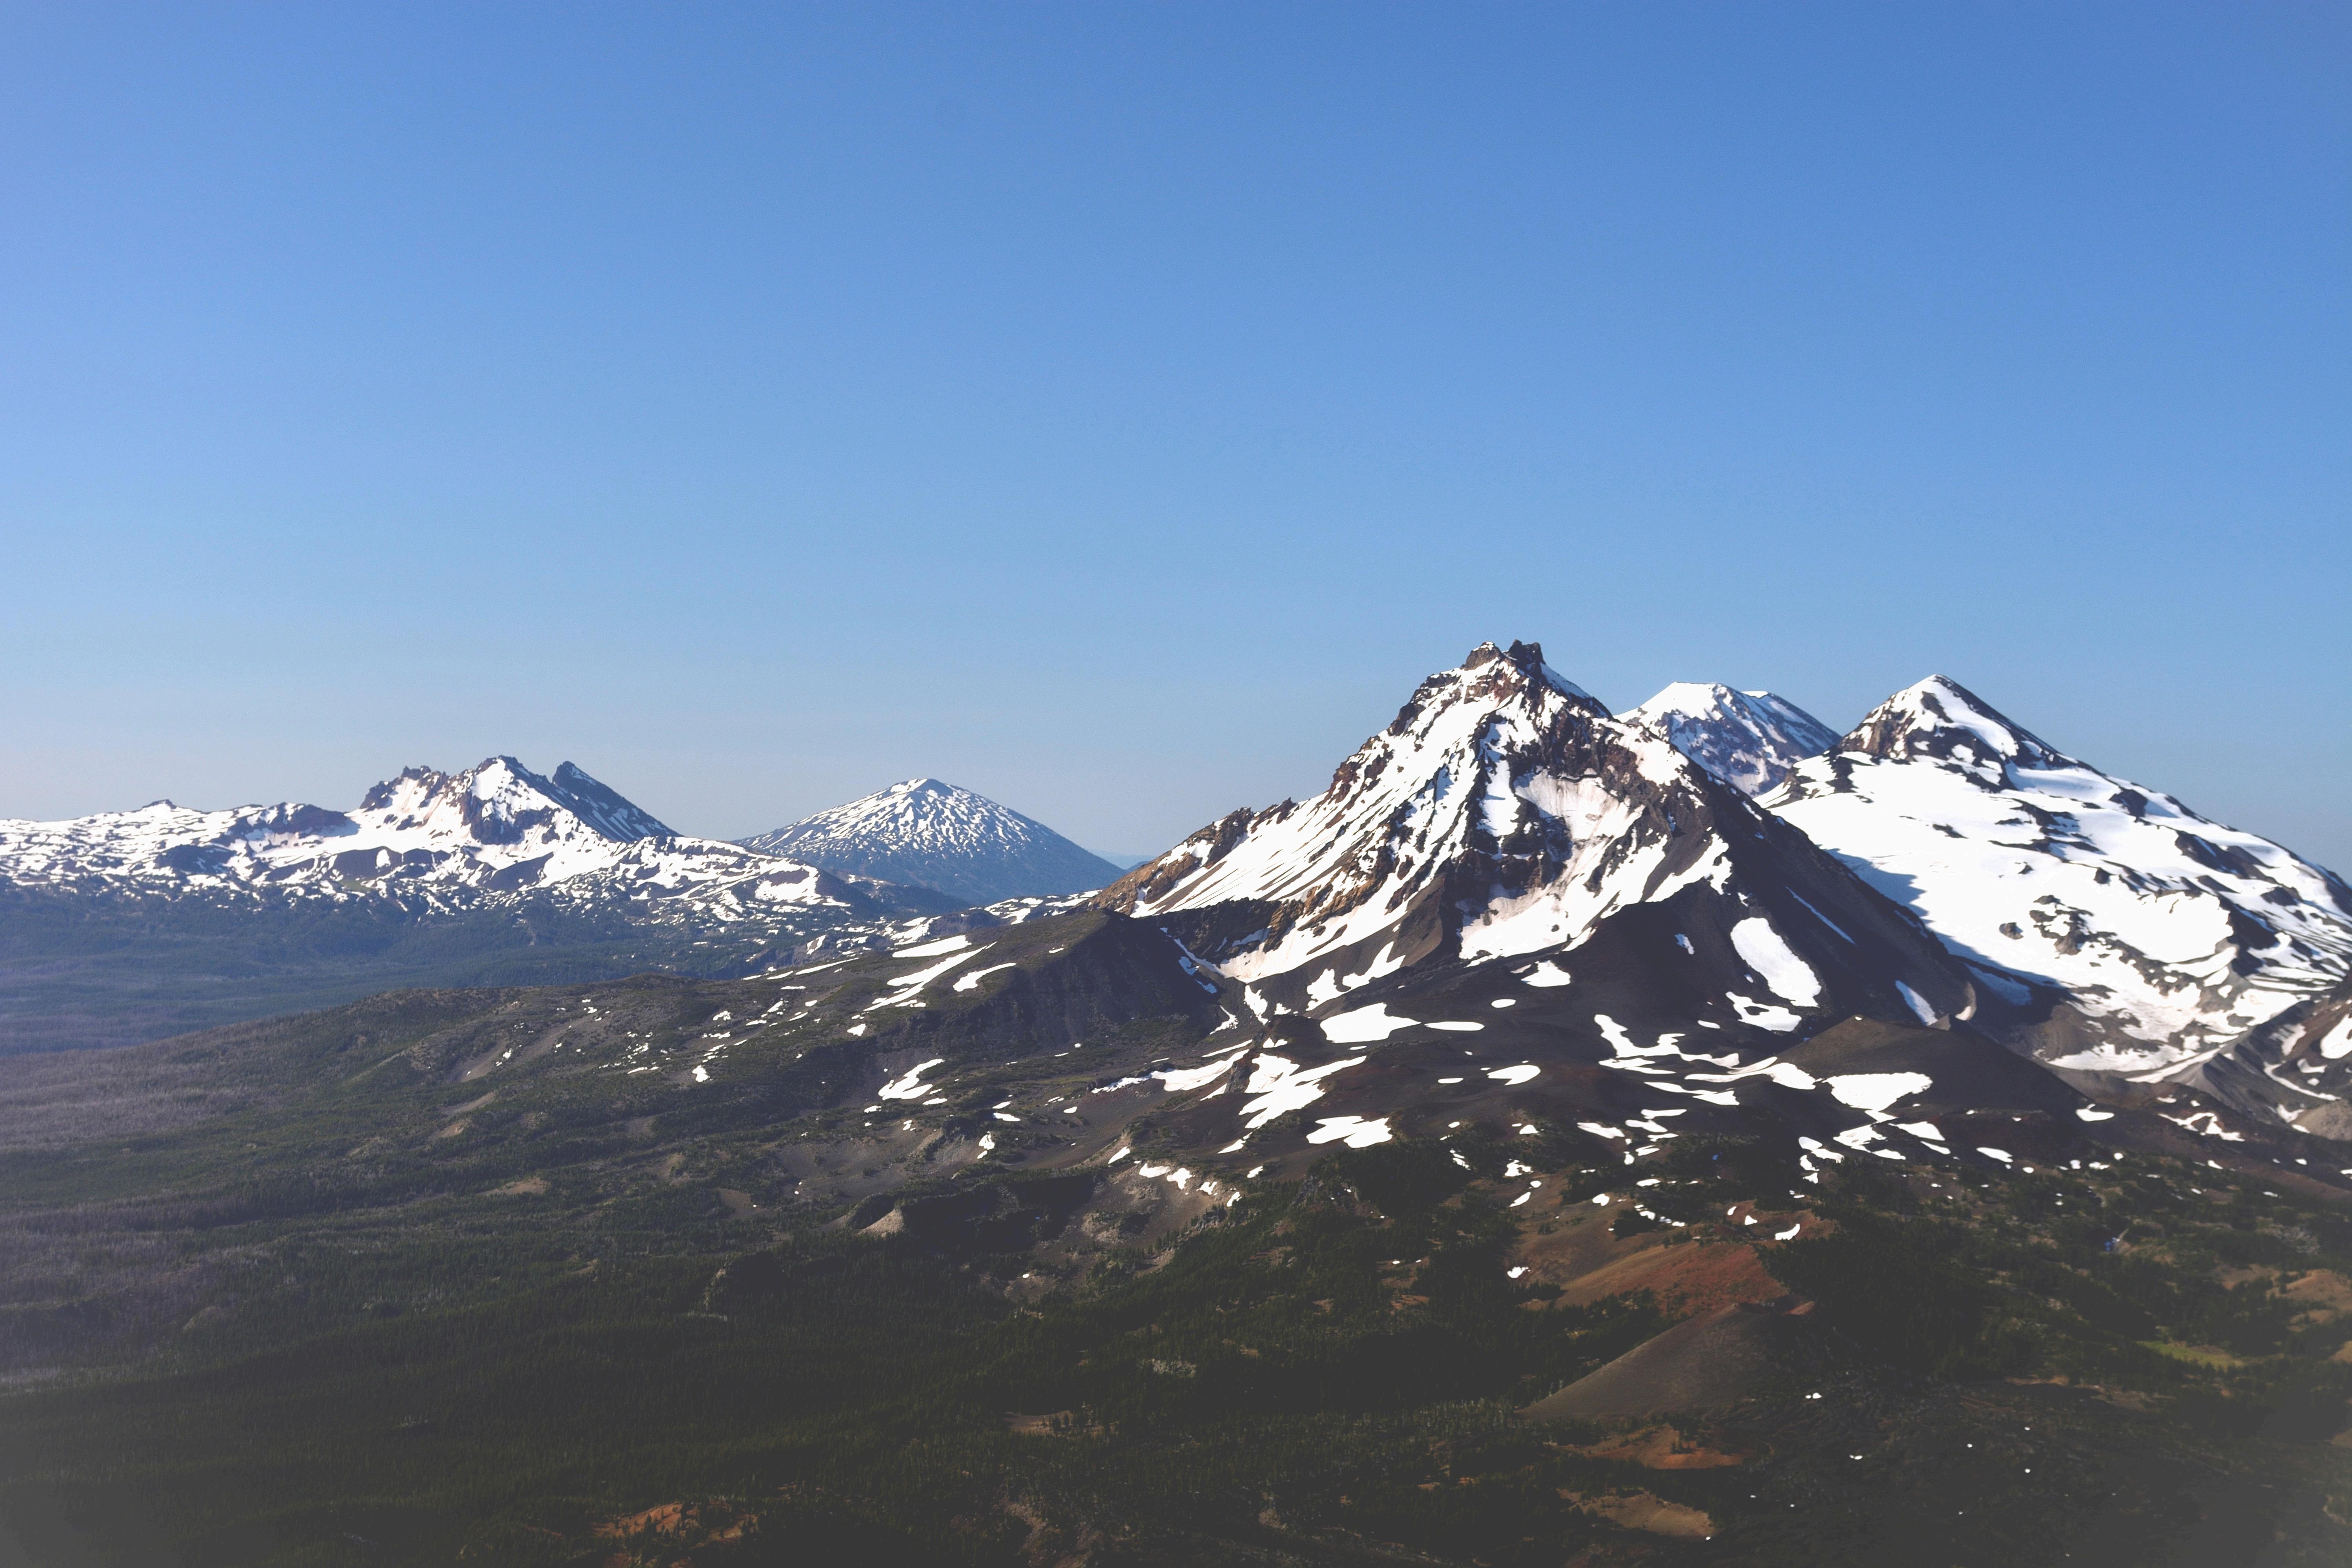
Central Oregon produced a strong second quarter, with increases in both pending and closed sales Prices remained essentially unchanged, while homes sold more quickly than they did during the same period last year
56 Day Average
↓ 13% Year-Over-Year
Homes sold more quickly than a year ago, indicating buyers acted decisively when desirable properties became available
New Listings Flat
Pending Sales ↑ 16%
New listing volume held steady, while the significant rise in pending sales demonstrated robust buyer demand
HOME PRICES
$818,096
Average Sales Price Flat Year-Over-Year
Average pricing remained virtually unchanged, reflecting stability across the Central Oregon market
1,193 Closed Sales
↑ 9% Year-Over-Year
Closed sales posted the strongest year-over-year growth among the markets in this report, reflecting sustained buyer demand and continued confidence in the Central Oregon market


The Eugene, Coastal and Southern Oregon market posted gains in pricing, pending transactions and closed sales during Q2 2026 Although fewer homes entered the market and properties took longer to sell, overall activity remained resilient
59 Day Average
↑ 18% Year-Over-Year
Longer market times gave buyers additional time to compare properties and negotiate terms
INVENTORY & DEMAND
New Listings ↓ 5%
Pending Sales ↑ 2%
New listing activity declined, while pending sales increased modestly and reflected continued buyer demand
HOME PRICES
$459,064
Average Sales Price ↑ 2% Year-Over-Year
Average prices increased moderately, supported by gains across several local markets
SALES ACTIVITY
1,603 Closed Sales
↑ 5% Year-Over-Year
Closed sales rose from the previous year, demonstrating sustained activity across Eugene, the Oregon Coast and Southern Oregon


