
Q1 2026

PACIFIC NW MARKET REPORT

ABOUT THIS REPORT
The Berkshire Hathaway HomeServices Quarterly Market Report features the latest MLS data and local market statistics. Through year-over-year comparisons of key performance indicators and market summaries, this report delivers a comprehensive overview of residential real estate activity for the regions we service across the Pacific Northwest, including:
• Greater Portland Metro Area
• Southwest Washington (Vancouver Metro Area)
• Greater Seattle Metro Area (King, Pierce, Snohomish, & Thurston)
• Mid-Willamette Valley (Marion, Polk, Linn, & Benton)
• Central Oregon
• Eugene, Coastal, and Southern Oregon (Lane, Tillamook, & Douglas)
Learn about trends affecting sales activity and price, read decisive takeaways for each market, and empower yourself with Northwest Knowledge.
ABOUT US
Since 1942, we’ve been helping people buy and sell homes throughout Oregon and Washington. Today, with 30 offices and a regional network of nearly 1,000 real estate professionals, Berkshire Hathaway HomeServices continues to lead the Northwest in delivering exceptional service, trusted local expertise, and data-driven market intelligence like the insights featured throughout this report.
Through OnePoint, we provide a more complete real estate experience by bringing together brokerage, mortgage, insurance, and title services in one connected process. This integrated approach helps simplify each step of the transaction, giving buyers and sellers greater clarity, convenience, and confidence from start to finish.
For more information or assistance navigating today’s real estate market, contact your local Berkshire Hathaway HomeServices broker. We are
LETTER FROM THE EDITOR
As you read through this Q1 2026 Quarterly Market Report, a clear theme emerges: balance. Across many of the Pacific Northwest markets featured in this report, the first quarter was not defined by dramatic swings or rapid acceleration, but by measured shifts in pricing, inventory, buyer activity, and sales pace.
Compared with the first quarter of last year, most regions experienced modest year-over-year changes. Average sales prices moved slightly up or down depending on the market, closed sales reflected continued buyer selectivity, and days on market generally pointed to a more thoughtful pace of activity. At the same time, increased listing activity in several areas gave buyers more options, while well-positioned homes continued to attract attention.
This is the type of market where broad headlines rarely tell the whole story. Conditions can vary significantly by neighborhood, price point, property type, and timing. In some communities, limited inventory is still supporting pricing. In others, expanding supply and longer marketing times are creating more room for negotiation.
That is why working with a knowledgeable Berkshire Hathaway HomeServices real estate broker is so important. A skilled local professional can help interpret the data, understand the trends behind the numbers, and guide you through decisions with clarity and confidence whether you are preparing to sell, searching for your next home, or evaluating real estate as part of your long-term financial goals.


Melanie Weidenbach, President & CEO
Greater Portland Metro Area

• New Listings: Up 1% to 7,133
• Closed Sales: Down 1% to 4,539
• Days on Market: Up 10% to 75 days
• Average Sales Price: Down 1% to $595,837
For the Greater Portland Metro Area, the first quarter brought stable yearover-year performance, as modest inventory growth and steady pricing created balanced conditions. While sales activity remained largely unchanged compared to Q1 2025, buyers are taking a more measured approach, contributing to longer marketing times and a more normalized market pace.
DAYS ON MARKET
The days on market average in the Greater Portland Metro Area was 75 this quarter, rising 10% from year-ago figures. Northeast Portland posted the lowest average time on market (52 days), a 4% increase from this time last year, and West Linn (93 days) posted a 69% gain year-over-year.
NEW LISTINGS, ACTIVE LISTINGS, & PENDING SALES
New listings (7,133) edged up by 1% year-over-year; active listings were 5% higher this quarter than they were during Q1 2025; and pending sales increased 6% to end the quarter at 5,630.
AVERAGE SALES PRICE
At $595,837, average sales price missed the mark by a slight 1% year-over-year. Average sales price was down in several cities, including Lake Oswego, where the average of $1,099,531 was a 12% decline from year-ago figures. Notably, Lake Oswego still posted the highest average sales price for the region. Both McMinnville and Sandy recorded an average sales price that was 9% higher than this time last year, ending Q1 2026 at $512,162 and $594,880, respectively.
CLOSED TRANSACTIONS
Closed transactions (4,539) dipped just 1% from year-ago figures. West Linn and Gresham/Troutdale saw increased market activity compared with this time period last year. In West Linn, closed units (88) were up 42% and in Gresham/ Troutdale closed units (226) climbed 25% from year-ago figures.
GREATER PORTLAND METRO AREA
Southwest Washington
(Vancouver Metro Area)
• New listings: Up 14% to 2,156
• Closed Sales: Up 3% to 1,397
• Days on Market: Up 17% to 75 days
• Average Sales Price: Up 6% to $640,078
Southwest Washington entered 2026 with strong year-over-year gains in both sales activity and pricing, supported by increased inventory and continued buyer demand. While homes are taking slightly longer to sell compared to Q1 2025, the region remains wellpositioned, offering a balance of value and opportunity as the spring market begins.
DAYS ON MARKET
Average days on market in Southwest Washington increased 17%, across the region. Washougal was the exception, with a 19% drop from 98 days in Q1 2025 down to 79.
AVERAGE SALES PRICE
Overall, average sales price rose 6% from year-ago figures. La Center ($707,400) increased 10%, and Battle Ground ($668,394), Longview/Kelso ($419,780), and Ridgefield ($770,110) all showed 7% increases.
CLOSED TRANSACTIONS
Closed transactions grew 3% year-over-year to end Q1 2026 at 1,397. Closed transactions in Camas (133) shot up 45% from year-ago figures and increased 11% in Woodland to end the quarter at 41.
NEW LISTINGS, ACTIVE LISTINGS, & PENDING SALES
New listings in the Vancouver Metro Area (2,156) were 14% higher than this time period last year. Active listings were also up, increasing 15% to 3,725 from 3,243 in Q1 2025. Pending sales followed this upward trajectory as well, rising 13% from year-ago figures to end Q1 2026 at 1,737.
SW WASHINGTON METRO AREA
NUMBER OF CLOSED UNITS
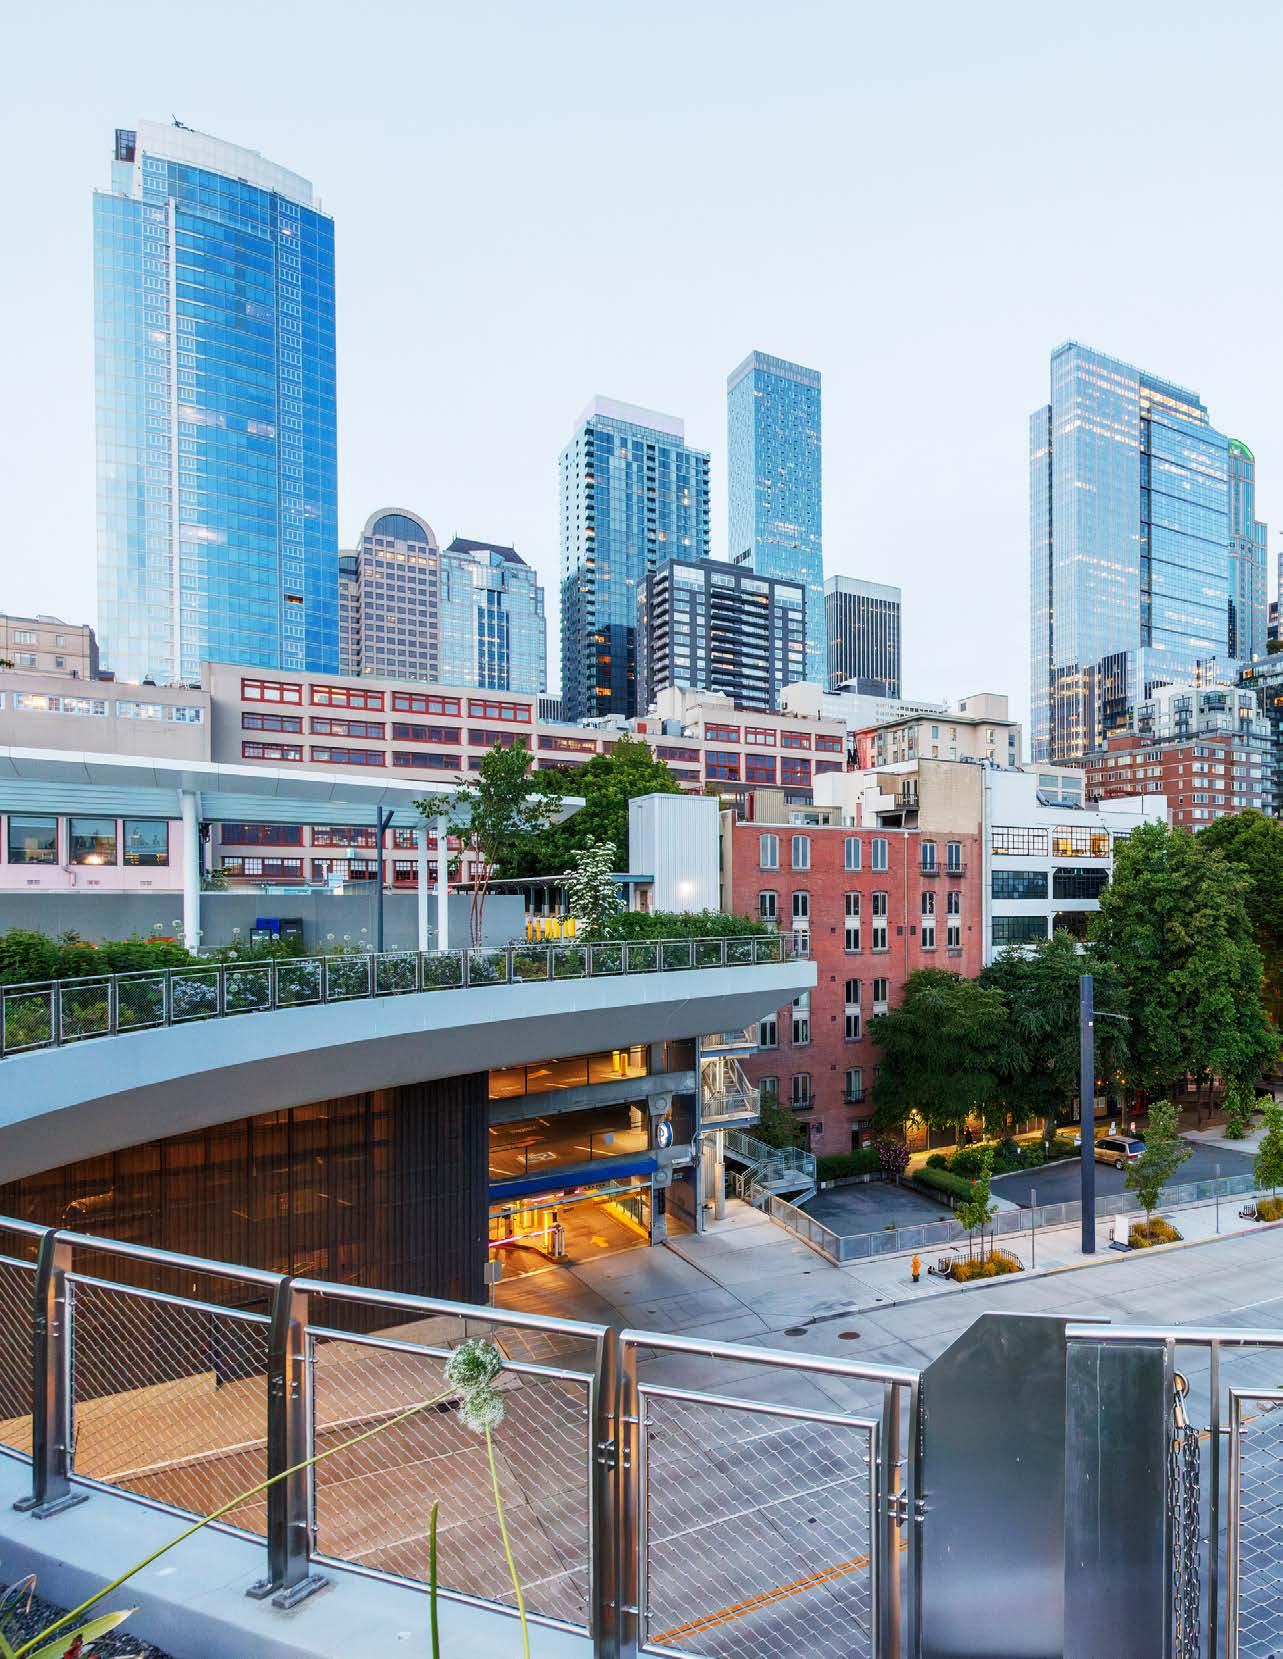
Greater Seattle Metro A rea
(King, Pierce, Snohomish, & Thurston)
• New Listings: Up 8% year-over-year
• Closed Sales: Down 5% to 10,195
• Days on Market: Up 19% to 50 days
• Average Sales Price: Down 2% to $860,183
The Greater Seattle Metro Area market entered Q1 2026 with a noticeable increase in listing activity and expanding inventory compared to the same period last year. While pricing and sales activity adjusted modestly year-overyear, demand remained steady across much of the region. With more options available and buyers taking a more thoughtful approach, market conditions continue to move toward a healthier, more balanced environment.
DAYS ON MARKET
Days on market increased 19% year-over-year, rising to an average of 50 days this quarter. In Redmond/Carnation, average days on market jumped 109% from year-ago figures, ending Q1 2026 at 46 days. At 33 days, Mercer Island posted the lowest average market time for the region, an 11% drop from this time last year.
CLOSED TRANSACTIONS
Closed transactions (10,195) missed the mark by 5% compared with Q1 2025. In Kent, closed units (194) fell 27% while in Lacey/DuPont and Puyallup, closed units were up 9% year-over-year, ending the quarter at 194 and 428, respectively.
PENDING SALES, NEW LISTINGS, & ACTIVE LISTINGS
Pending sales (12,347) were down a slight 2% from year-ago figures; new listings (17,718) increased 8%; and active listings increased by 15% to end Q1 2026 at 26,369.
AVERAGE SALES PRICE
Dipping 2%, average sales price in the Greater Seattle Metro Area ended the quarter at $860,183 compared with $880,381 this time last year. Average sales price in Everett ($580,253) and Mercer Island ($2,501,699) showed the greatest declines at 12%, and conversely, average sales price in Olympia ($635,442) was up 12% from year-ago figures. Redmond/Carnation and Central Seattle showed gains of 7% and 8%, respectively.
PACIFIC NW MARKET REPORT
GREATER SEATTLE METRO AREA
GREATER SEATTLE METRO AREA
2025 2026
NUMBER OF CLOSED UNITS
GIG HARBOR/ KEY PENINSULA
Mid-Willamette Valley
(Marion, Polk, Linn, & Benton)
• New Listings: Down 3% to 1,347
• Closed Sales: Down 3% year-over-year
• Days on Market: Up 32% to 86 days
• Average Sales Price: Up 2% to $456,0398
Like many other Pacific Northwest regions surveyed for this report, the Q1 Mid-Willamette Valley market was balanced, presenting distinct advantages for buyers and sellers. While closed sales activity softened slightly compared to the same period last year, increased inventory and longer marketing times reflect a market continuing to stabilize while offering strong value and opportunity.
DAYS ON MARKET
Throughout the region, average days on market increased 32% to 86 days yearover-year. Monmouth’s average market time increased 91% to 124 days and at 62 days, Stayton had the lowest average for the region, which represented a 3% rise from year-ago figures.
AVERAGE SALES PRICE
In the Mid-Willamette Valley, average sales price increased 2% year-over-year, rising from $446,943 in Q1 2025 to $456,039 this quarter. Stayton’s average sales price ($574,314) jumped 20%. In Independence, average sales price was also higher than last year, up 15% to end the quarter at $400,371.
PENDING SALES, NEW LISTINGS, & ACTIVE LISTINGS
Pending sales (1,078) edged up 6%; new listings (1,347) missed the mark by 3%; and at a total of 2,662, active listings were 6% higher than this time last year.
CLOSED TRANSACTIONS
Closed transactions in Marion, Polk, Linn, and Benton Counties were 3% lower than the first quarter of 2025, ending Q1 2026 at 835. Closed units in Independence (24) soared 60%, and closed sales were up 39% in Stayton, ending this quarter at 25.
PACIFIC NW MARKET REPORT
MID-WILLAMETTE VALLEY
MID-WILLAMETTE VALLEY
Central Oregon
• New Listings: Up 7% from Q1 2025
• Closed Sales: Down 3% to 832
• Days on Market: Up 18% to 92 days
• Average Sales Price: Down 3% to $773,484
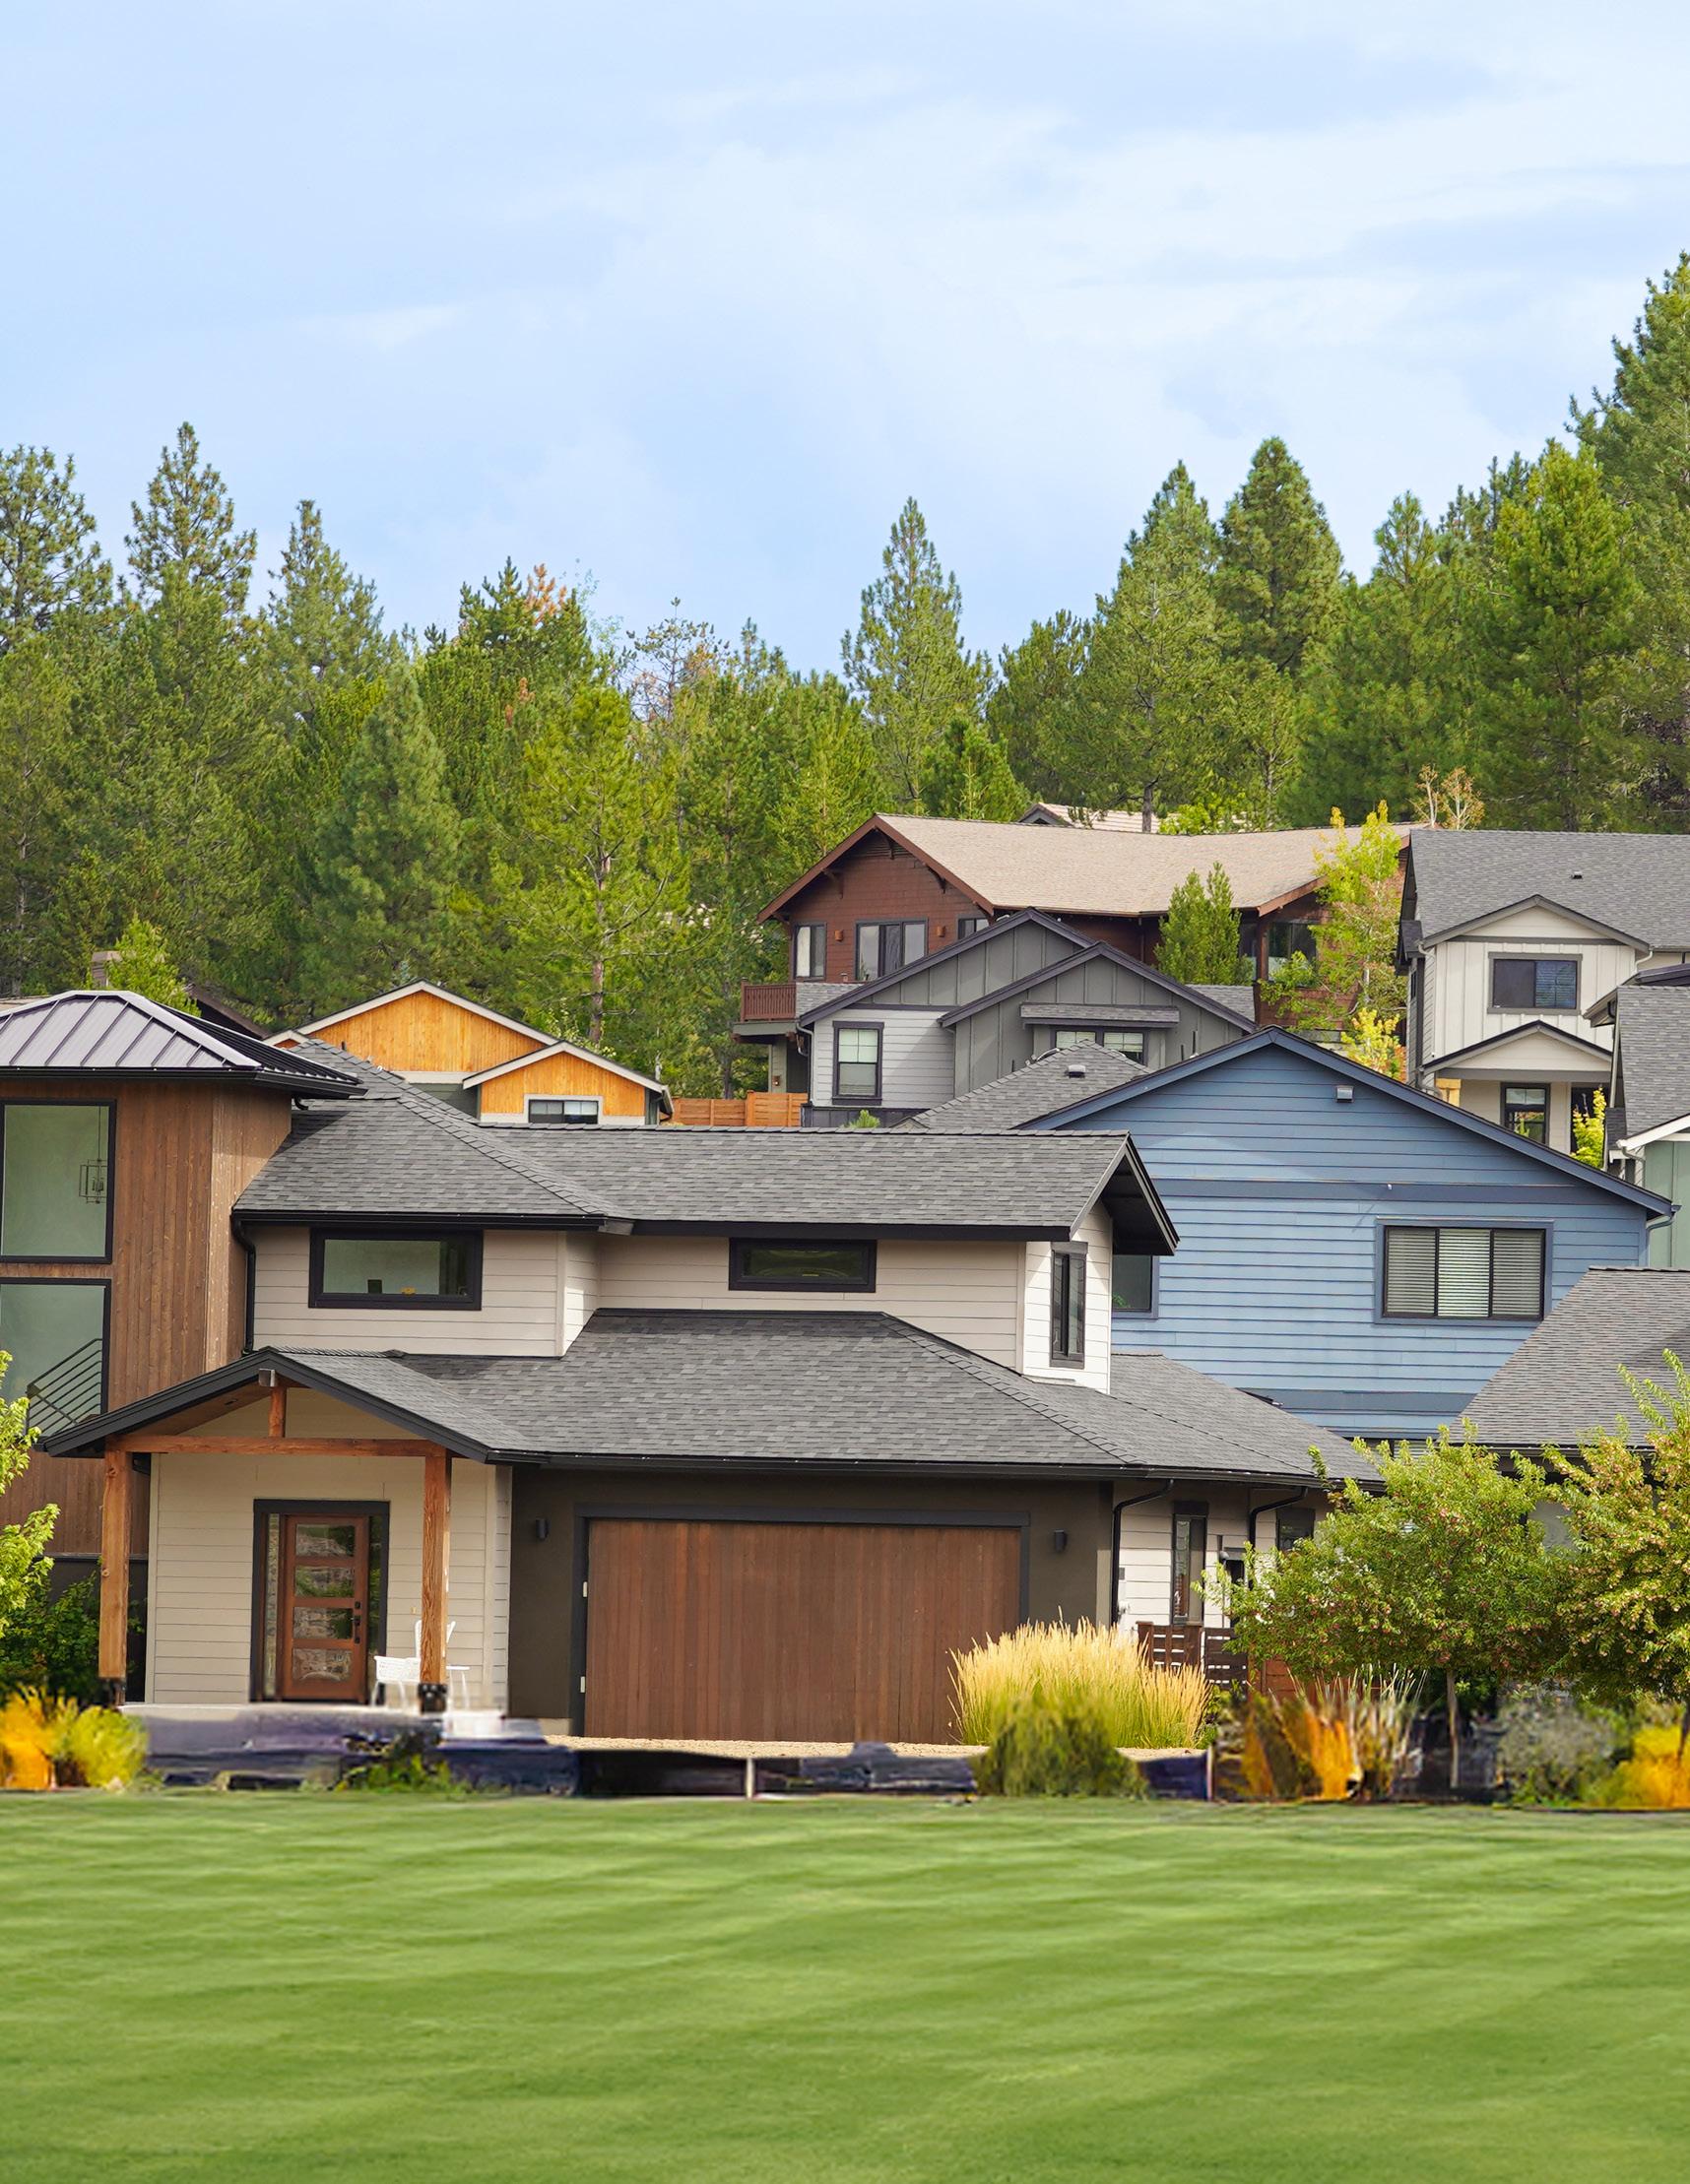
The Central Oregon market showed increased listing activity compared with Q1 2025 and continued buyer engagement across the region. While pricing and sales activity experienced modest year-over-year adjustments, the market remains stable, with growing inventory contributing to more balanced conditions and a stable foundation as the spring selling season unfolds.
AVERAGE SALES PRICE
Central Oregon’s average sales price dipped 3% year-over-year to end Q1 2026 at $773,484. Average price in Bend ($871,075) fell 7% while in Sunriver, the average price ($879,664) was up 10% from year-ago figures.
CLOSED TRANSACTIONS & PENDING SALES
Closed transactions were just 3% of the mark, falling from 854 in Q1 2025 to 832 this quarter. Closed units in Sunriver (35) decreased 22% yearover-year, and in Bend, closed units (520) were 4% higher than this time last year. Pending sales across the region increased 13% to end Q1 2026 at 1,032.
NEW & ACTIVE LISTINGS
New listings (1,521) increased 7% from year-ago figures and active listings throughout Central Oregon were also up, rising 4% from Q1 2025 to 2,768 this quarter.
DAYS ON MARKET
Average days on market (92) was 18% higher than Q1 last year. In Sunriver, market time (105) lengthened by 44%, but in Redmond/Terrebonne the average days on market (75) decreased 11% from year-ago figures.
CENTRAL OREGON
Eugene, Coastal, & Southern Oregon
(Lane, Tillamook, & Douglas)
• New Listings: Down 4% to 1,618
• Closed Sales: Down 6% to 1,081
• Days on Market: Up 7% to 73 days
• Average Sales Price: Flat at $456,039
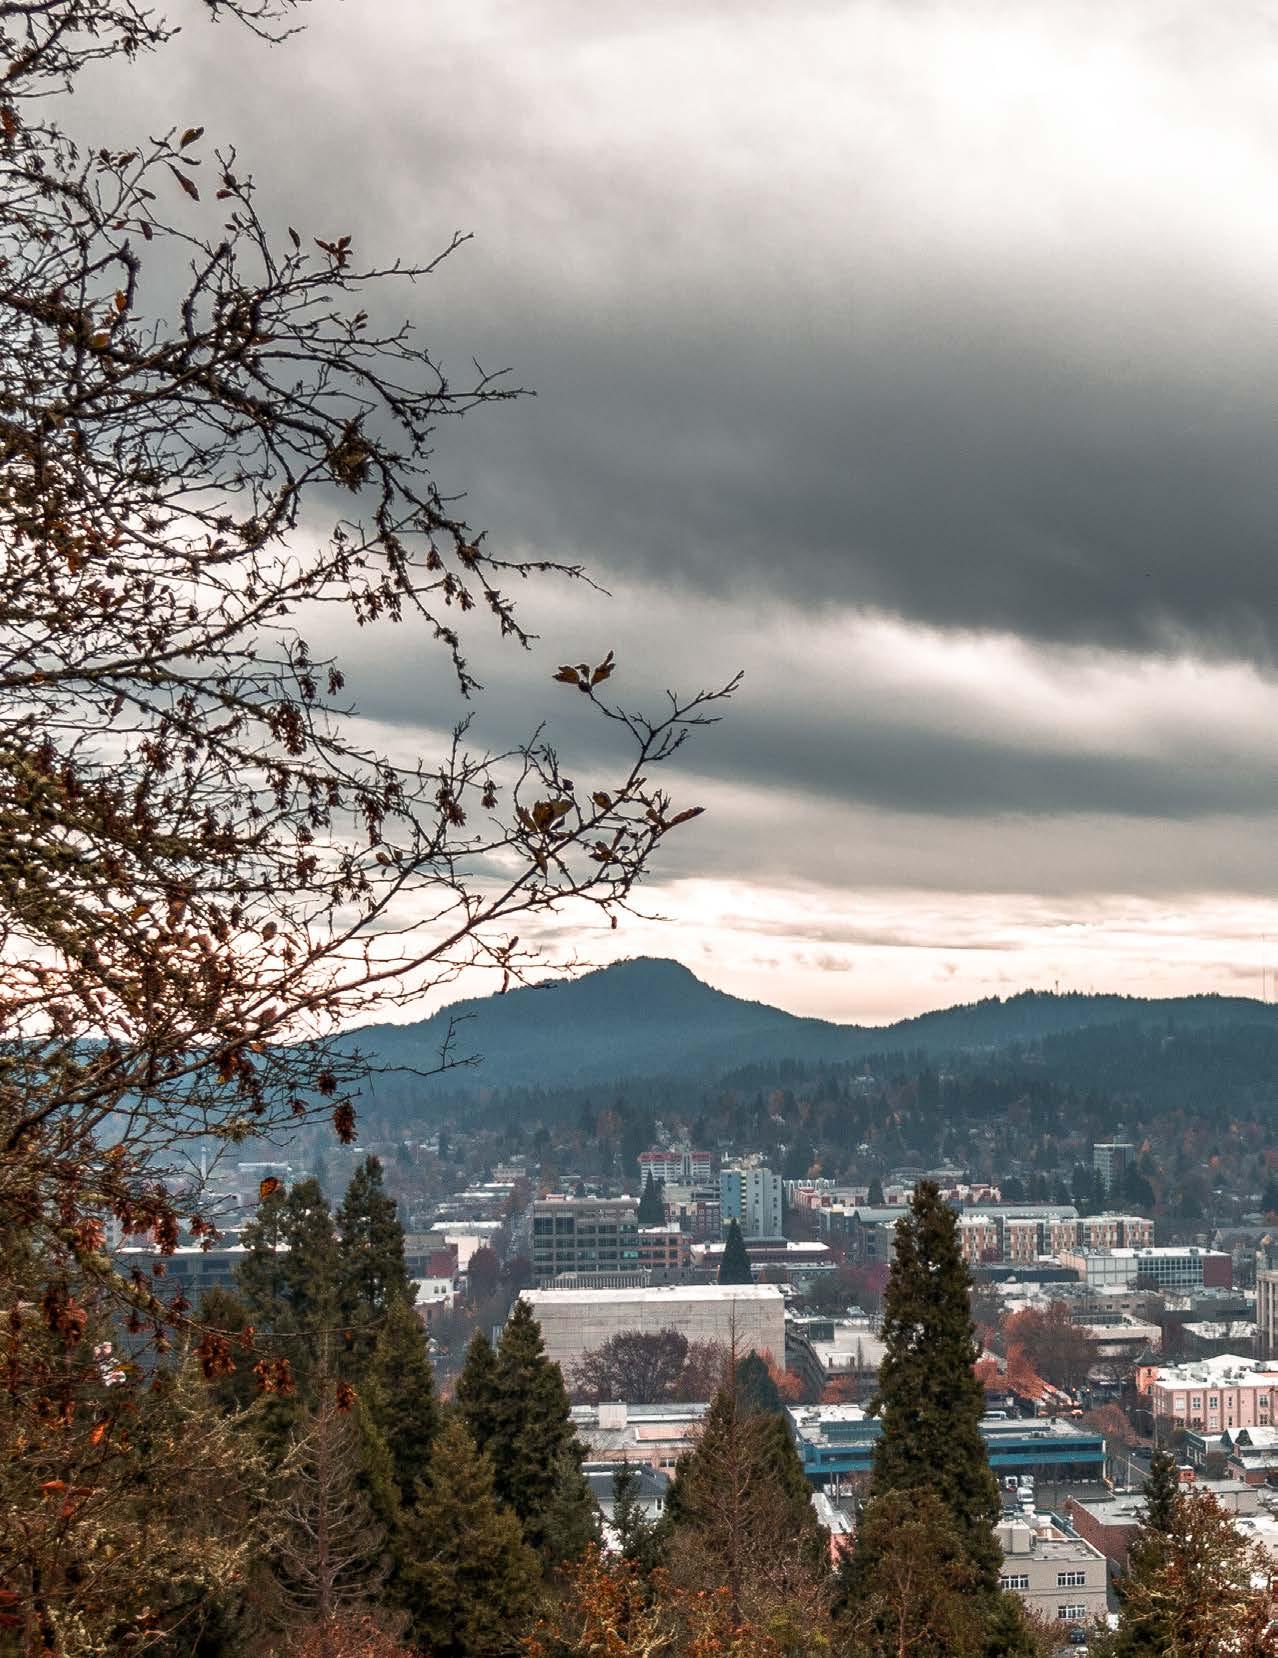
The Eugene, Coastal, and Southern Oregon markets entered 2026 with stable pricing compared to Q1 2025, and continued variations between inland and coastal communities. While sales activity declined modestly year-over-year and homes took slightly longer to sell, demand remained steady in core markets, supporting a balanced start to the year.
CLOSED UNITS
Regionally, closed units were down 6% to 1,081 this quarter compared with 1,148 during the first quarter of 2025. In Tillamook County, closed units (6) jumped 200%. On the coast, Netarts posted a 33% decrease, and Oceanside recorded a 33% increase, each with market closing 4 transactions, while Florence declined 20% to 70 units. Inland, closed units increased 3% in Roseburg to 132, while Eugene (411) dipped 7% from Q1 2025.
NEW LISTINGS, ACTIVE LISTINGS, & PENDING SALES
New listings decreased 4% from year-ago figures to end Q1 2026 at 1,618. Active listings (3,115) were 3% higher and pending sales (1,375) edged up year-over-year by 2%.
AVERAGE SALES PRICE
In Eugene, Coastal and Southern Oregon, average sales price ($438,103) was unchanged from year-ago figures. In the cities, average sales price fluctuated, rising 50.5% year-over-year in Netarts ($817,250) and falling 61% in Garibaldi ($153,500). Eugene remained flat at $499,308.
DAYS ON MARKET
Average days on market throughout the region increased 7% to end Q1 2026 at 73 days. At 32 days, Garibaldi posted the lowest days-on-market average, which was 69.5% lower than this time last year.
EUGENE, COASTAL, & SOUTHERN OREGON