
National Housing Outlook


Where Things Stand | A Mid-Year Read
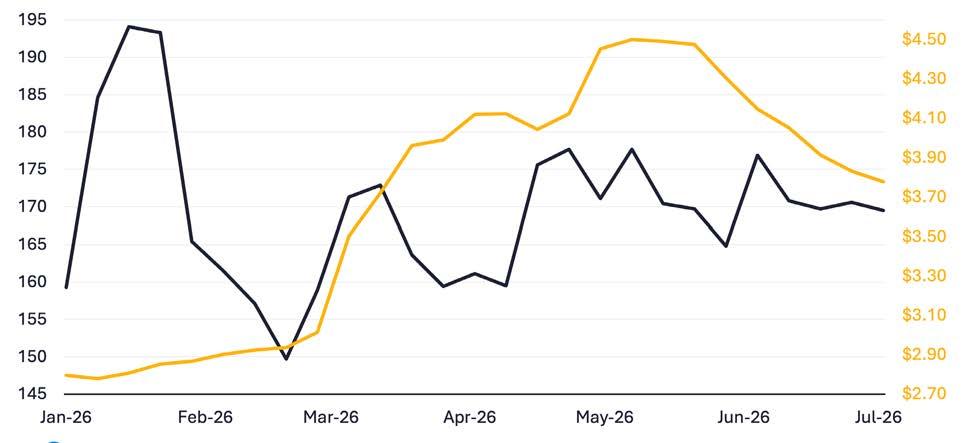
This year began with cause for optimism. By late February 2026, the 30-year fixed mortgage rate had fallen to 5.99%, the first time it had dipped below 6% in three and a half years. Inventory was climbing, providing buyers with more choice and breathing room. Consumer confidence showed signs of stabilizing. The spring real estate season appeared poised to be balanced and refreshingly active.
The recovery, which had been building for months, was interrupted in late February by global conflicts. Inflation, which had been gradually retreating toward the Federal Reserve’s 2% target, reversed sharply. April CPI came in at 3.8%, a 0.6 percentage point monthly increase.
As of June 2026, the 30-year fixed mortgage rate was meaningfully higher than the February low, but still lower than the 6.86% average recorded at the same time last year. The market absorbed a significant external shock and has remained functional. That is not a small thing.
Of note, affordability improved year-over-year in all
four geographic regions of the United States. The National Association of REALTORS Chief Economist Lawrence Yun described current circumstances as, “modestly boosted by the continued improvement in housing affordability.” Wage growth is still outpacing home price appreciation in many markets across the U.S., enhancing housing affordability for many consumers.
The fundamentals that underpinned our January HSOA Housing Outlook’s thesis of stability have not broken.
Despite renewed inflation pressures and global uncertainty, the housing market has remained resilient.
History, Mechanics and What Buyers Are Getting Wrong
Every generation has a reference point that distorts their perception of normal. For homebuyers today, that reference point is a 30-year fixed rate of approximately 3%, available briefly during 2020 and 2021 as the Federal Reserve took emergency action to prevent economic collapse during a global pandemic. Those rates were crisis pricing. They were never meant to last.
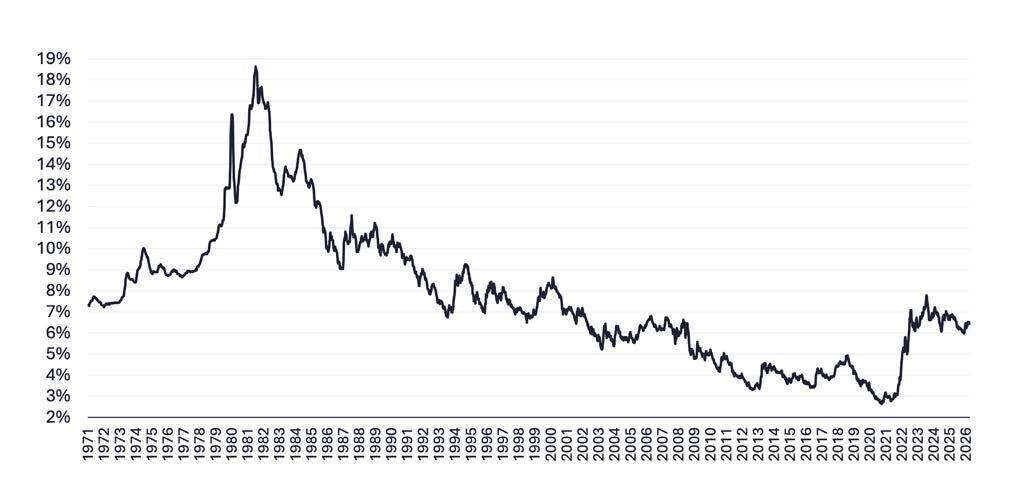
The long-run historical average for the 30-year fixed mortgage rate, dating back to 1971, is approximately 7.7%. Rates averaged above 10% throughout the 1980s. The period from 2011 to 2021, during which rates stayed predominantly between 3% and 5%, was historically unusual, the product of a decade of extraordinary monetary policy following the Great Recession. Today’s rates, at approximately 6.5%, are not high by historical standards. However, they are unfamiliar to housing consumers who hadn’t been involved in purchasing or selling prior to 2020 and are coupled with 38.9% home price appreciation over a 5 year period as well.
HOW RATES ACTUALLY MOVE AND WHY THE FED ALONE CAN’T FIX THEM
A common misconception among buyers is that the Federal Reserve sets mortgage rates. It does not. The Fed sets the federal funds rate, the overnight lending rate between banks, which most directly affects shortterm borrowing costs like credit cards and home equity lines of credit.
The 30-year fixed mortgage rate moves primarily with the 10-year U.S. Treasury yield, which in turn reflects investors’ expectations about long-term inflation.
30-year fixed mortgage rates have averaged 6.2% since 1990
When energy prices spike, as they have following the onset of the global conflict, investors anticipate higher inflation and demand higher yields on long-term bonds. Mortgage rates follow. This is precisely what happened beginning in late February 2026.
Most economists currently project the 30-year fixed rate will remain in the 6.0% - 6.5% range through the end of 2026, with modest easing possible in the second half if inflation data cooperates.
All major industry forecasts project mortgage rates to remain in the 6% range through 2028.
30-YEAR FIXED MORTGAGE RATE
Today’s Rates Are Historically Normal

FOR OVER 50 YEARS, THE 30-YEAR MORTGAGE RATE HAS MOVED IN UNISON WITH THE 10-YEAR TREASURY YIELD
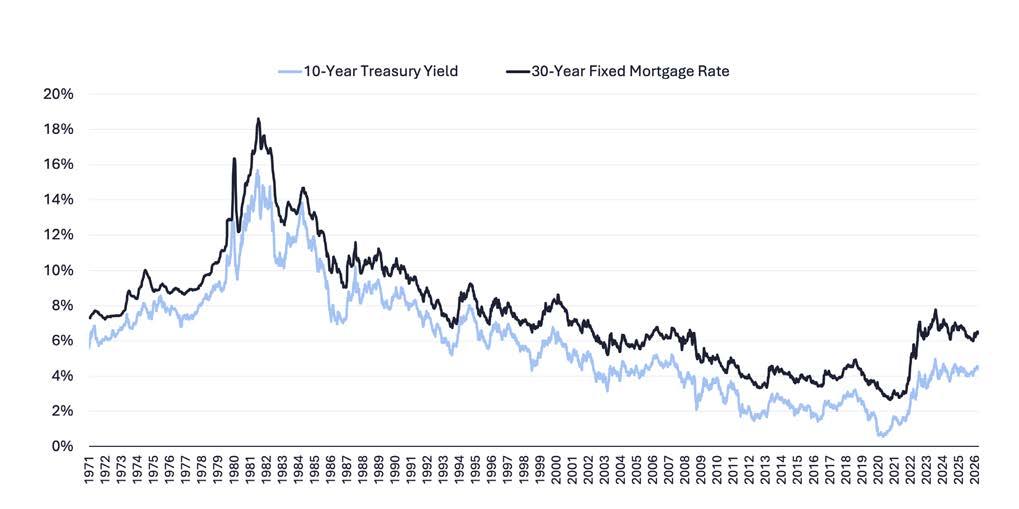
Sources: Freddie Mac, Macrotrends
Source: Freddie Mac
The Potential Cost of Waiting
For buyers who have been on the sidelines hoping for rates to drop significantly before acting, it’s helpful to run your numbers.
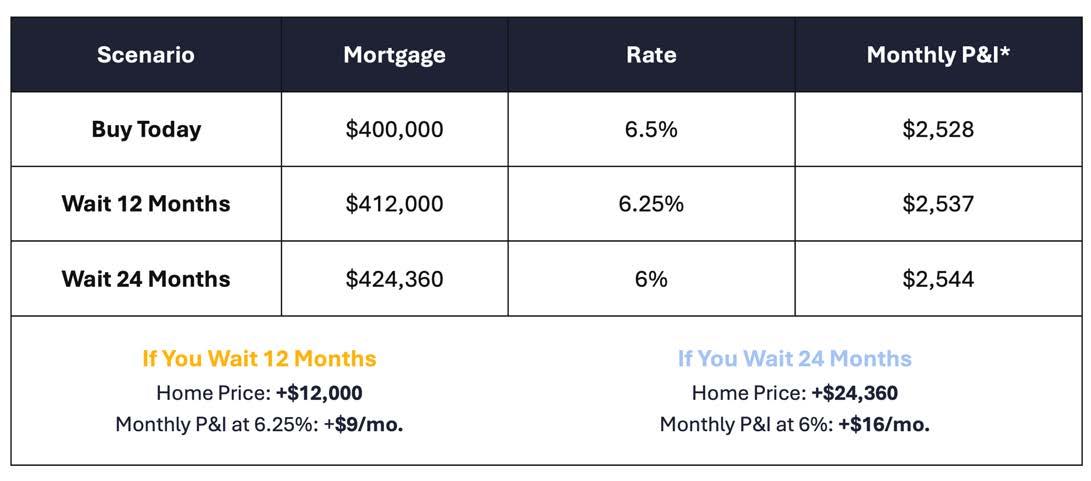
Consider the purchase of a $500,000 home with 20% down. At a rate of approximately 6.5%, the monthly principal and interest payment on the $400,000 mortgage is roughly $2,528. If rates were to fall to 5.5%, a highly unlikely scenario that would require a substantial and sustained improvement in inflation and Treasury market conditions, that same payment drops to approximately $2,271, a difference of about $257 per month.
That $257 per month is real. But so is this: if the home appreciates at even 1.7% annually over the next year, the Fannie Mae Home Price Expectations Survey’s
current consensus, its value increases by $10,000. The buyer who waited twelve months has saved roughly $3,084 in lower interest costs but has potentially paid $10,000 more for the same home. That calculation does not account for the twelve months of equity forgone over that period. Not only will this buyer pay $10,000 more by purchasing a year later, but they’ll also lose out on $10,000 in equity, which amounts to a potential $20,000 mistake.
There is also the refinance option. If rates do fall meaningfully, homeowners who purchased at today’s rates will eventually have the ability to refinance and capture some savings. Buyers who waited will not recover the equity they did not build, or the appreciation they did not capture.
If You Wait 12 Months
If You Wait 24 Months

Waiting for a lower rate to save $257 a month can end up costing $20,000 in missed appreciation and equity. Rate drops are recoverable through refinancing. Lost home value is not.
For Sellers, Pricing Shouldn’t
Be Based On a
Feeling
The best asking price isn’t based on what your neighbor received in 2022. It’s based on what today’s buyers are willing to pay.
WHAT HAS CHANGED?
The market has changed, and so has the way buyers make decisions. Today’s buyers aren’t comparing homes to what sold during the pandemic. They’re comparing them to what’s available right now. That means successful pricing starts with current market data, not memories of the market two or three years ago.
The extraordinary market conditions of 2021 and early 2022 were driven by historically low mortgage rates, intense buyer demand and limited inventory. Buyers competed aggressively, often waiving inspections and other contingencies just to secure a home.
Those conditions have largely disappeared. While some markets continue to have limited inventory, today’s buyers have more time, more choices and greater negotiating power. Sellers who price based on outdated expectations risk missing today’s market.

Price using current market conditions.
Focus on today’s comparable sales.
Work with an experienced real estate professional.
Understand that accuracy creates opportunity.
THE GAP BETWEEN EXPECTATION VS. REALITY
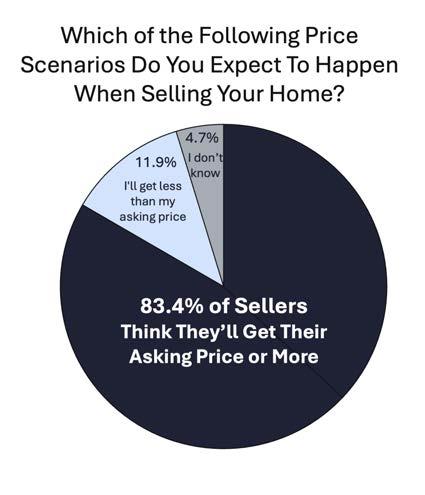
The data on seller expectations in 2026 is striking. According to Realtor.com survey data, 46% of sellers expect to receive their asking price and 37% expect to receive more than asking. That means 83% of sellers expect to receive full price or above.
The actual market tells a different story. In May 2026, according to ATTOM data and MLS records analyzed nationally, 20.2% of home sellers lowered their list price.
83% Expect to receive their asking price or higher.
More telling: across all February home sales, the average price reduction from original to final list price was 4%.
This is a tale of misaligned expectations meeting a market that has more options, more time and more patience than it had two or three years ago. The market is not punishing sellers, but it is requiring them to be accurate.
20% Of home sellers reduced their asking price in May 2026.
4%
Average reduction from original list price to final list price.
The First Two Weeks Are the Two Weeks That Truly Matter
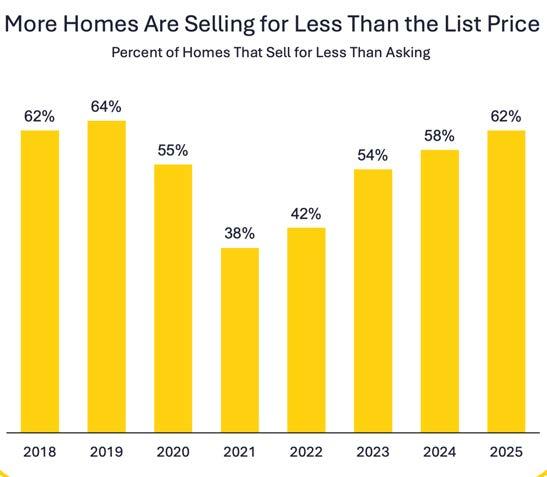
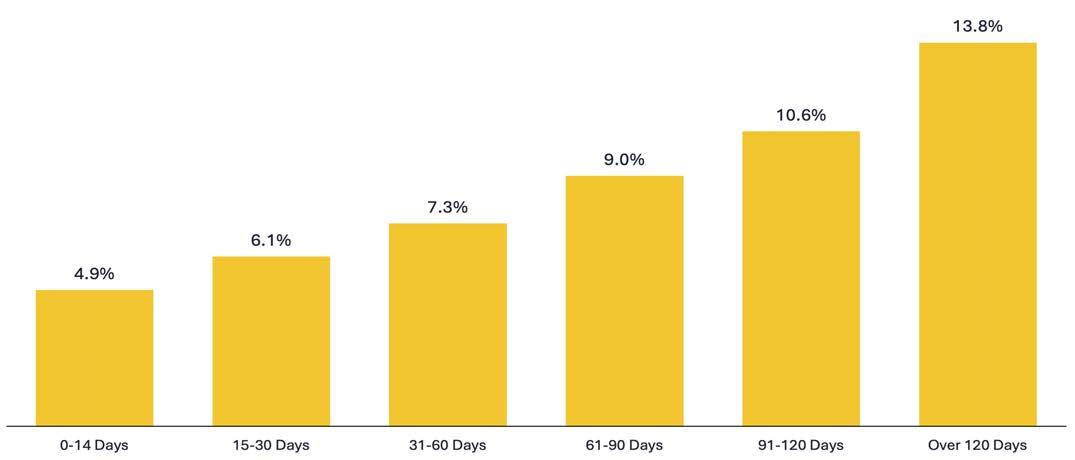
In a market with more inventory and buyers who have the time to be deliberate, the listing window has compressed. A home generates its highest attention, strongest buyer interest and greatest negotiating leverage in the first two to three weeks on the market. After that, a predictable psychology sets in: buyers begin to wonder what is wrong, competition softens, and any eventual price reduction feels like confirmation of their suspicions rather than an opportunity.
NAR Senior Economist Nadia Evangelou has noted that homes priced even 3% to 5% above market
value will face longer days on market and deeper eventual reductions than if they had been priced correctly from the start. Homes that are well priced are still selling. Homes that are not are sitting, then reducing, then selling for less than a correct list price would have generated.
Sellers should also understand that the first two weeks are when the most financially qualified buyers are engaged. As time passes, the pool shifts, sometimes toward buyers who sense weakness. Pricing correctly initially does not just mean selling faster. It often means selling to a more serious buyer.
PRICE CUTS GET BIGGER AS LISTINGS LINGER
Average Percent a Listing Price Is Reduced Based on Days on Market
Source: NAR

Moderation Is Not a Warning Sign
The question we are asked often, in some variation, is: “Are prices going to crash?”
The answer, supported by a substantial body of evidence, is no. But understanding why is more valuable than the answer itself.
WHAT THE DATA SHOWS RIGHT NOW
The U.S. median existing-home price reached $440,600 in June 2026, according to the National Association of Realtors - up 1.8% from a year earlier. This marks the 36th consecutive month of yearover-year price increases. Prices are not falling nationally. They are rising more slowly, and more slowly is the appropriate pace for a market returning to equilibrium after years of unsustainable appreciation.
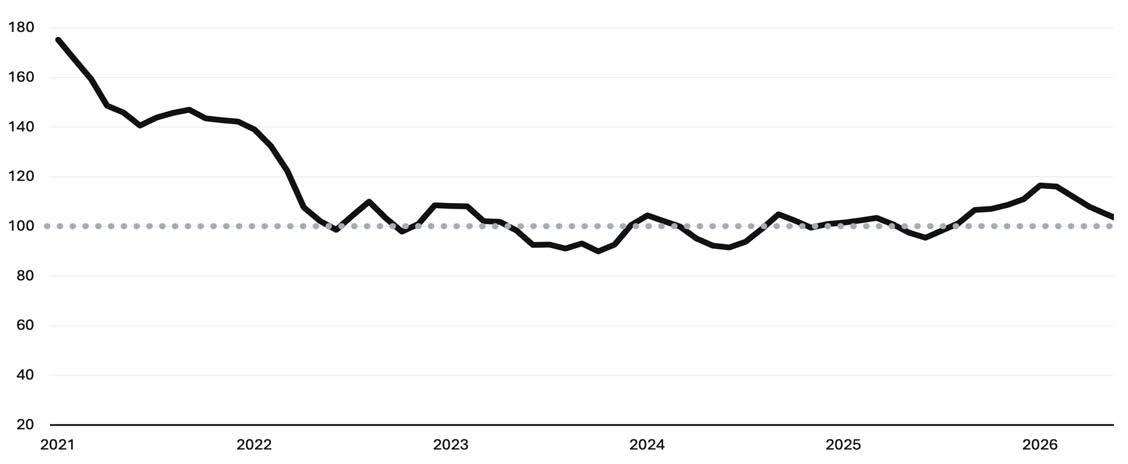
Additionally, affordability advanced year-over-year in all four U.S. geographic regions. Income growth is now outpacing home price appreciation, a dynamic that has not been true for several years and represents improvement in the underlying conditions for buyers who are ready and able to act.
HOUSING AFFORDABILITY, 2021 - PRESENT
To interpret the index, a value of 100 means that a family with the median income has exactly enough income to qualify for a mortgage on a median-priced home. The higher the index, the more affordable homes are.
WHAT THE NEXT 5 YEARS ARE EXPECTED TO LOOK LIKE
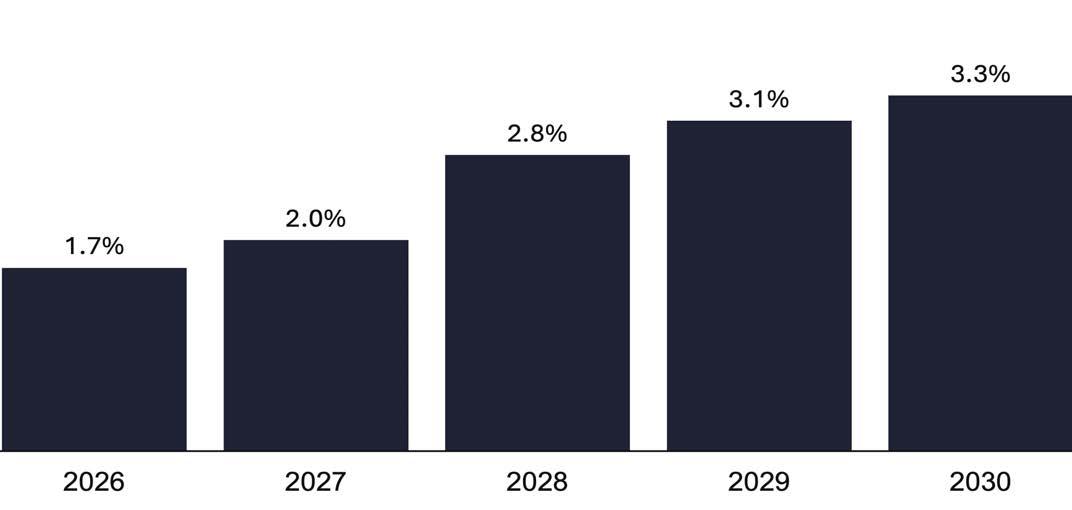
Home Price Appreciation Forecast, as of Q2 2026
Source: Fannie Mae
Once a quarter, Fannie Mae conducts the Home Price Expectations Survey in partnership with Pulsenomicspolling more than 100 economists, real estate experts and investment strategists on their five-year outlook for U.S. home prices. It is among the most rigorous forward-looking surveys in the industry.
The current consensus from that panel: home prices are expected to appreciate at a rate of approximately 1.7% in 2026, improving gradually toward 2.0% in 2027. The overwhelming majority of panelists do not anticipate a national price decline. The small minority who do project declines foresee modest, localized corrections in markets that overshot during the pandemic era, not the kind of systemic collapse that requires a structural breakdown in lending or employment.
THE CURRENT OUTLOOK IS CLEAR
Home prices are expected to appreciate approximately 1.7% in 2026.
Appreciation is projected to improve gradually to 2.0% in 2027.
Most experts do not anticipate a national price decline.
More Choices, Still Not Enough
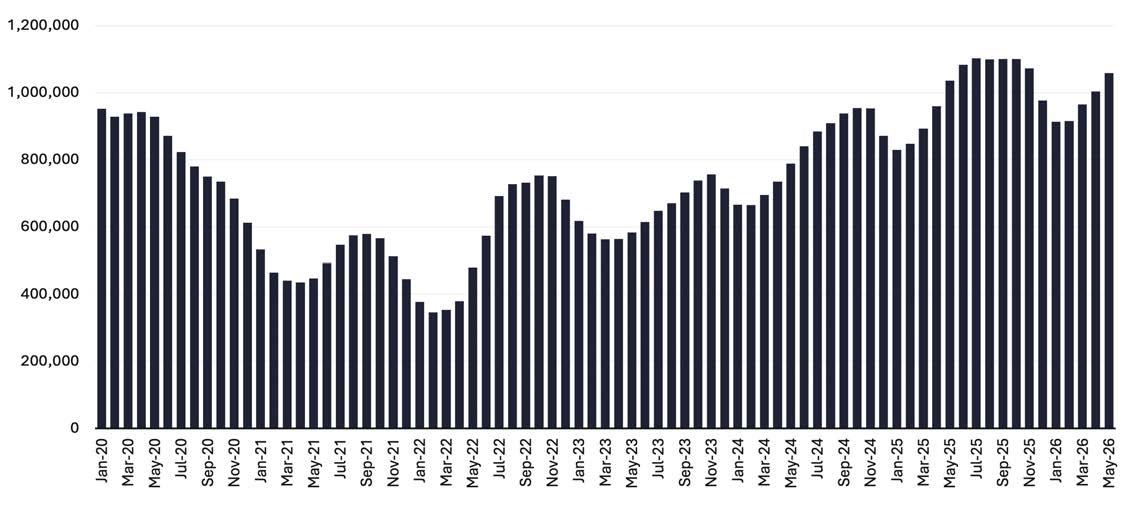
For the first time in years, many buyers have something that felt out of reach during the pandemic housing frenzy: options. The inventory picture in 2026 is genuinely improved.
More inventory has given buyers something they haven’t had in years: time.
Multiple offers, while less common than during the frenzy years, are still occurring in well-priced segments and in certain high-demand markets like the Bay Area. Days on market have extended in a significant number of local markets across the country, giving buyers more time to evaluate. That is a meaningful change from 2021 and 2022, when decisions made in hours had to last decades.
New construction is adding supply, but cautiously. April housing starts rose 4.6% YOY to an annualized rate of 1.465 million according to the U.S. Census Bureau and HUD. Builder confidence, however, remains below the threshold of optimism. Builders are providing incentives and rate buydowns to move inventory, particularly in the South.
ACTIVE LISTING COUNT
Northeast Seller-Favored
+3%–4% YoY
Midwest
Balanced to SellerLeaning
South Balanced / Shifting to Buyers
Mountain West Balanced / Buyer-Gaining
West + Pacific Balanced
+2%–3% YoY
+1%–2% YoY
Flat to +1% YoY
56%+ below pre-pandemic
Below pre-pandemic in major metros
Near or above prepandemic in many markets
Meaningfully above recent lows; Denver notably expanded
+0%–1% YoY; some Sun Belt markets declining
Above recent lows; tech markets strong for sellers
Buyers: come prepared. Sellers: leverage is real, but pricing still matters.
Most affordable region nationally. First-time buyer activity strong. Price with precision.
Buyers have negotiating room. Sellers face more competition from new construction.
Price to today's market, not 2021. Inbound migration still provides demand floor.
Affordability improved most in this region (NAR: +12.5% YoY). Selective opportunity for buyers but very competitive in Bay Area.
National statistics are useful for understanding broad trends, but far less useful for making individual housing decisions. A buyer’s experience in Connecticut can be dramatically different from one in Florida or California, despite all being reflected in the same national data. If there is one key takeaway from 2026’s housing market, it is this: the market has fragmented into distinct regional stories, and relying on national headlines instead of local conditions is one of the most common and costly mistakes buyers and sellers make.
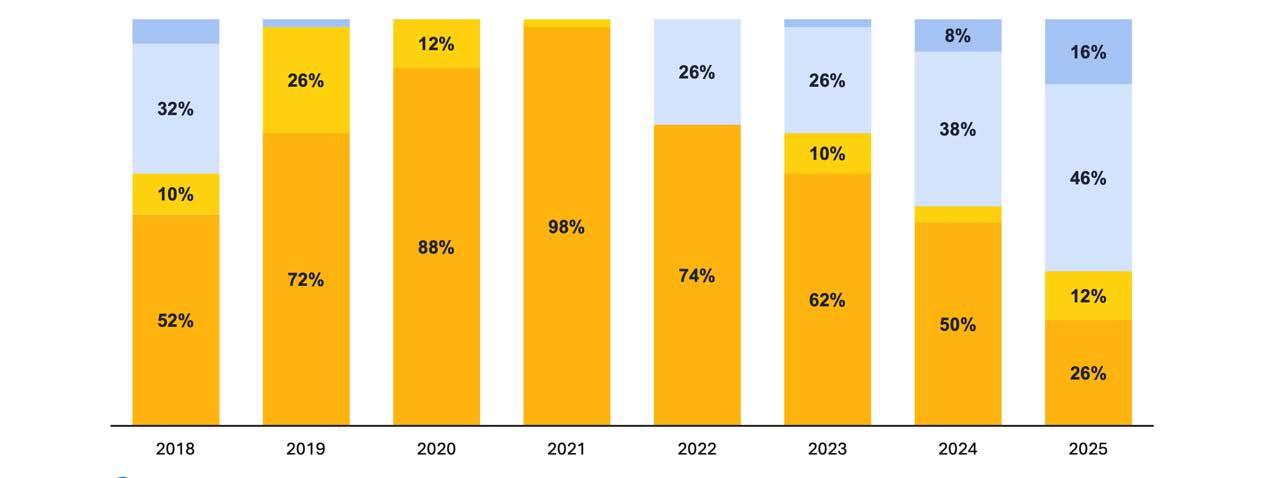
MANY METROS ARE BECOMING MORE BUYER FRIENDLY
A Few Regional Stories
Deserve Particular
Attention

THE NORTHEAST continues to be one of the most supply-constrained regions in the U.S. Hartford, Rochester, and Worcester lead Realtor.com’s ranking of the nation’s hottest housing markets - a geographic shift that would have seemed unlikely as recently as 2023, when the top-ten list was dominated by Sun Belt cities. The chronic undersupply in the Northeast is structural: limited land, high construction costs, and slow permitting mean inventory is unlikely to normalize quickly. Sellers in this region retain significant pricing power. Buyers should expect competition on well-priced homes and plan accordingly. An outlier is the Washington, DC metro area, which has slowed noticeably compared to surrounding markets in Maryland and Virginia. Sellers in DC are advised to price carefully.
THE MOUNTAIN WEST, including Colorado, has seen meaningful inventory expansion. Denver is among a small group of metros where active listings have increased more than 50% compared to pre-pandemic levels, according to Realtor.com data. That is a significant shift in buyer leverage and a challenge for sellers who are anchored to peak-era valuations. The underlying demand in some areas of the Mountain West, supported by continued inbound migration and a strong regional economy, remains intact. But sellers who price based on anything more than a few months of recent history are educating themselves at significant cost.
THE SUN BELT markets that led the pandemic boom are experiencing the most pronounced corrections, driven by a combination of slowing migration, an oversupply of new construction and rising insurance costs in coastal and wildfire-prone areas. These are market corrections in places where prices had exceeded what local income could sustainably support. For buyers in these markets, 2026 presents genuine opportunity. For sellers, patience and accurate pricing are essential.
In 2026, local market conditions matter more than national headlines.

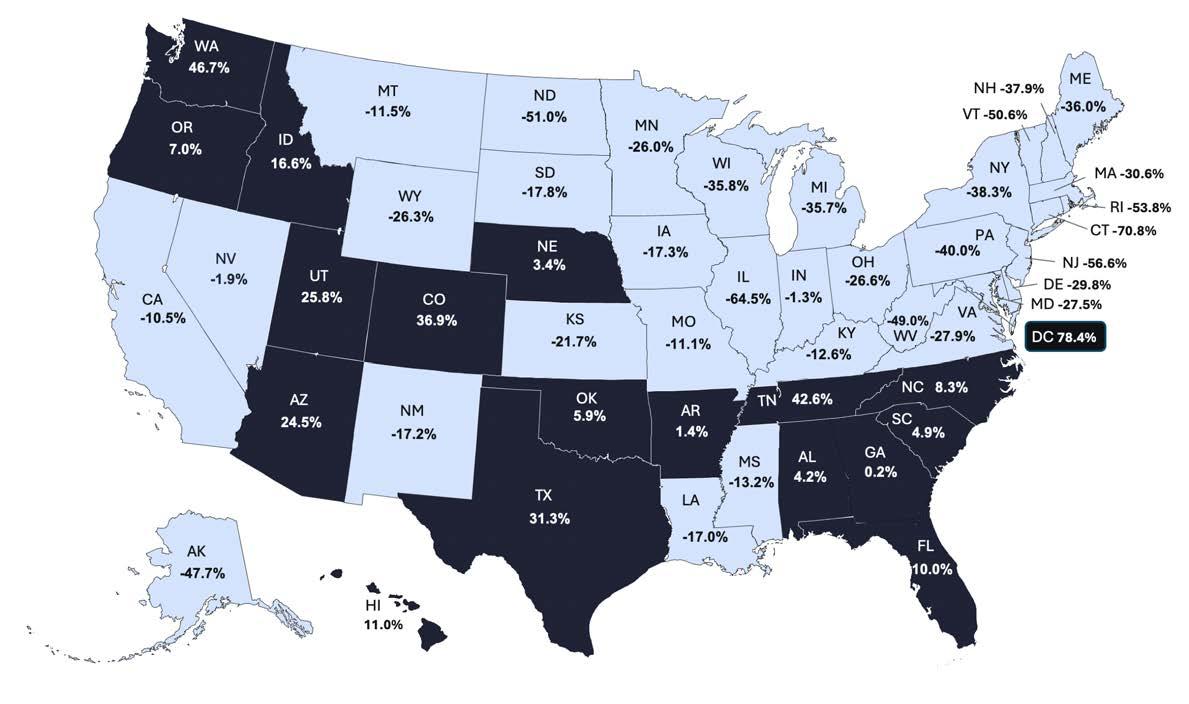
15 STATES AND D.C. ARE BACK ABOVE 2019 INVENTORY LEVELS
Inventory Shift Between June 2019 and June 2026
Source: Realtor.com
What the Headlines Are Getting Wrong
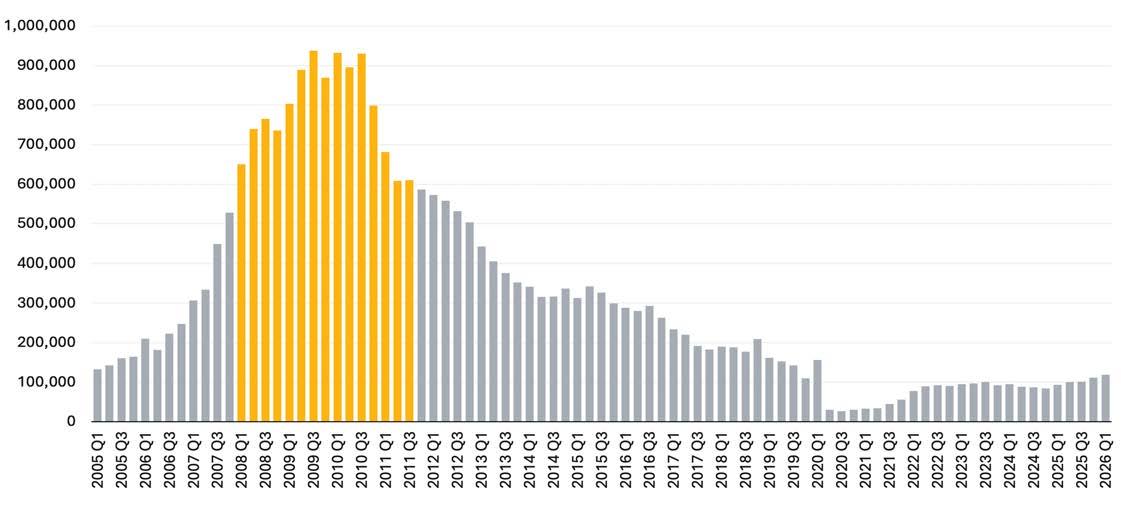
Recent news reporting tells us that foreclosure filings are rising. According to ATTOM, 42,430 properties had foreclosure filings in April 2026, 18% higher than a year ago. That trajectory, taken in isolation, produces alarming headlines. Taken in context, we learn a different story.
Current foreclosure filings represent approximately 0.26% of all housing units in the United States. At the peak of the 2008 housing crisis, that figure was 2.23%. For today’s foreclosure rate to match the crisis-era
peak, activity would need to increase roughly eight to nine times from current levels. There is no evidence to suggest that is occurring or is likely to occur.
The structural reason today’s rising foreclosure activity will not replicate 2008 is equity. During the last housing crisis, millions of homeowners owed more than their homes were worth - many homeowners had negative equity. Selling was not an option because the proceeds would not cover the mortgage balance.
FORECLOSURES REMAIN WELL BELOW CRASH LEVELS
Homes with Foreclosure Filings
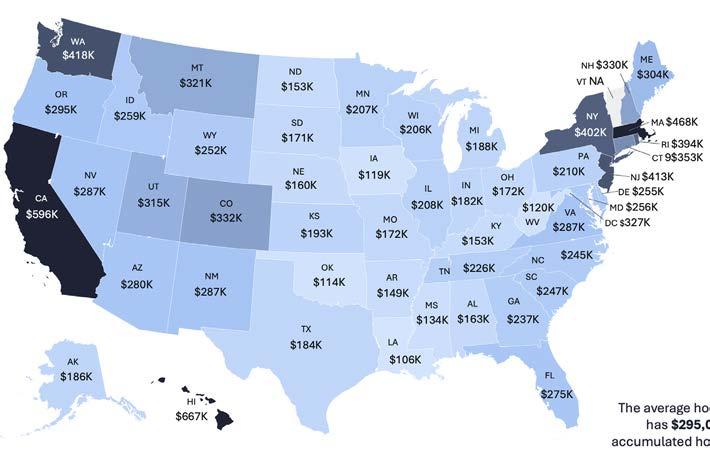
Today, according to Cotality’s most recent data, the average American homeowner carries approximately $295,000 in home equity. Homeowners who find themselves in financial distress have options that did not exist in 2008: they can sell, pay off their mortgage, protect their credit, and in many cases walk away with meaningful proceeds.
What is actually happening with foreclosure filings is less dramatic than the headlines suggest. During the pandemic, the federal government implemented foreclosure moratoriums and loan forbearance programs that paused the normal foreclosure process. As those programs have wound down and as the mortgage servicer industry works through backlogged cases, filings are returning toward historical norms.
The average homeowner has $295,000 in accumulated home equity.
AVG. EQUITY PER HOMEOWNER, Q4 2025
Source: Cotality
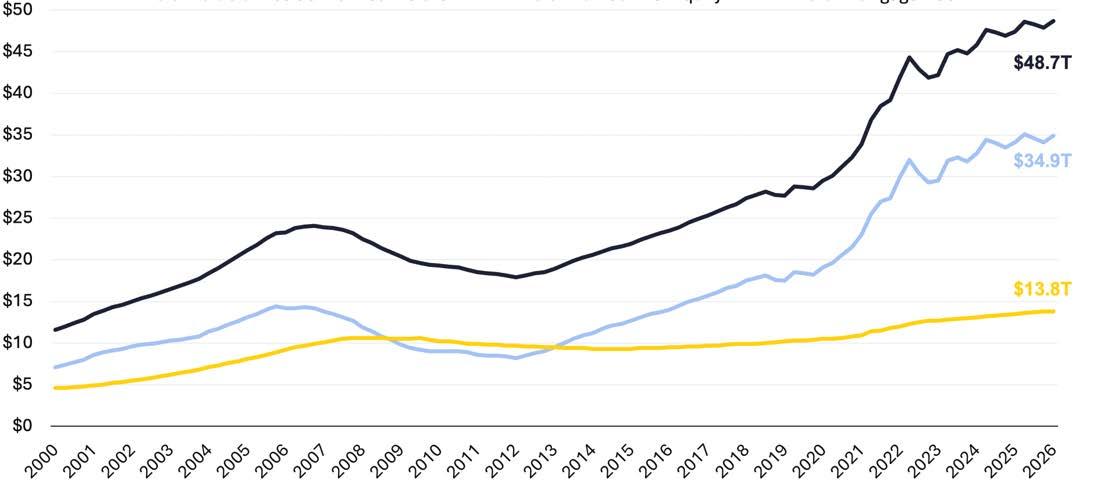
MORTGAGE DEBT IS HIGH, BUT EQUITY IS HIGHER (In Trillions)
Source: Cotality
Where Will Tomorrow’s Inventory Come From?
Every conversation about housing supply eventually arrives at the same question: when will there be enough homes? The answer usually focuses on builders - on permitting, housing starts, completions and the pace of new construction relative to household formation. Those factors are important. But they are not the
only source of supply about to reshape the American housing landscape. The least-discussed inventory story of the next decade is happening inside homes that already exist - those that have been occupied for 20, 30, or 40 years, by a generation soon to undergo a shift in housing needs.
THE DEMOGRAPHIC SHIFT BENEATH THE SURFACE
Seventy-three million Baby Boomers were born between 1946 and 1964. As a generation, they are the most property-owning cohort in American history - holding approximately 40% of all residential real estate in the United States, representing somewhere between $18 and $20 trillion in housing wealth, according to Federal Reserve data and academic research.
73M
Baby Boomers are living in the U.S
40%
Baby Boomer share of residential real estate
$20T
Baby Boomer estimated housing wealth
That wealth has been built over decades. Many Boomers purchased homes in neighborhoods that grew in value over time, paid down their mortgages, raised families and built equity by staying in place. Over the next 15 to 20 years, a historic volume of owner-occupied housing will transfer out of Boomer ownership through traditional sales, inheritances and estate transactions.
BOOMERS NOW HOLD OVER 40% OF THE NATION’S REAL ESTATE WEALTH
Real Estate Assets by Generation
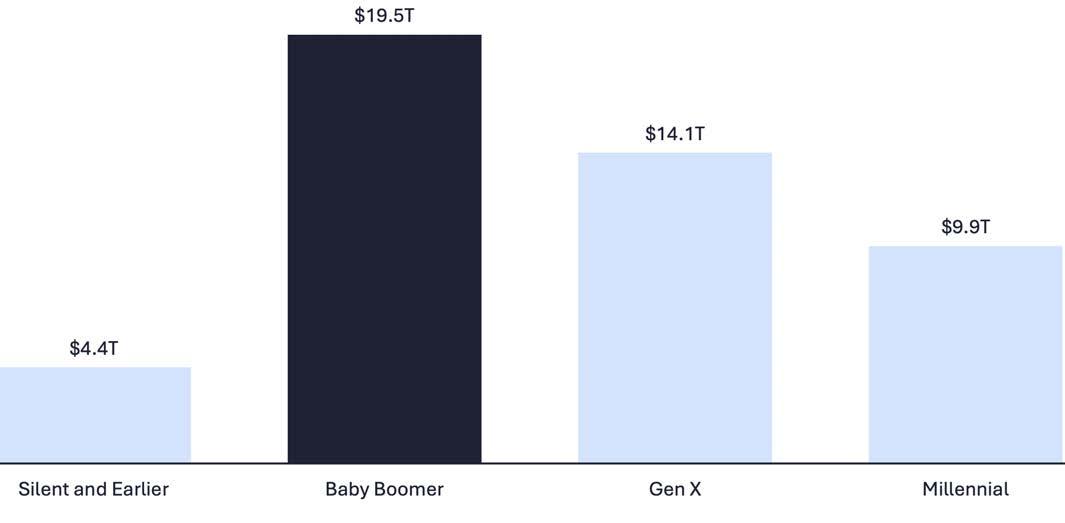
Sources: Federal Reserve, Realtor.com
WHAT THIS MEANS FOR THE MARKET - AND WHY IT IS NOT A SIMPLE STORY
The temptation is to frame this as straightforwardly good news for buyers: a coming wave of supply that will ease the structural deficit and improve affordability. The reality is more nuanced. First, the timeline is extended and uneven. This is not a single event, it is a gradual demographic process spanning the next two decades, with some markets experiencing it earlier and more dramatically than others. Communities with older populations and limited new construction will feel it first.
The next wave of inventory will be gradual, uneven and shaped by local conditions.
This is not simply a market story. Behind every one of these transfers is a family navigating loss, transition or the complicated emotions of letting go of a home that held a life.
The Home as a Financial Engine:
AN ASSET MOST PEOPLE UNDERMANAGE
There is an irony at the center of American personal finance. The asset that most households rely on most heavily to build long-term wealth, their home, is also the one they are least likely to think about strategically. Portfolios get reviewed quarterly. Tax returns get filed annually. The home, which for most American families represents 60% to 70% of their total net worth according to Federal Reserve survey data, often gets managed by instinct, sentiment or inertia.
WHAT THE DATA SHOWS RIGHT NOW
The Federal Reserve’s Survey of Household Economics and Decision Making, released in May 2026 using data collected through October 2025, highlights the critical role housing plays in American household finances. For many middle-income households, homeownership is the single most powerful wealth-building tool available and has historically been one of the strongest paths to long-term financial security.
National home prices have risen approximately 38.9% over the past five years, according to FHFA data. While appreciation has moderated from pandemic-era highs,
even a more typical annual growth rate of 2.5% to 3% can generate meaningful equity over time. According to Cotality, the typical homeowner now has approximately $295,000 in equity, and approximately 43 times the net worth of an average renter - an opportunity renters generally cannot replicate.
Households who are in a position to own should understand the financial benefits of homeownership and think strategically about managing that longterm asset.
THE TYPICAL HOMEOWNER HAS 43X THE WEALTH OF THE TYPICAL RENTER
Median Net Worth

Sources: Federal Reserve, NAR



THE RISE OF THE DELIBERATE HOMEOWNER
Several emerging trends suggest American homeowners are becoming more strategic about using their housing wealth.
Renovation spending has increased from 33% to 45% of all residential construction investment since 2007, according to National Association of Home Builders data. Rather than moving for more space or updated features, many homeowners are choosing to invest in the homes they already own - a shift driven by the rate lock-in effect, rising transaction costs and the growing recognition that well-planned renovations can generate meaningful returns.
Accessory dwelling units (ADUs) - also known as in-law suites, backyard cottages or garage apartments - have become a mainstream financial planning tool in many markets. As states and municipalities streamline permitting, more homeowners are viewing their property as a long-term financial asset, not just a place to live.
Multigenerational living has also made one of the most significant comebacks in American residential history. According to the U.S. Census Bureau, approximately 18% of Americans now live in multigenerational households - roughly double the share in 1971. Aging parents, affordability challenges and the desire to care for family members under one roof are all contributing to this growing trend.
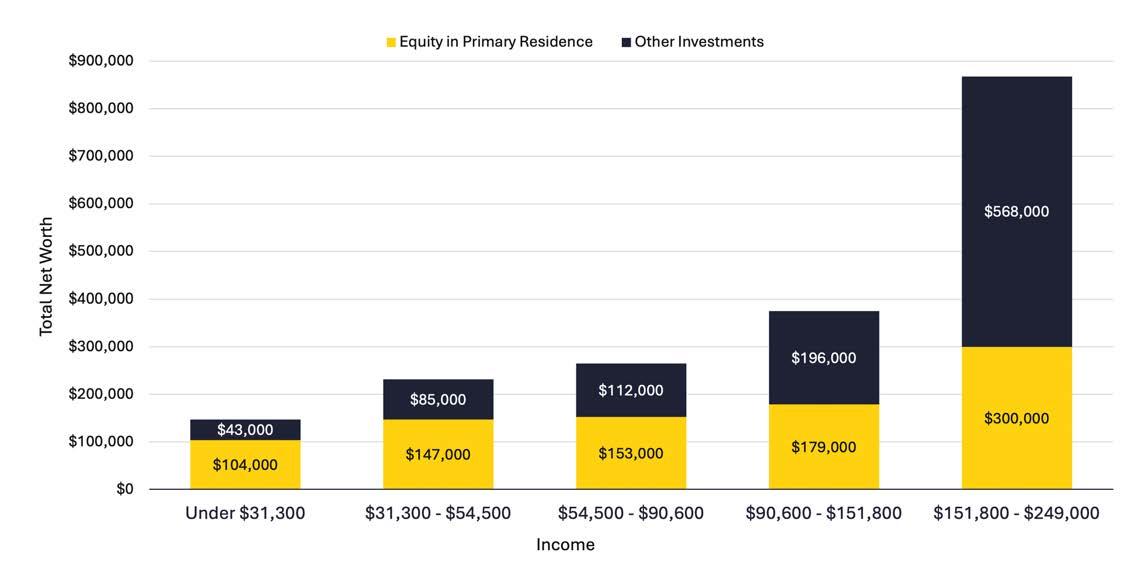
THE HOUSING PIECE OF NET WORTH IS CRUCIAL
The Market Rewards Informed Decisions
We have covered a significant amount of ground in this report: interest rates and their history, seller pricing and its consequences, inventory and its regional unevenness, the foreclosure story beneath the headlines, and the concept of housing as a financial instrument. If there is a single thread connecting all of it, it is this:
The housing market is the sum of the decisions made by the people participating in it.
The buyers who purchased in 2006 at the top of an inflated market had a difficult decade. But those who maintained ownership have recovered and, in most markets, prospered. The buyers who waited through 2012, 2013, and 2014 because prices still felt uncertain missed one of the longest appreciation runs in residential real estate history. The sellers who held out in 2024 for prices that the market had already moved past watched their
listings sit, then reduce, then close at numbers they could have had months earlier with a different conversation.
Every period of uncertainty produces its own arguments for inaction. And in every period, the people who acted thoughtfully, informed by data, guided by professionals who knew their market, and clear-eyed about their own circumstancesfared better than those who waited for certainty that never arrived.
The mid-year market of 2026 is genuinely complex.
None of this is unprecedented. Housing markets have always operated in the presence of uncertainty, because life does not pause for perfect conditions.



Special thanks to Keeping Current Matters for their collaboration on this report and providing all data, charts and graphs.
©2026 HomeServices of America. All rights reserved. No part of this document may be reproduced without permission.
©2026 BHH Affiliates, LLC. Real Estate Brokerage Services are offered through the network member franchisees of BHH Affiliates, LLC. Most franchisees are independently owned and operated. Berkshire Hathaway HomeServices and the Berkshire Hathaway HomeServices symbol are registered service marks of Columbia Insurance Company, a Berkshire Hathaway affiliate. Equal Housing Opportunity.

