Second Quarter Report May 27, 2026
Second Quarter Report May 27, 2026
• For 2025, NORTH CAROLINA real GDP is forecast to increase by 2.9 percent overthe2024level.
• Eleven of the state’s fifteen economic sectors are expected to experience output increases during 2025. The sectors with the strongest growth rates are agriculture with a real increase of 10.9 percent; information with a real increase of 8.1 percent; business and professional services with a real increase of 4.6 percent; wholesale trade with a real increase of 4.5 percent; educational and health services with a real increase of 3.9 percent; construction with a real increase of 3.7 percent; finance, insurance, and real estate (FIRE) with a real increaseof3.6percent;anddurablegoodswitharealincreaseof3.6percent.
• For 2025, NORTH CAROLINA establishments added 39,900 net jobs, an increaseof0.8percent.
• For 2026, NORTH CAROLINA real GDP is forecast to increase by 2.5 percent overthe2025level.
• Fourteen out of fifteen of the state’s economic sectors are expected to experience output increases during 2026. The sectors with the anticipated strongest growth rates are mining with a real increase of 5.1 percent; information with a real increase of 3.9 percent; durable goods manufacturing with a real increase of 3.3 percent; business and professional services with a real increase of 3.1 percent; wholesale trade with a real increase of 2.9 percent; nondurable goods manufacturing with a real increase of 2.8 percent; andconstructionwitharealincreaseof2.6percent.
• For 2026, NORTH CAROLINA establishments are forecast to add 65,100 net jobs,anincreaseof1.3 percent.
• By December of 2026, the state’s unemployment rate is expected to increase to4.1percent.
Gross Domestic Product (GDP) is expected to reach a level of $893,232.3 million in 2025. Real (inflation-adjusted) GDP is expected to increase by 2.9percentoverthe2024level.Thisgrowthin2025willrepresentthe fifth fullyearofgrowthsinceCOVID-19.
For 2025, first quarter GDP was flat with an annualized real rate of 0.3 percent. During the second quarter, GDP increased by an annualized real rate of 4.0 percent. In the third quarter, GDP increased by an annualized real rate of 5.7 percent. In the fourth quarter of 2025, GDP is expected to increasebyanannualizedrealrateof0.9percent.
U.S. first quarter GDP declined by 0.6 percent, which was a major influence on the flat North Carolina first quarter GDP performance. In addition, the continued drag caused by the slow recovery from Hurricane Helene is still having a negative impact on the North Carolina economy. Fourth quarter US GDP only increased by 0.5 percent as a result of the government shutdown which spilled over to North Carolina GDP growing by only 0.9 percent.
Recovery in western North Carolina is still ongoing and is likely to last well into 2026 and beyond. Unlike coastal areas, most businesses and households in the western part of the state do not have flood insurance. Normally,rebuildingafteranaturaldisasterstimulatestheeconomy,butin this case the lack of insurance has put a burden on small businesses and households and delayed the rebuilding stimulus on the economy. The hurricane’s impact on the state’s economy, which began in late 2024, continues to impact the state’s overall GDP through all of 2025 and into 2026.
Finally, 2025 has seen a period of uncertain Fed policy. After three reductions in the Federal funds rate in the fall of 2025, the Fed has been unclear on rate policy going forward. This uncertainty will likely have a significant impact in early 2026, and because of policy lags, will likely continue through the end of the year. Right now the Fed is facing conflicting goals as inflation has remained sticky and the employment pictureisbeginningtoweaken.
The chart to the left presents the projected contributions of each major economic sector to North Carolina’s Gross Domestic Product (GDP). The real (inflation-adjusted) growth rate for 2025 increased by 2.9 percent. Real growth rates for each sector (displayed in black type) are plotted on the horizontal axis. Percentages of GDP contributed by each sector (displayed in green type) are plotted on the vertical axis. The resulting rectangles show the weighted importance of each sector’s growth during 2025. All of the sector information presented in the table to the left is based on the North American Industry Classification System (NAICS)definitions.
Elevenofthestate’sfifteeneconomicsectorsareexpectedtoexperience output increases during 2025. The sectors with the strongest growth rates are agriculture with a real increase of 10.9 percent; information with a real increase of 8.1 percent; business and professional services with a real increase of 4.6 percent; wholesale trade with a real increase of 4.5 percent; educational and health services with a real increase of 3.9 percent; construction with a real increase of 3.7 percent; finance, insurance, and real estate (FIRE) with a real increase of 3.6 percent; and durablegoodswitharealincreaseof3.6percent.
Three other sectors are expected to experience growth but with rates below the overall rate of 2.9 percent. These sectors are government, with a growth rate of 1.1 percent; transportation, warehousing, and utilities (TWU) with a real increase of 0.5 percent; and retail trade with arealincreaseof0.4percent.
Foursectorsareexpectedtoexperienceadeclineinoutputduring 2025. These sectors are mining with a real decrease of 2.3 percent, nondurable goods manufacturing with a real decrease of 1.4 percent, hospitality and leisure with a real decrease of 1.3 percent, and other serviceswitharealdecreaseof0.3percent.
GrossDomesticProduct(GDP)shouldreachalevelof$947,667.2millionin 2026. Real (inflation-adjusted) GDP is expected to increase by 2.5 percent over the 2025 level. This growth in 2026 will represent the sixth full year ofgrowthsinceCOVID-19.
For 2026, first quarter GDP is expected to increase by an annualized real rate of 1.8 percent. During the second quarter, GDP is expected to increase by an annualized real rate of 2.2 percent. In the third quarter, GDP is expectedtoincreasebyanannualizedrealrateof2.7percent. Inthe fourth quarter of 2026, GDP is expected to increase by an annualized real rate of 3.0percent.
For 2026, there are some big questions. What will be the effect of the war in Iran? Will there be a recession, a slowdown, or a boom? The recession will be complicated by two issues. First, what will the Fed do? Will it continue to fight inflation and keep the fed funds rate above the neutral rate, or will it sense labor market weakness and continue to cut interest rates? Second, will we see an AI bubble? Finally, will runaway capital investment in AI technology lead to a stock market sell-off of tech stocks andslowconsumerspending?
A second option is for the economy to continue to grow but at a slower pace. The U.S. economy demonstrated resilience during 2025 despite a number of threats to economic growth. Tariff fears of an economic drag have not materialized, the government shutdown hasn’t caused significant disruptions,andinternationalissuesseemtohavehadlittleeffectsofar. A third option is an economic boom, brought about by efficiency benefits of AI and the resulting productivity gains. This could happen in 2026 but is morelikelytohappenin2027.
However,ifCongressdoesnotbegintocontrolfiscalspending,weare likely to see a return of inflation in 2026, which could disrupt the Fed’s plans. The wild card in all of this is Fed interest rate policy and the balance betweenareturnofinflation,aslowdown,arecession,oraboom.
The chart to the left presents the projected contributions of each major economic sector to North Carolina’s Gross Domestic Product (GDP). The real (inflation-adjusted) growth rate for 2026 is projected to increase 2.5 percent. Real growth rates for each sector (displayed in black type) are plotted on the horizontal axis. Percentages of GDP contributed by each sector (displayed in green type) are plotted on the vertical axis. The resulting rectangles show the weighted importance of each sector’s expected growth during 2026. All of the sector information presented in the table to the left is based on the North American Industry ClassificationSystem(NAICS)definitions.
Fourteen out of fifteen of the state’s economic sectors are expected to experience output increases during 2026. The sectors with the anticipatedstrongestgrowthratesareminingwitharealincreaseof5.1 percent, information with a real increase of 3.9 percent, durable goods manufacturing with a real increase of 3.3 percent, business and professionalserviceswitharealincreaseof3.1percent,wholesale trade with a real increase of 2.9 percent, nondurable goods manufacturing with a real increase of 2.8 percent, and construction with a real increase of2.6percent.
Seven other sectors are expected to experience growth rates, at levels at or below the overall 2.5 percent GDP real growth rate. These sectors are finance, insurance, and real estate (FIRE) with a real increase of 2.5 percent; educational and health services with a real increase of 2.4 percent; hospitality and leisure services with a real increase of 2.2 percent;retailtradewitharealincreaseof2.0percent; transportation, warehousing, and utilities (TWU) with a real increase of 2.1 percent; other services with a real increase of 1.9 percent; and governmentwitharealincreaseof1.1percent.
Onlyagriculturewillexperienceadeclineof0.6percentin2026.
Thesectoremploymentanalysispresentedonthispageisbasedon the North American Industrial Classification System (NAICS). North Carolina employment is expected to reach 5,068,200 persons in December 2025, a 0.8 percent increase over the December 2024 employment level. The state is expected to add 39,900 net jobs in 2025.
Nine of the state’s fourteen nonagricultural sectors of the economy are expected to experience employment increases during 2025. The sectors with the strongest employment increases in 2025 are construction at 3.5 percent, education and health services at 2.9 percent,andhospitalityandleisureservicesat2.9percent.
*Thousands of persons
Thesectoremploymentanalysispresentedonthispageisbasedon the North American Industrial Classification System (NAICS). North Carolina employment is expected to reach 5,133,400 persons by December 2026, a 1.3 percent increase over the December 2025 employment level. The state is expected to add 65,100 net jobs in 2026.
Twelve of the state’s fourteen nonagricultural sectors of the economy are expected to experience employment increases during 2026. The sectors with the strongest projected employment increases in 2026 are education and health services at 3.6 percent, information at 3.3 percent,andbusinessandprofessionalservicesat1.6percent.
*Thousands of persons
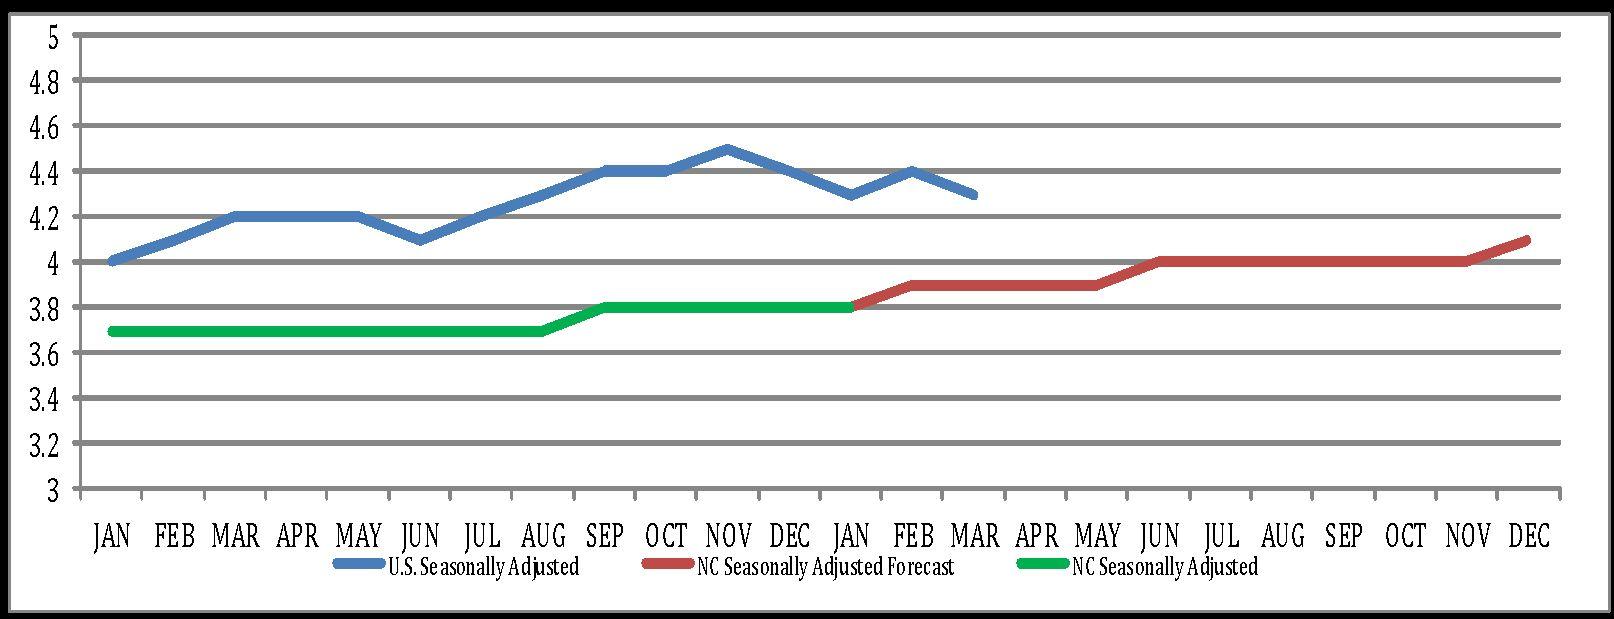
FORECAST reports historical seasonally adjusted monthly unemployment rates for North Carolina and the United States and forecasts the seasonally adjusted monthly unemployment rate for North Carolina. The seasonal adjustment accounts for variationsinlabormarketconditionsthatcauseregularfluctuationsintheunemploymentleveleachmonth.
The graph at the top of this page provides a summary of the monthly unemployment rates for 2025 and 2026. The solid blue line represents the United States seasonally adjusted historical unemployment rate. The seasonally adjusted unemployment rate for North Carolina is represented by the solid green line. The North Carolina seasonally adjusted unemployment rate forecast is represented by the solid red line. The seasonally adjusted rates for the United States and North Carolina can be compared directly andprovidemorereliableestimatesthantheunadjustedrates.
The United States and North Carolina started 2025 with unemployment rates of 4.0 percent and 3.7 percent, respectively. The U.S. unemploymentratehasbeenincreasingthroughthefirsthalfof2025reaching4.5percentbyNovember. TheNorthCarolinarate has remained below the U.S. rate during all of 2025 and stood at 3.8 percent in December. However, the North Carolina rate is likelytoincreaseduring2026to4.1percentbyDecemberof2026.
Second Quarter Report May 5, 2026