How liquefied biomethane is reshaping Baltic and Northern European shipping
The methane runway is open by Steve Esau, COO, SEA-LNG
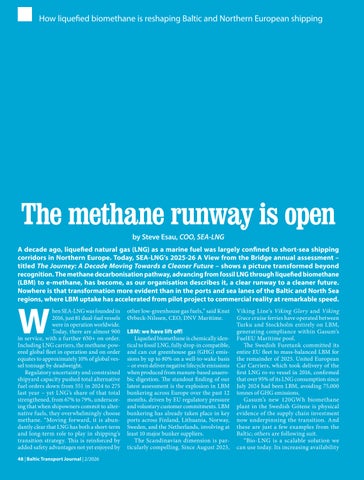
A decade ago, liquefied natural gas (LNG) as a marine fuel was largely confined to short-sea shipping corridors in Northern Europe. Today, SEA-LNG’s 2025-26 A View from the Bridge annual assessment – titled The Journey: A Decade Moving Towards a Cleaner Future – shows a picture transformed beyond recognition. The methane decarbonisation pathway, advancing from fossil LNG through liquefied biomethane (LBM) to e-methane, has become, as our organisation describes it, a clear runway to a cleaner future. Nowhere is that transformation more evident than in the ports and sea lanes of the Baltic and North Sea regions, where LBM uptake has accelerated from pilot project to commercial reality at remarkable speed.
W
hen SEA-LNG was founded in 2016, just 81 dual-fuel vessels were in operation worldwide. Today, there are almost 900 in service, with a further 650+ on order. Including LNG carriers, the methane-powered global fleet in operation and on order equates to approximately 10% of global vessel tonnage by deadweight. Regulatory uncertainty and constrained shipyard capacity pushed total alternative fuel orders down from 551 in 2024 to 275 last year – yet LNG’s share of that total strengthened, from 67% to 79%, underscoring that when shipowners commit to alternative fuels, they overwhelmingly choose methane. “Moving forward, it is abundantly clear that LNG has both a short-term and long-term role to play in shipping’s transition strategy. This is reinforced by added safety advantages not yet enjoyed by 48 | Baltic Transport Journal | 2/2026
other low-greenhouse gas fuels,” said Knut Ørbeck-Nilssen, CEO, DNV Maritime. LBM: we have lift off! Liquefied biomethane is chemically identical to fossil LNG, fully drop-in compatible, and can cut greenhouse gas (GHG) emissions by up to 80% on a well-to-wake basis – or even deliver negative lifecycle emissions when produced from manure-based anaerobic digestion. The standout finding of our latest assessment is the explosion in LBM bunkering across Europe over the past 12 months, driven by EU regulatory pressure and voluntary customer commitments. LBM bunkering has already taken place in key ports across Finland, Lithuania, Norway, Sweden, and the Netherlands, involving at least 10 major bunker suppliers. The Scandinavian dimension is particularly compelling. Since August 2025,
Viking Line’s Viking Glory and Viking Grace cruise ferries have operated between Turku and Stockholm entirely on LBM, generating compliance within Gasum’s FuelEU Maritime pool. The Swedish Furetank committed its entire EU fleet to mass-balanced LBM for the remainder of 2025. United European Car Carriers, which took delivery of the first LNG ro-ro vessel in 2016, confirmed that over 95% of its LNG consumption since July 2024 had been LBM, avoiding 75,000 tonnes of GHG emissions. Gasum’s new 120GWh biomethane plant in the Swedish Götene is physical evidence of the supply chain investment now underpinning the transition. And these are just a few examples from the Baltic; others are following suit. “Bio-LNG is a scalable solution we can use today. Its increasing availability
DEVELOPMENT OF LNG-FUELLED FLEET INCLUDING LNG CARRIERS MARITIME Fig. 1. Development of the LNG-fuelled fleet (incl. LNG carriers) in 2016-29
VESSEL NUMBERS
2,500 2,500 2,000 2,000 1,500 1,500 1,000 1,000
2029 2029
2028 2028
2027 2027
LNG fuelled vessels on order LNG on order LNG fuelled carriersvessels on order LNG carriers on order
2026 2026
2025 2025
2024 2024
2023 2023
2022 2022
LNG fuelled vessels in operation LNG in operation LNG fuelled carriersvessels in operation LNG carriers in operation
2021 2021
2020 2020
2019 2019
2018 2018
2017 2017
0 0
2016 2016
500 500
Source: SEA-LNG/DNV AF
and commercial viability give our customers confidence that their dual-fuel LNG f leets are ready to further reduce emissions,” shared Dexter Belmar, Vice President of Shell Downstream LNG.
Why methane leads: the infrastructure advantage LNG bunkering is available in 222 ports worldwide, supported by 62 bunker vessels in operation and 38 on order – up from a single
2016 bunker barge inSource Sweden. Over $150 bilSEA-LNG DNV AFI lion has been invested in LNG dual-fuel vessels and supply chains over the past decade. The contrast with rival fuels is stark: current global LNG production stands at
BIOMETHANE BUNKERING MAP
KEY PORTS PORTS WITH REGULAR BIOMETHANE BUNKERING OPERATIONS PORTS WITH AD HOC BIOMETHANE BUNKERING OPERATIONS DECEMBER 2025
Source: SEA-LNG Analysis
2/2026 | Baltic Transport Journal | 49
MARITIME WORLDWIDE GROWTH IN LNG USE AND INFRASTRUCTURE WORLDWIDE GROWTH IN LNG USE AND INFRASTRUCTURE
BULK
68
x7 Unallocated
16
CRUISE
31 27 CAR CARRIER RORO & ROPAX
44
124
9
98
KEY PORTS LNG BUNKERING AVAILABLE LNG BUNKERING UNDER DEVELOPMENT
62 38
CONTAINER
LNG BUNKERING VESSELS
TANKER
OPERATIONAL ON ORDER
229
LNG-FUELLED VESSELS
IN OPERATION
ON ORDER
GREY & GREEN FUEL MARKET SIZES DECEMBER 2025
178 89
395
Source DNV
Fig. 2. Grey and green fuel market sizes: current production and trade volumes
CURRENT GREEN FUEL PRODUCTION (Mtpa LNGe)
SIZE OF CURRENT FUEL MARKETS (Mtpa LNGe)
36.20
35
450 406.0
30
406.0
400
25
350
20
300
15
250
10
GLOBAL MARINE FUEL DEMAND
200
5
150
0 LNG
100
63.5
50
42.9
CURRENT GREEN FUEL PRODUCTION (Mtpa LNGe)
15.0
0
36.20
35
5.1
30 25 20 15 10 5 0 LNG
LNG
Methanol
Ammonia
Production LNGe Mtpa International Trade LNGe Mtpa Sources: Ammonia Energy Association, GIIGNL, IEA, Methanol Institute & S&P Global
50 | Baltic Transport Journal | 2/2026
0.27
0.21
Green Methanol
Green Ammonia
0.27
0.21
Green Methanol
Green Ammonia
MARITIME Fig. 3. The methane decarbonisation pathway Today
2050
Fossil
Bio/Blue
Synthetic
LNG
Biomethane
e-methane
Bio-methanol
e-methanol
Blue Ammonia
e-ammonia
Up to 23% WtW
Methanol 14% WtW
FUELS
2050
Ammonia 47% WtW
Hydrogen 64% WtW
Natural gas
Common destination Zero-emissions Same starting point 75% of fuel costs associated with cost of producing H2
Blue Hydrogen
e-hydrogen
Biomass
Renewable electricity
NH3 CH4 CH3OH $
H2
FEEDSTOCK
406 million tonnes per annum, already 100 times marine fuel LNG consumption, with infrastructure at virtually every major port. The infrastructure supporting the global ammonia and methanol trade is approximately 30 and 80 times smaller. Fossil ammonia and methanol are themselves mainly produced from methane today, meaning they carry higher well-to-wake emissions than fossil LNG – despite the green credentials often attributed to them. To achieve emissions parity with LNG, operators choosing these fuels must blend in large and costly volumes of green variants. On any standard investment metric, the methane pathway offers a materially shorter payback period than any rival alternative fuel. The pathway forward: bio- to e-methane The methane framework is incremental: fossil LNG today, LBM as the nearterm step, and e-methane – produced from renewable electricity and green hydrogen – as the zero-emission destination. All three stages use identical engines, bunkering infrastructure, and operational procedures. Current global biomethane production of approximately 36 million tonnes per annum already represents 15% of shipping’s total energy demand, and the International Energy Agency estimates just 5.0% of the total global
production potential is currently exploited. For the Baltic region, with its developed agricultural sector and growing biogas industry, the feedstock opportunity is significant. On e-methane, three large-scale projects totalling approximately 150,000 tonnes per annum are in FEED, targeting start-up between 2028 and 2030 in the US and Finland – the latter’s involvement ref lecting the Baltic’s continued leadership on the methane pathway. Methane slip and fugitive emissions: an improving picture High-pressure diesel cycle two-stroke engines, accounting for 75% of the LNG vessel order book, have already effectively eliminated methane slip. For low-pressure technologies, slip has fallen by roughly 60% over the past decade, and SEA-LNG maintains that it will be resolved across all engine types by 2030. A recent Baltic trial on Wasaline’s Aurora Botnia ferry (under the EU-funded Green Ray project) cut methane slip by up to 56% in Wärtsilä’s low-pressure four-stroke engine. A 2025 Rystad Energy study commissioned by SEA-LNG found the global average wellto-tank fugitive emissions intensity for LNG bunkering fuel is 13.9 grams of CO₂e per megajoule – materially below the EU FuelEU Maritime default of 18.5g CO₂e/MJ.
Recognise and reward: a call for (global) regulatory clarity The Internat iona l Ma rit ime Organization’s October 2025 decision to delay its Net-Zero Framework was frustrating as it risks regulatory fragmentation. SEA-LNG is calling for a single, global, goalbased, and technology-neutral decarbonisation framework that protects early adopters, incentivises practical and investable solutions, and permits compliance pooling – a mechanism already delivering results through the FuelEU Maritime pools operating across the Baltic Sea region. For operators here who led LNG adoption and are now at the frontier of LBM commercialisation, the rules of tomorrow must recognise and reward what has already been built. Transition on the way The methane decarbonisation pathway is no longer a proposition or a projection – it is a functioning commercial reality, with infrastructure in place, long-term supply agreements signed, and vessels in Northern European waters already running on near-zero emissions fuel today. For the shipping community up there in the North, the transition is not approaching. It has already begun, and the industry is leading it alongside bunker providers and regional market regulations.
Founded in 2016, with numerous high-profile members including shipping companies, ports, LNG suppliers, bunkering companies, infrastructure providers, original equipment manufacturers, classification societies, banks, and brokers, SEA-LNG is a multi-sector industry coalition whose members work together to demonstrate the benefits of LNG and its variations as a marine fuel throughout the entire value chain. Head to sea-lng.org for more info. 2/2026 | Baltic Transport Journal | 51