Emissions that could be cut tomorrow – but won’t
by Przemysław Myszka
“The best fuel is the one not used,” is a phrase heard often enough during discussions about shipping’s decarbonisation. It is perhaps up to investments in energy efficiency to push the needle. After all, the vote on the International Maritime Organization’s (IMO) Net-Zero Framework ended in a debacle last year – with the main instigator doubtlessly more concerned with abducting or assassinating its political rivals abroad than doing something remotely green(ish), not to mention other items on the Big Beautiful Agenda. Truly low-/ zero-carbon marine fuels propelling the sector’s transition? A trickle at best. The World Bank Group did all the math in its latest report on the topic: in short, the numbers (for the most part) add up – you save on bunker by shelling out on energy-efficiency measures (EEM). Notwithstanding, almost the entire global shipping industry is merrily sailing on fossil fuels, with but a few shipowners that do it more efficiently. How come?
The paper on which the IMO greenhouse gas emission (GHG-E) reduction goals are written fortunately avoided scorching in the autumn of 2025: the ambition of hitting that net-zero by/around the middle of this century, with interim (minimumstrive) checkpoints of 20-30% by 2030 and 70-80% a decade later. The Keys… analysis states that technical and operational EEMs offer a maximum potential of reducing absolute GHG-E by 23-39% by the end of this decade vs the baseline 2008-levels. Read: no need to scramble in supply-and-demand panic and pay the premium for alternative fuels (granted you own a vessel that can run on them in the first place) to arrive at that first IMO station with flying colours. What is more, the biggest EEM potential, 5.0-15% of GHG-E reduction, lies in good-old slow steaming. Read: no need to dry-dock your precious tonnage for mounting a rotor or getting a propeller re-work.
World Bank.

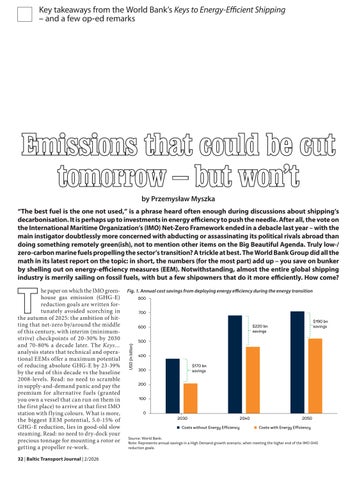
Fig. 1. Annual cost savings from deploying energy efficiency during the energy transition
Next, “about half of emissions savings from energy efficiency measures are considered cost-effective in 2030, cutting 250 million tonnes of emissions at no cost.”
Let’s money do the talking: EEMs can reduce the cost of the maritime energy transition by $170 billion/year in 2030, some $220b/y in 2040, and $190b/y in 2050. “To save up to $270 billion in green ammonia fuel costs per year, an additional annualized investment of about $35 billion in energy efficiency across the fleet is required.” Well, that’s indeed spare change of capital investment expense –should shipping, of course, want to make those paper dreams of IMO a reality. Just for comparison, the IEA World Energy Investment 2025 report states that about $1.1 trillion of total global energy investment goes to oil, natural gas, and coal combined, with the first two representing the overwhelming majority of that fossil fuel segment ($700-900b injected into the up-, mid-, and downstream value chain).
Maybe the current Oval Office tenant should reconsider reviving the country’s shipbuilding industry and instead inject that (still virtual) tribute money into Big Beautiful Factories of Big Beautiful Sails (getting on board them some NSA equipment incidentally)? Then again, you don’t see the Chinese pouring endless buckets of yuan into EEMs (let alone wind-assisted propulsion systems). The EU is, too, somewhat ascetic towards throwing funds at European shipping (even if it is the sector’s own monies collected via the block’s Emissions Trading System).
Meh-regulations
The World Bank mentions the Energy Efficiency Design Index (EEDI) and that “it has a strong enforcement mechanism as a vessel is not allowed to sail without a valid International Energy Efficiency Certificate.” But how a ship is designed and how it’s operated are two different things. Besides, when reporting on newbuilds ordered by some more environmentally inclined owners from the Baltic Sea region, the announcements either do not mention EEDI at all or state that the vessel will surpass the requirements by the magnitude of several lengths. Read: EEDI won’t save shipping’s green transition. Neither will its cousin, the Energy Efficiency Existing Ship Index (EEXI). Here, compliance is ticked off by shaft or engine power limitation. “This reduction of available onboard power is unlikely to lead to a short-term reduction of CO₂ emissions, since most vessels routinely operate at
200520102015202020252030203520402045
Historic emissions
BAU, high demand growth
Moderate Efficiency-High Demand Scenario
Moderate Efficiency-Low Demand Scenario
Source: World Bank.
BAU, low demand growth
Maximum Efficiency-High Demand Scenario
Maximum Efficiency-Low Demand Scenario
Historic intensity
BAU, high demand growth
Moderate Efficiency-High Demand Scenario
Moderate Efficiency-Low Demand Scenario
Source: World Bank.
BAU, low demand growth
Maximum Efficiency-High Demand Scenario
Maximum Efficiency-Low Demand Scenario
Fig. 4. Modelled uptake speed of measures among eligible ships
Mature energy efficiency measure
Source: World Bank.
speeds and engine loads between 38% and 50% of their maximum continuous rating, well below the maximum allowed under the
Innovative energy efficiency measure
EEXI.” If anything, the World Bank further highlights, “[…] in the future, the EEXI may limit the ability of vessels to speed up under
Fig. 3. Modelled emissions intensity development to 2050
Fig. 2. Modelled absolute emissions development to 2050
SUSTAINABILITY
Fig. 5. The maximum efficiency-high demand emissions reduction pathway – relative to 2008
Historical data Projection
2005201020152020202520302035204020452050
Business-as-usual (High Demand)
Business-as-usual (High Demand)
Minimum IMO GHG reduction goals
Minimum IMO GHG reduction goals
Source: World Bank.
Source: World Bank.
Maximum Energy Efficiency-High Demand Scenario
Maximum Energy Efficiency-High Demand Scenario
Striving IMO GHG reduction goals
Striving IMO GHG reduction goals
Fig. 6. Absolute GHG emissions for the three fleet segments to 2050
200520102015202020252030203520402045 2050
Tanker (BAU)
Container (BAU) Bulker (BAU)
Tanker (Maximum Efficiency)
Container (Maximum Efficiency) Bulker (Maximum Efficiency)
Source: World Bank. GHG emissions for three fleet segments (bulker, container, tanker) under BAU-High Demand and the Maximum Efficiency-High Demand scenario to 2050.
Fig. 7. Emissions intensity for the three fleet segments to 2050
Tanker (BAU)
Tanker (Maximum Efficiency)
Container (Maximum Efficiency) Bulker (Maximum Efficiency) Container (BAU) Bulker (BAU)
Source: World Bank. GHG intensity is shown for the three fleet segments (bulker, container, tanker) under BAU-High Demand and the Maximum Efficiency-High Demand scenario to 2050.
favorable commercial conditions or to catch up on schedules due to port delays.” Read: neither EEXI will carry the day.
Then there’s the Carbon Intensity Indicator (CII) that, in turn, looks at how vessels are operated. As things stand
today, CII as a GHG-E-reduction tool underperforms twofold. First, its reduction factor for 2027-30 stands at roughly 2.6%, with 6.0-7.0% needed to nail that 30% ‘strive’ target of IMO, according to Keys… Second, CII lacks enforcement. Getting a really poor score over several years will earn the shipowner a slap on the hand and the need to come up with a corrective action plan to get a minimum CII rating. But a swarm of barely performing students, instead of a masterclass of A(ce)s, isn’t exactly what shipping needs to decarbonise. IMO does not publish annual global rating distributions in order to follow the score changes (read: CII’s efficacy; so much for transparency for an agenda that’s largely financed from public funds…). The actual supply of vessels in the best A-B range might be limited for the market to orient itself towards this energy-efficient tonnage – which was a key pitch point behind CII to begin with. And if you have goods to ship, well, C, D, or E must do (never mind the environment).
Even though the EU, with its FuelEU Maritime (FEUM) Regulation, wields an enforcement stick, it’s a piece of legislation with a limited geographical reach; thus, the World Bank’s report does not stoop over it a single time. Given the geopolitical climate these days – and the European shipping sector itself keeping a wary eye on the Regulation (with a few bioLNGcompliance-generator exceptions) – it’s a foregone conclusion that the IMO won’t agree to copy and paste FEUM on a worldwide scale. The shipping-needs-globalover-local-regulation mantra will most likely sound even more clichéd and contentless in the years to come.
Last, the shadow fleet that’s bankrolling the Russian war of aggression against Ukraine operates at zero-care capacity, its concerns over EEDI, EEXI, CII, having an IMO number, valid insurance (or any cover at all), etc., being perpetually on holiday. Those ghost tankers aren’t exactly in the prime of life – and doughnuts to roubles they aren’t sporting any EEMs…
Setting the scene
In the model employed by the World Bank, baseline (full life cycle/well-towake) GHG-E are extended to 2050 using two business-as-usual pathways, with low and high transport demand scenarios from the Fourth IMO GHG Study and EEM uptake driven by EEDI-EEXI. For dry bulk and container carriers, a significant growth in transport demand is projected, reaching up to 200% by mid-century. “The
relative to 2008
* Includes miscellaneous ship types such as pleasure yachts for which no improvements are modeled. Negative values mean GHG emissions increase.
Source: World Bank.
* Only includes ships which transport freight goods.
Source: World Bank.
Source: World Bank. Results are presented for the Maximum Efficiency-High Demand scenario. Solar panels were included in the modelling but were omitted from the visual for presentation purposes due to their small contribution to emissions abatement.
tanker sector experiences a decrease in demand for oil transport, but an increase in gas and chemicals transport,” the Keys… report claims, pointing out that this will probably increase emissions as the latter category’s tankers are smaller, hence the fleet’s emission/tonne performance will worsen. Also, while there will be a cap on the size of container ships, the
largest size bins are expected to grow (so more blank sailings if there’s not enough merch to stuff the deep-sea trades, eh?).
Next, the model assumes no changes to the future fuel mix, with heavy fuel oil, marine gas oil, and liquefied natural gas dominating the bunker landscape, similar to today. “This is a simplifying assumption to understand the
SUSTAINABILITY
impact of energy efficiency measures on GHG emissions, GHG intensity, and energy efficiency.” That said, the World Bank also ran calculations for a scenario assuming a future uptake of green fuels – using e-ammonia as a proxy for a zeroemission bunker – to check EEMs’ impact on lowering the energy transition bill for the shipping industry.
In total, the analysis covers 30 technical and operational EEMs (distinguishing between market-ready technical and innovative technical measures) further divided into over 15 groups. Interestingly, “onshore power supply is […] not explicitly considered, although reduced auxiliary power demand is included among other technology groups.” Whereas innovations – such as wind-assisted ship propulsion, air lubrication, photovoltaic panels, and super-light shipbuilding materials – will enjoy an uptake of 5.0% among eligible vessels in 2030 only, other measures will reach 90% (both rise to 100% two decades later; read: the lowhanging fruit of slow steaming will contribute most in the next few years).
Alike transport demand, the analysis is split into moderate and maximum efficiency scenarios; the difference being here the application in speed reduction (10% vs 30%). There is a clear tension between transport demand and GHG-E reduction gains provided by EEMs. More goods to transport require more ships, which translates into higher absolute emissions – even despite the reduction in ship GHG-E intensity due to better vessel design coupled with the higher uptake of EEMs by existing ships and newbuilds. All Keys… scenarios foresee an increase in transport demand, putting pressure on EEMs to outpace the subsequent increase in total GHG-E. Though all abatement scenarios exceed the 20% target set by the IMO for 2030 (also thanks to a relatively small increase in transport demand in 2030 vs the baseline 2022 as opposed to 2022 vs 2040-50), with the maximum efficiency scenario even ‘overshooting’ the 30% target in both low and high demand scenarios, “[…] even in a scenario with maximum uptake of energy efficiency measures, there is a clear need for green fuels before 2040.”
Total vs particular
Technical EEMs involve modifications to the ship’s design or equipment to decrease engine power need, “for example, reducing the frictional resistance of the ship in the water or by using
Tab. 1. Modelled absolute emissions reduction potential –
Tab. 2. Modelled GHG intensity reduction potential – relative to 2008
Fig. 8. Cost-effectiveness and abatement potential of individual measures for the total fleet in 2030 under fossil fuel prices
9. Cost-effectiveness and abatement potential of individual measures for tanker fleet in 2030 under fossil fuel prices
Source: World Bank. Results are presented for the Maximum Efficiency-High Demand scenario. Solar panels were included in the modelling but were omitted from the visual for presentation purposes due to their small contribution to emissions abatement.
Fig. 10. Cost-effectiveness and abatement potential of individual measures for container fleet in 2030 under fossil fuel prices
while sailing in the Middle East…), so tasking them with ensuring this-or-that EEM runs optimally might just add to their stress levels, which probably isn’t the best working environment for taking care of the environment.
Whether technical or operational, “Information about the savings potential is fragmented. While some studies only report the minimum and maximum savings, others provide only the average savings.” Regardless of data imperfection (or should we say: data secrecy?), the World Bank says that from a total fleet perspective, the largest potential for emissions reduction comes from deceleration, “[…] particularly in the maximum efficiencyhigh demand scenario.” Another operational EEM, hull maintenance, comes in second. The hyped wind-assisted propulsion systems “[…] can reduce absolute emissions from global shipping by up to 3.0% […].” Assuming full uptake, that is.
Marketing brochures/academic papers can tell the truth, e.g., that a ship constructed with the use of super-light materials will glide over the waves. Yet, actually constructing a featherweight bulker or container ship would cost a king’s ransom, flying the vessel’s freight rates sky high (which is a story already told by nuclearpowered freighters many a decade ago). As such, the Keys… report puts EEMs against the marginal abatement cost (MAC), showing the tonnes of GHG-E abated compared to whether it saves or costs money (and if somebody else isn’t recompensing for your green efforts, then, well, it’s hard imagining a business ‘investing’ in something that puts it in the red). What you want is a negative MAC, when an EEM’s CAPEX-OPEX spending is lower than the bunker invoice.
wind-assisted propulsion to reduce the power demand from the engines, thereby enhancing the overall efficiency of the machinery system.” As such, these EEMs are capital-intensive. Operational EEMs are, in turn, more on the OPEX side of things. “Better use of data and training can, for example, help to operate a vessel at optimum engine loads, reducing fuel consumption. […] However, studies highlight the need for quality and continuous
training to enhance crew capabilities for energy-efficient operations.”
In other words, if you’re buying an EEM gizmo, be it hardware or a piece of code, make sure your people know how to use it. On a side note, the World Bank does not further dwell into the human element as it relates to EEMs; data from other areas of shipping, such as safety, paint a picture of modern seafarers overloaded with work and data (not to mention being fired at
At the total fleet level – with container ships, dry bulk carriers, and tankers accounting for almost 80% of the global shipping GHG-E – nine out of the 15 analysed EEM groups are MAC-negative. “This translates to approximately half of the total GHG emissions savings from energy efficiency measures, resulting in a reduction of 250 million tonnes of emissions at no net cost,” the World Bank underscores in its Key… report.
Not surprisingly, super-light ships are also super expensive. Air lubrication also comes with a hefty price tag (and a rather modest GHG-E abatement potential). Curiously enough, slow steaming is MAC-positive, which isn’t something positive for shipowners’ pockets. But this is where the Keys… analysis takes a sharp
Fig.
Source: World Bank. Results are presented for the Maximum Efficiency-High Demand scenario. Solar panels were included in the modelling but were omitted from the visual for presentation purposes due to their small contribution to emissions abatement.
12. Annual costs of meeting the lower end of the IMO GHG reduction goals
Source: World Bank. Total annual costs (in $ billion) for the global shipping fleet for reaching the lower end of the IMO GHG reduction goals according to IMO’s 2023 GHG Strategy.
turn, just as different vessels head to their specific terminals.
Deceleration isn’t a cost-effective EEM for tankers as their auxiliary engines power on-board systems (e.g., cargo temperature control equipment) run full steam regardless of a ship’s actual speed. “Assuming that the voyage length increases at slower speeds, the overall energy from auxiliary engines forms
a larger proportion of the total energy demand.” Altogether, nine out of 14 EEM groups scrutinised for tankers are MACnegative by 2030, making it possible to cut this segment’s GHG-E by 60% at no cost. Container carriers, on the other hand, benefit greatly from slow steaming. These freighters, conversely, do not – or simply cannot – benefit from wind assistance as their decks are unsuitable for mounting
fixed sails (kites are a different story, told by now as models only, with theoretical power savings in the 1.0-4.0% range; also, getting a kite entangled in the Øresund/ Öresund Bridge or in a passing ship in the Kiel Canal would in all probability be an operational bummer of the year). Then again, you could, as the Dutch from Econowind, put a wing sail in a 40-foot box for mounting on a container ship (two pieces aboard ONE’s 1,036-TEU Kalamazoo, expected to generate up to 400kW of power, potentially reducing the feeder’s fuel consumption by 5.0%). Minus the power of the Anemoi (the Greek gods of wind, not the rotor-producing bearing that name), most EEMs are cost-effective for container ships, representing 95% of the total container ship emissions savings.
Also, most EEMs are MAC-negative for bulk carriers by 2030, here too accounting for 95% of GHG-E savings (with rotor sails being among the most cost-effective, though not exactly the most potent). Overall, “the emission reduction potential is largest for bulk carriers and container ships, especially for scenarios with low growth in transport demand” (read: fewer vessels needed, so we can decelerate the fleets).
Lastly in this thread, it was quite puzzling to see the following remark in the Keys… report, “There is less overall emission reduction potential from energy efficiency measures for non-major fleet segments such as vehicle carriers and ferries, segments that are included in the global fleet.” As things stand in the Baltic (and Norway regarding car carriers), it’s exactly these shipping sub-sectors that are exploring EEMs with gusto. Finnlines’ President and CEO, Thomas Doepel, in his company’s financial review for January-December 2025, noted, “The IMO’s decision last October to postpone consideration of the Net-Zero Framework adds uncertainty to shipping’s green transition. Nevertheless, Finnlines remains firmly committed to achieving its own environmental targets. […] The fleet’s carbon intensity decreased by 14% when compared with 2024. Compared with 2008, which is used as the baseline year in shipping, the company has already achieved the 40% reduction target set for 2030 ahead of schedule.” Finnlines operates in the FEUM-EU ETS area, so given these regional regulations, it’s just good business to green one’s footprint. Its three Hansa Superstars cruise ferries, to criss-cross the Baltic Sea between
Fig.
Fig.
Source: World Bank. Total annual costs (in $ billion) for the global shipping fleet for reaching the higher end of the IMO GHG reduction goals according to IMO’s 2023 GHG Strategy.
Helsinki and Travemünde as of 202829, will include multi-fuel (methanol) engines, optimised hull and propeller designs, shore-power connectors, and energy-efficient on-board power management systems for both at-sea and in-port operations, “all contributing to over a 50% reduction in CO₂ emissions per transported cargo unit compared to vessels currently operating on the same routes,” Hansa Superstars’ designers from Deltamarin highlighted in a press brief. What Finnlines’ newbuilds won’t sport is wind-assisted propulsion, a total sham according to Emanuele Grimaldi, who heads Finnlines’ parent company, the Grimaldi Group.
Finally, the Keys… analysis also calculated the total cost of reaching the IMO’s GHG-E reduction goals, considering annual fuel expenses, as well as CAPEX and OPEX of EEMs and green fuels (CAPEX covers fleet investments to make vessels ammonia-capable; ammonia-OPEX includes bunkering, maintenance and repair, and crew training; considered separately, fuel costs include raw material, production, fuel distribution, and supply-demand considerations). The business-as-usual scenario will see shipping spending over $200b/year on fossil marine fuels towards the middle of the century. Should the sector decide
to tick off IMO goals with e-ammonia, the costs would increase by $410-500b in 2050 (depending on transport demand and whether base or ‘strive’ IMO checkpoints are met along the way).
Technologies must demonstrate
All things counted, why isn’t the shipping sector investing like mad to (de)fuel
Barrier
Economic
Market failures
Negative externalities
Imperfect information
Asymmetric information
Split incentives
the green transition? The World Bank goes over several economic, behavioural, and organisational barriers. It cites a survey of 5,500 ships (275 shipowners), which found that the most widely implemented devices had only a small energy-efficiency savings potential at the vessel level. At the same time, EEMs with the highest savings potential had the lowest levels of implementation. “Even for technologies with the highest uptake, the share was low, ranging from 11-18% for pre-/post-swirl devices and 20-26% for energy-saving lighting for the ships in the sample.” Then again, the Keys… analysis continues, “Air lubrication, wind-assisted propulsion, and advanced low-friction anti-fouling coatings remain less common but have grown over the past five years.” However, “The entry into force of the 2023 EEXI regulation has also driven a marked increase in engine power limitation and shaft power limitation, which may have contributed to reduced near-term investment in other energy efficiency technologies.” Well, if complying with (it seems counterproductive) EEXI is the best shipping can do concerning its green transition, it’s not doing much at all.
The industry has long been mocked as a fossil – not only owing to its extensive use of fossil fuels. “[…] Behavioral barriers relate to decision makers’ non-financial behavior. These include their inability to process information, their inertia in adopting energy efficiency measures, their values about energy efficiency, and credibility and trust issues with an information
Non-market failures
Description
Situations where market outcomes do not maximize efficiency.
Markets do not price the full cost of production.
Decision-makers lack full knowledge of efficiency options or savings potential.
One party has more/better information than another.
The party paying for efficiency is not the one reaping the benefits.
Barriers representing real features of decision-making, which are not captured in techno-economic modelling.
Shipping-specific example
Energy savings may not be fully realized if costs/benefits are misaligned across actors.
The climate impact of GHG emissions, and health impact of air pollutants, is not included in fuel or shipping costs.
Shipowners may not know the true fuel savings of new technologies.
Charterers may not trust owners’ claims about ship efficiency, leading to underinvestment.
Owners pay for retrofits, but do not receive a premium from charter rate in a time charter that pays back the investment.
Barriers such as hidden costs (downtime in retrofitting) and funding prevent uptake.
Tab. 3. Overview of barriers in shipping
Non-market failures Barriers representing real features of decision-making, which are not captured in techno-economic modelling.
Market heterogeneity Variations across actors make “one-size-fits-all” solutions ineffective.
Hidden costs Additional costs beyond purchase/installation not always accounted for.
Access to capital Difficulty obtaining financing for efficiency improvements.
Barriers such as hidden costs (downtime in retrofitting) and funding prevent uptake.
Different ship types and routes mean that savings and applicability of measures varies.
Downtime during retrofits, training, increases in operational costs, or certification requirements deter investment.
Smaller operators may lack credit to invest in new technologies.
monetarily from fuel savings also doesn’t have to be a clear-cut issue in the shipping business (and going with that to court would guarantee a protracted source of headaches and lawyers’ bills).
Risk Uncertainty around future fuel prices, policy, or technology performance.
Shipowners hesitate to invest if payback periods are unclear.
Barrier Description Shipping-specific example
Behavioral
Bounded rationality Sub-optimal decision making.
Bounded rationality Limited cognitive capacity leads to suboptimal decisions.
Human dimension Social factors that influence the adoption of measures.
Form of information Presentation of information affects decision-making.
Credibility and trust Lack of trust in the source of information or data.
Inertia Preference for the status quo or resistance to change.
Values Cultural or personal attitudes influence choices.
Organizational
Power Internal decision-making authority shapes outcomes.
Culture Shared norms and attitudes affect organizational behavior.
Source: World Bank.
provider or party they need to collaborate with to implement an energy efficiency measure.” Organisational structures affect the implementation of EEMs, too, reflecting “[…] how the different groups within an organization have different priorities that prevent the rational and efficient implementation of energy efficiency measures.” Just like in those cartoons, where the sustainability spirit sits on the protagonist’s one shoulder, while the commercial imp perches on the other. And since shipping is a business, well, unilateral hearing loss isn’t unheard of.
Operators focus on short-term costs rather than lifetime fuel savings.
Complex technical data may not be understood by shipowners or financiers.
Owners may distrust technology suppliers’ performance claims.
Companies continue established operating practices despite available solutions.
Some owners prioritize reliability and reputation over efficiency.
Technical teams may recommend upgrades, but financial departments block them.
Companies with conservative cultures may be slower to adopt new technologies.
Within shipping, there are split incentives as well. Shipowners “sail fast, then wait” because they’re compensated for this operational inefficiency through demurrage. If it pays more than savings on bunker, that’s a clear incentive – especially if the charter-party contract contains a charter speed and a due despatch clause. Also, the payload might be so lucrative that slow steaming would only cut into the financial gains of delivering the goods as fast as possible (plus taking on board another shipment to utilise the asset as quickly as possible). Who gains
“Modeling studies, sea trials, and operational data suggest fuel savings from wind-assisted propulsion can range from as low as 1.0-2.0% to more than 40%, depending on the specific vessel configuration and operational context,” says the Keys… report. A rotor is an expensive piece of machinery in itself, not to mention the dry-docking commotion when one goes for a retrofit. Imagine now that real-life performance doesn’t live up to simulations (especially that climate change can drastically outdate historical weather data on which AI models rest). Would a manufacturer share such a case study in its circular? Surely the operator would think twice before mounting another sail – or perhaps even give another EEM a try. An EU survey from 2016 said the most important challenges seen by owners-operators for wind-assisted propulsion uptake were the lack of trusted information on the performance, operability, safety, durability, and economic implications, followed by access to capital for the development of this EEM type. While recent years have upped the number of installations to several dozen (71 at the end of Q1 2025 according to the International Windship Association), “Still, suppliers are not using a standardized method to calculate fuel savings from wind-assisted propulsion,” notes the World Bank. “Datasets on the performance of wind technologies are currently owned by each technology provider, who struggle to communicate the average savings as they depend on several factors (for example, ship type, size, and route).” Shipping not having the full picture of what they’re about to invest in is one red flag. “Financiers’ lack of knowledge about technology and trusted third-party verification data have also exacerbated access to capital.” Wind-assisted propulsion system manufacturers are trying to remedy the situation. For example, the Finnish Norsepower has shifted the upfront cost of its technology to a monthly fee based on the actual fuel saved, “[…] effectively implementing a pay-as-you-save model.” Other options explored by the industry are lease and modular rentals. And here is a real cracker: a system installation (two 37.5-metre tall WindWings) on Pyxis Ocean , chartered by Cargill,
Remuneration
Control of the ship (trading, routes sailed)
Cargo handling (stowage and storage)
Voyage expenses (port and fuel costs)
Operating expenses (crew wages, maintenance, repairs, stores & supplies, insurance, overheads)
Capital expenses (interest and capital repayment)
Voyage charter
Per unit of cargo for example $/ ton/TEU
Contract of affreightment Time charter Bareboat charter
Per unit of cargo over a fixed duration and route Per day Per day
Owner Owner Charterer Charterer
Charterer Charterer Charterer Charterer
Shipowner Shipowner Charterer Charterer
Shipowner Shipowner Shipowner Charterer
Shipowner Shipowner Shipowner Shipowner
Source: Adapted from Rehmatulla and Smith (2020), Stopford (2009) and Plomaritou (2014).
14. Range of savings from different technical measures
Savings ranges with min, max, and average points
Wind-assisted propulsion
Waste heat recovery
Contra-rotating propeller Air lubrication
Source: World Bank.
Fig. 15. Range of savings from different operational measure
Savings ranges with min, max, and average points Weather routing
Onshore power
Source: World Bank.
Ultimately, the World Bank stresses in the Keys… analysis, energy-efficiency technologies are inherently linked to the underlying asset, the ship itself. “To justify financing for energy efficiency upgrades, these technologies must demonstrate that they enhance the ship’s value, for example, by improving operating cash flow through reduced fuel costs or lower compliance expenses.” Given that wind-assistance potential largely depends on the weather conditions of the specific route a vessel serves, such a system might very well be a value-adding asset, as it can be a liability when the time comes to sell the ship. You can worry about the resale value of a ship with a sail, get sleepless nights from regulations or bunker prices, and whatnot – or you can be obscenely rich (catering to even richer people) and build the world’s largest luxury sailing yacht. At the beginning of this year, Orient Express Corinthian of Orient Express (of Accor, the largest hospitality company in Europe, in co-op with none other than LVMH) seatested her three 360-degree rotatable, tilting-up-to-70°-masts, 100-metre tall rigs, each spanning 1,500 m². In 20 knots of wind, this GT 26,600, 220-by-25-metre lavishness reached a speed of 12 knots. Because if you’re filthy with money, you can either afford to run your engines on pure apathy or be wind-green while cracking open a cognac bottle the price of a mundane rotor while sailing in the Med or the Atlantic (or anywhere you want, safe for reason or ice restrictions). Of the chronicler’s duty, it needs to be added that Orient Express Corinthian ’s engines can burn gas, and the propulsion system design is hydrogen-ready. What is partly reassuring is that Orient Express Corinthian at least isn’t a grave offence to the eye, as when the Americans commission the biggest cruise ship in the world… A four-night oh-so-green cruise (from Monte Carlo to Saint-Tropez) is being pre-sold for £35,535 (that’s for the smallest 70 m² suite; the presidential suite is 1,000 m² – in case you’re wondering), up to £62,186 for a week en route Marseille-Monte Carlo. That would Tab. 4. Cost allocation between
was supported by a grant from the EU’s Horizon 2020 research and innovation programme (Cargill and Pyxis Ocean ’s owner, Mitsubishi Corporation, aren’t exactly the poorest businesses, but if the EU wanted to foot the bill…). According to the WindWing Project, on an average global route, WindWings can save 1.5 tonnes of fuel per day (with the possibility of saving more on trans-ocean crossings).
Fig.
Requested Time of Arrival (RTA)
be, respectively, some 770 and 1,350 sailings on the Umeå-Vaasa ferry crossing, the world’s first green shipping corridor. Whatever wags your environmental tail.
Source: World Bank (2025b) based on GIA (2020).
Trust to break the anchoring habit
The Keys… report concludes by putting the spotlight on an operational EEM, the uptake of which continues to face headwinds: port call optimisation (PCO). Its Holy Grail – just-in-time (JIT) arrival – can cut a vessel’s GHG-E by 3.0-25%, “[…] depending on the ship type, model assumptions, the period over which speed is optimized, and the length of the voyage. […] The reduction of GHG emissions in ports also has the added benefit of reducing the CII because emissions in port cannot be offset by tonne-miles.”
The World Bank illustrates this with a set of case studies, including Tanger Med (average anchorage time down from 17.5 hours in 2017 to 7.3 h in 2023) or the Hamburg Vessel Coordination Center (HVCC), a JV between two competitors, EUROGATE and HHLA (with a direct API with the ports of Rotterdam and Le Havre). “An example of a JIT journey provided by HVCC shows that an 18,000 TEU container ship was able to reduce its speed from 18 knots to 14 knots travelling from the Port of Rotterdam, saving 22 tonnes of bunker fuel and 66 tonnes of carbon emissions.” The Keys… report also mentions the PCO solution implemented by Gävle, especially underscoring that the Swedish seaport has made its queuing systems mandatory through law for specific terminals (managed by the port itself) or types of vessels (tankers).
These examples pretty much exhaust the GHG-E reduction opportunities and
the challenges with implementing PCO/ JIT. On the one hand, the (ever) promising yet seldom-implemented slow steaming. On the other, first, the lack of datasharing trust among stakeholders (and even the most backwater pen & paper shipping line knows that data is more precious than family silverware), who are “[…] concerned that this information could be used by third parties to infer commercially sensitive information, such as the type of commodities being traded or terminal productivity”). Second, the shortage of collaboration/ coercion tools in a landlord port authority’s box, primarily concerned with infrastructure and not with the lessee’s operations. While a crisis or an accident can be a catalyst for developing a PCO system – massive air pollution caused by a container-ship-anchorage surge outside Long Beach and Los Angeles or the grounding of a bulk carrier in the Australian Port of Newcastle, respectively – “other motivating factors include improving coordination, transparency, efficiency and situational awareness; reducing GHG emissions; reducing costs; reducing air pollution; and mitigating disputes arising from the first come, first serve system.”
Then again, the charterer-shipowner dynamics can very well mess up the cosiest PCO-slow steaming bed for cargo and demurrage’s sake. That and the endless calamities forces outside shipping’s influence throw at the schedules, with armed conflicts playing the first Kalashnikovfiddle recently (this is not to forget that a ship can wedge shut one of the world’s most important canals on its own or ram into a bridge at the cost of life and limb, effectively sealing off a seaport).
In 2026 and beyond
Do we have to wear sackcloth and ashes for reporting on transport & logistics developments, particularly the green ones? After all, a news bit about a shipowner inking a rotor investment carries more market intel (and clicks, and thumbs up on LinkedIn, and hope in humankind) than the rest of the kin not doing the same – or does it? Maybe both carry the same message, “[…] voluntary initiatives are not effective to decarbonize the shipping industry on their own […]” Read: if all the ships around the world were to employ all the EEMs, then it still wouldn’t be enough.
Authors of the World Bank’s Keys to Energy-Efficient Shipping state that “regulations, policies, and standards are key to address [the sector-specific economic, behavioral, and organisational] barriers.” As things stand today, IMO’s NetZero Framework is still lying bruised on 4 Albert Embankment’s pavement in London after last autumn’s defenestration. Coming with new, larger-than-life ‘green-everything’ slogans every postelection time, the EU has been effective at taxing the shipping business – how about a carrot policy now? The current EEDI/XI standards are too low a bar to jump over to make a decarbonisation difference.
I am not cynically saying that those who invest in EEMs do not care about the environment. But as sure as eggs is eggs, they care about their margins, too, with the bunker invoice being an opponent worthy of throwing their best punches at. In 2026 and beyond, what else can a shipping company do alone to make its business greener? If it wants to decarbonise to begin with, that is…