
ASEAN-5 IN AN ERA OF GEOECONOMIC REALIGNMENT Opportunities
and risks in a fragmenting global economy
BY AMIN MOHSENI-CHERAGHLOU


ASEAN-5 in an era of geoeconomic realignment
Introduction
Rising geoeconomic fragmentation and intensifying trade tensions between the world’s two largest economies have put the Association of Southeast Asian Nations (ASEAN) in a delicate balancing position. Established in 1967 to promote economic, political, and security cooperation, ASEAN today comprises eleven countries: Brunei, Cambodia, Indonesia, Laos, Malaysia, Myanmar, the Philippines, Singapore, Thailand, Vietnam, and Timor-Leste.
Within the bloc, the five largest middle-income emerging market and developing economies (EMDEs)—Indonesia, Malaysia, the Philippines, Thailand, and Vietnam (collectively ASEAN-5)— account for more than 84 percent of gross domestic product (GDP) and 87 percent of the population.1 This brief therefore focuses on these economies, examining their main industries, their roles in global supply chains, and the challenges and opportunities they face.
The central finding is that ASEAN-5 is well positioned for sustained growth and increasing significance in the global economy. A young and expanding population, improving human capital, abundant natural resources, and strategic proximity to major markets in South and East Asia underpin the bloc’s strong economic potential. Deep trade ties with East Asia, the European Union (EU), and the United States have further cemented the region’s role in global supply chains, particularly in high-tech manufacturing, energy, and consumer markets.
However, the results of this potential are not guaranteed. Rising geoeconomic fragmentation, trade disruptions, climate vulnerabilities, persistent infrastructure gaps, and regulatory constraints all pose significant headwinds that could limit the region’s trajectory if they are left unaddressed.
The brief proceeds as follows: Section II provides an overview of the main trends in the global economy, with a focus on middle-income EMDEs. Section III examines ASEAN-5 economies, their role in global trade and supply chains, and key opportunities. Section IV provides a discussion of the main challenges facing the bloc. Section V offers policy recommendations to help unlock ASEAN-5’s full potential, and Section VI concludes the brief.
The global economic landscape: Resilience, risks, and transformation
The global economic landscape is currently defined by a structural slowdown in growth, primarily driven by rising debt, aging population, climate change, inadequate infrastructure, geoeconomic fragmentation, and overall declining total factor productivity (TFP) over the past two decades. As illustrated in Figure 1, while the global economy has shown surprising resilience post-pandemic (maintaining an average GDP growth of approximately 3 percent between 2022 and 2024), the underlying forces of prosperity have weakened. This resilience is tempered by an increasingly uneven recovery; while middle-income countries continue to lead in growth, low-income economies have significantly regressed, being on average 20 percent poorer in 2024 than they were in 2011 (Figure 2).
In other words, by the end of 2026, GDP per capita in low-income economies is expected to remain below 2 percent of that in high-income economies. Moreover, with structural headwinds continuing to outweigh growth tailwinds, the global economy is likely to remain on a path of slowing long-term growth for the foreseeable future. According to the World Bank’s 2026 “Global Economic Prospects” report, this means “the average growth rate of this decade will be the lowest since the 1960s,” posing major challenges to global efforts aimed at reducing extreme multidimensional poverty and inequality.
The looming debt crisis
One of the most critical headwinds facing the global economy is the unprecedented rise in public and private debt. Global public debt is projected to exceed 100 percent of global GDP by 2028, with EMDEs currently facing debt levels at a fiftyfive-year high (Figure 3). This burden is particularly acute for EMDEs due to borrowing costs, which range from 7 percent to 11 percent for EMDEs, compared to 1 percent to 4 percent in advanced economies, forcing EMDEs to allocate significant portions of their budgets to debt service. As shown in Figure 3.1, the share of government revenue dedicated to interest payments in EMDEs doubled from 5 percent in 2008 to 10 percent in 2023, totaling approximately $415 billion in 2024 alone and diverting funds away from essential expenditure and investments in infrastructure, health, and education.
Beyond the rising levels and costs of public debt, policymakers must also confront the growing risks posed by the world’s massive stock of combined public and private debt. According to the Institute of International Finance’s 2025 “Global Debt
1. In this brief, EMDEs are referred to as middle-income economies, and are otherwise categorized as lower -and upper-middle income economies in World Bank and International Monetary Fund datasets. Low-income economies are not considered part of EMDEs. In the literature, they are usually referred to as least-developed countries or LDCs.
Source: “World Development Indicators,” World Bank; author’s calculations.
Source: “World Development Indicators” and author’s calculations.
Figure 1: GDP and GDP per capita growth (five-year moving average percentage)
Figure 2: GDP per capita growth (constant 2015 US dollars, percentage)
3: General government gross debt (percentage of GDP)
Source: “World Economic Outlook,” International Monetary Fund, October 2025.
Source: “World Development Indicators” and author’s calculations.
Figure
Figure 3.1: Interest payments (percentage of revenue)
Monitor” report, global debt climbed to nearly $350 trillion in 2025, more than three times global GDP. Such unprecedented debt levels heighten vulnerabilities in global financial markets and increase the risk of financial instability, particularly in an environment of increasing uncertainties and slowing growth.
Demographic shifts and labor market fragility
Demographic trends present a double-edged sword for EMDEs. As seen in Figure 4, while high-income nations grapple with an aging population—one of five people in high-income economies is over the age of 65—the share of population aged 65 and above has remained merely around 3 percent and 6 percent in low- and lower-middle income economies, respectively. In fact, these economies house 60 percent of the world’s population aged 0–14, creating a massive demographic dividend, but only if 40–50 million jobs can be created annually through 2040. Failure to do so could lead to increasing social and political instability in these economies, which could lead to mass migration crises.
Global labor markets appear stable with a 5 percent unemployment rate, but this is masked by a structural decline in labor force participation (LFPR), which fell to 61 percent in 2025 (Figure 4.1). In other words, declining LFPR around the world
is one factor in lower unemployment rates. Youth unemployment remains a persistent challenge at 13.4 percent globally, and it has increased in upper-middle income economies over the last quarter century. This reflects a growing skill mismatch in EMDEs as these economies shift from labor-intensive, low-technology industries toward more capital-intensive and technologically advanced sectors.
The climate challenge and the energy transition
Climate change acts as a major drag on the global economy, with the frequency of disasters increasing from fewer than one hundred per year in 1980 to more than 350 by 2024 (Figure 5). EMDEs bear the brunt of climate-related disasters, which could reduce global income by 20 percent by 2050. While global primary energy use has been shifting away from oil and coal toward renewables and natural gas (Figure 5.1), greenhouse gas emissions still reached a record 53.2 gigatons (GT) in 2024 (Figure 5.2).
Interestingly, high-income countries have reduced per capita emissions by 18 percent since 2001 and global growth in per capita emissions is now primarily driven by EMDEs such as China and India. Nonetheless, per capita emissions in high-income economies remain significantly higher than in EMDEs—43
Figure 4: Population aged 65 and above (percentage of total population)
Labor force participation rate
Source: “World Development Indicators.”
5: Climate-related disasters frequency, number of disasters: total
Climate related disasters frequency, Number of Disasters: TOTAL Linear (Climate related disasters frequency, Number of Disasters: TOTAL)
Source: “Macroeconomic Climate Indicators Dashboard,” International Monetary Fund; author’s calculations.
Figure 4.1:
Figure
5.1: World primary energy use mix
Source: “BP Energy Outlook 2025.”
5.2: Total greenhouse gas emissions excluding land use, land-use change, and forestry (LULUCF) (million tons (Mt) of carbon dioxide equivalent (CO2e))
Source: “World Development Indicators.”
Figure
Figure
Source: “World Development Indicators.”
Figure
Table 1: World electricity generation by source (terawatt hours (TWh))
ASEAN-5 in an era of geoeconomic realignment
percent more than higher-middle-income economies, 4.7 times those in lower-middle-income economies, and 8.8 times those in low-income economies (Figure 5.3). According to Table 1, to meet the 2 degrees Celsius (°C) target by 2050, the world must electrify and decarbonize fast, which means it needs to increase wind and solar generation by a factor of thirteen by 2050. At the same time, while carbon pricing is expanding (with more than eighty emissions trading schemes (ETS) and carbon taxes active in 2025), carbon prices remain too low to meet climate goals in a timely manner.
Infrastructure and the digital divide
The lack of basic infrastructure remains a staggering hurdle for the low-income and lower-middle-income economies. As shown in Table 2, in low-income economies only 45 percent of the population has access to electricity, less than 25 percent
use internet, and fixed broadband subscription rates are less than one per one hundred people. To address increasing global demand for basic infrastructure, meet climate targets, and power the artificial intelligence (AI) revolution, an estimated $106 trillion in investment (mainly in low-income economies and EMDEs) is required by 2040, a sum that necessitates massive mobilization of private capital through innovative public-private partnerships. Driven largely by the rapid rise of AI and its expanding use across virtually every sector of the economy, global demand for information and communications technology (ICT) and digital infrastructure investment is projected to reach $19 trillion in the next fifteen years.
The rapid rise of AI and the digital economy has become a primary driver of recent growth, particularly in the United States, where AI-related investment accounted for nearly 40 percent
Source: “World Development Indicators.”
Source: “The 2026 AI Index Report,” Stanford Institute for Human-Centered AI (HAI).
Table 2: Access to infrastructure
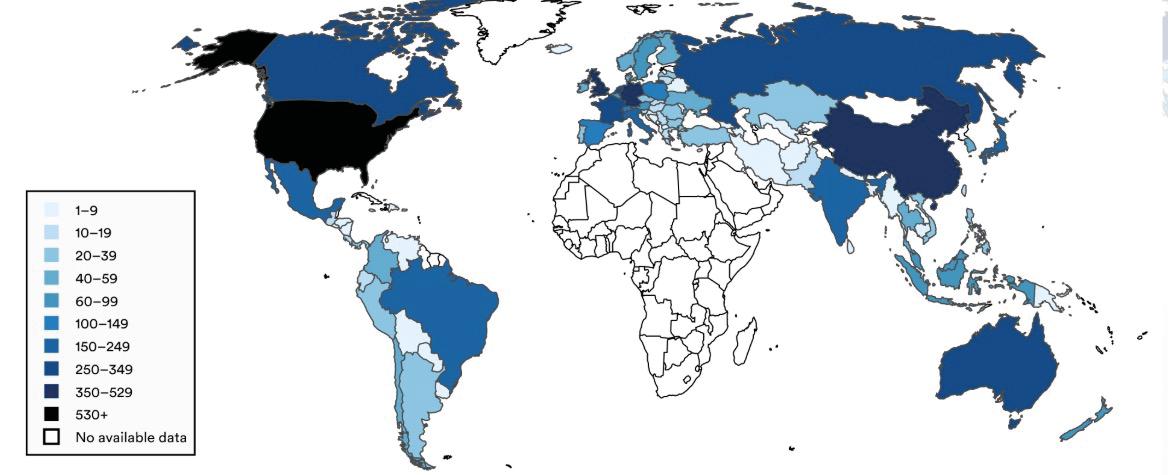
Figure 6: Global distribution of data centers, 2025
of GDP growth through the third quarter (Q3) of 2025. However, the AI revolution and investment in data centers are highly concentrated in a few countries (Figure 6), exacerbating the existing wide digital divide across economies. With more than 25 percent of people globally without access to the internet, the AI revolution is poised to leave 2 billion people—mainly from the low-income economies—behind, much like they were left behind by the internet revolution of the past three decades (Figure 6.1).
Geoeconomic fragmentation, inflation, and TFP
Over the past decade, the global economy has experienced increasing momentum of geoeconomic fragmentation, characterized by trade decoupling, re-shoring, and friend-shoring. Trade barriers have been on the rise (Figure 7), causing the global trade-to-GDP ratio to decline and stagnate after increasing continuously for more than three decades and peaking at 61 percent in 2008 (Figure 8). This fragmentation, alongside supply chain pressures and extreme policy uncertainty, has fueled inflation and weakened TFP, or the efficiency with which economies use labor and capital.
Inflation remains a significant hurdle, particularly for low-income economies where budget deficits are often monetized due to a lack of access to debt markets (Figure 9). These pressures are exacerbated by volatile energy and food prices (Figures 10 and 10.1), which have remained elevated following the pan-
demic, the Russia–Ukraine war, and the most recent conflict in the Persian Gulf.
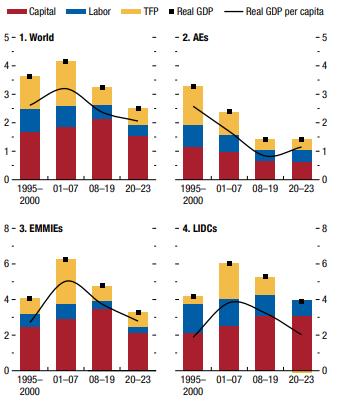
In major economies such as the United States, EU, China, Japan, the United Kingdom, and Canada, aging populations, weaker business investment, climate-related disruptions, increasing policy uncertainties, and structural frictions have all reduced TFP growth and limited the efficient flow of labor and capital toward the most productive firms. International Monetary Fund (IMF) analysis from April 2024’s World Economic Outlook shows that TFP’s contribution to growth declined sharply across advanced, emerging, and low-income economies between 2020 and 2023. As shown in Figure 11, TFP’s role in driving global growth peaked in the early 2000s and has steadily weakened across the world since the global financial crisis, falling to nearly zero in low-income developing countries during 2020–2023.
In conclusion, while technological tailwinds such as AI and the green transition are creating new momentum for global growth, the world economy faces an increasingly fragile outlook marked by rising debt burdens, demographic pressures, geoeconomic fragmentation, supply chain disruption, and widening disparities between advanced and developing economies. As shown earlier in Figure 2, EMDEs have become the primary engine of global growth over the past two decades, yet persistent infrastructure gaps (especially in digital infrastructure), skills mismatches, limited youth employment
Source: “World Development Indicators.”
Figure 6.1: Individuals using the internet (percentage of population)
Figure 7: Number of trade restrictions imposed annually worldwide
Source: Global Trade Alert
8: Global trade-to-GDP ratio (percentage)
Source: “World Development Indicators.”
Figure
Figure 9: Inflation, annual change in GDP deflator (percentage)
Source: “World Development Indicators.”
Source: Federal Reserve Economic Data, Federal Reserve Bank of St. Louis; author’s calculations.
Figure 10: Global energy price index
Source: Federal Reserve Economic Data, Federal Reserve Bank of St. Louis; author’s calculations.
Figure 11: Contribution of components of GDP growth, 1995–2023 (percentage)
Source: “World Economic Outlook,” 68.
Figure 10.1: Global food price index
ASEAN-5 in an era of geoeconomic realignment
opportunities, and, most critically, rising trade barriers and geoeconomic fragmentation are clouding their long-term development and growth prospects. In this increasingly uncertain and fragmented global economic and trade environment, the ASEAN-5 economies are striving to keep pace with rapid technological change while strengthening economic resilience, investing in modern infrastructure, ensuring energy and food security, and creating the skills and jobs needed for their young and growing populations.
ASEAN-5: An overview and key opportunities
Overview
As mentioned earlier, ASEAN-5 economies are the five EMDEs within the larger ASEAN bloc. As seen in Figure 12, in addition to ASEAN-5, the bloc also includes a few low-income (such as Myanmar and Timor-Leste) and high-income (such as Singapore and Brunei) economies.
Over the past twenty-five years, EMDEs have become increasingly central to the global economy, raising their share of global GDP from 21.5 percent in 2001 to 38 percent in 2024. Much of this transformation was driven by China, whose share of global output climbed from 6.2 percent to 19.2 percent over
the same period (Figure 13). ASEAN-5’s economic trajectory has been closely tied to this rise. China’s share of ASEAN-5 trade expanded steadily from roughly 5 percent in 2001 to more than 22 percent in 2024 (Figure 14), making it the bloc’s largest trading partner. At the same time, the combined trade share of the United States, the European Union, and Japan declined from 46 percent in 2000 to 27 percent in 2024, underscoring a major reorientation of ASEAN-5’s external economic relationships.
Against this backdrop, ASEAN-5 economies consistently outperformed global growth trends, increasing their share of global GDP from 2.1 percent in 2001 to 3.1 percent in 2024 (Figure 13). Between 2001 and 2024, the bloc recorded a compound annual growth rate (CAGR) of 4.7 percent—the second highest among major EMDE groups, behind only China (Figure 15). Looking ahead, growth momentum is expected to remain strong. In 2026, Vietnam and Indonesia are projected to grow by 7.1 percent and 5.0 percent, respectively, well above the projected global growth rate of 3.1 percent and the EMDEs average of 3.9 percent
ASEAN-5 economies are deeply integrated into global trade and remain among the most trade-oriented economies in the world. Although the ratio of total trade to GDP declined
Source: “World Development Indicators.” Yellow bars represent ASEAN economies. Yellow bars with GDP per capita figures represent ASEAN-5 economies.
Figure 12: ASEAN and selected economies, 2024 GDP per capita (constant 2015 US$)
ASEAN-5 in an era of geoeconomic realignment
13: Share in global GDP (percentage)
Axis
Source: “World Development Indicators”; author’s calculations; ASEAN-5 right axis.
14: ASEAN-5 share of trade with major economies
Source: “ITC Trade Map,” UN Comtrade.
Figure
Figure
ASEAN-5
15: Compound annual growth rate (percentage)
Source: “World Development Indicators”; author’s calculations.
Source: “World Development Indicators”; author’s calculations.
EMDES EMDEs (excluding China and ASEAN-5)
Low
ASEAN-5
Figure
Figure 16: Trade (percentage of GDP)
ASEAN-5 in an era of geoeconomic realignment
from 106 percent in 2001 to 92 percent in 2024—reflecting rising trade restrictions, supply chain disruptions, and growing geoeconomic fragmentation—it has consistently remained well above the global average (Figure 16). This high degree of openness has been a major driver of the bloc’s growth, industrialization, and integration into global value chains. At the same time, it also leaves ASEAN-5 more exposed to external shocks, shifting trade policies, weakening global demand, and, most importantly, growing geoeconomic and trade fragmentation.
Key opportunities: Global supply chains
ASEAN-5 has emerged as a key hub in global value chains and cross-border production networks, particularly in industries such as electronics, semiconductors, automotive components, and apparel. A large share of the region’s trade consists of intermediate goods tied to global supply chains, reflecting ASEAN’s deep integration into the global economy and its increasingly central role in international production. As shown in Figure 17, this is reflected in more than $870 billion of inward foreign direct investment (FDI) flows into ASEAN-5 over the period 2010–2024. The increasing share of ASEAN-5 in global FDI inflow—from 2.6 percent in 2010 to 5.4 percent in 2024—is indicative of the region’s growing importance in global production and the region’s attempt to diversify supply chains in
response to rising trade tensions, geopolitical uncertainty, and the need for greater resilience.
In conjunction with this increasing industrial activity and value chain integration, the region is also demonstrating more pronounced patterns of sectoral specialization. Electrical and electronics play a dominant role in both Vietnam and Malaysia, accounting for 38 percent and 48 percent of their exports, respectively. Thailand is producing automobiles and computer parts. Indonesia is a major supplier of iron, steel, and nickel products. The country stands as the dominant force in the global nickel market, accounting for more than 60 percent of mined supply worldwide. Backed by significant FDI in its nickel industry and a strict ban on raw ore exports, it has rapidly moved up the value chain—from exporting unprocessed ore to becoming a central hub for refining, processing, and electric vehicle (EV) battery supply chains.
Meanwhile, the Philippines has emerged as a significant player in the semiconductor sector, with semiconductors making up 75 percent of its electronics exports. Broadly speaking, given its relatively educated young labor force, technological advancement, natural resources, proximity to East Asian markets and production centers, and access to ports, ASEAN-5 has seen an expansion in its manufacturing and industrial base over the past decade. This is especially true for Indonesia and Malay-
Source: “World Development Indicators”; AseanStats; author’s calculations.
Figure 17: ASEAN-5 flows of inward FDI (2010–2024)
ASEAN-5 in an era of geoeconomic realignment
sia, where the Index of Industrial Production (IPI) for the manufacturing industry grew by 41 percent and 31 percent, respectively, between 2012 and 2024. The creation of innovation clusters and special economic zones (SEZs) is further fueling these developments, supporting ASEAN-5’s transition to more technologically advanced production.
As a result, ASEAN-5’s abundant mineral and energy resources (see below)—combined with its accelerating shift toward electronics, high-tech manufacturing, and a growing digital economy (see below), as well as its close proximity to East Asian industrial hubs—position the bloc to move to the center of global supply chains while steadily climbing up the value chain.
Key opportunities: Digital economy
The rapid evolution of ASEAN-5’s digital landscape is being fueled by the rising tide of internet use, online shopping, and platform-based services. As seen in Figure 18, the share of people using the internet in ASEAN-5 increased from 3.7 percent in 2001 to more than 77 percent in 2024 (above the world average of 71 percent), with Malaysia leading all other ASEAN-5 economies at 98 percent. This growth, which has been fueled largely by these economies’ 98 percent or more access to electricity and the region’s strong investment in its digital infrastructure and literacy, has strengthened ASEAN5’s place in the global digital economy. With the implemen-
tation of the Framework Agreement on the Digital Economy (DEFA), ASEAN’s digital economy is expected to double to $2 trillion by 2030, with ASEAN-5 accounting for about 70 percent of this market.
The services sector is becoming the fastest-growing driver of trade and FDI across the ASEAN-5, while also serving as an important source of employment for women and a broader force for economic inclusion. Much of this momentum is being fueled by deeper regional integration, digitalization, and national reforms aimed at moving beyond traditional outsourcing toward higher-value technology and knowledge-based services. Tech outsourcing, in particular, presents a major opportunity to deepen ASEAN-5’s trade and economic ties with more advanced economies in East Asia and beyond.
The Philippines remains a leading hub for business process outsourcing (BPO) and digital services, supported by a highly skilled, English-speaking workforce. Increasingly, however, the country is shifting toward more sophisticated, higher-value digital technology services such as software engineering, data analytics, fintech, and knowledge process outsourcing (KPO). Meanwhile, Vietnam is rapidly emerging as a major destination for tech outsourcing, with recent World Bank data showing strong gains in technology and financial services following market liberalization and reform.
Source: “World Development Indicators”; author’s calculations.
Figure 18: Individuals using the internet (percentage of population)
ASEAN-5 in an era of geoeconomic realignment
Moreover, ASEAN-5’s increasing footprint in the global electrical and semiconductor industries, its ample renewable energy potential, and its young and tech-savvy population are some of the reasons why hyperscale technology giants such as Amazon Web Services (AWS), Microsoft, Google, and Meta are investing billions of dollars to expand digital infrastructure across ASEAN-5. AWS alone has committed $6 billion to Malaysia, alongside similar investments in Thailand and Indonesia. Microsoft is investing $2.2 billion in Malaysia and $1.7 billion in Indonesia, while Google is developing a hyperscale facility in Vietnam and has earmarked $1 billion for Thailand.
Key opportunities: Energy and nature-based solutions
The energy and climate sectors offer another opportunity for progress, considering ASEAN-5’s significant strengths in green supply chains and renewable energy, as well as its growing potential in voluntary carbon markets (VCMs) and nature-based solutions (NbSs).
With global greenhouse gas (GHG) emissions on the rise—reaching 53.2 GT of CO2e in 2024—and heightened concerns over energy security, the demand for diverse sources of energy, especially domestically produced renewable energy, is ri-
sing. Reflected in Tables 3 and 4, ASEAN-5 enjoys a unique set of energy endowments that, if tapped, could both reduce their dependence on energy imports significantly and help address some of the increasing energy demand in East Asia.
To better realize the ASEAN-5 economies’ massive energy potential, providing some perspective on the table above would be beneficial. Specifically, ASEAN-5 is home to
y the world’s seventh-largest proven coal reserves and 50 percent of global thermal coal exports (mainly to East Asian economies);
y the world’s fifth- and sixth-largest liquefied natural gas (LNG) exporters, accounting for 10 percent of global LNG exports (mainly to East Asian economies);
y the world’s largest and second-largest palm oil exporter, accounting for more than 80 percent of the world’s total palm oil exports; and
y about 3600 GW of geothermal, renewable, and hydro technical potential capacity, which is more than ten times larger than its current 350 GW installed electricity generation capacity across all of ASEAN.
Table 3: ASEAN-5 share of global proven energy reserves (approximate percentage)
Table 4: ASEAN-5 renewable energy potentials (gigawatts)
ASEAN-5 in an era of geoeconomic realignment
Given the bloc’s significant renewable energy potential, combined with its rapid economic and population growth—and the resulting surge in energy demand to support expanding industrial activity—the ASEAN-5 energy sector, particularly renewables, presents a highly attractive investment opportunity. This case is further strengthened by the growing interest of major hyperscalers in the region, which are actively seeking to establish data centers and will require substantial, reliable clean power to operate at scale. Clean energy is especially critical given these firms’ climate commitments and active participation in VCMs. By powering data centers in ASEAN-5 with renewables, these firms can significantly reduce operational emissions and, in turn, decrease their reliance on carbon credit purchases to meet net-zero commitments.
At the same time, when high-quality carbon credits are needed, ASEAN-5 is well positioned to supply them. The bloc is home to roughly 30 percent of the world’s NbS potential, with particularly strong opportunities in Indonesia, Malaysia, and the Philippines. To unlock this potential, ASEAN-5 economies—especially Indonesia—are strengthening monitoring, reporting, and verification (MRV) systems to ensure carbon credits are measurable, transparent, and investable. Robust MRV frameworks are essential not only for building trust and integrity in carbon markets, but also for supporting broader environmental and social goals, including biodiversity conservation, water regulation, disaster risk reduction, and community resilience across the region.
This comes at a time when the global voluntary carbon market is entering a period of rapid growth. Valued at $2.77 billion in 2025, the market is projected to exceed $45 billion by 2034, driven by rising corporate climate commitments and the growing use of offsets for emissions that cannot yet be fully eliminated through operational decarbonization. By 2024, more than 4,200 companies worldwide had validated or committed to science-based climate targets under the Science Based Targets initiative (SBTi), reflecting deepening corporate alignment with the Paris Agreement.
At the same time, the market is becoming more sophisticated and transparent. Carbon registries and exchanges are increasingly adopting digital MRV systems, blockchain-enabled registries, and satellite-based monitoring technologies to improve traceability, strengthen market integrity, and reduce the risk of double counting. Nature-based projects—including forest conservation, reforestation, and solar and wind farms— have emerged as one of the fastest-growing segments of the market because they deliver both verified emission reductions and broader environmental and social benefits. The World Bank estimates that nature-based solutions could provide up to 30 percent of the global emissions reductions needed by 2030 to meet climate goals.
Taken together, ASEAN-5’s unique geography and vast nature-based assets position the bloc to become a major player in global VCM, creating jobs and new income streams for local communities while strengthening environmental protection and advancing climate resilience.
Key opportunities: Demographics and labor markets
The ASEAN-5 presents a highly diverse demographic landscape. While Thailand is aging rapidly, much of the bloc is still benefiting from a demographic dividend supported by large and growing working-age populations. On average, nearly one-quarter of ASEAN-5’s population is under the age of 15, giving the region a young and dynamic labor force as well as an expanding consumer market over the next two decades.
ASEAN-5’s geographic proximity to the rapidly aging industrial and economic centers of East Asia—such as China, Japan, Singapore, and South Korea (Figure 19)—further enhances the bloc’s strategic importance. As labor shortages deepen, especially in Japan and South Korea, ASEAN-5 is well positioned to supply workers across a broad spectrum of industries and skill levels, ranging from hospitality, manufacturing, and services to more specialized technical professions. While this dynamic is most evident in East Asia, similar labor demands are emerging across other aging high-income economies. Such labor mobility can create mutual economic benefits: helping aging economies address workforce gaps while enabling ASEAN-5 to ease domestic labor pressures, generate employment opportunities, and increase remittance inflows that support household incomes and economic development.
The Philippines stands out as one of Asia’s youngest countries, with a median age of 25–26, giving it a long runway for workforce-driven growth. This demographic advantage aligns closely with the country’s established strength in BPO and its growing appeal as a destination for higher-value digital and technology services investment. Indonesia, Malaysia, and Vietnam are currently in their demographic “golden age,” with median ages around 30 and large productive populations expected to support economic expansion for at least another decade. Thailand, by contrast, has entered a post-dividend phase. With a median age above 40 and a shrinking labor force, sustaining growth will increasingly depend on automation, productivity gains, and a shift toward higher-value industries.
Realizing the full potential of this demographic advantage, however, will require sustained investment in education, vocational training, and job creation in ASEAN-5 economies. It will also depend on stronger bilateral labor mobility frameworks with East Asia’s aging high-income economies to ensure young workers from ASEAN-5 can be effectively integrated into regional labor markets.
ASEAN-5
Main challenges
ASEAN-5 enters the next decade facing a far more complex development landscape in which geoeconomic fragmentation, technological disruption, and climate pressures are increasingly intertwined. Managing these overlapping priorities will require not only sustaining growth but also strengthening resilience, protecting social cohesion, and building more coordinated regional strategies for long-term economic, social, political, and environmental stability.
Geoeconomic tensions, trade volatility, and chokepoints
ASEAN-5 is no longer operating in a conventional globalization environment. The region increasingly sits at the center of a new geoeconomic contest in which trade, technology, energy, and security have become deeply intertwined. While ASEAN-5 has benefited from supply chain diversification and “China Plus One” strategies, its growing importance also exposes it to vulnerabilities that stem directly from US–China geoeconomic rivalry. China is the bloc’s largest trading partner and a major source of infrastructure and industrial FDI, while the United States remains critical for exports, finance, and advanced technology.
ASEAN-5 has become one of the largest beneficiaries of production relocation from China, particularly in electronics, semiconductors, textiles, and EV supply chains. Yet this opportunity is accompanied by significant risk. Many ASEAN exports ultimately depend on demand, technology, or intermediate inputs originating from either the United States or China. As a result, trade restrictions, export controls, sanctions, or tariff escalation between the two powers can quickly reverberate through ASEAN manufacturing networks. The region is therefore not simply benefiting from fragmentation; it is increasingly becoming one of its principal transmission channels.
Hence, ASEAN-5 governments are trying hard to balance economic ties with both powers while avoiding strategic overdependence. Vietnam and Thailand, for example, benefit from supply chain diversification away from China, yet remain vulnerable to US tariffs and export controls. Vietnam remains especially exposed on this front due to its large trade surplus with the United States, particularly in electronics and textiles. Indonesia’s nickel industry (which is central to high-storage batteries and EVs) has attracted significant Chinese investment, raising concerns with the United States, while Malaysia’s semiconductor sector is increasingly shaped by US–China technology competition. Recent tariff measures have underscored these vulnerabilities, with ASEAN-5 economies facing US tariffs ranging from 10 percent to 48 percent, including pro-
Source: “World Development Indicators.”
Figure 19: Population aged 65 and above (percentage of total population)
Source: Global Trade Alert.
posed rates as high as 46 percent on Vietnamese exports and 36 percent on Thai exports
Harmful trade restrictions targeting ASEAN-5 are not limited to the United States, although it remains by far the largest source of such measures. As shown in Figure 20, several other major trading partners of ASEAN-5 have also introduced trade-distorting policies affecting the bloc. This underscores that rising protectionism is becoming a broader global trend rather than a challenge tied to a single country. The growing use of tariffs, subsidies, export controls, and local content requirements creates increasing uncertainty for ASEAN-5 economies that have historically relied heavily on open trade, global supply chains, and export-oriented growth.
This fragmentation is also forcing ASEAN-5 to reshape its industrial strategy. Firms are increasingly re-routing production through Southeast Asia under “China Plus One” diversification, particularly in electronics, EV components, and textiles, with Vietnam and Malaysia emerging as key beneficiaries of semiconductor and manufacturing shifts. However, this rerouting also exposes the region to stricter rules of origin, export controls, and competing regulatory regimes from both Washington and Beijing. According to the IMF and Organisation for Economic Co-operation and Development (OECD), this
is accelerating a pattern of “selective decoupling,” in which trade remains high but becomes more politically conditional and fragmented across value chains. In response, ASEAN-5 governments are increasingly pursuing hedging strategies, diversifying export markets, strengthening intra-ASEAN integration, and tightening industrial policy coordination to preserve growth while navigating intensifying geopolitical constraints.
Another geopolitical vulnerability facing the ASEAN-5 economies concerns strategic maritime chokepoints, particularly the Strait of Malacca. Stretching between Indonesia, Malaysia, and Singapore, the strait is one of the most important shipping lanes in the world and serves as the primary gateway connecting the Indian Ocean to East Asia. An estimated one-quarter to one-third of global trade, 30 percent of global maritime oil flows, 20 percent of global LNG flows, and nearly one-quarter of global dry bulk cargo (such as coal, iron ore, and grain) pass through this narrow corridor each year. For ASEAN-5, the strait is not merely a transit route; it is an irreplaceable backbone of the region’s economy and a critical source of its geopolitical relevance.
The economic implications of any disruption would be significant for ASEAN-5 economies. A prolonged closure or restriction of traffic through the Strait of Malacca—whether caused by
Figure 20: Harmful trade interventions against ASEAN-5
military conflict, piracy, cyberattacks on port infrastructure, accidents, or broader geopolitical tensions—would immediately increase shipping costs, lengthen delivery times, and disrupt regional trade, energy flows, and supply chains. Industries that rely heavily on just-in-time manufacturing—including electronics, semiconductors, automotive components, and consumer goods—would be particularly vulnerable. Given ASEAN-5 trade’s total dependence on this strait and deep integration into global value chains, even temporary disruptions could generate substantial economic losses, leading to social instability and weakening of investor confidence.
In particular, the strait’s importance is magnified by the region’s dependence on imported energy. Much of the crude oil and LNG consumed across East and Southeast Asia originates in the Persian Gulf and passes through both the Strait of Hormuz and the Strait of Malacca. Consequently, conflict in and trade restrictions through either of these two straits can quickly translate into higher energy costs and inflationary pressures across ASEAN-5. Recent conflicts in the Persian Gulf and disruptions to international shipping have highlighted how events occurring thousands of kilometers away can rapidly affect economic conditions in Southeast Asia.
This vulnerability is not merely theoretical. China, Japan, and South Korea have long viewed the Strait of Malacca as a strategic concern because of their dependence on energy imports. This is widely known as the “Malacca Dilemma,” a term coined in 2023 by Hu Jintao, former president of China. ASEAN-5 economies face a similar, though less frequently discussed, challenge. Their growing industrial bases, expanding digital infrastructure, and rising middle classes will require increasing volumes of imported energy and raw materials, making maritime security in the Strait of Malacca an even more important determinant of their future growth and stability.
The political economy implications are equally important. Rising fuel prices, higher transportation costs, and supply shortages tend to affect lower- and middle-income households disproportionately, increasing public dissatisfaction and placing pressure on governments to intervene through subsidies, price controls, or fiscal support measures. As a result, maritime security is no longer solely a defense issue; it has become a core economic and social policy concern. In this context, ASEAN-5’s future prosperity and social stability will depend not only on its ability to attract investment, strike a delicate balance amid US–China geoeconomic rivalry, and integrate more deeply into global supply chains, but also on its capacity to manage the growing geopolitical risks associated with the trade routes that support its economic lifeline.
Technological disruption and workforce impact
While, as mentioned above, investments related to AI and data centers present a massive opportunity for ASEAN-5 economies, they can also lead to serious challenges, especially for labor markets. AI is now ranked as the fourth most significant risk in the region (compared to tenth globally), largely driven by concerns about labor displacement and uneven adaptation across economies. Estimates suggest that up to 142 million workers in ASEAN-5 could be affected by AI-driven automation, with younger workers and women facing disproportionate exposure. This shift is compounded by a widening digital divide: while 46 percent of large firms in the region are already scaling AI solutions, only about 15 percent of small and medium enterprises (SMEs) have done so, limiting inclusive productivity gains and deepening existing high levels of inequality in ASEAN-5.
The disruption is also unlikely to be uniform, as ASEAN-5 economies are entering the AI transition with different levels of digital readiness and labor market flexibility. The World Bank and IMF both emphasize that countries with larger shares of routine services employment, particularly in BPO and basic manufacturing, face higher short-term displacement risks, even as they stand to gain from productivity growth over time. In the Philippines, for example, AI adoption in the BPO sector could significantly reshape entry-level employment pathways, while in Vietnam and Indonesia, automation pressures are concentrated in manufacturing-linked services and export processing zones. Without coordinated investment in reskilling, expanding digital infrastructure, and SME adoption of AI tools, these gaps risk translating technological divergence into deeper income inequality across the region rather than shared productivity gains.
Moreover, stakeholders increasingly warn that this transition could introduce new environmental pressures. The rapid expansion of digital infrastructure is highly energy intensive, with data center electricity demand projected to rise nearly eightfold by 2030. Without cleaner energy systems, emissions from data centers could increase sharply, including a rise of up to fourteen times in the Philippines, seven times in Malaysia, and four times in Indonesia, underscoring the intertwined challenges of digitalization, inequality, and sustainability. Hence, in early 2025, Malaysian authorities reportedly rejected nearly 30 percent of proposed data center projects due to inadequate commitment to responsible energy use and sustainability standards.
ASEAN-5 in an era of geoeconomic realignment
Emissions and climate
ASEAN-5’s GHG emissions have grown faster than the global average, increasing the bloc’s share of global emissions from 3.5 percent in 2001 to 5.5 percent in 2024. As shown in Figure 21, ASEAN-5’s total GHG emissions have risen steadily over the past twenty-five years, reaching nearly 3 GT in 2024. This trend largely reflects the region’s rapid economic expansion and population growth. Although ASEAN-5’s per capita emissions remain well below the global average, they have increased far more rapidly—particularly since 2017. Between 2001 and 2024, per capita emissions in ASEAN-5 rose by 75 percent, compared with just 13 percent globally (Figure 22).
At the same time, Figure 23 shows that ASEAN-5 has achieved a relative (but not absolute) decoupling of emissions from economic growth, resulting in a gradual decline in energy intensity. In 2024, the bloc emitted 21 percent less GHG per unit of GDP than it did in 2001, broadly in line with the global decline of 25 percent over the same period. While this long-term improvement is encouraging, the recent uptick in energy intensity from its 2017 lows—combined with the sharp rise in per capita emissions—suggests that growing demand for reliable and affordable energy (due partly to the adoption of AI and expansion of data centers), alongside heightened concerns over energy security, has increased ASEAN-5’s reliance on domestic and imported fossil fuels even as the region continues to expand renewable energy capacity
While ASEAN-5 per capita GHG emissions are 25 percent lower than the global average, air pollution imposes a staggering economic and human cost across ASEAN-5, causing an estimated $500 billion in annual welfare losses, illness, and premature deaths. Across ASEAN-5’s largest urban centers (such as Jakarta and Bangkok), exposure to fine particulate matter (PM2.5) is estimated to reduce GDP by 4 to 11 percent through rising healthcare costs, lower labor productivity, and avoidable illness and mortality. Indonesia faces the largest absolute losses, with air pollution-related health damages estimated at more than $220 billion annually, and the cost of inaction on PM2.5 projected to exceed $27 billion per year by 2030. Thailand alone could face annual losses of $13 billion by 2030 from pollution-related health impacts, even though implementing major clean-air measures would cost only a fraction of that amount. Meanwhile, Malaysia and the Philippines continue to bear substantial economic losses from pollution and transboundary haze through rising healthcare costs, lost working days, and worsening respiratory illnesses.
With their dense populations and extensive coastlines, ASEAN countries are especially vulnerable to the impacts of climate change, including rising sea levels, extreme weather events, and accelerating biodiversity loss. Since 2012, storms and tsunamis have accounted for roughly 10 percent of ASEAN-5’s natural disasters and nearly 15 percent of related economic losses. The 2004 tsunami remains the region’s deadliest climate-related disaster, leaving an estimated 350,000
Source: “World Development Indicators”; author’s calculations.
Figure 21: Total GHG emissions excluding LULUCF (Mt CO2e)
22: Total GHG emissions excluding LULUCF per capita (tons of CO2e per capita)
Source: “World Development Indicators”; author’s calculations.
Source: “World Development Indicators”; author’s calculations.
Figure
Figure 23: Tons of GHG emissions per $1,000 GDP
ASEAN-5 in an era of geoeconomic realignment
dead or missing. Philippines, Thailand, and Vietnam rank among the ten most climate-vulnerable countries, suffering some of the highest human and economic losses from extreme weather over the past two decades. Hence, as reflected in a recent survey, 71.1 percent of Filipinos, 67.4 percent of Indonesians, and 62.5 percent of Vietnamese view climate change and its ramifications as one of their top three concerns, reflecting growing awareness of the severe economic and social costs associated with flooding, coastal erosion, and rising sea levels. The Asian Development Bank has warned that without stronger action, climate change could reduce Southeast Asia’s GDP by as much as 11 percent by the end of the century. Growing climate pressures demand stronger intra-ASEAN-5 preparedness, regional cooperation, and integration of climate into economic and healthcare policymaking.
Policy recommendations
The political economy landscape across ASEAN-5 is being reshaped by regional and global dynamics. Governments are under increasing pressure to deliver stronger and more inclusive economic outcomes, including quality employment opportunities, affordable housing, energy security, and climate resilience, while simultaneously preserving competitiveness within rapidly evolving global value chains. These demands are particularly pronounced among the bloc’s increasingly dissatisfied younger population, whose rising educational attainment has elevated expectations for economic opportunity, social mobility, and public service delivery. Across ASEAN-5, improvements in wages, job quality, and upward mobility have not kept pace with these expectations. As a result, concerns over governance, inequality, environmental sustainability, and the labor market implications of technological change and automation are becoming leading drivers of public, especially youth, dissatisfaction. At the same time, urbanization and climate-related vulnerabilities are placing additional pressure on governments to strengthen social protection systems and invest in resilient infrastructure.
On the supply side, businesses are calling for accelerated infrastructure development, more predictable regulatory frameworks, and greater policy certainty to support long-term investment decisions. These concerns have become more urgent as geopolitical tensions, trade fragmentation, and supply chain realignments reshape the global economic landscape. The ability of ASEAN-5 economies to attract investment, move up the value chain, and capitalize on emerging opportunities from global supply chain realignment and diversification efforts will depend on the quality of institutions, policy coherence, adequate infrastructure, and the pace of structural reforms.
Against this backdrop, the challenge for policymakers is to sustain economic growth while also ensuring that growth is inclusive, resilient, and politically sustainable. The following high-priority policy recommendations are proposed in the context of these evolving political economy dynamics, marked by the significant opportunities and growing risks highlighted above.
Building a regional clean energy and digital infrastructure compact
ASEAN-5 economies should align the expansion of digital infrastructure with large-scale investment in clean energy systems. The bloc is rapidly emerging as a global hub for AI, cloud computing, and data centers, but rising electricity demand risks overwhelming power grids, increasing emissions, and deepening reliance on imported fossil fuels if energy systems do not evolve. A coordinated regional strategy focused on renewable energy deployment, cross-border power connectivity, battery storage, and green data center standards would help ASEAN-5 capture the economic benefits of the digital transition while strengthening energy security and climate resilience. With the bloc’s digital economy expected to approach $1.4 trillion by 2030, ASEAN-5’s competitiveness will increasingly depend on its ability to deliver reliable, affordable, and low-carbon infrastructure. Moreover, as concerns over energy security continue to grow, reducing dependence on imported fossil fuels through accelerated investment in renewable energy and cross-border grid connectivity is no longer only a climate priority; it is a strategic economic and national security imperative for ASEAN-5.
Investing in human capital and workforce adaptation
ASEAN-5’s demographic strength can become a lasting economic advantage only if governments invest aggressively in education, workforce training, and digital capabilities. The bloc sits beside rapidly aging East Asian economies facing mounting labor shortages, creating a major opportunity for ASEAN-5 to emerge as a leading manufacturing, services, and technology talent hub. Yet the rise of AI and automation also threatens to disrupt labor-intensive sectors that have historically driven growth and employment. To remain competitive, governments should expand STEM (science, technology, engineering, and math) education, technical and vocational training, AI literacy, and industry-linked apprenticeship programs while improving labor adaptability and mobility across the region. In the next phase of global competition, productivity and technological adaptability will matter as much as labor costs. ASEAN-5’s young populations, particularly in Indonesia and the Philippines, could become one of the region’s greatest sources of resilience if matched with sustained forward-looking investments in human capital and innovation.
ASEAN-5
Source:
Deepening
regional integration and diversifying supply chains
ASEAN-5 should deepen regional integration by harmonizing regulations, strengthening logistics and infrastructure connectivity, and reducing non-tariff barriers across the bloc. As multinational firms diversify production networks through “China Plus One” strategies, ASEAN-5 has emerged as one of the world’s most attractive alternative destinations for manufacturing, trade, and investment. However, fully capturing this opportunity will require the region to function more as an integrated economic platform rather than a fragmented group of national markets.
A key priority should be increasing intra-ASEAN-5 trade and supply chain integration. As shown in Figure 24, intra-ASEAN-5 trade peaked at 23 percent of its total trade during 20082012 period before declining gradually to 19 percent in 2024. Reversing this trend is critical for strengthening the region’s economic resilience, reducing vulnerability to external trade disruptions, and building more secure regional supply chains in an increasingly fragmented global economy.
To this end, stronger coordination on customs procedures, digital trade rules, semiconductor supply chains, and investment standards would also improve resilience against geopolitical tensions and global trade fragmentation. Deeper regional
integration would also help local firms scale more efficiently, attract higher-quality investment, and reduce exposure to external economic shocks. ASEAN-5’s long-term advantage increasingly lies in its ability to offer diversified, interconnected, and politically balanced production ecosystems.
Strengthening climate resilience and nature-based growth strategies
Climate change is no longer only an environmental concern for ASEAN-5; it is a growing economic and security challenge affecting infrastructure, agriculture, coastal cities, food systems, and labor productivity. Governments should therefore integrate climate resilience directly into education and economic and industrial planning. ASEAN-5 possesses some of the world’s most valuable natural capital, including tropical forests, mangroves, and biodiversity, creating major opportunities in nature-based VCMs, sustainable tourism, and climate finance if they are managed credibly and transparently. At the same time, investments in resilient infrastructure, flood management, water systems, and sustainable urban development will become increasingly essential as climate-related disasters and their economic costs intensify. By embedding resilience into development strategies, ASEAN-5 can reduce long-term vulnerability while creating new engines of green growth, investment, and employment.
“ITC Trade Map.”
Figure 24: Intra-ASEAN-5 trade (percentage of total ASEAN-5 trade)
ASEAN-5
Reinforcing institutions, cybersecurity, and strategic autonomy
ASEAN-5’s long-term resilience will depend heavily on stronger institutions and effective governance. As the bloc becomes more digitally connected and geoeconomically significant, governments must improve cybersecurity frameworks, data governance, financial regulation, and public-sector capacity. AI adoption, digital finance, and cross-border data flows offer enormous economic opportunities, but they also expose economies to cyber threats, misinformation, and systemic vulnerabilities. Closer intra-ASEAN-5 cooperation on cyber defense and digital governance standards will therefore become increasingly important. At the same time, ASEAN-5 should preserve its strategic autonomy amid intensifying competition between major powers. Maintaining diversified economic and diplomatic relationships will help the bloc retain policy flexibility, sustain investor confidence, and avoid excessive dependence on any single partner or region. ASEAN-5’s enduring strength has long rested on pragmatic balancing and regional cohesion, and that approach will remain critical amid increasingly fragmented global geoeconomics.
Conclusion
The ASEAN-5 economies stand at a critical juncture, positioned as an indispensable part of global growth within an increasingly fragmented and uncertain geoeconomic landscape. Accounting for more than 84 percent of ASEAN’s GDP, these five EMDEs (Indonesia, Malaysia, the Philippines, Thailand, and Vietnam) have demonstrated remarkable resilience, consistently outpacing global growth averages through deep integration into East Asia and global high-tech manufacturing, electronics, and supply chains. However, as the global economy grapples with structural slowdowns, rising debt, and geoeconomic fragmentation, the region’s continued success is not guaranteed and requires forward-looking adaptive policies.
To secure long-term prosperity, ASEAN-5 must navigate three transformative shifts.
y Digital and technological evolution: The region is rapidly becoming a hub for AI and data centers, with its digital economy projected to reach $1.4 trillion by 2030. To prevent a widening digital divide and mitigate the risk of labor displacement for up to 142 million workers, governments must aggressively prioritize workforce skilling and reskilling.
y The green transition: With some of the world’s most significant potential in geothermal, renewable energy, and nature-based solutions, ASEAN-5 has a unique opportunity to lead the global energy transition and the growth of VCMs. Decoupling economic growth from emissions is essential, especially as climate change and ambient air pollution pose serious threats, could reduce the bloc’s GDP by 11 percent by the end of the century, and negatively impact the health and well-being of tens of millions in these economies annually.
y Strategic autonomy in a fragmented world: As barriers to global trade grow, ASEAN-5 must maintain its pragmatic hedging strategies to avoid overdependence on any single economy or region. Strengthening intra-ASEAN integration and operating as a unified economic platform will be vital to remaining an attractive and stable bloc for investment and trade.
In conclusion, ASEAN-5’s greatest strengths—its young and dynamic population, central role in the global value chain, and renewable energy potential—provide a robust foundation for the future. By aligning digital infrastructure with clean energy, investing heavily in human capital, and reinforcing regional cohesion, ASEAN-5 can reduce the impact of current global headwinds on member economies and ensure a sustainable and inclusive era of growth in the decades ahead. The path forward requires a shift from being a collection of national markets to becoming a unified, resilient, and technologically advanced global powerhouse with high levels of coordination and cooperation on regulatory, energy, trade, and human development fronts.
ASEAN-5 in an era of geoeconomic realignment
About the authors
Amin Mohseni-Cheraghlou is a senior consultant with the Atlantic Council’s GeoEconomics Center, a senior lecturer in economics at American University, and a faculty affiliate at Columbia University. He is a development macroeconomist, educator, and policy advisor specializing in geoeconomics, global energy markets, and international trade and finance, with a particular focus on China and the Middle East and North Africa (MENA). Previously, he served as Senior Advisor to the Executive Director at the International Monetary Fund (IMF) and spent more than a decade as a Research Economist at the World Bank.
About the center
The GeoEconomics Center develops data-driven programs and thought leadership at the nexus of economics, finance, and foreign policy. The center aims to bridge the divide between these oft-siloed sectors, with the goal of helping shape a more resilient global economy. The United States must lead with allies or risk becoming a bystander in a reshaped international financial system. The center is organized around three pillars: The Future of Capitalism and Trade, The Future of Money, and The Economic Statecraft Initiative.