From Copper, Cattle and Cotton to Chips and Cloud Computing: Large Water Uses in Central Arizona
“AI will open up new ways of doing things that we cannot even imagine today.”
Sundar Pichai, CEO of Google
“America is the country that started the AI race. And as President of the United States, I'm here today to declare that America is going to win it.”
President Donald J. Trump, July 23, 2025
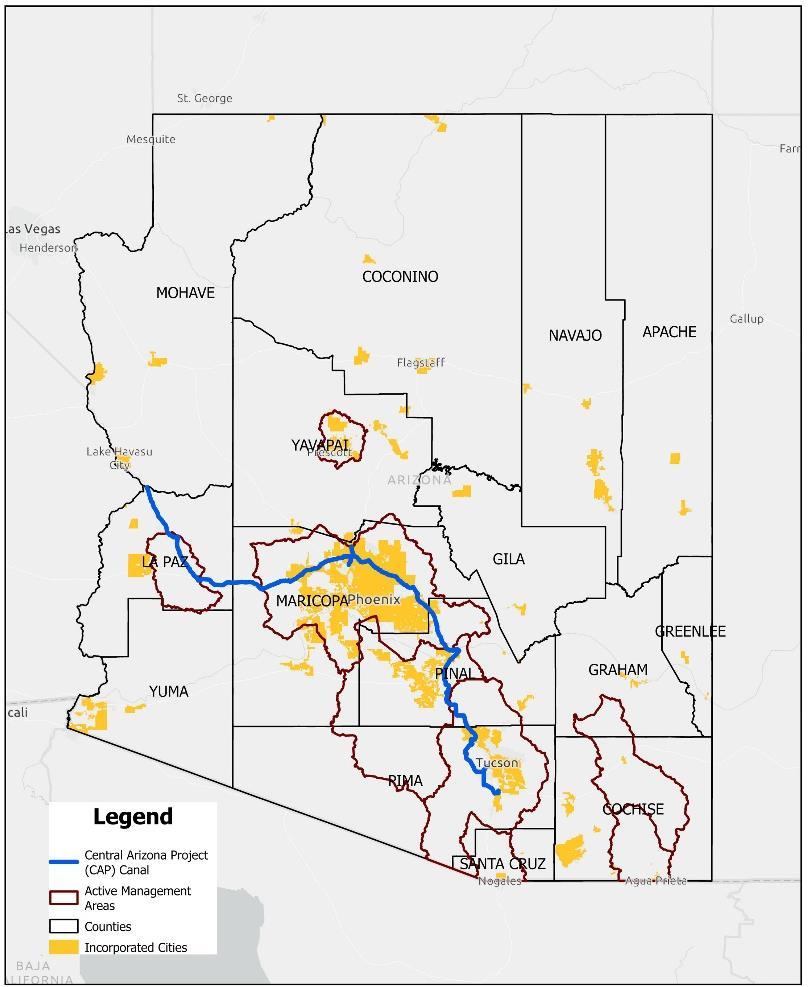
Study Area
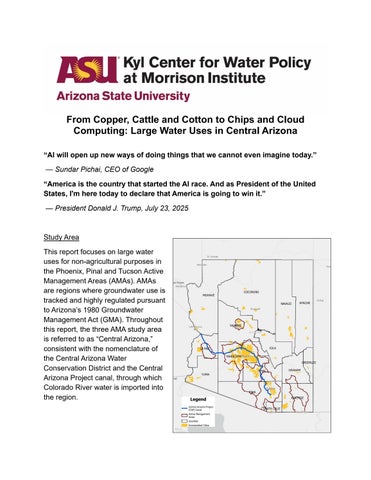
This report focuses on large water uses for non-agricultural purposes in the Phoenix, Pinal and Tucson Active Management Areas (AMAs). AMAs are regions where groundwater use is tracked and highly regulated pursuant to Arizona’s 1980 Groundwater Management Act (GMA) Throughout this report, the three AMA study area is referred to as “Central Arizona,” consistent with the nomenclature of the Central Arizona Water Conservation District and the Central Arizona Project canal, through which Colorado River water is imported into the region.
Introduction
A half-century ago, Arizona school children were taught that the pillars of Arizona’s economy and growth were the Three Cs: copper, cattle and cotton. Over time, the state’s economy has diversified, especially in Central Arizona, where around 85% of the state’s population resides and where the municipal population has doubled since 1980. Mining copper, growing alfalfa to feed cattle and growing cotton are arguably waterintensive activities. Yet the development of at least two new “Cs” chips, as in semiconductor chips, and cloud, as in servers, databases and software that are accessed via the internet, have created consternation over water use by these newer and rapidly growing economic sectors
To address these concerns and help inform community decision-making, this report explores the impacts of water demand from these new Cs and other industrial users and contextualizes that demand with respect to other large water uses that have long been woven into the pattern of urban water use. People within Arizona and beyond rely on the products, services and jobs provided by large water users. In Central Arizona, large water users include food processors, miners of sand and gravel to make concrete, beverage facilities such as bottling companies and breweries, turf facilities such as public parks, schools, sports complexes and golf courses, microchip manufacturers, power utilities and data centers, among others.
Here we explore large water uses in Central Arizona with a special focus on data centers. In Part 1 we look at the big picture of water uses and sources. In Part 2 we discuss water sources for urban uses. In Part 3 we examine large water uses within a municipal tap water system. In Part 4 we discuss considerations related to water use by data centers and in Part 5 we look at future trends
This report relies on two primary data sources: the Arizona Department of Water Resources (ADWR) AMA demand and supply data, which quantifies annual demand for various use categories and sub-categories from 1985-2024, and the Kyl Center’s 2022 Community Water Use study (CWU), an analysis of all physical sources and uses of water within community water systems in Central Arizona. In the data analysis for this report, we changed the categorization of ADWR AMA demand and supply data for cattle feedlots and dairy from industrial to agricultural, data for golf courses, parks, schools, cemeteries and HOAs from industrial to landscape & turf, and data for subdivision irrigation from municipal to landscape & turf. ADWR sector data related to lost & unaccounted for water was excluded. The 2022 CWU was carefully crafted from ADWR’s database of groundwater pumping, the annual reports submitted by water users to ADWR, aerial maps, municipal water provider consumer confidence reports, direct communication with municipal water providers and other sources. This analysis is limited to water use across sectors for non-tribal uses. Most Tribal water use in Central
Arizona is for agricultural purposes; however, Tribes, which are sovereign, do not report water use to the state.
Background
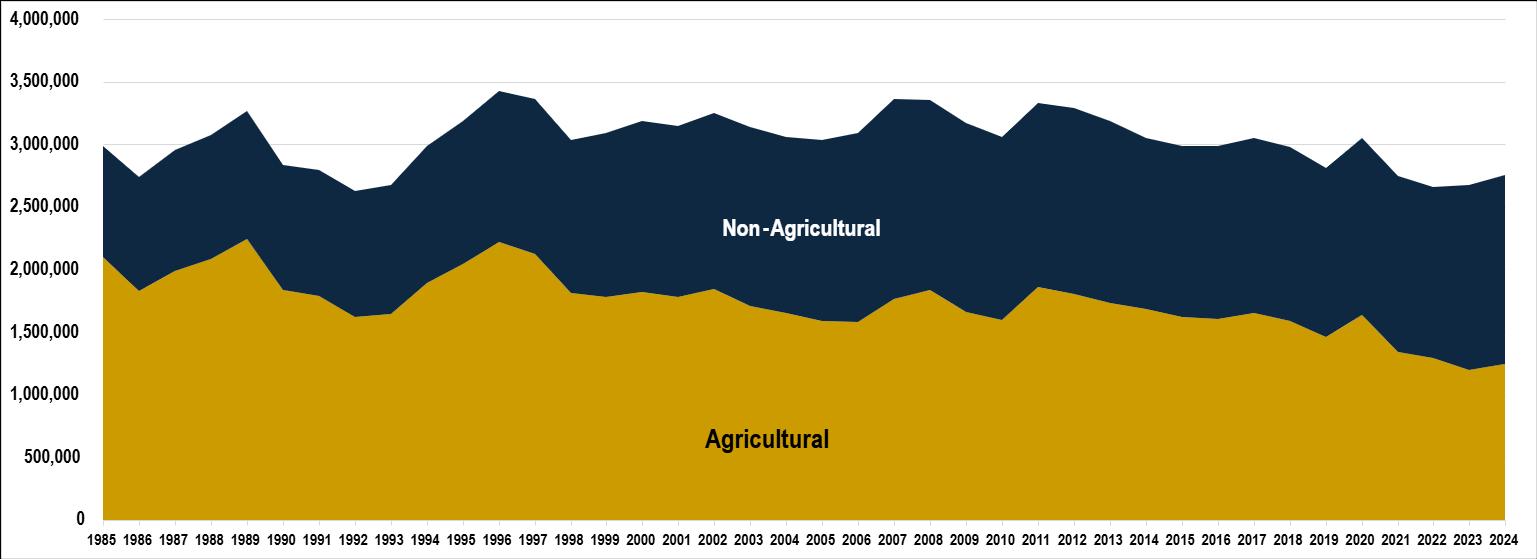
Central Arizona has urbanized over the last several decades, and its economy has changed accordingly. Because much urban growth occurred on previously farmed lands and urban water uses are generally lower per-acre than agricultural ones, total nontribal water use within Central Arizona has declined by around 9% over the last four decades as agriculture’s contribution to the regional economy has diminished and other industries have emerged and grown 1
Table 1: Declines in Non-Tribal Water Use Since 1985
Figure 1: Agricultural and Non-agricultural Water Use in Central Arizona 1985-2024
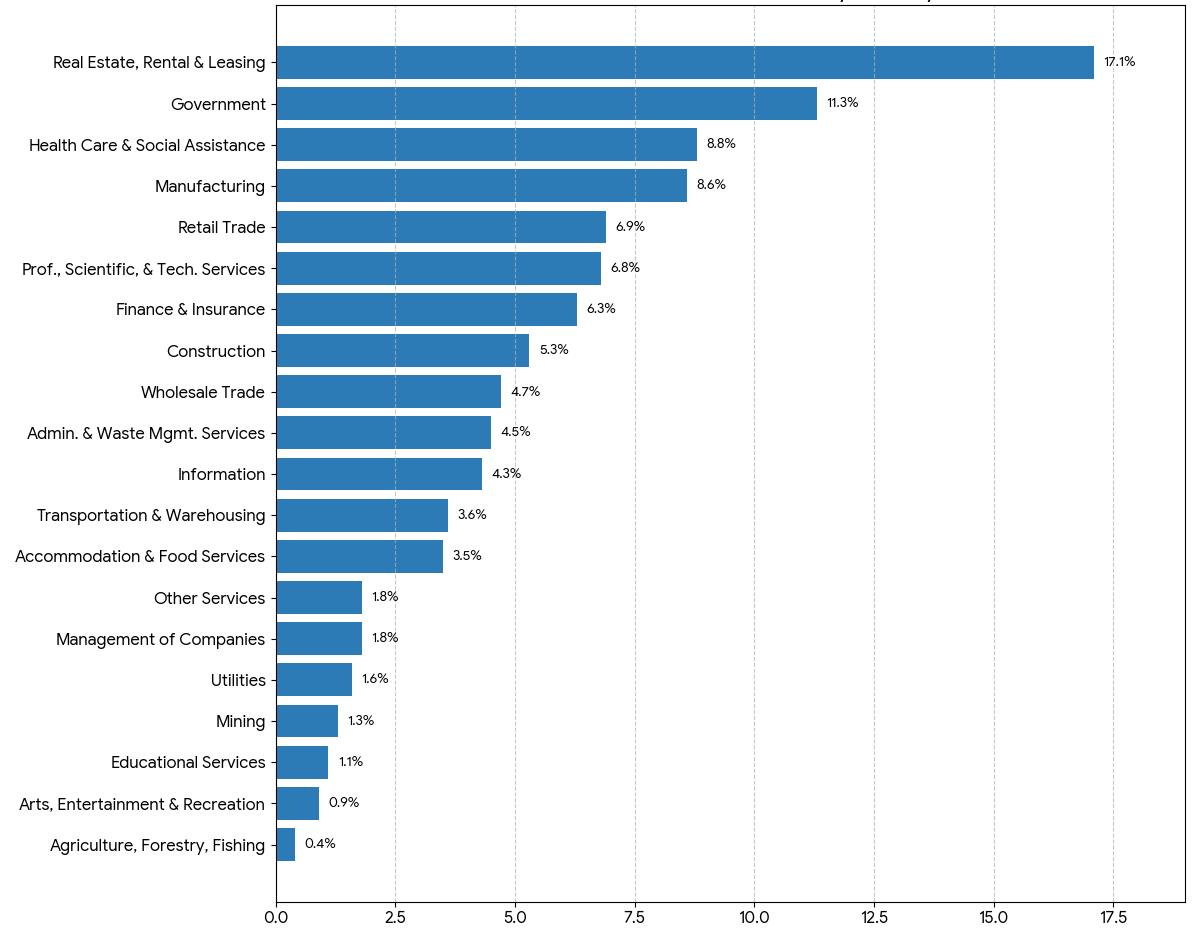
Today, agriculture represents less than 1% of the state’s gross domestic product; mining, less than 2%. Instead, real estate, government and health care and social assistance lead the pack. As of 2023, manufacturing came in at number four. We can expect manufacturing to contribute even more to the regional economy as the Taiwan Semiconductor Manufacturing Company facility in north Phoenix continues to expand in conjunction with its many suppliers. This facility, alongside the expansion of Intel in Chandler and the emergence of data centers across Central Arizona, is driving a shift to a high-tech economy.
1 Ariz. Dept. of Water Resources, AMA Data (AMA Annual Supply and Demand Dashboard), https://www.azwater.gov/ama/ama-data (hereafter ADWR, AMA Data).
Large Non-Agricultural Water Uses in Central Arizona Kyl Center for Water Policy – page 3 February 2026
Large Non-Agricultural Water Uses in Central Arizona Kyl Center for Water Policy – page 4
Table 2: Ratio of Non-Farm to Farm Jobs2
Maricopa County 150:1 395:1 Pinal County 5:1 19:1 Pima County 80:1 100:1
Table 3: Arizona’s 2023 Gross Domestic Product by Industry3
2 U.S. Bureau of Economic Analysis (BEA) Table CAEMP25N; Arizona Office of Economic Opportunity (2023-2024 data); MAP Dashboard (University of Arizona); University of Arizona Cooperative Extension & Arizona Farm Bureau (historical data).
3 Steven L. Byers and Glenn Farley, Arizona’s 2023 Economic Performance Index, Common Sense Inst., February 2024, https://www.commonsenseinstituteus.org/arizona/research/jobs-and-oureconomy/arizonas-2023-economic-performance-index
February 2026
Large Non-Agricultural Water Uses in Central Arizona
Kyl Center for Water Policy – page 5
With this shift have come concerns about water uses – concerns that may be intensified by current challenges to the region’s water supplies. The flows of one important water supply, the Colorado River, are in decline4 and in the Phoenix and Pinal AMAs, the state has restricted some forms of groundwater reliant growth.5 It is more important than ever for local elected officials and other stakeholders to determine whether a proposed economic enterprise high-tech or otherwise is worth the water.
Part I. Water Use and Water Supply – the Big Picture
Relative Water Uses by Sector
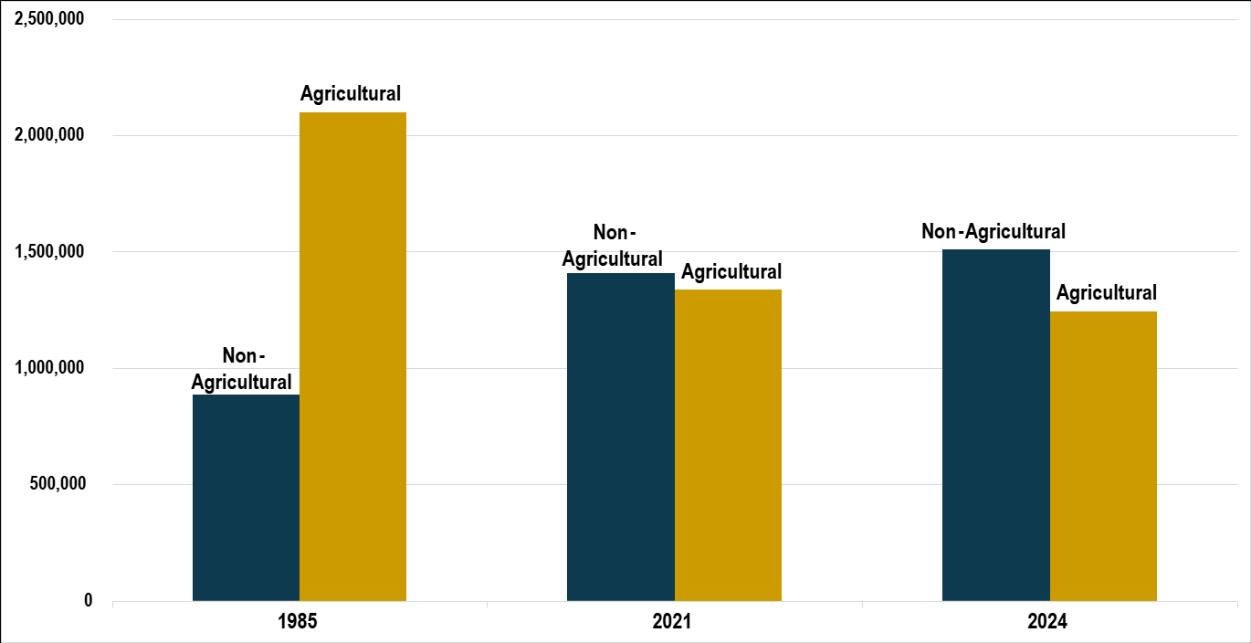
While non-agricultural demand has gradually increased, in Central Arizona agriculture continues to use more water than any other sector.
Agricultural Water Use
Given the region’s long growing season and arid climate, agricultural users can easily use 6 acre-feet per acre per year or more depending on cropping patterns.6 In contrast, annual water use per acre in urban areas in Central Arizona ranges from around 0.2 acre-feet per acre to 2.6 acre-feet per acre per year and averages about one acre-foot per acre per year 7
Water use for all non-agricultural sectors combined did not match agricultural uses until 2021. In 2024, agriculture used approximately 1.24 million acre-feet out of 2.75 million acre-feet in total.8
4 Jack Schmidt et al., The Colorado River water crisis: Its origin and the future, WIREs Water,2023, https://doi.org/10.1002/wat2.1672
5 Kyl Center for Water Policy, New Phoenix AMA Model Shows Limits of Groundwater as an Assured Water Supply, ASU Morrison Inst. for Public Policy, June 2023, https://morrisoninstitute.asu.edu/publication/new-phoenix-ama-model-shows-limits-groundwater-assuredwater-supply
6 See Arizona Department of Water Resources, Phoenix Active Management Area 5th Management Plan § 4.2.1.2 (calculation of irrigation water duties).
7 Kyl Center for Water Policy, Water and Land Use in Central Arizona, Arizona Water Blueprint, ASU Morrison Inst. for Public Policy, October 8, 2025, https://storymaps.arcgis.com/stories/eb51183c1305428187c699d004cbf77b
8 ADWR, AMA Data
February 2026
Large Non-Agricultural Water Uses in Central Arizona Kyl Center for Water Policy – page 6
Municipal Water Uses
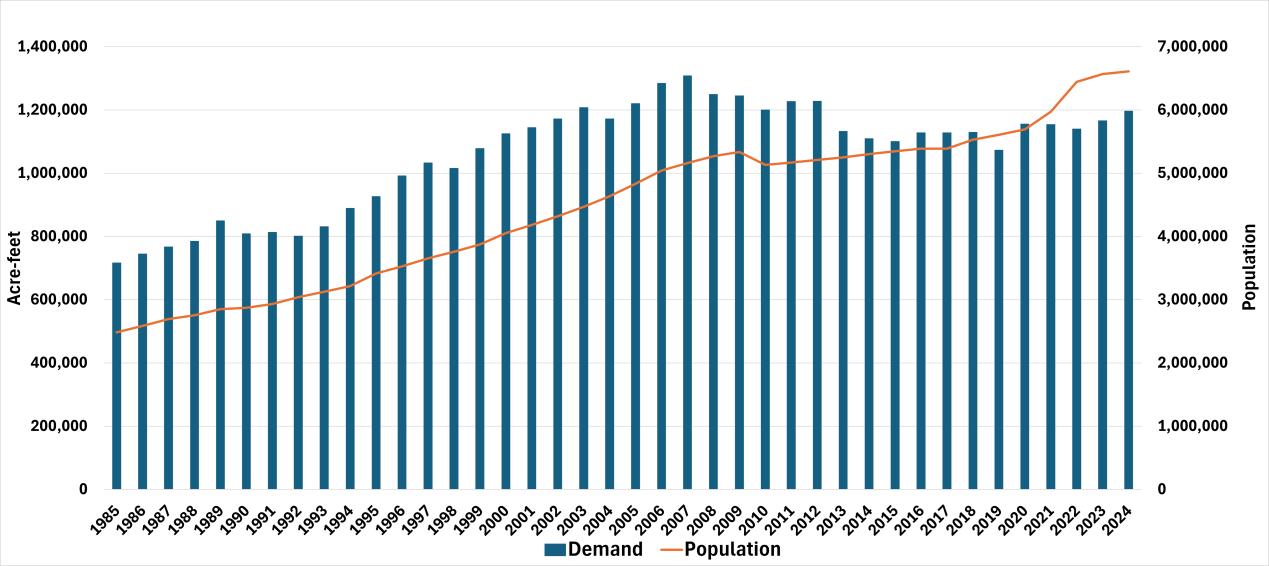
Municipal water use in Central Arizona is roughly the same as it was twenty years ago, even though population has increased by around 2 million since that time.10 There are many reasons why demand has held steady: a transition away from grass and waterintensive landscaping to desert landscaping, increases in water efficiency in many household appliances, the adoption of water efficient plumbing fixtures and increasing tap water costs – to name a few.
9 Id.
10 US Census, www.census.gov
11 ADWR, AMA Data
Water Sources by Sector
The source of water used to fulfill a particular need is as important as the total demand for that need. Water sources in Central Arizona include:
• local surface water supplies from the Agua Fria, Gila, Salt, Santa Cruz and Verde Rivers,
• Colorado River water imported through the CAP canal,
• reclaimed wastewater (effluent) and
• groundwater
Surface water and effluent are regarded as renewable because their use to meet demand does not result in a permanent depletion of supply. In Central Arizona, surface water supplies are fully allocated and there are significant constraints on the transferability of these supplies from one user to another. Colorado River water imported through the CAP canal is a renewable water source, but the river is overallocated and its flows have been diminishing due to a prolonged drought and aridification of the Colorado River basin watershed.12 Effluent is also a renewable supply, and the entity (such as a city) that treats wastewater to produce it may put the water “to any reasonable use it sees fit.”13
Groundwater is different. In Central Arizona and other parts of the state, only about 3% of the precipitation that reaches the ground converts to groundwater;14 yet pumping technology enables the withdrawal of groundwater far faster than it can naturally be replenished. Accordingly, groundwater is regarded as nonrenewable, and managing groundwater as a finite source has been a defining water management challenge for Arizona since the mid-20th Century.15
Within Central Arizona, groundwater is highly regulated pursuant to the GMA and associated Assured Water Supply (AWS) rules, which generally promote the use of renewable water supplies and discourage the depletion of local groundwater.16 However, groundwater has long served as a significant water supply for agriculture, and its continued use for crop irrigation is grandfathered under the GMA. This use is
12 Bradley Udall & Jonathan Overpeck, The twenty-first century Colorado River hot drought and implications for the future, American Geophysical Union, February 17, 2017, https://agupubs.onlinelibrary.wiley.com/doi/full/10.1002/2016WR019638
13 Arizona Public Serv. v. Long, 160 Ariz. 429 (1989).
14 Karem Abdelmohsen et al., Declining Freshwater Availability in the Colorado River Basin Threatens Sustainability of its Critical Groundwater Supplies, AGU Geophysical Research Letters (May 27, 2025) https://doi.org/10.1029/2025GL115593
15 Kyl Center for Water Policy, Groundwater Protection in the Valley of the Sun, ASU Morrison Inst., March, 2024, https://morrisoninstitute.asu.edu/groundwater-protection-valley-sun
16For further information about the 1980 Groundwater Management Act and the Assured Water Supply rules, see Kathleen Ferris and Sarah Porter, The Myth of Safe Yield, Kyl Center for Water Policy at ASU Morrison Institute, May 2021, https://morrisoninstitute.asu.edu/sites/g/files/litvpz841/files/the_myth_of_safe-yield_0.pdf
Large Non-Agricultural Water Uses in Central Arizona Kyl Center for Water Policy – page 8
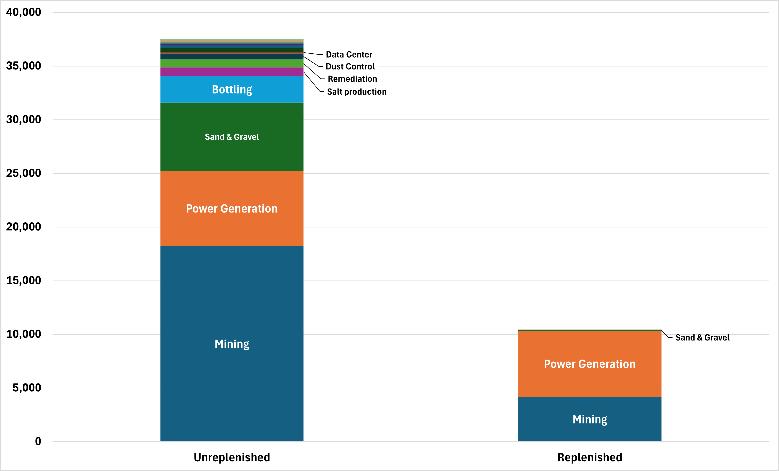
“unreplenished,” meaning that it results in aquifer depletion, and it is the largest source of unreplenished groundwater demand in the AMAs. According to a 2020 ADWR report, agriculture was responsible for 63% of unreplenished groundwater pumping in Central Arizona from 2012 to 2016,17 averaging around 892,000 acre-feet per year in the last decade.18
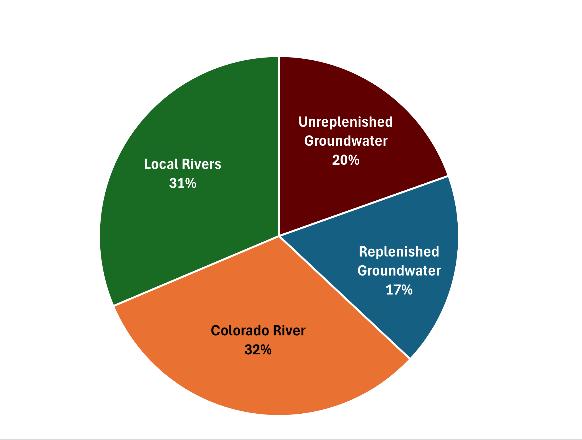
Largely due to AWS requirements, municipal tap water in Central Arizona is much less dependent on groundwater. In 2022, approximately 20% of municipal tap water supplies, around 215,000 acre-feet, derived from unreplenished groundwater pumping.19
Effluent is currently used exclusively for non-potable purposes, though a consortium of cities plans to treat it for potable purposes in the future. In 2022, about 75,000 acre-feet of effluent was delivered to the Palo Verde Nuclear Generating Station, nearly as much (70,000 acrefeet) was delivered to turf and landscape uses and another 70,000 acre-feet was delivered for agricultural uses Approximately 70,000 acre-feet of effluent is recharged annually into local aquifers to replenish groundwater pumping and to build a store of water that can be used in the future.20
Part II. Water Sources for Non-Agricultural Uses
Sources of water available for non-agricultural uses in Central Arizona include:
• surface water and Colorado River water delivered directly from a canal,
• reclaimed water delivered via a reclaimed water pipeline,
• water from wells operated independently from the municipal water provider, and
• tap water delivered from a municipal water provider
17 Arizona Department of Water Resources, Issue Brief: Unreplenished Groundwater Withdrawals, June 15, 2020, https://www.azwater.gov/sites/default/files/2022-08/ISSUE%2520BRIEF%2520%2520Unreplenished%2520-%2520Final.pdf.
18 ADWR, AMA Data
19 Kyl Center for Water Policy, 2022 Community Water Use Study, ASU Morrison Institute.
20 Id
February 2026
Large Non-Agricultural Water Uses in Central Arizona Kyl Center for Water Policy – page 9
Surface Water and Colorado River Water Delivered from a Canal
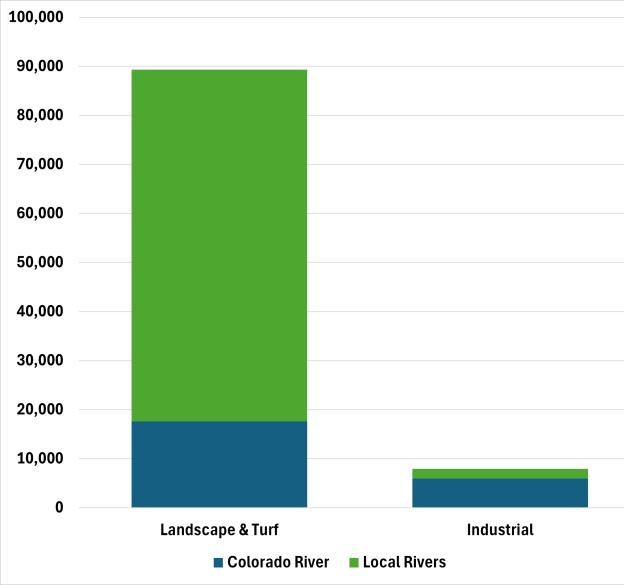
Most businesses and industries in Central Arizona lack direct physical and legal access to surface water or Colorado River water; only a relatively few power generators and mining companies have access to Colorado River water imported through the CAP canal or to surface water supplies.
However, many turf facilities – golf courses, sports complexes, parks, cemeteries, schools and other places that grow grass – have access to surface water and Colorado River water delivered from a canal. Many turf facilities and some homeowners in the Phoenix area have access to Salt and Verde River water delivered via canals operated by the Salt River Valley Water Users’Association, commonly known as the Salt River Project (SRP), and most of the surface water available for turf and landscape irrigation comes from this local supply In contrast, most of the surface water delivered for industrial purposes is Colorado River water. Nearly all of the Colorado River water delivered via the CAP canal for industrial purposes goes to mining.
Effluent
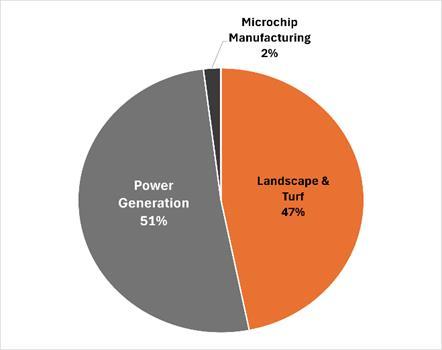
Effluent is also delivered to turf facilities in large quantities, and as noted previously a large amount of effluent is delivered for power generation. Most of the effluent delivered for power generation in Central Arizona goes to the Palo Verde Nuclear Generating Station but a small amount is also delivered to a natural gas generating station in Pinal County.
TSMC WATER RECYCLING
TSMC Arizona (Taiwan Semiconductor Manufacturing Company) in north Phoenix is a large industrial water user. While its first fabrication facility (fab) uses approximately 5,300 acre-feet of water per year,21 the operation currently recycles 65% of that water which is reused in facilities support systems. TSMC Arizona is now building an Industrial Reclamation Water Plant (expected to begin operations in 2028) that will increase the water recycling rate to 85% and eventually as high as 90%.22 This plant will allow the company to return water to an ultrapure state for reuse in its semiconductor wafer manufacturing process. Large industrial facilities are often capable of reusing water in ways others cannot.
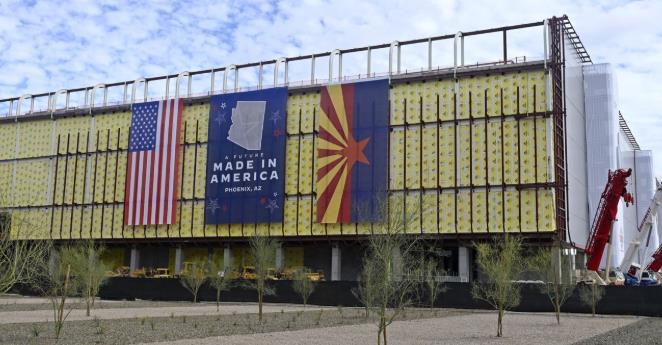
TSMC is expected to invest $165 billion23 in the regional economy a comparatively favorable return on the water.
Water from Wells Operated Independently from the Municipal Water Provider
Under the GMA some large urban water users, including mining companies, power generators, general industries and turf facilities, are allowed to pump groundwater from wells that are not owned or operated by a municipal water provider. Often, these users rely on rights to pump groundwater that are independent of the municipal water provider and have no replenishment requirement,
21 https://www.azcentral.com/story/money/business/tech/2024/11/04/phoenix-provides-water-to-a-newchipmaker-any-cause-for-worry/75917812007/
22 The company clarified in an email to AZ Central that this 90% goal applies to water remaining after evaporation occurs in the manufacturing process Accounting for evaporative losses, the total water reuse goal is 74% 'A thirsty operation': TSMC plant arrives amid water doubts, but Phoenix isn't worried https://www.azcentral.com/story/money/business/tech/2024/11/04/phoenix-provides-water-to-a-newchipmaker-any-cause-for-worry/75917812007/
23 TSMC, TSMC Intends to Expand Its Investment in the United States to US$165 Billion to Power the Future of AI, March 4, 2025, https://pr.tsmc.com/english/news/3210
meaning they deplete local groundwater stores. Golf courses and large turf facilities can own and operate wells independently from the local municipal water provider, but those developed after 1985 must replenish their groundwater use and are subject to strict conservation requirements.
Some enterprises avoid using tap water for financial reasons. Tap water delivered by a municipal water provider is typically more expensive than groundwater pumped independently from the municipal water provider or surface water or Colorado River water directly from a canal Apart from costs for infrastructure and power to operate a pump, costs for groundwater include only the state’s Water Quality Assurance Revolving Fund fees of $2.12 per acre-foot plus groundwater withdrawal fees (applicable in Active Management Areas) of $2.00 to $3.50 per acre-foot rather than the industrial class water rates charged by municipal water providers, which among the larger municipal water providers are on the order of $700 to $2,200 per acre-foot.
From the perspective of a large water user, there are pros and cons to receiving tap water service from a municipal water provider rather than using local groundwater Tap water is extremely reliable. Municipal water providers use looped water distribution systems so that water service can continue even when there is a pipeline break. Tap water meets federal Safe Drinking Water Act (SDWA) requirements and can be used for commercial and industrial purposes and for potable needs such as in employee breakrooms and bathrooms A large water user opting to drill and operate wells is responsible for developing and maintaining a water supply. Drilling and operating wells, and treating the water to meet SDWA standards if necessary, can be expensive and risky, but over time may be less expensive than paying the water tariffs of the local municipal water provider.
In some cases, the large water user has no choice but to apply to the local municipal water provider for service because well-spacing rules do not allow new wells to be developed on-site, or because local groundwater is not of adequate quality for the intended use among other reasons. In other cases, the large water user chooses to locate within the boundaries of a municipal provider because the user discharges a large amount of wastewater, and health codes and Clean Water Act requirements dictate that within and near city boundaries large discharges of wastewater be connected to an existing sewer and wastewater treatment system.
Water supply, reliability and quality are not the only considerations for a large water user when deciding whether to locate within the boundaries of a municipal water provider and to apply for tap water service. An enterprise may require a large and proximate labor pool, reliable power supplies, adequate street transportation and traffic control, solid waste service, housing and other amenities. These requirements may dictate location choice to a greater degree than considerations related to water.
Large Non-Agricultural Water Uses in Central Arizona
Tap Water Provision
In Central Arizona the provision of water service for the vast majority of homes and businesses is undertaken by municipal water providers who can spread the large capital cost of delivery of safe, reliable drinking water across the customer base. These community water systems extend across all urbanized parts of Central Arizona.
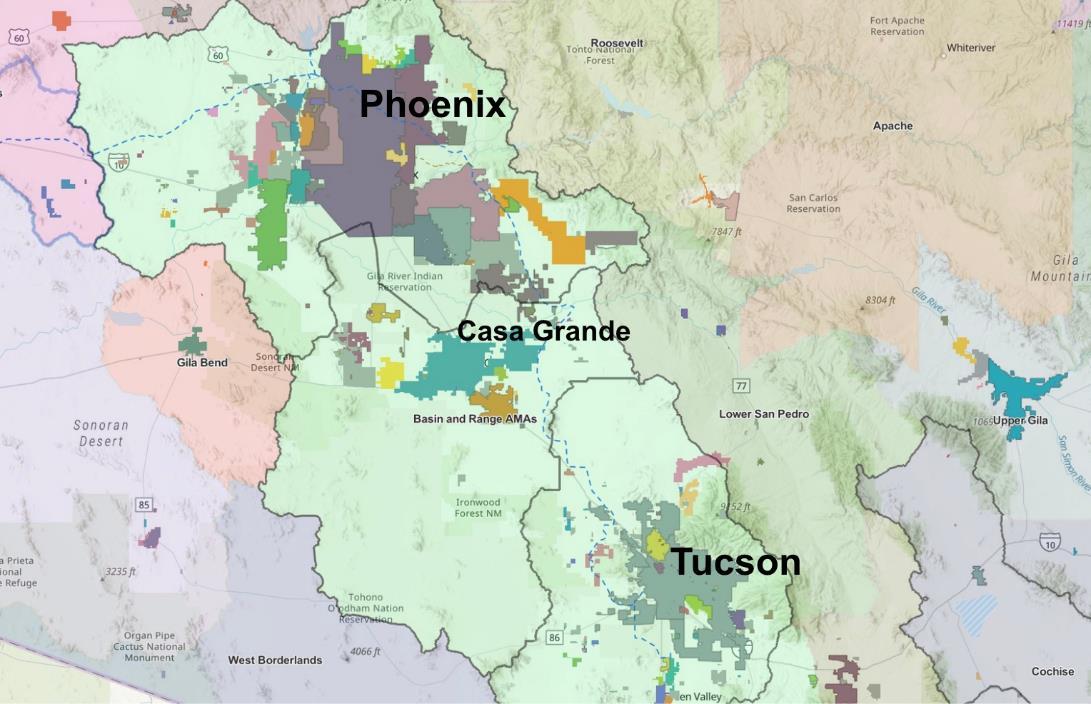
The majority of Central Arizona residents and businesses – some 4.3 million people and tens of thousands of commercial and industrial enterprises – rely on tap water provided within the service territory of a municipal water provider with a Designated Assured Water Supply (DAWS).
A DAWS is issued by the State of Arizona through ADWR. To achieve a DAWS, a municipal water provider must demonstrate it has the necessary water to meet for 100 years current and projected demand within the designation period. It must also show the financial capability to construct the delivery, storage and treatment works needed to make that water supply available to its customers. For a city or town, this means the adoption of a five-year capital improvement plan that provides for the construction of these works and certification by the chief financial officer that finances are available to implement the plan. ADWR must review a DAWS at least every 15 years to determine if it should be modified or revoked. This rolling time frame guarantees that commitments for water service do not exceed available supplies.24
24 Kathleen Ferris and Sarah Porter, The Elusive Concept of an Assured Water Supply: The Role of CAGRD and Replenishment at 7, Kyl Center for Water Policy at Morrison Institute, , Fall 2019 (citing Ariz. Rev. Stat. § 45-402(31); Ariz. Admin. Code R12-15-720 & R12-15-711).
Kyl Center for Water Policy – page 12 February 2026
Center for Water Policy – page 13
Most DAWS providers’ portfolios contain multiple sources of supply – some combination of renewable surface water supplies, reclaimed water and a quantum of groundwater, the use of which must be deemed consistent with the management goal for the AMA.25
If a municipal water provider has attained a DAWS, it has successfully demonstrated that its water management strategies are sound – renewable water supplies are secured, adequate finances support the utility, necessary infrastructure is planned and any groundwater pumping is consistent with the GMA.
To the extent that large water uses are served tap water from a municipal water provider with a DAWS, there is less cause for concern than if the large water use relies on the depletion of groundwater. Because a DAWS provider is required to continually demonstrate to ADWR that the provider can meet all of the demand within its service areas for the long-term, the DAWS provider is incentivized to carefully consider how a commitment to serve a high-volume water user will impact its ability to meet current and future demand.
Still, provision of service from a municipal water provider with a DAWS does not mean there is no concern regarding new large volume water uses. Current and future cuts in Colorado River water supplies imported through the CAP canal will put stress on the ability of municipal water providers to maintain their DAWS. Water managers, city councilmembers and local customers and constituents will need to carefully balance the benefits a proposed large volume use may bring in terms of tax revenues, jobs, and other considerations against the need to maintain a DAWS.
In some cases, new large volume water uses can be offset by the diminishing water demands of other customers. In other cases, the municipal water provider will need to reduce total demand or incur the expense of developing new water supplies to maintain its DAWS.
Part III. Large Water Uses within a Municipal Tap Water Distribution System
As detailed in a recent Kyl Center report, within Central Arizona, ten water providers serving a combined total of over four million residents have implemented ordinances or other measures regarding the provision of water service to high volume uses.26 Generally, these measures provide a framework for assessing whether adding demand
25 Ariz. Rev. Stat. § 45-576.
26 Kyl Center for Water Policy, How Arizona Municipal Water Providers Are Regulating Large-Volume Users, ASU Morrison Inst. for public policy, September 2025, https://morrisoninstitute.asu.edu/sites/g/files/litvpz841/files/2025-09/LargeVolume%20Water%20User%20Ordinances%20090525_revised2.pdf. Of these ten providers, nine are city water service departments with DAWS. The sole private water provider, EPCOR, serves multiple service areas, three of which have DAWS: Chaparral (Fountain Hills), San Tan and West Valley.
from a high volume use is within the community’s interests. Allocating a portion of a limited water portfolio represents an opportunity cost that should be carefully considered.
However, the demands municipal water providers meet are not stationary over time. Business enterprises come and go, technologies change, the water efficiency of appliances and industrial equipment increases, water service territories expand, population increases and turf and landscaping patterns change. Municipal water use per capita has been in decline over the last several decades in much of Central Arizona.
Because of this, an increase in the number of large water users served by a municipal water provider does not necessarily create an increase in the overall demand the provider must meet. Often, new water demands are offset by decreases in existing demands. In these cases, adding demand from a new large water user may contribute revenues from water sales to an otherwise declining revenue base.
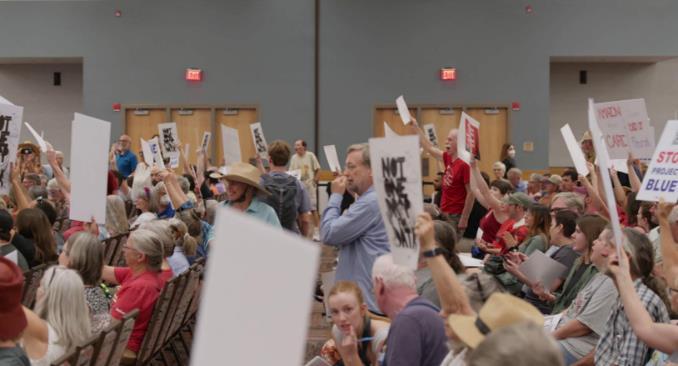
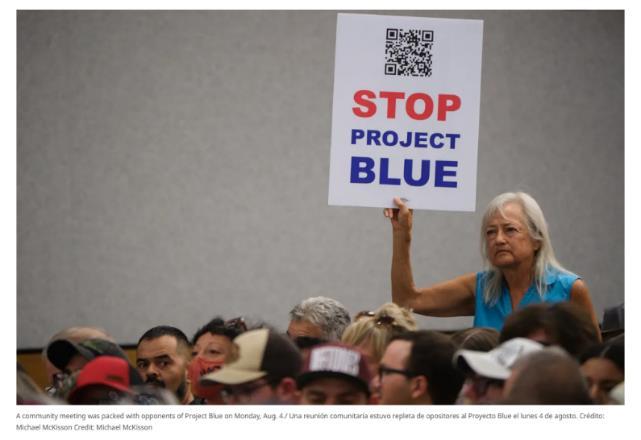
As examples, total tap water deliveries between 2019 and 2024 fell in the city of Mesa, even though Mesa has the third-largest number of data center campuses in Central Arizona, and total tap water deliveries between 2019 and 2024 fell by 2,266 acre-feet in the city of Tucson, more than the amount of water proposed to be used annually by the controversial Project Blue data center and an associated campus.27
Large water uses have always been woven into the fabric of urban living. Golf courses and water parks are obvious, but manufacturing and other enterprises rely on water to some degree.
27 Annual reports submitted by the cities of Mesa and Tucson to ADWR; Dylan Smith, “Tucson deal: ‘Project Blue’ data centers would thirst for water & electricity,” AZMirror (July 18, 2025) (quantifying water demands for two associated data centers at 2,000 acre-feet per year).
Large Non-Agricultural Water Uses in Central Arizona Kyl Center for Water Policy – page 14 February 2026
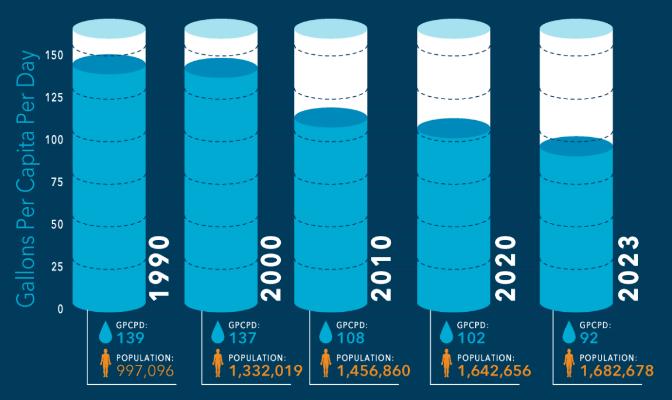
Table 4: Estimated Ranges of Large Water Uses in Central Arizona by Facility28
This table shows estimated use per facility, not total use across each sector. Facilities vary widely in their water use based on size, production levels and other factors.
The largest industrial water user in Central Arizona is the Palo Verde Nuclear Generating Station, whose primary water source is renewable effluent. Of the groundwater pumped for power generation in Central Arizona, 47% is replenished with renewable water supplies.29 This is not to say that the amount of water consumed for power producers doesn’t matter, but rather to note that the source of water used for power production matters a great deal. To the extent that power production relies less on unreplenished groundwater, there is less concern.
WHY DON’T WE TALK ABOUT ALL THE WATER USED FOR BEER?
In 2024, bottling and beverage facilities used just over 3,800 acre-feet of groundwater in Central Arizona (not delivered via a tap water system). That’s more than data centers use annually.
Why don’t we hear consternation about this use of water? Possibly because a lot of people love craft beer The popularity of a water use does not change its impact on local aquifers, but it may shape the public perception of how much it does.

28 Kyl Center for Water Policy, 2022 Community Water Use Study, ASU Morrison Institute 29 Id.