March 2026
HEAT
IN MARICOPA COUNTY

Authors:
Liza C. Kurtz, Senior Research Analyst
Alison Cook-Davis, Research Director
Morrison
Institute for Public Policy
Arizona State University
Acknowledgements
The work that provided the basis for this publication was supported by funding under an award with the U.S. Department of Housing and Urban Development. The substance and findings of the work are dedicated to the public. The author and publisher are solely responsible for the accuracy of the statements and interpretations contained in this publication. Such interpretations do not necessarily reflect the views of the Government.
Special thanks to Behshad Mohajer and Arisbeth Valenzuela for their assistance in preparing this report.
Executive Summary
Indoor heat is a critical public health and equity issue in Maricopa County. Addressing energy affordability, housing quality, and program accessibility can prevent deaths, reduce hospitalizations, and improve quality of life. The following report synthesizes broad findings from indoor heat and electricity cost research in both Maricopa County and other settings and reviews secondary data to understand the complexities of coping with indoor heat for residents. The report is framed to dispel five myths about indoor heat in Maricopa County and highlights solutions.
MYTH #1: HEAT-RELATED DEATHS ONLY HAPPEN OUTSIDE.
Reality: In Maricopa County, approximately one-third of heat-related deaths occur indoors, mostly in residences. From 2006–2024, 1,029 indoor heat deaths were recorded, and hospital visits for heat illness have tripled since 2006. Older adults (55+) account for over 90% of indoor heat deaths, and vulnerable populations including low-income households and those with disabilities face elevated risks.
MYTH #2: HAVING AIR CONDITIONING (AC) MEANS YOU’RE SAFE FROM THE HEAT.
Reality: AC presence does not guarantee safety. Most indoor heat deaths (92%) occurred where AC existed but wasn’t used often due to broken units or unaffordable electricity. Phoenix’s long, hot season drives high bills: summer costs average $100 more per month, and AC alone costs $658/year (vs. $299 nationally). Poor housing quality and inefficient units worsen risks, especially for renters who rely on landlords for repairs.
MYTH #3: FALLING BEHIND ON ELECTRIC BILLS IS THE SAME AS ANY OTHER DEBT.
Reality: Electricity utility debt can trigger eviction, credit damage, and health crises. Households trade off essentials (“heat or eat”), juggle debt, or limit AC use sometimes enduring unsafe temperatures. Disconnection, though rare (≈2%), is life-threatening. Energy insecurity disproportionately affects older adults, families with children, and minority communities, and has been shown in other settings to correlate with higher eviction rates.
MYTH #4: ASSISTANCE IS AVAILABLE FOR EVERYONE WHO NEEDS IT.
Reality: Programs like LIHEAP and utility discounts help households cope with high utility bills but fall short of meeting needs. Only 5% of eligible Arizona households received LIHEAP in FY2023; benefits ($500–$640) rarely cover full costs. Local programs (APS, SRP) and nonprofits provide aid, but funding is limited and declining as pandemic-era programs end. Administrative burdens and eligibility rules further restrict access.
MYTH #5: THERE IS NOTHING WE CAN DO.
Reality: Indoor heat is preventable. Solutions include:
• Data sharing & research on indoor heat and utility burdens.
• Policy improvements for disconnection moratoriums and assistance programs.
• Weatherization & AC repair to reduce costs and improve safety.
• Urban cooling strategies to lower outdoor and indoor temperatures.
• Invest in prevention to save lives and reduce healthcare and eviction costs.
Introduction
The Phoenix metro area is the hottest urbanized area in the United States. 1 Residents often struggle to stay cool and comfortable in the desert heat, which is exacerbated by an urban heat island effect that can raise temperatures by nearly 10°F. 2 In the most extreme cases, an inability to stay cool can lead to heat illness and even death, particularly for individuals experiencing unsheltered homelessness. 3 Housed residents, however, can also experience deleterious impacts from extreme heat, including in their own homes, and some of these impacts have far-reaching consequences. This report addresses five myths about extreme heat, focusing on the impacts of heat in indoor environments and the associated stress – physical, financial, and mental – on households in Maricopa County.
MYTH #1: HEAT-RELATED DEATHS ONLY HAPPEN OUTSIDE.
In 2024, the daily high temperatures in Maricopa County reached 110F or above a record-breaking 70 times. 4 With such extreme summertime heat, it can be easy to assume that heat-related illness and death occur only in outdoor environments, where residents and visitors are most likely to be directly exposed to high air temperatures. Being indoors, however, is not always a guarantee of protection from heat, as not all residents in Maricopa County have access to air conditioning, and indoor environments without adequate air conditioning can reach high temperatures quickly in the right circumstances. 5
Heat-related deaths in indoor environments
Heat-related deaths in indoor settings represent a substantial public health burden, with an average of 33% of all heat-related deaths per year taking place indoors between 2006-2024. 6 The number of indoor heat-related deaths has also increased over time, with the 5-year average number of indoor deaths more than quadrupling from 2006-2010 to 2020-2024 (Figure 1). 7, 1 For comparison, the population of Maricopa County has increased by less than 25% in that same time period. 8 While the county saw a reduction in both indoor and total heat deaths in 2024, it remains to be seen if this reduction is part of a downward trend overall.
1 Changes in heat death surveillance may account for some variation between years.
Heat Deaths in Maricopa County 2006 - 2024
Deaths Non-Indoor Deaths
Figure 1. Heat deaths in Maricopa County, 2006 – 2024. Source: Maricopa County Public Health Department, 2025. Note: Chart specifies “non-indoor” as location of injury may be unknown.
When thinking about indoor heat deaths, work sites without air conditioning such as warehouses or manufacturing plants might come to mind. But nearly all indoor heat-related deaths are in residential settings, meaning inside a structure where someone lives such as a house, apartment, mobile home, or RV. There were 1,029 heat-related deaths indoors in Maricopa County from 2006 –2024; 92.1% were in a residence. 9 In 2007, 2008, 2009, 2014, and 2015, all indoor heat deaths were residential. 10
In addition to the environment where a death has taken place, heat-related death reports record the status of air-conditioning (AC) for indoor deaths. Of the indoor heat deaths mentioned above, 948 were in an environment where AC was present but not in use. 11 In the largest share of those deaths (66%), the AC was not in working condition. 12 In others, the unit had been turned off (20%), the electricity was disconnected (6%), something else was wrong (2%), or the reason for its disuse was unknown (5%). 13 The fact that so many deaths took place in environments with AC emphasizes how critical a comfortable indoor environment is to daily life, and also demonstrates that simply having AC is insufficient to guarantee residents’ health and well-being.
AC Status for Indoor Heat Deaths in Maricopa County, 2006 - 2024
Heat-related illness in indoor environments
Death is not the only risk from indoor heat. High indoor temperatures can also cause heat-related illnesses such as heat exhaustion and heat stroke. In the short term, symptoms such as dizziness, headaches, shortness of breath, cramping, vomiting, fatigue, fainting, and increased body temperature can be uncomfortable and dangerous. 14 In the longer term, an episode of heat illness can cause permanent organ damage, including brain, damage. 15 Exposure to indoor heat can also exacerbate underlying health conditions such as respiratory and cardiac disease, diabetes, mental health disorders, and impaired physical functioning. 16 In severe cases, heat illness can lead to a hospital visit, which may place a substantial financial burden on households and additional strain on healthcare institutions. 17 Hospital visits across Arizona for all heat-related illnesses (indoors and outdoors) cost $115 million in 2022. 18
As with heat-related deaths, the prevalence of heat-related illness in Maricopa County has risen steadily, with the number of hospital visits (defined as both emergency department admissions and hospitalizations) for heat more than tripling from 2006 - 2024 (Figure 2). 19 The most common setting for heat-related illness requiring a hospital visit was residential, meaning that the heat exposure happened inside a home. 20 In Maricopa County from 2006-2018, 28% of all heat-related illnesses that led to a hospital visit took place inside a home. From 2019-2023, that percentage rose to 34%. 21
Figure 2. AC status for indoor heat deaths in Maricopa County, 2006 – 2024. Source: Maricopa County Public Health Department, 2025.
Heat-Related Hospital Visits In Maricopa County, 2006 - 2024
Figure 3. Heat-related hospital visits in Maricopa County 2006 - 2024. Source: Maricopa County Public Health Department 2017, 2024; Arizona Department of Health Services, 2025.
Who dies from indoor heat?
Studies of heat risk have shown that some populations have an elevated health risk from extreme heat, including racial and ethnic minorities, older, and lower-income residents, as well as people with disabilities. 22 Health risks are elevated for these individuals due to both physical factors, such as pre-existing health conditions, and socioeconomic ones like the inability to pay for air conditioning and social isolation, which makes asking for assistance more difficult. 23
The same risk implications appear among indoor heat deaths in Maricopa County. 2 A disproportionate share of indoor heat deaths are individuals over the age of 55 (Figure 3). 24 As indoor heat deaths have increased in total number, the share of deaths in individuals over 55 has also increased, with deaths in the over 55 category accounting for 90% of all indoor heat deaths in 2023. 25 This trend suggests that older residents face unique challenges in preventing and coping with high indoor temperatures, and these individuals may need additional resources or assistance to cool their homes.
2 Data from the U.S. Census Bureau, including the American Community Survey and the American Housing Survey, uses either counties or metropolitan standard areas (MSAs) as geographic units of analysis. The Phoenix MSA encompasses all of Maricopa County and a small, urbanized area of Pinal County. Both are referred to as “Maricopa County” throughout this report for clarity.
Proportion of Indoor Heat Deaths Over Age 55 in Maricopa County
Figure 4. Proportion of indoor heat deaths over age 55 in Maricopa County. Source: Maricopa County Public Health Department, 2024; American Community Survey (ACS) 1-Year Estimates, 2010-2023. Note: Chart begins in 2010, the first year for which ACS estimates are available, and ends in 2023, the most recent year for which ACS estimates are available. 2020 data is experimental due to COVID-19 pandemic.
There are also discrepancies in indoor heat deaths in Maricopa County by racial and ethnic categories. While the proportions of indoor heat deaths by racial and ethnic categories vary from year to year, white residents were the only group that consistently died from heat-related causes across all years at higher rates than expected based on their proportion of the total population (Figure 4). 26 The reasons that drive this pattern of overrepresentation of white individuals in indoor heat deaths are unknown.
In contrast, residents identifying as Hispanic or Latino died from indoor heat at a much lower rate compared to their representation in the total population across all years (Figure 5). 27 The relatively low risk of indoor heat death for Hispanic/Latino individuals is consistent with prior studies that have shown lower rates of heat-related deaths for Hispanic/Latino individuals regardless of indoor or outdoor settings. 28 These findings, however, are in tension with other studies that have found that Hispanic/Latino residents of Maricopa County are significantly more likely to report being too hot inside their homes and are more likely to live in hotter neighborhoods. 29 The reasons for relatively low rates of indoor heat death among Hispanic or Latino individuals are unknown, although a lower median age among the Hispanic/Latino population in Maricopa County compared to the white population may account for some of the difference. 30 Further investigation might provide additional insight.
Proportion of Indoor Heat Deaths by Race/Ethnicity (White)
Figure 5. Proportion of indoor heat deaths among white individuals in Maricopa County. Source: Maricopa County Public Health Department, 2024; American Community Survey 1-Year Estimates, 2010-2023. Note: Chart begins in 2010, the first year for which ACS estimates are available, and ends in 2023, the most recent year for which ACS estimates are available. 2020 data is experimental due to COVID-19 pandemic.
Proportion of Indoor Heat Deaths by Race/Ethnicity (Hispanic) % of pop. - Hispanic or Latino % of indoor deaths - Hispanic or Latino
Figure 6. Proportion of indoor heat deaths among Hispanic individuals in Maricopa County. Source: Maricopa County Public Health Department, 2024; American Community Survey 1-Year Estimates, 2010-2023. Note: Chart begins in 2010, the first year for which ACS estimates are available. 2020 data is experimental due to COVID-19 pandemic.
MYTH #2: HAVING AIR CONDITIONING MEANS YOU’RE SAFE FROM THE HEAT.
In Maricopa County, many residents go inside their homes to cool off with air conditioning (AC) on hot days. In this very hot region, 97.6% of homes are equipped with central AC, while the national average is only 73.9%. 31 However, while many studies use the presence of AC to quantify residents’ risk from indoor heat, simply having AC is not enough. 32 Residents must also be able to afford the increased electricity costs that come with using AC, live in homes that are sufficiently insulated for AC to be effective, and the AC unit must be maintained. Without affordability, quality housing in good repair, and a unit in adequate condition, AC alone does not prevent heat illness and death. 33 Electricity and air-conditioning costs
Maricopa County’s unusually warm climate means that using AC to cope with high outdoor temperatures can be costly, as summertime temperatures are both higher and last longer than many other comparably sized urban areas. In 2024, the Phoenix metro area shattered existing records with 70 days above 110F, and with days at or above 100F extending into late October – weeks later than the previous record. 34 These temperatures are part of an overall warming trend in which temperatures in urban areas of Maricopa County have risen (Figure 7). 35 Daily minimum temperature, defined as the lowest temperature at any point during a calendar day but most commonly occurring overnight, has shown a substantial increase; the total number of days over 110F has also increased. 36 The consequences of this warming trend for household electricity costs have been identified as a major source of concern for residents. 37
https://xmacis.rcc-acis.org/.
Understanding the exact connections between increased temperatures and electricity expenditures, however, is difficult. By some measures, Arizona does not have unusually high per-household electricity costs. Data from the American Housing Survey indicate that 21.5% of Maricopa County households pay more than $200 in average monthly cost for their bill, compared to a national
Figure 7. Mean summertime minimum temperatures for Phoenix, AZ, 1974 – 2024. Source: xm-ACIS2, NOAA Regional Climate Centers,
percentage of 24.9%. 38 In 2024, an analysis of three electrical utilities in Arizona found residential customers’ kilowatt hours priced 1% lower than the national average – although this analysis does not take into account additional bill charges such as service fees. 39
The low base-level cost of electricity may, however, be offset by high seasonal costs. One estimate suggests that Arizonans pay an average of $100.15 more per month in the summer than during other months of the year, the largest summertime increase in the country. 40 This seasonal increase is driven by AC use. As of 2020, the latest year for which data are available, the average household in Arizona spent $658 per year on electricity to power AC alone. 3, 41 The national average was $299. 42 Both major electrical utilities in Maricopa County provide options that help residential customers spread the cost of summertime bills across longer timeframes, but these programs are not available to customers with past due balances or in payment arrangements, making them less accessible to lower-income households. 43
Data shows that, regardless of time of year, many households in Maricopa County struggle to pay their electric bill. The U.S. Household Pulse Survey is a survey deployed multiple times per year by the U.S. Census Bureau to collect data on emerging economic and social trends. 44 The Household Pulse sampled Maricopa County households 20 times between January 2022 – September 2024; across those surveys, between 15.8% - 22.4% of respondents reported they had difficulty paying their utility bills (Figure 7). 45
Percent of Maricopa County Households Unable to Pay Energy Bill
3 This statistic includes households outside of the lower elevation deserts of Arizona. Households in higher elevation areas experience cooler summers, reducing the need for AC. The average expenditure for households in lower elevation Maricopa County, therefore, is likely to be even higher than reported here at the state level.
Figure 8. Percent of Maricopa County households having difficulty paying energy bills, 2023 – 2024. Source: U.S. Census Household Pulse Survey, 2023 – 2024.
Another way to track households’ inability to pay bills is to measure “energy burden.” A household’s energy burden is the percentage of their gross income spent on energy (including electricity, gas, geothermal, etc.). Households that spend more than 6% of their gross income on energy costs have a high energy burden, while households spending more than 10% are severely energy burdened. 46 According to an analysis of 2019 data by the American Council for an Energy-Efficient Economy, 25% of lower-income households across the United States had an energy burden above 15%. 47 In the Phoenix metropolitan area, 21% of all households, regardless of income, are estimated to have a high energy burden, with 10% experiencing a severe energy burden. 48 According to data from the U.S. Department of Energy, the cost of electricity is the largest share of energy burden for these households, far surpassing gas and other expenditures. 49 This may reflect the additional costs of high AC usage, as mentioned above.
Statewide economic analyses show that lower-income households in Maricopa County face especially severe energy burdens. For households of four making less than $13,875 (50% of FPL) in 2022, energy costs were an average of 24% of their annual gross income. 50 For households of four making less than $55,500 (200% FPL), home energy bills exceeded the 6% income threshold by an average of $652 per year in 2022. 51 In the Phoenix metro area, households below 200% FPL spent a median of 15% of their gross income on energy bills in 2018. 52
Residential billing data from Maricopa County’s electricity service providers support these findings. While residential account data is complex and the reported data includes service territories beyond county boundaries (see Figure 9), Maricopa County’s two largest service providers, Arizona Power Supply (APS) and Salt River Project (SRP), estimate that the percentage of residential customers who were behind on their bills at any point during 2024 was 9 – 35% depending on the service provider and the time of year. 53
Reporting on the average total of unpaid balances also varies, with service providers utilizing differing thresholds and reporting periods. Among SRP customers, 67% of accounts with unpaid balances owed more than $100; the average unpaid amount per account was $207. 54 Between 78%91% of APS customers behind on bills had balances greater than $75, depending on the time of year; average unpaid amounts varied, with the lowest average at $398 in May and the highest in $751 in October 2024. 55
The most straightforward way to assess residents’ need for electricity bill assistance is to track the number of customers asking for assistance. Combined, SRP and APS received more than 336,000 calls for bill assistance in 2024. That same year, 13% of all callers to the 211 Arizona crisis assistance helpline were concerned they could not pay their electricity bill, were past due, or had been disconnected. 56 Electric bill payment assistance was the third most common need identified by 211 assistance counselors, behind shelter and low-cost housing, occurring 17,702 times in 2024. 57 This data has the advantage of being relatively up-to-date; measures that require more complex data collection efforts may lag households’ lived experiences. Rate increases are common for Arizona’s largest utility providers, with electricity rates, in particular, rising faster in the Phoenix metro area than the national average. 58 A recent change to Arizona policy reduced the documentation required
for state-regulated utilities to seek rate increases; the new requirements allow for utilities to request rate increases annually, further widening the gap between analyses using publicly available data and households’ immediate energy costs. 59
It is additionally worth noting that all measures of energy burden and bill affordability assess only those households who have difficulty paying - not those households who make their bills affordable by severely limiting their consumption of electricity. Yet these households, too, are experiencing the impacts of electricity costs. 60 In 2020, a non-representative survey of Arizona households, the Arizona Residential Energy Consumption Survey (RECS) found that 11% of respondents kept their home at an unhealthy temperature at least one or two months of the year to reduce the cost of their bill. 61
Housing quality and neighborhood temperatures
For many lower-income households, electricity costs are frequently compounded by the poor quality of their residences. 62 Leaky windows and doors, outdated building materials, poor insulation, and inefficient appliances can all raise costs (and temperatures) while decreasing the efficacy of air conditioning. Yet, these issues can be expensive to remedy. In 2024, estimates of the cost to replace one window with a more energy efficient, double-paned model varied from several hundred to several thousand dollars, depending on style, glass type, and frame material. 63 Windows with additional energy efficiency features, such as specialty coatings or fillings between panes, are often even more expensive. 64
Old or malfunctioning AC units can be another source of high electricity bills and warm indoor environments, but reliable data on AC operational status is hard to find. 5% of RECs respondents were unable to use cooling equipment in their home because they could not afford to repair or replace it. 65 While also not representative, media coverage indicates the price of repairs or a newer, more efficient AC is beyond reach for many lower-income households in Maricopa County. 66 For lower-income homeowners, a new AC unit could offer potentially meaningful savings as well as a more comfortable living environment. As with windows, however, upfront costs can be prohibitive, with estimates ranging between $5,000 - $12,500. 67 Renters, by contrast, are unable to replace AC units and must largely rely on landlords for regular maintenance or emergency repairs. 68 Landlords have a legal duty to ensure a habitable residence, including “reasonable cooling” according to the Arizona Revised Statues 33-1324 and 9-1303, and many municipalities further specify a minimum temperature to which equipment must be capable of cooling an indoor environment. 69 These policies rely on air temperature as the defining measure of acceptable temperature, despite research showing that air temperature is not an appropriate indicator of human health or comfort. 70 There are few options for renters whose landlords refuse or delay repairs other than expending funds for expensive alternatives (such as a portable AC or staying at a hotel), while recouping these costs can require filing a civil suit. 71 Subsequently, renters sometimes wait weeks or months for AC repairs, leaving them exposed to potentially dangerous living conditions with little recourse. 72
Even in cases where lower-income residents can afford or are enabled to improve their home’s energy efficiency, they may pay more to stay cool due to external factors. In Phoenix, neighborhoods
with more lower-income and/or Latino households experience hotter outdoor temperatures due to a lack of vegetation, greater urban density, and the historical impact of discriminatory housing practices, which reduced investment in minority areas leading to poorer quality housing. 73 While the relationship between high outdoor temperatures and indoor temperatures is complex, the most accessible and effective means for buffering outdoor heat is AC – yet using more AC increases costs in households that may already struggling financially. 74
MYTH #3: FALLING BEHIND ON ELECTRIC BILLS IS THE SAME AS ANY OTHER DEBT.
In Maricopa County, not being able to pay a bill is a frequent experience for many households. A single resident is estimated to need an income of $102,710 to live comfortably in the Phoenix metro area, while a two-adult family with two children would require $238,500. 75 The median household income in 2023, however, was $84,307 – far short of the amount needed to sustain even one individual comfortably. 76 Eleven percent (11%) of residents are below the federal poverty line (FPL) of $14,580 in gross income for a single resident and $30,000 gross income for a family of four. 77 An additional 15.2% are below 200% FPL, a threshold often used to define under-resourced households. 78
Impacts of unaffordable bills
For households with insufficient monetary resources, the struggle to pay for utilities like electricity can have negative health impacts. The financial strain of unaffordable bills combined with an inability to moderate indoor temperatures can lead to stress, depression, respiratory conditions, and sleep issues in addition to heat-related illness. 79 It can also have long-term financial consequences, as households that struggle to pay for electricity are more likely to be food insecure or transition into poverty. 80 For renters with few financial resources, an unusually high energy bill is more likely to lead to hardship than other unexpected costs, including a similarly sized increase in rent; the same may be true of homeowners to a lesser extent. 81 Failing to maintain utility services can be grounds for eviction, depending on lease terms. 82 Unpaid bills or service disconnection can also make achieving stability difficult in the future by affecting credit scores, requiring additional fees or a larger deposit to reconnect in the future, or even requiring a third party to guarantee payment. 83 These impacts are not evenly distributed, as racial and ethnic minorities, residents with disabilities, older residents, and families with young children are all more likely to be energy burdened. 84 Most significantly, neighborhoods with higher average energy burdens see more evictions, and this relationship is not explained by housing costs or demographic variables. 85
The essential need for electricity in modern life, combined with the possible consequences of failure to pay, makes unpaid electric bills a central concern for households. 86 Residents struggling to pay their bill have three options for addressing the shortfall: redistribute existing resources by trading off between necessary expenses; conserve electricity; or find additional ways to pay, such as bill assistance or going into debt. 87 Research shows that the greater the amount owed, the more households resort to these strategies to compensate. Approaching the point of shut -off due to nonpayment can throw households into the same level of crisis as the threat of eviction. 88
Trading off between expenses
One of the most common methods for moderating the impacts of unaffordable electricity bills is to shift available resources away from other necessities and towards electricity costs. 89 For households already struggling, these tradeoffs come not from discretionary spending but from reducing consumption of essential needs such as food, medicine, and other necessities. 90 These tradeoffs can create additional hardship: lower-income households, for example, are already more likely to be in poor health, and reducing the use of medication or care to pay for utilities may further exacerbate medical issues. Similarly, paying a bill may mean a reduction in access to food – a phenomenon often called the “heat or eat” dilemma in the context of cold climates. 91 Nineteen percent (19%) of RECS survey respondents in Arizona reported reducing or foregoing necessities to pay their utility bills. 92
An alternative to reducing expenditures on necessities is “debt juggling.” 93 Debt juggling refers to the practice of trading off payments between utility bills, credit card payments, and other forms of debt to avoid defaulting entirely. Households may alternate which bills are paid every month or use partial payments to stave off more severe consequences, such as disconnection, while accruing additional debt via late fees and interest. 94 Some lower-income households, however, may not have access to debt juggling due to their participation in prepaid or pay-as-you-go service plans; these plans are often recommended by utilities for customers with a history of missed payments, and do not allow debt accrual. 95 In Maricopa County, only the Salt River Project (SRP) offers a prepaid plan; approximately 14% (152,000) of SRP customers utilize this plan. 96
Conserving electricity by limiting AC use
Studies find reducing the cost of electric bills by using less AC overall is another frequent strategy for households struggling to pay. 97 In 2022, a convenience sample of Maricopa County residents found that 23% reported being too warm in their homes in the summer. 98 An equivalent percentage (23%) reported having difficulty paying their electrical bills. 99 Seventy-five percent (75%) of these respondents reported the cost of electricity was the top barrier to keeping their home cool. 100 A similar survey with clients at public cooling centers in Maricopa County found that, of respondents with stable housing, 41% reported they were utilizing the center because their own home was too hot and 35% were having trouble paying their energy bills. 101 Another survey of residents in Maricopa County in 2023 found that 9.3% of all households were too hot in their home for at least 24 hours in the past 12 months. 102
Reducing AC use may be more common among lower-income households in Maricopa County; one national study found that lower-income households increase their energy expenditures in response to extreme weather only half as much as higher-income households. 103 Controlling energy expenditures is a convenient strategy lower-income households because it relies on behavior that is completely within residents’ control. Unlike securing payment assistance or taking on debt, changing a thermostat can be done by any member of the household at any time. Residents who intentionally endure warmer temperatures to lower costs, however, are literally trading their health and comfort for reduced financial strain by “[using] their bodies as buffers against the effects of energy insecurity”; the most extreme version of this tradeoff can be seen in the cases of indoor heat deaths where AC was turned off despite high indoor temperatures. 104 By letting homes warm in hot months,
electricity costs go down, but discomfort and other impacts such as poor-quality sleep, stress, and chronic health issues become more likely. 105 For some residents, buffering their financial strain via warming may result in hospitalization and even death. 106
Finding additional resources
Households also cope with unaffordable electricity bills by finding alternative means to pay. 107 Programs such as the Low-Income Housing Energy Assistance Program (LIHEAP) are critical sources of payment assistance, as are income-based bill reduction and energy credit programs from electrical utilities. These assistance programs are addressed below (see “Myth #4: Assistance is Available for Everyone who Needs it.”)
Formal assistance programs, however, are not the only pathway to obtaining additional financial resources. Electricity bills can also drive households to take on additional credit card debt or participate in predatory lending practices, such as pay-day loans, which have high interest rates and may contribute to financial instability in the long-term. 108 Households may tap personal social networks for informal assistance as well, but access to this kind of social support depends on existing relationships being strong enough to motivate help from peers. 109 Research on extreme heat in general has found that individuals who are socially isolated are more likely to experience heatrelated illness; similarly, social isolation may reduce residents’ ability to leverage financial assistance through friends and family. 110
Unpaid bills as crisis
When a household cannot pay an electricity bill and the strategies discussed above have either failed or been exhausted, the result is disconnection from electrical service altogether. A lack of electricity prevents households from performing essential tasks such as refrigerating food, washing clothes, cooking food, and cooling the home, leading to “life-threatening” disruption. 111
Despite the impacts of disconnection, however, the total number of residential disconnections is difficult to assess. 112 One estimate for Arizona put the rate of disconnection notices at 7.5% of all households in 2020, but how many of these notices translate to full disconnections is unknown. 113 In Maricopa County, differing service plans and providers make reporting a unified estimate of residential disconnections complex. Among residential customers of the Salt River Project who use a traditional payment plan (e.g., customers are billed at the end of the month for electricity used), the disconnection rate in 2024 was approximately 2%. 114 For residential customers of Arizona Public Service, the other large electricity provider in Maricopa County, the disconnection rate was less than 2%. 115 Both of these estimates, however, include service areas outside of Maricopa County and time periods covered by disconnection moratoriums (see “Disconnection moratoriums,” below).
Disconnection, while an obvious crisis for households, is not the only circumstance in which unpaid bills can become an emergency. Increases in extreme heat days are associated with increases in evictions, resulting from unplanned household expenditures on additional cooling. 116 Evictions can lead to unsheltered homelessness, which may lead to an increase in heat -related deaths overall. 117 In Maricopa County in 2024, 32% of all callers to the county’s 211 helpline that identified a need for electric service payment assistance also needed rental payment assistance. 118 The co-occurrence of
requests for both electricity bill and rent assistance illustrates how many households struggle with housing precarity at the same time as energy costs.
MYTH #4: ASSISTANCE IS AVAILABLE FOR EVERYONE WHO NEEDS IT.
Assistance programs offer an alternative means of securing additional resources to pay utility costs. Federal programs such as the Low-Income Household Energy Assistance Program (LIHEAP) and the Weatherization Assistance Program (WAP), as well as local funding sources such as city and community programs and utilities themselves, offer financial assistance to buffer households from the impacts of unaffordable electricity bills. Accessing assistance, however, requires programs to have sufficient funding and personnel, and households must be eligible and have the time and resources to complete an application.
Low-Income Household Energy Assistance Program
The most significant source of payment assistance for households has been LIHEAP, a federal program created in the 1980s to help households with high energy costs. 119 In the years since its inception, LIHEAP has expanded to include weatherization (see “Weatherization and Housing Rehabilitation” below) and crisis assistance funds in addition to utility bill assistance. 120 The funding allocation for the program in Fiscal Year (FY) 2024 was $3.7 billion, distributed between states, territories, and tribal governments. 121 In FY 2023, LIHEAP assisted nearly six million households nationwide, including 261,000 instances where LIHEAP funds were used to restore utility service to a household. 122 Receiving LIHEAP funds has been associated with a reduction in the likelihood of hospitalization and poor childhood nutrition, and eliminating the program could increase the prevalence of lower-income households struggling to pay energy costs by 17%. 123
Historically, the LIHEAP program has prioritized heating rather than cooling costs. 124 In FY 2023, five million households across the United States received assistance in paying for heating costs, while less than one million households received equivalent assistance for cooling. 125 The skew in distribution partially comes from the formulas used to derive the funding allocations, which prioritizes coldweather states. 126 Another source of discrepancy is the timing of the program, as funds are disbursed in October – meaning that, unless a certain portion of funding is earmarked for cooling needs, LIHEAP funds may be largely exhausted before high summer temperatures arrive. 127 Arizona received $30,937,243 in LIHEAP funding in FY 2024 – about 0.8% of total LIHEAP funds. 128 Despite advocacy for a more equitable formula that recognizes the potentially life-threatening risk of extreme heat, Arizona’s LIHEAP portion remains lower than that of colder states with similar population sizes, like Washington ($65,422,651), Tennessee ($75,366,886), and Massachusetts ($143,775,713). 129 40% of Arizona’s allocation is set aside for use October – March, while the remaining 60% is distributed April – September. 130
Arizona’s LIHEAP funds are managed through the Arizona Department of Economic Security. 131 Eligibility is determined on a point system that considers household income and energy burden, with prioritization for vulnerable populations such as the elderly, children, veterans, and those with disabilities. 132 Households making more than 60% ($61,069 for a family of four) of the state’s median income are ineligible. 133 Arizona households who qualify for LIHEAP funds can receive up to a
maximum of $640 in payment assistance once per year. 134 Households may also be eligible for $500 in crisis assistance, which is designed to prevent immediate shut-offs, if other LIHEAP funds have already been received. 135 APS reports that the most common source of bill assistance for its customers in 2024 was LIHEAP, which composes 59 – 77% of total customer assistance funding received each quarter. 136
While LIHEAP has been a critical source of assistance, there are also significant barriers that prevent households from using the program. In FY 2023, only 5% of eligible households in Arizona received LIHEAP – an increase from only 3% in FY 2022. 137 Nationally, the average percentage of eligible households reached is between 15 – 20%. 138 Research also shows the administrative component of navigating programs like LIHEAP – which requires photo identification, proof of income and benefits, copies of utility bills, and other documentation – is the most burdensome to households who need the most help. 139 While program administrators have tried to reduce this burden by changing application requirements (with some success), research indicates that the complexity of securing assistance still deters many households. 140
Even if households continue to receive LIHEAP, the funding may not be enough to eliminate unaffordability. In 2022, the average LIHEAP benefit per household for utility bills was $723 for heating assistance and $714 for cooling assistance. 141 An economic analysis of Maricopa County households below 100% FPL in that same year, however, found that these households were an average of $1,008 short of affordable energy expenditures. 142 Since LIHEAP applicants are ineligible if they are receiving additional utility bill assistance from other sources (see “Local utility assistance programs” below), and benefits are awarded only once in a 12-month period, the lowest-income households are faced with an affordability gap. 143
Both households and state-level LIHEAP administrators may face additional challenges in the future as the program reorganizes under President Trump’s administration. In April 2025, the U.S. Health and Human Services staff administering the federal LIHEAP program were laid off. 144 While federal funding for the LIHEAP program has not been reduced, it is unclear how the program will be administered in the future or how this reorganization may impact households that rely on LIHEAP. 145
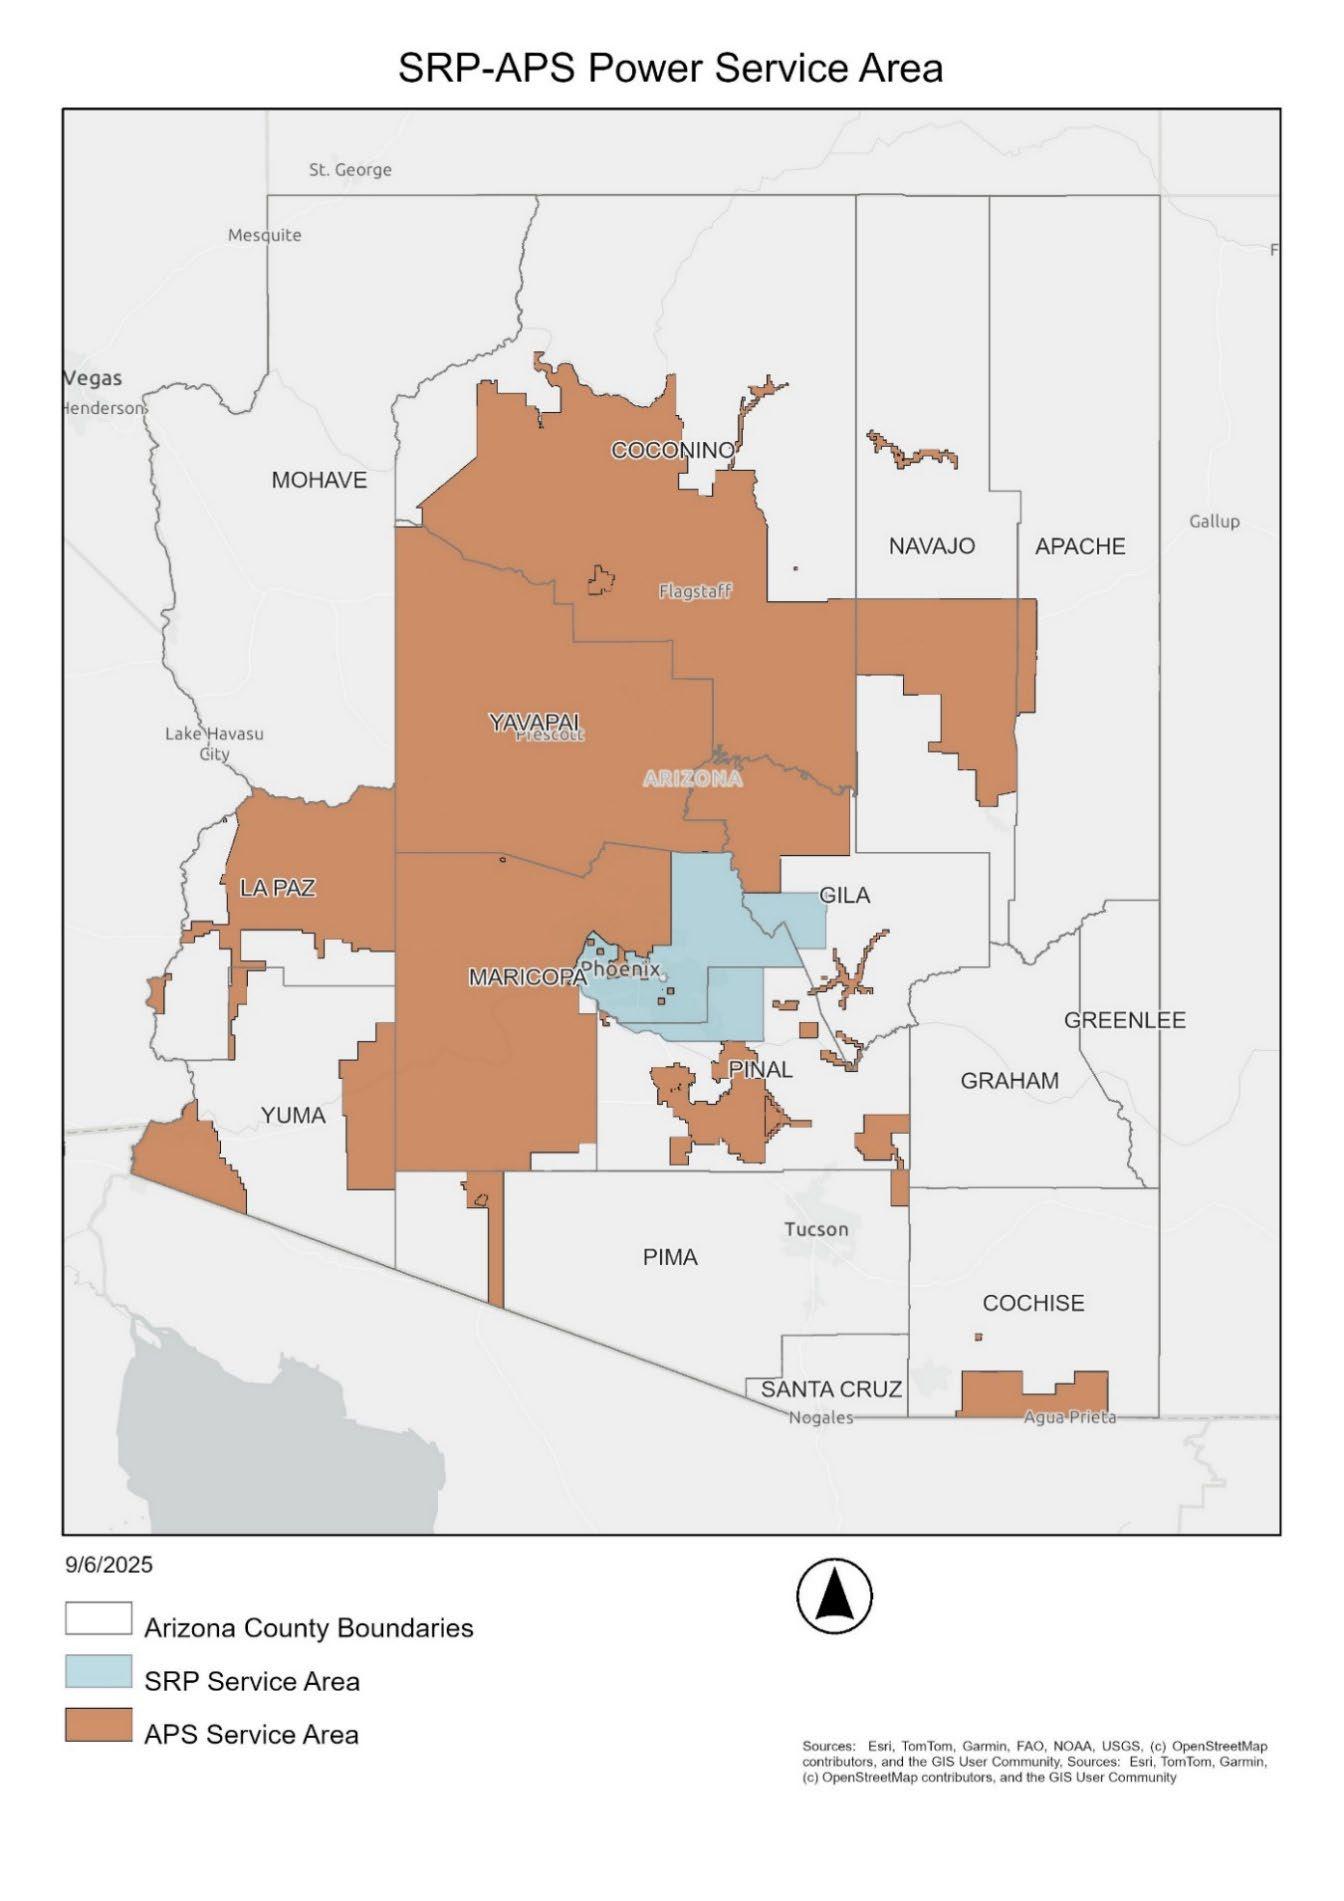
Figure 9. Map of Salt River Project (SRP) and Arizona Public Service (APS) service territories.
Local utility assistance programs
In addition to federal programs like LIHEAP, Maricopa County’s two largest utility companies, the Salt River Project (SRP) and Arizona Public Service (APS), also make resources available for lower-income households. Assistance can come in the form of discounts on bills, extended repayment periods, and direct funding for bill payment through community-based organizations. All of these options require households to voluntarily enroll and provide proof of income to qualify.
Both SRP and APS offer cost reductions on electricity bills for residential customers if household income is below a certain threshold. APS offers two options for households below certain FPL thresholds as well as a waived convenience fee (a savings of approximately $3 per bill), while SRP offers a single economy priced plan for all households below 150% FPL. 146 About 8.6% of all SRP residential customers were enrolled in their economy priced plan at any point in 2024. 147 Discounts of this kind are useful because they address the fundamental unaffordability of utilities for households who struggle to pay and because they can be maintained indefinitely as long as households meet income eligibility. 148
Table 1. APS and SRP income-based bill reduction programs. Source: APS 2025; SRP 2025.
For households with past due balances, bill repayment plans are available, although the length and terms of these repayment plans vary by service provider, customer history and account type. 149 APS offers only post-paid accounts, meaning accounts where customers pay for electricity used during a previous set period (e.g., the previous month). APS customers are eligible for a repayment plan if the amount owed is over $75, if they are not using budget billing, and if they have not broken a payment arrangement more than once in a 90-day period or three times in a 12-month period. 150 Customers who have had a payment declined due to insufficient funds may also be ineligible. 151 The minimum monthly charge on an APS payment arrangement is $25. 152
For SRP customers, repayment arrangements differ based on whether customers have a post -paid account or a “pay-as-you go” (pre-paid) account, where customers purchase a set amount of electricity in advance and can add to that amount at any time. 153 SRP offers repayment arrangements to post-paid accounts who have had an account for more than six months, do not already have an extension on bill due dates, and have paid their deposit. 154 Pre-paid customers who have unpaid balances are automatically enrolled in a repayment plan, with a certain percentage of each new payment assigned to the unpaid balance. 155
Repayment plans and payment arrangements are valuable for preventing disconnections but have been criticized because they do not help households afford future bills. 156 They also may not be a
feasible solution for lower-income households already struggling to afford bills; of SRP customers with payment arrangements in 2024, 83% were unable to complete the terms of the arrangement. 157 APS reported payment plan completion rates of between 12-32% in 2024. 158 These estimates may be an incomplete picture of customer repayment, however, as electrical utilities are often willing to negotiate new payment plans based on customer request. 159 In such cases, the prior payment agreement may be counted as broken or incomplete, even though customers are still paying towards their outstanding balance. 160
Utilities may also support direct assistance for lower-income households by donating funds earmarked for bill assistance to local community-based organizations. In fiscal years 2022 - 2024, APS and SRP collectively gave a total of over 2.8 million dollars to Wildfire AZ, a non-profit organization that combats poverty through collaborative, community-based initiatives and solutions. 161
$1,200,000
$1,000,000
$800,000
$600,000
$400,000
$200,000
$0
FY 2022-23
2023-24
2022-23
Direct Costs Indirect Costs
2023-24
10 APS and SRP contributions to Wildfire AZ utility assistance funds (Maricopa County agencies only.) Source: Wildfire AZ, 2024.
Wildfire AZ redistributes APS and SRP funds to 16 organizations serving Maricopa County, which use the money to help qualifying households pay their electricity bills. The organizations directly serving residents include cities, non-profit agencies, and faith-based organizations. The average amount of assistance received through Wildfire AZ funds was $545 in FY 2022 - 23 per household and $533 in FY 2023 - 24; as with LIHEAP, this program leaves many lower-income households with a gap between the assistance they receive and affordable energy expenditures. 162 Unlike LIHEAP, it may be possible to stack sources of bill assistance to cover more of electricity costs, although the frequency with which a household may apply and whether multiple sources of assistance can be used simultaneously varies by program. Other direct payment assistance programs include the Salvation Army’s Project SHARE, partially funded by APS, and other programs funded by direct donations to municipalities, faith-based organizations, or non-profits. 163 Many of these programs, however, have either already been or will be impacted by the end of the Emergency Rental Assistance Program (ERAP),
Figure
APS & SRP Contributions to Wildfire AZ (Maricopa County Only)
Homeowners Assistance Fund (HAF), funds from the American Rescue Plan Act (ARPA), and other COVID-19 pandemic-era programs that are now reaching their end. 164 APS reported a 43% reduction in utility bill assistance from 2023 to 2024 due to the conclusion of ERAP and HAF, a trend that will likely continue as local governments are obliged to spend all ARPA funds by December 2026. 165
Disconnection moratoriums
An indirect form of electricity bill assistance is through disconnection moratoriums. Moratoriums are mandates from regulatory bodies that prohibit utilities from shutting off service to households for reasons such as nonpayment. 166 In 2021, the Arizona Corporation Commission (ACC) amended their policy on disconnections to prevent electricity shut offs during extreme heat, after media coverage drew attention to the heat death of a Phoenix resident, whose electricity was shut off over an unpaid bill. 167 Utilities are granted the option of choosing one of two disconnection policies: they must provide electricity service to delinquent residential customers who would otherwise be disconnected either (a) when daily temperatures are above 95 degrees; or (b) between June 1 – October 15. 168
While the ACC does not govern all utilities in Maricopa County, the other large electricity supplier, the Salt River Project (SRP), voluntarily avoid electricity disconnections in July, August, and during National Weather Service-issued Excessive Heat Warnings. 169 Arizona is one of only 19 states with a summertime moratorium designed to protect residents from the dangers of extreme heat. 170 In 2024, 137,774 residential accounts at SRP were eligible for disconnection at some point during 2024 but were not disconnected due to their moratorium; a further 177,748 residential account disconnections were deferred at APS, although this statistic may include households that were eligible for disconnection multiple times throughout the moratorium period. 171
Disconnection moratoriums protect households from losing electricity altogether, but they do not protect from debt accumulation or notification that payments are past due. 172 Utilities vary on whether late fees are assessed during the moratorium period; APS does not charge late fees for nonpayment but SRP does. 173 Repayment plans also differ from provider to provider, with APS enrolling customers automatically in a six-month repayment plan and disconnecting service after that period if the account balance is over $300. 174 SRP also offers a repayment plan, with the full balance due immediately if a repayment is missed in the case of post-paid accounts or, if a customer is on a prepaid account, a certain percentage of future payments automatically credited towards the debt. 175 Evidence is mixed on the effectiveness of disconnection moratoriums as a life-saving measure for residents who would otherwise be left without AC. In Maricopa County, only 6% of all indoor heat death cases from 2006 - 2023 were found in residences where the electricity had been shut off. 176 Far more residents died indoors without working AC (66%). 177 Indoor deaths in June, July, August, and September – the months either covered by a seasonal moratorium or most likely to be above temperature thresholds for shutoffs – did not see a decline after the moratorium went into effect. 178 Isolating the impact of policy change is difficult due to year-to-year variations in seasonal temperatures and other factors that have an impact on heat deaths. 179 Additionally, a longer hot season – such as Maricopa County’s in 2024, where temperatures reached 99F as early as April and as late as the end of October – may make seasonal moratoriums less influential on health outcomes. 180
Although the extent to which disconnection moratoriums prevent heat deaths is unknown, they may buffer the impact of extreme heat and electricity bills by acting as an informal credit line for lowerincome households. 181 A study of cold weather-based disconnection moratoriums found that being able to carry bill balances through the winter season reduced evictions in areas with high energy burdens by 4%, with no corresponding increase in evictions after the moratorium ended. 182 At least in this small, localized study, a disconnection moratorium increased housing stability and financial security by acting as informal credit, without the dangers of high-risk lending options like payday loans. 183
It is currently unclear whether heat-based moratoriums have similar informal credit effects. Faced with continual reminders of an inability to pay, households may still engage in potentially risky strategies, such as reducing AC use or seeking predatory loans. 184 While blanket protections against all disconnections during the COVID-19 pandemic were shown to reduce the number of households who went without other necessities to pay electricity bills in the short term, seasonal moratoriums had less of an effect on household spending. 185 More investigation is needed to understand the effects of Arizona’s disconnection moratoriums for lower-income households.
Weatherization and housing rehabilitation
Unlike bill assistance, weatherization and housing rehabilitation are designed to reduce costs overall by targeting one of the root causes of energy use: poor-quality housing and inefficient appliances. In Arizona, the primary source of weatherization funding is from the federal Weatherization Assistance Program (WAP) through the U.S. Department of Energy, as well as a portion of LIHEAP funds set aside for weatherization. 186 Some utilities also provide supplementary funding to support state programs. 187 In FY 2023, Arizona received a one-time increase in weatherization funds through the Bipartisan Infrastructure Investment Act, bringing the WAP total to $47.5 million, but this additional funding will not continue. 188
Of all household energy assistance programs, weatherization tends to receive the least funding overall. The FY 2024 WAP base allocation for Arizona is under three million dollars and the LIHEAP weatherization set aside is under five million dollars. 189 Other sources of assistance include the Maricopa County Emergency Home Repair program, funded by the American Rescue Plan Act, and city-led housing rehabilitation grants using federal Community Development Block Grants. 190 Unlike LIHEAP and other bill assistance programs, funding sources can be stacked to ensure households can meet their weatherization needs, although different funding sources may have different eligibility requirements. 191 In general, programs often require households to make less than 50 - 80% of the area median income (AMI) or less than 200% FPL to be eligible, although other factors such as unemployment or special hardship may also be prioritized. 192
The diversity of requirements and funding sources makes assessing the accessibility and reach of weatherization and home rehabilitation programs difficult. Nationally, the WAP funds approximately 35,000 projects per year, and Arizona’s WAP has completed more than 26,000 weatherization projects for households since the program started in 1977. 193 The Arizona Department of Housing anticipates serving just under 1,000 households with WAP, LIHEAP, and assorted other funding
sources in FY 2024-25; using the Arizona Department of Housing income threshold of less than $51,640 for a family of three, over 450,000 households are potentially eligible for weatherization in Maricopa County. 194 The number of these households actually in need of weatherization, however, is unknown.
The effectiveness of weatherization at improving indoor temperatures and reducing utility costs for lower-income households is difficult to assess due to the variability in housing quality and available weatherization options. While some reports put yearly household savings in the hundreds of dollars –more, if the cost of missed work and medical care stemming from unhealthy indoor conditions is included – other studies have found that methods used to estimate benefits do not reflect actual savings, which are much lower. 195 Benefits are also not equally available, as renters do not have widespread access to weatherization because they do not own their homes, and landlords are not incentivized to participate due to utility costs being passed on to renters. 196 Lower-income households are more likely to be renters and, therefore, excluded from benefits. 197 In Maricopa County, homeownership is a requirement to access many weatherization and home repair programs, although renters may qualify for some forms of assistance under specific circumstances and with landlords’ approval. 198
Weatherization in the desert climate of Maricopa County presents additional challenges. In hot environments, weatherization does little for health and comfort without the presence of AC. 199 Fortunately, weatherization programs increasingly recognize both the dangers of non-functioning AC and the impacts of indoor heat more broadly. Funding sources such as WAP and programs like Maricopa County’s Emergency Home Repair can be used to repair and update AC units for eligible households. 200 Eligibility requirements for AC assistance are generally based on income, financial hardship, or household composition (such as having a child under the age of 5 or an adult over the age of 60, both of whom are at increased risk from indoor heat). 201 Once effective AC is installed, other forms of weatherization, such as insulation and air duct sealing, can help households reduce electricity costs. 202
One reason for the conflicting evidence on the outcomes of weatherization may be the variety of possible interventions and starting conditions. Weatherization can mean anything from making small modifications, like replacing window and door stripping to larger projects, like replacing windows and doors, adding attic insulation, or upgrading HVAC systems. 203 Prior to the 2022 Consolidated Appropriations Act, many lower-income households may not have been able to take advantage of all weatherization options due to a “deferment.” Deferred weatherization happens when some or all recommended repairs and upgrades are not possible due to the condition of the home. 204 For instance, an energy audit might find that a household would benefit from a new roof-mounted AC unit, but the home would need a new roof first. While some state-level weatherization programs leveraged additional funding sources to reduce deferrals or referred households to other assistance programs, these stopgap measures made the process more complex. 205 In 2022, program rules were changed so that WAP funding could be used to address these additional concerns, although deferment is still a possibility in some cases. 206 Combined with other forms of assistance, weatherization programs – particularly in conjunction with home repair and rehabilitation - reduce
the need for future interventions and improve living conditions for those most affected by poorquality housing, such as lower-income households and racial and ethnic minorities. 207
MYTH #5: THERE IS NOTHING WE CAN DO.
The public perception of Maricopa County is often one of unstoppable and accelerating heat driven by human behavior, urban development, and climate change. 208 Heat-related deaths, including indoor deaths, are both a fundamental component of this narrative and a tragic reality. 209 Extreme heat, however, is not an inevitable outcome, and neither are its deadly consequences. There are many effective strategies for decreasing indoor heat deaths and improving residents’ physical and financial health while strengthening quality of life.
Research the impacts of electricity costs on lower-income households
While research has been conducted on the consequences of high utility burdens for lower -income households, much of the information currently available does not consider the specific social and environmental circumstances surrounding those burdens. Maricopa County therefore represents both a unique research context and an opportunity for increasing our understanding of how extreme heat impacts electricity costs and the tradeoffs and strategies households use for managing not just electric bills and electricity consumption but the threat of extreme heat in indoor environments. This deeper context is critical for ensuring households are receiving assistance that meets their needs and for informing policies around heat and utility costs that protect residents’ financial and physical well-being.
One area ripe for further investigation is the short- and long-term effects of summertime electricity disconnection moratoriums on Maricopa County households, partially because disconnection moratoriums are relatively new. By partnering with electrical utilities to analyze seasonal moratorium disconnection data and trends in bill amounts, payment arrangements, and disconnections outside the moratorium period, the consequences of Arizona’s summertime disconnection policies could be better documented. This high-level quantitative data could be paired with interviews with lower-income households and utility bill assistance providers to deepen our understanding of how moratoriums impact household financial decisions and tradeoffs as well as the capacity and strategic planning of assistance programs.
Share data and coordinate between stakeholders
While outdoor heat-related deaths are the largest share of all heat-related deaths in Maricopa County and, as such, receive the most attention from local governments and other actors, indoor heat cannot be ignored as both a health hazard and a proxy for other critical issues, such as future housing insecurity. Maricopa County has extensive heat death surveillance through the Office of the Medical Examiner and the Public Health Department, but the less deadly impacts – and causes – of indoor heat are not as well documented as the causes and impacts of outdoor heat death. As noted above, indoor heat has a range of possible causes, including unaffordable electricity bills, poor quality housing, broken or inefficient AC, and disparate or insufficient assistance programs. The outcomes of indoor heat equally touch on many aspects of resident life: financial insecurity, shortand long-term health issues, utility disconnections, housing instability, and even death. Many (though
not all) of these causes and outcomes are tracked by local governments and community-based organizations, yet they are rarely analyzed through the lens of indoor heat. Data that could help us better understand heat impacts, such as estimates of the prevalence of heat-related illness in residential environments, are drawn from multiple sources at various timescales, making it more difficult to form a coherent picture of the risks of indoor heat. A more collaborative approach to the problem of indoor heat that brings together federal agencies, local and state governments, regional government associations, and community-based organizations would lay the groundwork for meaningful intervention.
Cool the outdoor environment
AC use as a means to manage indoor heat is ultimately driven by external environmental factors, including outdoor temperatures, land use, shade coverage, and building type and materials. 210 Efforts to cool urban environments, therefore, not only benefit residents by creating healthier and more comfortable spaces outside their homes but can also reduce indoor temperatures, electricity costs, and even increase the efficiency of cooling systems. 211 At the same time, energy efficiency improvements and weatherization assistance targeting indoor heat can also improve nearby outdoor environments, by reducing AC usage, which generates waste heat that is vented outside the home. While many cities in Maricopa County are already working to increase comfort and reduce disparities in outdoor temperature between neighborhoods, specifically tracking the effects of outdoor heat reductions strategies on indoor heat and electricity use can help illuminate connections between intervention programs. 212 Further, by including the effects of weatherization and other efficiency upgrades on outdoor as well as indoor heat, programs such as LIHEAP, WAP, and home rehabilitation can be better integrated into existing efforts to document these programs’ impacts more fully.
Increase funding to indoor heat mitigation
While Maricopa County residents may have access to important programs, such as bill assistance, weatherization, home repair, and other forms of indoor heat assistance, available data suggests that these programs do not have enough resources to meet household needs. Although many cities in Maricopa County, and the county as a whole, are facing budget reductions, increasing funding to assistance programs that directly or indirectly address indoor heat may save on public expenditures in the long term. 213 A nationwide study of heat-related hospitalizations from 2001 – 2010 found that the mean cost of hospitalization per incident was $5,359, and that healthcare costs have risen more than 200% since 2000. 214 Even using the 2001 – 2010 cost estimate, preventing the 885 hospitalizations caused by heat in residential environments in Maricopa County would have saved 4.7 million dollars in 2024 alone. 215
In addition to health-related cost savings, heat mitigation through utility payment assistance may also have positive effects on housing stability. If extending additional assistance or increasing repayment periods to households behind on utilities created a 4% reduction in evictions, as one study found, this would have led to approximately 3,500 fewer evictions in Maricopa County in 2024. 216 Since indoor heat and unaffordable electric bills are so closely related to residents’ health, housing, and other essential aspects of life, it is possible that smaller, less costly interventions (such as
electricity bill forgiveness) before households reach a crisis phase of hospitalization, disconnection, or eviction offer substantial savings when compared with assistance offered at the point of crisis.
Indoor heat is a preventable problem – and we can fix it.
The data and studies reviewed in this report highlight the physical, mental, and financial health impacts of indoor heat on lower-income households in both the short- and long-term. Nowhere is this research more applicable than Maricopa County, home to the hottest large city in the United States and its more than 20 neighboring municipalities in the county. 217 Heat in Maricopa County is an increasingly pressing issue as urban heat islands intensify and temperatures increase and, if current trends continue, may bring additional indoor heat deaths and higher electricity bills.
These outcomes, however, are not predetermined. Existing utility payment assistance and other potentially life-saving programs, such as emergency AC replacement and weatherization, create pathways for residents with access to fewer resources to achieve safe, comfortable homes. Heat mitigation and resilience projects aimed at reducing outdoor temperatures can create environments where less energy use is required to keep homes cool. While existing efforts are not sufficient to cope with the scale of indoor heat in Maricopa County, these programs, combined with increased situational awareness and collaboration between stakeholders, offer scalable blueprints for moving forward.
Endnotes
1 Dunn, Chris “Phoenix’s Relentless Heat: A Staggering 70 Days Over 110 Degrees, While Other Cities Don’t Even Hit 100,” 12 News, June 11, 2025, https://www.12news.com/article/weather/extreme-weather/surprising-comparison-betweenphoenixs-extreme-heat-other-big-cities-america/75-25a728bd-3fc5-4dcd-bbe7-396722d8c44e.
2 “Urban Heat Island Intensity”, Climate Central, last modified June 24, 2025, https://climatecentral.observablehq.cloud/urban-heat-hot-spots/conus-map.
3 Putnam, Hana, David M. Hondula, Aleš Urban, Vjollca Berisha, Paul Iñiguez, and Matthew Roach, "It’s not the Heat, it’s the Vulnerability: Attribution of the 2016 Spike in Heat-associated Deaths in Maricopa County, Arizona." Environmental Research Letters 13, no. 9 (2018): 094022. doi:10.1088/1748-9326/aadb44.
4 Cruz, Kylee, “Pheonix Reaches 110 Degrees or Hotter for 70 Days This Year,” Arizona Family, Oct. 8, 2024, https://www.azfamily.com/2024/10/08/phoenix-reaches-110-degrees-or-hotter-70-days-this-year/.
5 Iverson, Sally Ann, Aaron Gettel, Carla P. Bezold, et al, "Heat-associated Mortality in a Hot Climate: Maricopa County, Arizona, 2006-2016." Public Health Reports 135, no. 5 (2020): 631-63; Rajput, Mayuri, Godfried Augenbroe, Brian Stone, et al, "Heat Exposure During a Power Outage: A Simulation Study of Residences Across the Metro Phoenix Area.” Energy and Buildings 259 (2022): 111605.
6 Maricopa County Public Health Department, 2025, dataset provided in response to request.
7 Maricopa County Public Health Department, 2025, dataset provided in response to request.
8 “Resident Population in Phoenix-Mesa-Scottsdale, AZ (MSA) (PHXPOP)”, Federal Reserve Bank of St. Louis, accessed March 14, 2025, https://fred.stlouisfed.org/series/PHXPOP.
9 Maricopa County Public Health Department, 2025, dataset provided in response to request.
10 Maricopa County Public Health Department, 2025, dataset provided in response to request.
11 Maricopa County Public Health Department, 2025, dataset provided in response to request.
12 Maricopa County Public Health Department, 2025, dataset provided in response to request.
13 Maricopa County Public Health Department, 2025, dataset provided in response to request.
14 “Heat-Related Illnesses and How to Avoid Them,” Maricopa County Public Health Department, accessed June 6, 2025, https://www.maricopa.gov/2458/Prevent-Heat-related-Illness.
15 Bazille, Céline, Bruno Megarbane, Dan Bensimhon, et al, "Brain Damage After Heat Stroke." Journal of Neuropathology & Experimental Neurology 64, no. 11 (2005): 970-975; Geng, Y., Q. Ma., Y. Liu., et al, “Heatstroke Induces Liver Unjury via IL-1β and HMGB1-induced Pyroptosis.” Journal of Hepatology 62 no. 3 (2015), 622-633; Leon, Lisa R., and Abderrezak Bouchama. "Heat Stroke." Comprehensive Physiology 5, no. 2 (2015): 611-647.
16 Tham, Stephanie, Ross Thompson, Owen Landeg, K. A. Murray, and Thomas Waite, "Indoor Temperature and Health: A Global Systematic Review," Public Health 179 (2020): 9-17. doi:10.1016/j.puhe.2019.09.005.
17 Cyril Hampo, Chima, Leah H. Schinasi, and Simi Hoque, "Surviving Indoor Heat Stress in United States: A Comprehensive Review Exploring the Impact of Overheating on the Thermal Comfort, Health, and Social Economic Factors of Occupants." Heliyon 10, no. 3 (2024) doi:10.1016/j.heliyon.2024.e25801; Wondmagegn, Berhanu Y., Jianjun Xiang, Susan Williams, Dino Pisaniello, and Peng Bi, "What do we Know about the Healthcare Costs of Extreme Heat Exposure? A Comprehensive Literature Review," Science of the Total Environment 657 (2019): 608-618. doi:10.1016/j.scitotenv.2018.11.479.
18 “ADHS Recommendations and Findings for the Arizona Extreme Heat Preparedness Plan: Heat Resilience Shaping Arizona’s Future,” Arizona Department of Health Services, revised July 9, 2024, https://www.azdhs.gov/documents/preparedness/epidemiology-disease-control/extreme-weather/heatpreparedness/azdhs-recommendations-and-findings.pdf.
19 “Heat-Related Illness (HRI) Emergency Department and Inpatient Admissions (Hospitalizations) 2020-2024, Arizona Residents and Non-Residents,” Arizona Department of Health Services, accessed June 25, 2025, https://www.azdhs.gov/documents/preparedness/epidemiology-disease-control/extreme-weather/pubs/heat-relatedillness-emergency-department-and-inpatient-admissions-in- arizona-by-year-2020-2024.pdf?v=20250517; “Maricopa County Heat Morbidity Report 2006-2017,” Maricopa County Public Health, accessed March 11, 2025, https://www.maricopa.gov/ArchiveCenter/ViewFile/Item/1373; “2018-2022 Heat Morbidity Report,” Maricopa County Department of Public Health Epidemiology and Informatics, July 2024, https://www.maricopa.gov/ArchiveCenter/ViewFile/Item/5855
20 “Heat-Related Illness (HRI) Emergency Department and Inpatient Admissions (Hospitalizations) 2020-2024, Arizona Residents and Non-Residents,” Arizona Department of Health Services, accessed June 25, 2025, https://www.azdhs.gov/documents/preparedness/epidemiology-disease-control/extreme-weather/pubs/heat-relatedillness-emergency-department-and-inpatient-admissions-in- arizona-by-year-2020-2024.pdf?v=20250517; “Maricopa County Heat Morbidity Report 2006-2017,” Maricopa County Public Health, accessed March 11, 2025, https://www.maricopa.gov/ArchiveCenter/ViewFile/Item/1373; “2018-2022 Heat Morbidity Report,” Maricopa County Department of Public Health Epidemiology and Informatics, July 2024, https://www.maricopa.gov/ArchiveCenter/ViewFile/Item/5855.
21 “Maricopa County Heat Morbidity Report 2006-2017,” Maricopa County Public Health, accessed March 11, 2025, https://www.maricopa.gov/ArchiveCenter/ViewFile/Item/1373; “2018-2022 Heat Morbidity Report,” Maricopa County Department of Public Health Epidemiology and Informatics, July 2024, https://www.maricopa.gov/ArchiveCenter/ViewFile/Item/5855.
22 Schmeltz, Michael T., Grace Sembajwe, Peter J. Marcotullio, et al, "Identifying Individual Risk Factors and Documenting the Pattern of Heat-related Illness Through Analyses of Hospitalization and Patterns of Household Cooling," PLoS One 10, no. 3 (2015): e011895. doi:10.1371/journal.pone.0118958; “Who is Most at Risk to Extreme Heat?” Heat.gov, National
Integrated Heat Health Information System, accessed March 11, 2025, https://www.heat.gov/pages/who-is-at-risk-toextreme-heat; Chow, Winston T.L., Wen-Ching Chuang, and Patricia Gober, "Vulnerability to Extreme Heat in Metropolitan Phoenix: Spatial, Temporal, and Demographic Dimensions," The Professional Geographer 64, no. 2 (2012): 286-302. doi:10.1080/00330124.2011.600225.
23 Gronlund, Carina J., "Racial and socioeconomic Disparities in Heat-Related Health Effects and Their Mechanisms: A Review," Current Epidemiology Reports 1, no. 3 (2014): 165-173. doi:10.1007/s40471-014-0014-4; Harlan, Sharon L., Anthony J. Brazel, Lela Prashad, William L. Stefanov, and Larissa Larsen, "Neighborhood Microclimates and Vulnerability to Heat Stress," Social Science & Medicine 63, no. 11 (2006): 2847-2863. doi:10.1016/j.socscimed.2006.07.030.
24 Maricopa County Public Health Department, 2025, dataset provided in response to request.
25 Maricopa County Public Health Department, 2025, dataset provided in response to request.
26 Maricopa County Public Health Department, 2025, dataset provided in response to request.
27 Maricopa County Public Health Department, 2025, dataset provided in response to request.
28 Iverson, Sally Ann, Aaron Gettel, Carla P. Bezold, et alm "Heat-Associated Mortality in a Hot Climate: Maricopa County, Arizona, 2006-2016," Public Health Reports 135, no. 5 (2020): 631-639. doi:10.1177/0033354920938006.
29 Eisenman, David P., Holly Wilhalme, Chi-Hong Tseng, et al, "Heat Death Associations With the Built Environment, Social Vulnerability and Their Interactions with Rising Temperature," Health & Place 41 (2016): 89-99. doi:10.1016/j.healthplace.2016.08.007; Harlan, Sharon L., Juan H. Declet-Barreto, William L. Stefanov, and Diana B. Petitti, "Neighborhood Effects on Heat Deaths: Social and Environmental Predictors of Vulnerability in Maricopa County, Arizona," Environmental Health Perspectives 121, no. 2 (2013): 197-204. doi:10.1289/ehp.1104625; Chow, Winston T.L., Wen-Ching Chuang, and Patricia Gober, "Vulnerability to Extreme Heat in Metropolitan Phoenix: Spatial, Temporal, and Demographic Dimensions," The Professional Geographer 64, no. 2 (2012): 286-302. doi:10.1080/00330124.2011.600225.
30 “Median Age by Sex (White Alone, Not Hispanic or Latino),” American Community Survey 2024, 1-Year Estimate Table Creator, US Census Bureau, https://data.census.gov/table/ACSDT1Y2024.B01002H?t=Race+and+Ethnicity; “Median Age by Sex (Hispanic or Latino),” American Community Survey 2024 1-Year Estimate Table Creator, US Census Bureau, https://data.census.gov/table/ACSDT1Y2024.B01002I?t=Race+and+Ethnicity
31 “2023 Phoenix – Heating, Air Conditioning, and Appliances – All Occupied Units,” American Housing Survey (AHS) Table Creator, US Census Bureau, https://www.census.gov/programssurveys/ahs/data/interactive/ahstablecreator.html?s_areas=38060&s_year=2023&s_tablename=TABLE3&s_bygroup1=1&s_b ygroup2=1&s_filtergroup1=1&s_filtergroup2=1; “2023 Phoenix – General Housing Data – All Occupied Units,” American Housing Survey (AHS) Table Creator, US Census Bureau, https://www.census.gov/programssurveys/ahs/data/interactive/ahstablecreator.html?s_areas=38060&s_year=2023&s_tablename=TABLE1&s_bygroup1=1&s_b ygroup2=1&s_filtergroup1=1&s_filtergroup2=1.
32 Gronlund, Carina J., "Racial and Socioeconomic Disparities in Heat-related Health Effects and Their Mechanisms: A Review," Current Epidemiology Reports 1, no. 3 (2014): 165-173. doi:10.1007/s40471-014-0014-4.
33 Gronlund, Carina J., "Racial and Socioeconomic Disparities in Heat-related Health Effects and Their Mechanisms: A Review," Current Epidemiology Reports 1, no. 3 (2014): 165-173. doi:10.1007/s40471-014-0014-4; Wright, Mary K., David M. Hondula, Paul M. Chakalian et al, "Social and Behavioral Determinants of Indoor Temperatures in Air-Conditioned Homes," Building and Environment 183 (2020): 107187. doi:10.1016/j.buildenv.2020.107187; Samuelson, Holly, Amir Baniassadi, Anne Lin, et al, "Housing as a Critical Determinant of Heat Vulnerability and Health," Science of The Total Environment 720 (2020): 137296. doi:10.1016/j.scitotenv.2020.137296.
34 Snow, Anita, “Phoenix Hits Record October Highs During Heat Wave Before Wrapping up its Warm Season,” Associated Press (AP), October 18, 2024, https://apnews.com/article/southwest-extreme-heat-record-highs5dad0ae8a049dc00d5d9061da24e1377.
35 “2023 Climate Year in Review for Phoenix, Yuma, and El Centro,” National Weather Service, NOAA, January 2, 2024, https://www.weather.gov/psr/yearinreview2023
36 Davis-Young, Katherine, “The Hottest Overnight Temperatures in Phoenix History Raise Public Health Concerns,” KJZZ, July 28, 2023, https://www.kjzz.org/2023-07-28/content-1853326-hottest-overnight-temperatures-phoenix-history-raisepublic-health-concerns; Davis-Young, Katherine, “Phoenix Heat Isn’t Ceasing at Night Either,” NPR, August 23, 2024, https://www.npr.org/2024/08/23/nx-s1-5055858/phoenix-heat-isnt-ceasing-at-night-either; Cruz, Kylee, “Pheonix Reaches 110 Degrees or Hotter for 70 Days This Year,” Arizona Family, Oct. 8, 2024, https://www.azfamily.com/2024/10/08/phoenix-reaches-110-degrees-or-hotter-70-days-this-year/; “Minimum Temperature,” National Weather Service, accessed June 25, 2025, https://forecast.weather.gov/glossary.php?word=minimum%20temperature.
37 Whalen, Jeanne, “Arizona Voters at Breaking Point Over Cost of Electricity,” The Wall Street Journal, October 8, 2024, https://www.wsj.com/politics/policy/arizona-electricity-bills-trump-election-2024-b665468c
38 “2023 National – Housing Costs – All Occupied Units,” American Housing Survey (AHS) Table Creator, US Census Bureau, https://www.census.gov/programssurveys/ahs/data/interactive/ahstablecreator.html?s_areas=00000&s_year=2023&s_tablename=TABLE10&s_bygroup1=1&s_ bygroup2=1&s_filtergroup1=1&s_filtergroup2=1.
39 Dana, Joe, “Arizona’s Regulated Electric Companies Charged More Than 38 States,” 12News/NBC, October 31, 2024, https://www.12news.com/article/news/local/valley/arizonas-regulated-electric-companies-charged-more-than-38-statesindependent-analysis-consumer-watchdog/75-c6fd963b-5755-461d-aa14-4ed13bd4d5e4.
40 Sepulveda, Laura Daniella, “This is How High the Average Arizona Electric Bill is. How Does Yours Compare?” AZCentral/The Arizona Republic, July 15, 2024, https://www.azcentral.com/story/money/business/consumers/2024/07/15/arizona-electric-bill-costs/74342966007/; https://www.texaselectricityratings.com/resources/highest-household-electricity-bills-2024; “Arizona Residents Expected
to Pay 75% Increase in Electricity Costs this Summer,” inbusinessPHX.com, July 19, 2024, https://inbusinessphx.com/economy-trends/arizona-residents-expected-to-pay-75-increase-in-electricity-costs-thissummer
41 “Residential Energy Consumption Survey (RECS) Dashboard,” EIA, US Energy Information Administration, August 10, 2023, https://experience.arcgis.com/experience/cbf6875974554a74823232f84f563253.
42 “Residential Energy Consumption Survey (RECS) Dashboard,” EIA, US Energy Information Administration, August 10, 2023, https://experience.arcgis.com/experience/cbf6875974554a74823232f84f563253.
43 “Avoid Summer Bill Surprises with SRP Budget Billing,” Salt River Project (SRP), accessed March 11, 2025, https://www.srpnet.com/account/electric/manage-bill/budget-billing-residential#2; “Budget Billing,” Arizona Public Service (APS), accessed March 11, 2025, https://www.aps.com/en/Residential/Billing-and-Payment/Budget-Billing.
44 “Household Pusle Survey: Measuring Emergent Social and Economic Matters Facing U.S. Households,” US Census Bureau, February 8, 2024, https://www.census.gov/programs-surveys/household-pulse-survey.html.
45 “Unable to Pay Energy Bill: January 9 – February 5 2024,” Household Pulse Survey, US Census Bureau, 2024, https://www.census.gov/datatools/demo/hhp/#/?s_metro=38060&areaSelector=310&measures=ENERGYBILL&periodSelector=1&periodFilter=8,7,6,5,4,3, 2,1; “Unable to Pay Energy Bill: Week 53 (January 4-16, 2023),” Household Pulse Survey, US Census Bureau, 2023, https://www.census.gov/data-tools/demo/hhpweeks/#/?measures=ENERGYBILL&s_state=&s_metro=38060&areaSelector=msa&periodSelector=53
46 “Energy Burdens in Phoenix,” American Council for Energy-Efficient Economy, September 2020, https://www.aceee.org/sites/default/files/pdfs/aceee-01_energy_burden_-_phoenix.pdf.
47 “Data Update: City Energy Burdens,” ACEEE Policy Brief, September 2024, https://www.aceee.org/sites/default/files/pdfs/data_update_-_city_energy_burdens_0.pdf.
48 “Low Income Energy Affordability Data (LEAD) Tool,” U.S Department of Energy, accessed March 11, 2025, https://www.energy.gov/scep/slsc/lead-tool; “Energy Burdens in Phoenix,” American Council for Energy-Efficient Economy, September 2020, https://www.aceee.org/sites/default/files/pdfs/aceee-01_energy_burden_-_phoenix.pdf
49 “Low Income Energy Affordability Data (LEAD) Tool,” U.S Department of Energy, accessed March 11, 2025, https://www.energy.gov/scep/slsc/lead-tool.
50 “Home Energy Affordability Gap,” Fisher, Sheehan & Colton, Public Finance & General Economics, accessed March 11, 2025, http://www.homeenergyaffordabilitygap.com/03a_affordabilityData.html
51 “Home Energy Affordability Gap,” Fisher, Sheehan & Colton, Public Finance & General Economics, accessed March 11, 2025, http://www.homeenergyaffordabilitygap.com/03a_affordabilityData.html.
52 “Data Update: City Energy Burdens,” ACEEE Policy Brief, September 2024, https://www.aceee.org/sites/default/files/pdfs/data_update_-_city_energy_burdens_0.pdf.
53 “Quarter 1 Termination Report,” Arizona Public Service (APS), April 15, 2024; ““Quarter 2 Termination Report,” Arizona Public Service (APS), July 15, 2024; “Quarter 3 Termination Report,” Arizona Public Service (APS), October 15, 2024; “Quarter 4 Termination Report,” Arizona Public Service, January 15, 2025; Salt River Project (SRP), 2025, dataset provided in response to request.
54 Salt River Project (SRP), 2025, dataset provided in response to request.
55 “Quarter 1 Termination Report,” Arizona Public Service (APS), April 15, 2024; ““Quarter 2 Termination Report,” Arizona Public Service (APS), July 15, 2024; “Quarter 3 Termination Report,” Arizona Public Service (APS), October 15, 2024; “Quarter 4 Termination Report,” Arizona Public Service (APS), January 15, 2025.
56 Solari/211, 2024, dataset provided in response to request.
57 Solari/211, 2024, dataset provided in response to request.
58 Davis, Tony, “Rate Increases for TEP, APS Electricity Accelerated in Recent Years,” Tucson.com/Arizona Daily Star, November 16, 2024, https://tucson.com/news/state-regional/government-politics/elections/arizona-corporationcommission-candidates-election-2024-tucson-electric-power-utilty-rate-increases/article_6ad61f10-8811-11ef-8054735daaa6ec81.html.
59 Ryman, Anne, “Utilities Can Now Seek Annual Rate Increases,” ABC15 Arizona, December 3, 2024, https://www.abc15.com/news/local-news/corporation-commission-may-change-how-utility-companies-can-request-rateincreases
60 Cong, Shuchen Destenie Nock, Yueming Lucy Qiu, and Bo Xing, “Unveiling Hidden Energy Poverty Using the Energy Equity Gap,” Nature Communications 13 (2022): 2456. doi:10.1038/s41467-022-30146-5.
61 “2020 RECS Survey Data,” Residential Energy Consumption Survey (RECS), EIA, January 2024, https://www.eia.gov/consumption/residential/data/2020/index.php?view=microdata
62 Kontokosta, Constantine E., Vincent J. Reina, and Bartosz Bonczak, "Energy Cost Burdens for Low-Income and Minority Households: Evidence from Energy Benchmarking and Audit Data in Five U.S. Cities," Journal of the American Planning Association 86, no. 1 (2020): 89-105. doi:10.1080/01944363.2019.1647446.
63 Minasian-Koncewicz, Stephanie, “How Much Do Double-Pane Windows Cost? (2025 Guide),” This Old House, February 6, 2025, https://www.thisoldhouse.com/windows/double-pane-windows-cost.
64 Minasian-Koncewicz, Stephanie, “How Much Do Double-Pane Windows Cost? (2025 Guide),” This Old House, February 6, 2025, https://www.thisoldhouse.com/windows/double-pane-windows-cost
65 “2020 RECS Survey Data,” Residential Energy Consumption Survey (RECS), EIA, January 2024, https://www.eia.gov/consumption/residential/data/2020/index.php?view=microdata.
66 Davis-Young, Katherine, “Many in Arizona Struggle With Utility Bills and AC Repairs. Here’s Where to Get Help,” KJZZ, May 28, 2024, https://www.kjzz.org/2024-05-28/content-1881194-many-arizona-struggle-utility-bills-and-ac-repairs-hereswhere-get-help; Beach, Kenzie, “Air Conditioning Units Breaking Down Ahead of Arizona’s Summer,” FOX10 Phoenix, June
9, 2024, https://www.fox10phoenix.com/news/air-conditioning-units-breaking-down-ahead-arizonas-summer; “How Metro Phoenix Residents can get Money to Repair Their AC,” Arizona Family, July 21, 2023, https://www.azfamily.com/2023/07/21/how-metro-phoenix-residents-can-get-help-repairing-their-ac/; Herrera, Jack, “Her Bedroom was 100 Degrees During Phoenix Heat Wave – and her A/C was out,” The Los Angeles Times, August 2, 2023, https://www.latimes.com/world-nation/story/2023-08-03/as-the-planet-warms-can-air-conditioning-save-us; Caltabiano, David, “Phoenix Woman Living Without AC for Two Months Receives Free Unit from Parker and Sons,” Arizona Family, July 18, 2023, https://www.azfamily.com/2023/07/18/phoenix-woman-living-without-ac-two-months-receives-free-unit-parkersons/
67 Mudge, Lachlan, and Wasim Saman, "The Impact of Air Conditioning System Upgrades on Energy Use and Comfort in Lowincome Housing," Energy Procedia 121 (2017): 26-32. doi: 10.1016/j.egypro.2017.08.004; Sparks, Veronic, “How Much Does HVAC Replacement Cost? [2025 Data],” Angi, August 27, 2024, https://www.angi.com/articles/insider-s-price-guide-newheating-and-cooling-system.htm.
68 Ruiz, Raphael Romero, “Listen up, Arizona Renters: Here’s What Your Landlord Must do if Your AC Isn’t Working,” AZCentral/The Arizona Republic, August 28, 2024, https://www.azcentral.com/story/news/local/phoenix/2024/08/28/arizona-renter-ac-laws/74970801007/.
69 Arizona State Legislature, Landlord to maintain fit premises, Arizona Revised Statutes 33-1324, https://www.azleg.gov/viewdocument/?docName=https://www.azleg.gov/ars/33/01324.htm; Arizona State Legislature, Material affect on health and safety of occupants, Arizona Revised Statutes, 9-1303, https://www.azleg.gov/viewdocument/?docName=https://www.azleg.gov/ars/9/01303.htm; “Landlord/Tenant Disputes & Eviction: Questions about Air Conditioning (A/C) Issues,” AZcourts.gov, Arizona Judicial Branch, https://www.azcourts.gov/legalinfohub/Legal-Info-FAQs/Air-Conditioning-A-C-Issues.
70 Carlucci, Salvatore, and Lorenzo Pagliano. "A Review of Indices for the Long-Term Evaluation of the General Thermal Comfort Conditions in Buildings," Energy and Buildings 53 (2012): 194-205.
71 “What to Do if Your Air Conditioning is Broken: Tenants’ Rights, Responsibilities and Remedies,” Community Legal Services, Inc., 2017, https://www.phoenix.gov/nsdsite/Documents/CLS%20AC%20Packet%202017.pdf; “What to Do If your Air Conditioning (A/C) Is Broken?,” AZcourts.gov, Arizona Judicial Branch, 2025, https://www.azcourts.gov/selfservicecenter/Landlord-Tenant-Disputes-Eviction-Actions/Air-Conditioning-A-C-Issues/Whatto-do-if-your-air-conditioning-A-C-is-broken
72 “Arizona Residential Landlord and Tenant Act,” Arizona Department of Housing, May 2023, https://housing.az.gov/sites/default/files/2024-07/Landlord_Tenant_Act_May-2023_1.pdf; Amy Cutler, “Phoenix Officials Rarely Fine Landlords Despite Rise in Broken AC Unit Complaints,” Arizona Family, July 27, 2023, https://www.azfamily.com/2023/07/28/phoenix-officials-rarely-fine-landlords-despite-rise-broken-ac-unit-complaints/; Vandell, Perry, Vivan Barrett and L.M. Boyd, “’Serious Health Risk’: Phoenix Tenants Continue to Deal With Faulty AC Units Close to Deadline,” AZCentral/The Arizona Republic, July 26, 2024, https://www.azcentral.com/story/news/local/phoenix-breaking/2024/07/25/apartment -complex-still-face-ineffective-acunits-as-phoenix-apartment-complex-faces-repair-deadline/74537358007/; Marshall, Micaela, “Phoenix Apartment Complex Without A/C for More Than a Month, Wait Time for New Chiller is 20 Weeks,” Arizona Family, July 17, 2024, https://www.azfamily.com/2024/07/18/phoenix-apartment-complex-without-ac-more-than-month-wait-time-new-chilleris-20-weeks/; Golightly, Chase, “’It’s so hot in Here’: Tempe Tenants Claim Apartment Complex’s Air Conditioning Hasn’t Worked for Weeks,” 12News/NBC, June 6, 2024, https://www.12news.com/article/news/local/heatbeat/tempe-tenantsclaim-apartment-complexs-air-conditioning-hasnt-worked-for-weeks/75-08e18083-dc13-4ab2-8436-e537681f67ee; “’It’s Been Hell Living Here’: Mesa Apartment Without AC for More Than a Month, Tenants Claim,” 12News/NBC, August 9, 2024, https://www.12news.com/article/news/local/heatbeat/mesa-apartment-without-ac-for-more-than-month-tenantsclaim/75-ba7f8d1d-c80d-4494-a856-c80b1509a86c
73 Gentry, Katie, Nick Carroll, Paige Riddle, Melina Cruz, and Ellen O’Brien, “History of Housing,” accessed March 11, 2025, https://storymaps.arcgis.com/stories/5ac724a77c6f4fb2a2a83bc20d866c66; Dialesandro, John, Noli Brazil, Stephen Wheeler, and Yaser Abunnasr, "Dimensions of Thermal Inequity: Neighborhood Social Demographics and Urban Heat in the Southwestern US," International Journal of Environmental Research and Public Health 18, no. 3 (2021): 941. doi:10.3390/ijerph18030941; G. Jenerette, Darrel, Sharon L. Harlan, William L. Stefanov, and Chris A. Martin, "Ecosystem Services and Urban Heat Riskscape Moderation: Water, Green Spaces, and Social Inequality in Phoenix, USA," Ecological Applications 21, no. 7 (2011): 2637-2651. doi:10.1890/10-1493.1; Harlan, Sharon L., Anthony J. Brazel, Lela Prashad, William L. Stefanov, and Larissa Larsen, "Neighborhood Microclimates and Vulnerability to Heat Stress," Social Science & Medicine 63, no. 11 (2006): 2847-2863. doi:10.1016/j.socscimed.2006.07.030; Miller, Elise, “Connecting the Dots Between Redlining and Heat Resilience in Phoenix,” ASU News, Arizona State University, June 22, 2021, https://news.asu.edu/20210622-connecting-dots-between-redlining-and-heat-resilience-phoenix
74 Wright, Mary K., David M. Hondula, Paul M. Chakalian et al, "Social and Behavioral Determinants of Indoor Temperatures in Air-Conditioned Homes," Building and Environment 183 (2020): 107187. doi:10.1016/j.buildenv.2020.107187.
75 Sepulveda, Laura Daniella, “These are the Cheapest Places to Live Comfortably in the US. How Does Arizona Rank?” AZCentral/The Arizona Republic, March 20, 2024, https://www.azcentral.com/story/news/2024/03/12/how-much-does-itcost-to-live-in-arizona-comfortably/72946158007/
76 “Table DP03: Selected Economic Characteristics,” US Census Bureau, American Community Survey 5 Year Data, 2023, https://data.census.gov/table/ACSDP5Y2023.DP03?q=DP03&g=310XX00US38060.
77 “Federal Poverty Level (FPL),” HealthCare.gov, accessed March 11, 2025, https://www.healthcare.gov/glossary/federalpoverty-level-fpl/
78 “2023 Phoenix – Income Characteristics – All Occupied Units,” American Housing Survey (AHS) Table Creator, US Census Bureau, https://www.census.gov/programs-
surveys/ahs/data/interactive/ahstablecreator.html?s_areas=38060&s_year=2023&s_tablename=TABLE9&s_bygroup1=1&s_b ygroup2=1&s_filtergroup1=1&s_filtergroup2=1; Lillian Kilduff, “How Poverty in the United States Is Measured and Why It Matters,” Population Reference Bureau, January 21, 2022, https://www.prb.org/resources/how-poverty-in-the-unitedstates-is-measured-and-why-it-matters/
79 Han, Soojin, Ming Hu, Xue Gao et al, "Energy Burden and Mental Health: A National Study in the United States," Science of The Total Environment 955 (2024): 176796. doi:10.1016/j.scitotenv.2024.176796; Brown, Marilyn A., Anmol Soni, Melissa V. Lapsa, Katie Southworth, and Matt Cox, "High Energy Burden and Low-income Energy Affordability: Conclusions From a Literature Review," Progress in Energy 2, no. 4 (2020): 042003. doi: 10.1088/2516-1083/abb954; Hernández, Diana and Eva Siegel, "Energy Insecurity and its ill Health Effects: a Community Perspective on the Energy-Health Nexus in New York City," Energy Research & Social Science 47 (2019): 78-83. doi:10.1016/j.erss.2018.08.011; Hernández, Diana and Jennifer Laird, "Surviving a Shut-off: US Households at Greatest Risk of Utility Disconnections and how They Cope," American Behavioral Scientist 66, no. 7 (2022): 856-880. doi:10.1177/00027642211013401.
80 Bohr, Jeremiah, and Anna C. McCreery, "Do Energy Burdens Contribute to Economic Poverty in the United States? A Panel Analysis," Social Forces 99, no. 1 (2020): 155-177. doi:10.1093/sf/soz131; Hatch, Megan E., and Michelle Graff, “Housing Costs are not a Monolith: The Association Between Neighborhood Energy Burdens and Eviction Filing Rates,” Cities 150: 104995. doi:10.1016/j.cities.2024.104995.
81 Dorsey-Palmateer, Reid, "Outsized Impacts of Residential Energy and Utility Costs on Household Financial Distress," Economics Bulletin 40, no. 4 (2020): 3061-3070, https://www.accessecon.com/Pubs/EB/2020/Volume40/EB-20-V40-I4P266.pdf
82 Hatch, Megan E., and Michelle Graff, “Housing Costs are not a Monolith: The Association Between Neighborhood Energy Burdens and Eviction Filing Rates,” Cities 150: 104995.
83 “Getting Utility Services: Why Your Credit Matters,” Federal Trade Commission Consumer Advice, October 2024, https://consumer.ftc.gov/articles/getting-utility-services-why-your-credit-matters.
84 Memmott, Trevor, Sanya Carley, Michelle Graff, and David M. Konisky, "Sociodemographic Disparities in Energy Insecurity Among Low-income Households Before and During the COVID-19 pandemic," Nature Energy 6, no. 2 (2021): 186-193. doi:10.1038/s41560-020-00763-9; Hernández, Diana, and Eva Siegel, "Energy Insecurity and its ill Health Effects: A Community Perspective on the Energy-health Nexus in New York City," Energy Research & Social Science 47 (2019): 78-83. doi:10.1016/j.erss.2018.08.011; Graff, Michelle, Sanya Carley, David M. Konisky, and Trevor Memmott, "Which Households are Energy Insecure? An Empirical Analysis of Race, Housing Conditions, and Energy Burdens in the United States," Energy Research & Social Science 79 (2021): 102144. doi:10.1016/j.erss.2021.102144; Tang, Tian and Hyunji Kim, "Linking Energy Policy, Energy Insecurity, and Health Outcomes," Frontiers in Sustainable Energy Policy 2 (2023): 1231821. doi:10.3389/fsuep.2023.1231821; Friedman, Carli, "Unsafe Temperatures, Going Without Necessities, and Unpayable Bills: Energy Insecurity of People with Disabilities in the United States during the COVID-19 pandemic," Energy Research & Social Science 92 (2022): 102806. doi:10.1016/j.erss.2022.102806; O’lenick, Cassandra R., Amir Baniassadi, Ryan Michael et al, "A Case-crossover Analysis of Indoor Heat Exposure on Mortality and Hospitalizations Among the Elderly in Houston, Texas," Environmental Health Perspectives 128, no. 12 (2020): 127007. doi:10.1289/EHP6340.
85 Hatch, Megan E., and Michelle Graff, “Housing Costs are not a Monolith: The Association Between Neighborhood Energy Burdens and Eviction Filing Rates,” Cities 150: 104995.
86 Hernández, Diana, and Jennifer Laird, "Surviving a Shut-off: US Households at Greatest Risk of Utility Disconnections and how They Cope," American Behavioral Scientist 66, no. 7 (2022): 856-880. doi:10.1177/00027642211013401.
87 Hernández, Diana, and Jennifer Laird, "Surviving a Shut-off: US Households at Greatest Risk of Utility Disconnections and how They Cope," American Behavioral Scientist 66, no. 7 (2022): 856-880. doi:10.1177/00027642211013401; Brown, Marilyn A., Anmol Soni, Melissa V. Lapsa, Katie Southworth, and Matt Cox, "High Energy Burden and Low-income Energy Affordability: Conclusions from a Literature Review," Progress in Energy 2, no. 4 (2020): 04200. doi:10.1088/25161083/abb954.
88 Hernández, Diana, and Jennifer Laird, "Surviving a Shut-off: US Households at Greatest Risk of Utility Disconnections and how They Cope," American Behavioral Scientist 66, no. 7 (2022): 856-880. doi:10.1177/00027642211013401; Carley, Sanya, Michelle Graff, David M. Konisky, and Trevor Memmott, "Behavioral and Financial Coping Strategies Among Energy-insecure Households," Proceedings of the National Academy of Sciences 119, no. 36 (2022): e2205356119. doi:10.1073/pnas.2205356119.
89 Hernández, Diana, and Jennifer Laird, "Surviving a Shut-off: US Households at Greatest Risk of Utility Disconnections and how They Cope," American Behavioral Scientist 66, no. 7 (2022): 856-880. doi:10.1177/00027642211013401
90 Hernández, Diana, and Jennifer Laird, "Surviving a Shut-off: US Households at Greatest Risk of Utility Disconnections and how They Cope," American Behavioral Scientist 66, no. 7 (2022): 856-880. doi:10.1177/00027642211013401; Carley, Sanya, Michelle Graff, David M. Konisky, and Trevor Memmott, "Behavioral and Financial Coping Strategies Among Energy-insecure Households," Proceedings of the National Academy of Sciences 119, no. 36 (2022): e2205356119. doi:10.1073/pnas.2205356119.
91 Bhattacharya, Jayanta, Thomas DeLeire, Steven Haider, and Janet Currie, "Heat or eat? Cold-weather Shocks and Nutrition in Poor American Families," American Journal of Public Health 93, no. 7 (2003): 1149-1154. doi:10.2105/ajph.93.7.1149.
92 “2020 RECS Survey Data,” Residential Energy Consumption Survey (RECS), EIA, January 2024, https://www.eia.gov/consumption/residential/data/2020/index.php?view=microdata.
93 Sykes, Bryan L., Meghan Ballard, Andrea Giuffre et al, "Robbing Peter to pay Paul: Public Assistance, Monetary Sanctions, and Financial Double-dealing in America," RSF: The Russell Sage Foundation Journal of the Social Sciences 8, no. 1 (2022): 148-178. doi:10.7758/RSF.2022.8.1.07.
94 Carley, Sanya, Michelle Graff, David M. Konisky, and Trevor Memmott, "Behavioral and Financial Coping Strategies Among Energy-insecure Households," Proceedings of the National Academy of Sciences 119, no. 36 (2022): e2205356119. doi:10.1073/pnas.2205356119.
95 Burlinson, Andrew, Apostolos Davillas, and Cherry Law, "Pay (for it) as you go: Prepaid Energy Meters and the Heat-or-eat Dilemma," Social Science & Medicine 315 (2022), 115498. doi:10.1016/j.socscimed.2022.115498: Randazzo, Ryan, “Why Consumer Advocates are Wary of APS’ Prepay-for-power Program,” AZCentral/The Arizona Republic, November 18, 2015, https://www.azcentral.com/story/money/business/energy/2015/11/17/consumer-advocates-debate-prepaidutilities/75953644/; “SRP M-Power Prepaid Price Plan,” Salt River Project (SRP), accessed March 11, 2025, https://www.srpnet.com/price-plans/residential-electric/m-power; Brown, Marilyn A., Anmol Soni, Melissa V. Lapsa, Katie Southworth, “Low-Income Energy Affordability: Conclusions from a Literature Review,” Oak Ridge National Laboratory, March 2020, https://info.ornl.gov/sites/publications/Files/Pub124723.pdf.
96 Adams, Jeffrey A., Sanya Carley, and David M. Konisky, "Utility Assistance and Pricing Structures for Energy Impoverished Households: A Review of the Literature,” The Electricity Journal 37, no. 2 (2024): 107368. doi:10.1016/j.tej.2024.10736; Salt River Project (SRP), 2025, data provided in response to request; “SRP M-Power prepaid price plan,” Salt River Project (SRP), accessed March 11, 2025, https://www.srpnet.com/price-plans/residential-electric/m-power.
97 Hernández, Diana, and Jennifer Laird, "Surviving a Shut-off: US Households at Greatest Risk of Utility Disconnections and how They Cope," American Behavioral Scientist 66, no. 7 (2022): 856-880. doi:10.1177/00027642211013401; Cong, Shuchen, Arthur Lin Ku, Destenie Nock, Charlotte Ng, and Yueming ‘Lucy’ Qiu, “Comfort or Cash? Lessons from the COVID-19 Pandemic's Impact on Energy Insecurity and Energy Limiting Behavior in Households,” Energy Research & Social Science 113 (2024): 103528. doi:10.1016/j.erss.2024.103528.
98 “Feedback from the Community on Cooling Centers: Maricopa County Cooling Cener Evaluation 2023 Final Report,” Maricopa County Department of Public Health Epidemiology & Informatics, May 2024, https://www.maricopa.gov/DocumentCenter/View/92026/Cooling-Center-General-Survey-Community-2023-Report.
99 “Feedback from the Community on Cooling Centers: Maricopa County Cooling Cener Evaluation 2023 Final Report,” Maricopa County Department of Public Health Epidemiology & Informatics, May 2024, https://www.maricopa.gov/DocumentCenter/View/92026/Cooling-Center-General-Survey-Community-2023-Report.
100 “Feedback from the Community on Cooling Centers: Maricopa County Cooling Cener Evaluation 2023 Final Report,” Maricopa County Department of Public Health Epidemiology & Informatics, May 2024, https://www.maricopa.gov/DocumentCenter/View/92026/Cooling-Center-General-Survey-Community-2023-Report
101 “Feedback from the Community on Cooling Centers: Maricopa County Cooling Cener Evaluation 2023 Final Report,” Maricopa County Department of Public Health Epidemiology & Informatics, April 2024, https://www.maricopa.gov/DocumentCenter/View/92027/Cooling-Center-Visitor-Survey-Community-2023-Report.
102 “2023 38060 – Housing Quality – All Occupied Units,” American Housing Survey (AHS) Table Creator, US Census Bureau, 2023, https://www.census.gov/programssurveys/ahs/data/interactive/ahstablecreator.html?s_areas=38060&s_year=2023&s_tablename=TABLE5&s_bygroup1=1&s_b ygroup2=1&s_filtergroup1=1&s_filtergroup2=1.
103 Doremus, Jacqueline M., Irene Jacqz, and Sarah Johnston, "Sweating the Energy Bill: Extreme Weather, Poor Households, and the Energy Spending gap," Journal of Environmental Economics and Management 112 (2022): 102609. doi:10.1016/j.jeem.2022.102609.
104 Hernández, Diana, and Jennifer Laird, "Surviving a Shut-off: US Households at Greatest Risk of Utility Disconnections and how They Cope," American Behavioral Scientist 66, no. 7 (2022): 856-880. doi:10.1177/00027642211013401.
105 Tham, Stephanie, Ross Thompson, Owen Landeg, K. A. Murray, and Thomas Waite, "Indoor Temperature and Health: A Global Systematic Review," Public Health 179 (2020): 9-17. doi: 10.1016/j.puhe.2019.09.005.
106 “Maricopa County Heat Morbidity Report 2006-2017,” Maricopa County Public Health, accessed March 11, 2025, https://www.maricopa.gov/ArchiveCenter/ViewFile/Item/1373; ”2018-2022 Heat Morbidity Report,” Maricopa County Department of Public Health Epidemiology and Informatics, July 2024, https://www.maricopa.gov/ArchiveCenter/ViewFile/Item/5855; Maricopa County Public Health Department, 2025, dataset provided in response to request.
107 Carley, Sanya, Michelle Graff, David M. Konisky, and Trevor Memmott. "Behavioral and Financial Coping Strategies Among Energy-insecure Households," Proceedings of the National Academy of Sciences 119, no. 36 (2022): e2205356119. doi:10.1073/pnas.2205356119.
108 Carley, Sanya, Michelle Graff, David M. Konisky, and Trevor Memmott. "Behavioral and Financial Coping Strategies Among Energy-insecure Households," Proceedings of the National Academy of Sciences 119, no. 36 (2022): e2205356119. doi:10.1073/pnas.2205356119; Skiba, Paige Marta and Jeremy Tobacman, "Do Payday Loans Cause Bankruptcy?,” The Journal of Law and Economics 62, no. 3 (2019): 485-519. doi:10.1086/706201.
109 King, Christian, "Informal Assistance to Urban Families and the Risk of Household Food Insecurity," Social Science & Medicine 189 (2017): 105-113. doi:10.1016/j.socscimed.2017.07.030.
110 Yardley, Jane, Ronald J. Sigal, and Glen P. Kenny, "Heat Health Planning: The Importance of Social and Community Factors," Global Environmental Change 21, no. 2 (2011): 670-679.
111 Memmott, Trevor, Sanya Carley, Michelle Graff, and David M. Konisky, "Utility Disconnection Protections and the Incidence of Energy Insecurity in the United States," iScience 26, no. 3 (2023):106244. doi:10.1016/j.isci.2023.106244; Carley, Sanya, Michelle Graff, David M. Konisky, and Trevor Memmott. "Behavioral and Financial Coping Strategies Among Energy-insecure Households," Proceedings of the National Academy of Sciences 119, no. 36 (2022): e2205356119. doi:10.1073/pnas.2205356119.
112 Memmott, Trevor, Sanya Carley, Michelle Graff, and David M. Konisky, "Utility Disconnection Protections and the Incidence of Energy Insecurity in the United States," iScience 26, no. 3 (2023):106244. doi:10.1016/j.isci.2023.106244;
Baker, Shalanda H., Sanya Carley, and David M. Konisky, "Energy Insecurity and the Urgent Need for Utility Disconnection Protections," Energy Policy 159 (2021): 112663. doi:10.1016/j.enpol.2021.112663.
113 “2020 RECS Survey Data,” Residential Energy Consumption Survey (RECS), EIA, January 2024, https://www.eia.gov/consumption/residential/data/2020/index.php?view=microdata
114 Salt River Project (SRP), 2025, data provided in response to request.
115 “Quarter 1 Termination Report,” Arizona Public Service (APS), April 15, 2024; “Quarter 2 Termination Report,” Arizona Public Service (APS), July 15, 2024; “Quarter 3 Termination Report,” Arizona Public Service (APS), October 15, 2024; “Quarter 4 Termination Report,” Arizona Public Service (APS), January 15, 2025.
116 Brewer, Dylan and Sarah Goldgar, "The Effect of Extreme Temperatures on Evictions," Journal of Environmental Economics and Management 128 (2024): 103055. doi:10.1016/j.jeem.2024.103055; Bezgrebelna, Mariya, Kwame McKenzie, Samantha Wells et al, "Climate Change, Weather, Housing Precarity, and Homelessness: A Systematic Review of Reviews," International Journal of Environmental Research and Public Health 18, no. 11 (2021): 5812. doi:10.3390/ijerph18115812.
117 Jessel, Sonal, Samantha Sawyer, and Diana Hernández, "Energy, Poverty, and Health in Climate Change: A Comprehensive Review of an Emerging Literature," Frontiers in Public Health 7 (2019): 357. doi:10.3389/fpubh.2019.00357; Collinson, Robert, John Eric Humphries, Nicholas Mader, Davin Reed, Daniel Tannenbaum, and Winnie Van Dijk, "Eviction and Poverty in American Cities," The Quarterly Journal of Economics 139, no. 1 (2024): 57-120. doi:10.1093/qje/qjad042; Putnam, Hana, David M. Hondula, Aleš Urban, Vjollca Berisha, Paul Iñiguez, and Matthew Roach, "It’s not the Heat, it’s the Vulnerability: Attribution of the 2016 Spike in Heat-associated Deaths in Maricopa County, Arizona," Environmental Research Letters 13, no. 9 (2018): 094022. doi:10.1088/1748-9326/aadb44.
118 Solari/211, 2024, dataset provided in response to request.
119 Carrión, Daniel, and Diana Hernández, "Heatwaves and Hardship: Shortcomings and Solutions for Enhancing the Low Income Home Energy Assistance Program to Mitigate Extreme Heat and Energy Insecurity," The Electricity Journal 37, no. 710 (2024): 107440. doi:10.1016/j.tej.2024.107440.
120 “History of LIHEAP,” LIHEAP Clearinghouse, accessed March 11, 2025, https://liheapch.acf.hhs.gov/sites/default/files/webfiles/docs/History_of_LIHEAP.pdf
121 “Low Income Home Energy Assistance Program: Dear Colleague Letter,” Administration for Children & Families, October 24, 2023, https://www.acf.hhs.gov/sites/default/files/documents/ocs/COMM_LIHEAP_CRFundingReleaseBody_FY2024_0.pdf
122 “LIHEAP Fact Sheet,” Office of Community Services, Administration for Children & Families, accessed March 11, 2025, https://www.acf.hhs.gov/ocs/fact-sheet/liheap-fact-sheet.
123 Simes, Miranda, Tasfia Rahman, and Diana Hernández, "Vigilant Conservation: How Energy Insecure Households Navigate Cumulative and Administrative Burdens," Energy Research & Social Science 101 (2023): 103092. doi:10.1016/j.erss.2023.103092; Murray, Anthony G. and Bradford F. Mills, "The Impact of Low-Income Home Energy Assistance Program Participation on Household Energy Unsecurity," Contemporary Economic Policy 32, no. 4 (2014): 811825. doi:10.1111/coep.12050.
124 Gilger, Lauren, “How Changes to Federal Funding Allegation can Help More Arizonans With Cooling Costs,” KJZZ, July 1, 2024, https://www.kjzz.org/news/2024-07-01/how-changes-to-federal-funding-allocation-can-help-more-arizonans-withcooling-costs; Carrión, Daniel and Diana Hernández, "Heatwaves and hardship: Shortcomings and solutions for enhancing the low income home energy assistance program to mitigate extreme heat and energy insecurity," The Electricity Journal 37, no. 7-10 (2024): 107440, doi: 10.1016/j.tej.2024.107440.
125 “LIHEAP Fact Sheet,” Office of Community Services, Administration for Children & Families, accessed March 11, 2025, https://www.acf.hhs.gov/ocs/fact-sheet/liheap-fact-sheet.
126 “The LIHEAP Formula,” Congressional Research Service, May 2, 2019, https://sgp.fas.org/crs/misc/RL33275.pdf; Bechler, Scott, “How a Decades-Old Federal Energy Assistance Program Functions in Practice: A Deep Dive into LIHEAP,” Nicholas Institute for Environmental Policy Solutions, Duke University, April 2021, https://nicholasinstitute.duke.edu/sites/default/files/publications/How-a-Decades-Old-Federal-Energy-AssistanceProgram-Functions-in-Practice-A-Deep-Dive-into-LIHEAP.pdf; Pskowski, Martha, and Jenaye Johnson, “Funds to Help LowIncome Families With Summer Electric Bills Are Stretched Thin,” Inside Climate News, July 19, 2024, https://insideclimatenews.org/news/19072024/low-income-families-electric-bills-federal-funds-stretched-thin/.
127 Schott, Justin, “Optimizing $4 Billion Of Low-Income Home Energy Assistance Program Funding To Protect The Most Vulnerable Households From Extreme Heat,” Federation of American Scientists, April 4, 2024, https://fas.org/publication/liheap-extreme-heat/.
128 “Arizona,” LIHEAP Clearinghouse, July 9, 2024, https://liheapch.acf.hhs.gov/profiles/Arizona.htm; “LIHEAP Funding for States and Territories,” LIHEAP Clearinghouse, November 1, 2024, https://liheapch.acf.hhs.gov/Funding/funding.htm
129 “Gallego Leads Push to Increase Energy Assistance for Arizonans,” Office of Ruben Gallego, May 22, 2024, https://web.archive.org/web/20241118155435/https://rubengallego.house.gov/media-center/press-releases/gallegoleads-push-to-increase-energy-assistance-for-arizonans; Solís, Patricia, Kristin Borns, Margaret Hinrichs, Sarah Bassett, Melissa Guardaro, and Elizabeth Wentz, “Recommendations Report to the Office of the Governor on Extreme Heat Preparedness in Arizona,” Knowledge Exchange for Resilience KEEP Solutions Series, Arizona State University, 2024, https://hdl.handle.net/2286/R.2.N.191546; “Washington,” LIHEAP Clearinghouse, June 19, 2024, https://liheapch.acf.hhs.gov/profiles/WA.htm; “Tennessee,” LIHEAP Clearinghouse, June 19, 2024, https://liheapch.acf.hhs.gov/profiles/Tenn.htm; “Massachusetts,” LIHEAP Clearinghouse, June 18, 2024, https://liheapch.acf.hhs.gov/profiles/Mass.htm.
130 “LIHEAP Innovations FAQ,” A New Leaf, June 2022, https://www.turnanewleaf.org/wpcontent/uploads/2022/10/LIHEAP-FAQ-2022.pdf
131 “Low Income Home Energy Assistance Program,” Arizona Department of Economic Security, accessed March 11, 2025, https://des.az.gov/liheap.
132 “Low Income Home Energy Assistance Program,” Arizona Department of Economic Security, accessed March 11, 2025, https://des.az.gov/liheap
133 “Low Income Home Energy Assistance Program,” Arizona Department of Economic Security, accessed March 11, 2025, https://des.az.gov/liheap; “Arizona State Median Income for FFY 2025,” LIHEAP Clearinghouse, April 1, 2024, https://liheapch.acf.hhs.gov/profiles/povertytables/FY2025/azsmi.htm.
134 “Arizona,” LIHEAP Clearinghouse, July 9, 2024, https://liheapch.acf.hhs.gov/profiles/Arizona.htm; “Low Income Home Energy Assistance Program (LIHEAP) Frequently Asked Questions,” Arizona Department of Economic Security, accessed March 11, 2025, https://des.az.gov/services/basic-needs/shelter-housing/utility-assistance/liheap-faqs.
135 “Arizona,” LIHEAP Clearinghouse, July 9, 2024, https://liheapch.acf.hhs.gov/profiles/Arizona.htm; “Low Income Home Energy Assistance Program (LIHEAP) Frequently Asked Questions,” Arizona Department of Economic Security, accessed March 11, 2025, https://des.az.gov/services/basic-needs/shelter-housing/utility-assistance/liheap-faqs.
136 “Quarter 1 Termination Report,” Arizona Public Service (APS), April 15, 2024; ““Quarter 2 Termination Report,” Arizona Public Service (APS), July 15, 2024; “Quarter 3 Termination Report,” Arizona Public Service (APS), October 15, 2024; “Quarter 4 Termination Report,” Arizona Public Service (APS), January 15, 2025.
137 “Arizona LIHEAP FY2022 State Profile,” LIHEAP Performance Management, June 30, 2023, https://liheappm.acf.hhs.gov/sites/default/files/private/congress/profiles/2022/FY2022ArizonaProfile-508Compliant.pdf; “Arizona LIHEAP FY2023 State Profile,” LIHEAP Performance Management, April 30, 2024, https://liheappm.acf.hhs.gov/sites/default/files/private/congress/profiles/2023/FY2023ArizonaProfile-508Compliant.pdf.
138 Carrión, Daniel, and Diana Hernández, "Heatwaves and Hardship: Shortcomings and Solutions for Enhancing the Low Income Home Energy Assistance Program to Mitigate Extreme Heat and Energy Insecurity," The Electricity Journal 37, no. 710 (2024): 107440. doi:10.1016/j.tej.2024.107440.
139 Simes, Miranda, Tasfia Rahman, and Diana Hernández, "Vigilant Conservation: How Energy Insecure Households Navigate Cumulative and Administrative Burdens," Energy Research & Social Science 101 (2023): 103092. doi:10.1016/j.erss.2023.103092.
140 Graff, Michelle, "Reducing Administrative Burdens in an Energy Bill Assistance Program," Public Management Review (2024): 1-26. doi:10.1080/14719037.2024.2335556; Carrión, Daniel, and Diana Hernández, "Heatwaves and Hardship: Shortcomings and Solutions for Enhancing the Low Income Home Energy Assistance Program to Mitigate Extreme Heat and Energy Insecurity," The Electricity Journal 37, no. 7-10 (2024): 107440. doi:10.1016/j.tej.2024.107440.
141 “Arizona LIHEAP FY2022 State Profile,” LIHEAP Performance Management, June 30, 2023, https://liheappm.acf.hhs.gov/sites/default/files/private/congress/profiles/2022/FY2022ArizonaProfile-508Compliant.pdf.
142 “Home Energy Affordability Gap,” Fisher, Sheehan & Colton, Public Finance & General Economics, accessed March 11, 2025, https://www.homeenergyaffordabilitygap.com/03a_affordabilityData.html
143 “Low Income Home Energy Assistance Program,” Arizona Department of Economic Security, accessed March 11, 2025, https://des.az.gov/liheap.
144 Plumer, Brad, “Entire Staff is Fired at Office That Helps Poorer Americans Pay For Heating,” The New York Times, April 2, 2025, https://www.nytimes.com/2025/04/02/climate/trump-layoffs-energy-assistance-liheap.html.
145 Resnik, Brahm, “Arizona’s Air Conditioning Program at Risk: Federal Workers Fired,” 12 News, April 4, 2025, https://www.12news.com/article/news/local/heatbeat/arizonas-air-conditioning-relief-risk-federal-program-workersfired/75-150c00a1-5595-4812-b2db-10790bb690b4.
146 “APS Energy Support Program,” Arizona Public Service (APS), accessed March 11, 2025, https://www.aps.com/en/Residential/Account/Assistance- Programs/Energy-Support-Program; “Save $276 with the Economy Price Plan,” Salt River Project (SRP), accessed March 11, 2025, https://www.srpnet.com/customerservice/residential-electric/economy-price-plan
147 Salt River Project (SRP), 2025, data provided in response to request.
148 Adams, Jeffrey A., Sanya Carley, and David M. Konisky, "Utility Assistance and Pricing Structures for Energy Impoverished Households: A Review of the Literature,” The Electricity Journal 37, no. 2 (2024): 107368. doi:10.1016/j.tej.2024.107368.
149 “Payment Policies,” Arizona Public Service (APS), accessed March 11, 2025, https://www.aps.com/en/Residential/Billing-and-Payment/Payment-Policies; “SRP Credit Policy,” Salt River Project (SRP), accessed March 11, 2025, https://www.srpnet.com/account/electric/residential/residential-credit-policy
150 “Payment Arrangement,” Arizona Public Service (APS), accessed March 11, 2025, https://www.aps.com/en/Residential/Billing-and-Payment/Payment-Arrangement
151 “Payment Arrangement,” Arizona Public Service (APS), accessed March 11, 2025, https://www.aps.com/en/Residential/Billing-and-Payment/Payment-Arrangement
152 “Payment Arrangement,” Arizona Public Service (APS), accessed March 11, 2025, https://www.aps.com/en/Residential/Billing-and-Payment/Payment-Arrangement
153 Salt River Project (SRP), 2025, data provided in response to request.
154 “SRP Credit Policy,” Salt River Project (SRP), accessed March 11, 2025, https://www.srpnet.com/account/electric/residential/residential-credit-policy
155 Salt River Project (SRP), 2025, data provided in response to request.
156 Adams, Jeffrey A., Sanya Carley, and David M. Konisky, "Utility Assistance and Pricing Structures for Energy Impoverished Households: A Review of the Literature,” The Electricity Journal 37, no. 2 (2024): 107368. doi:10.1016/j.tej.2024.107368.
157 Salt River Project (SRP), 2025, data provided in response to request.
158 “Quarter 1 Termination Report,” Arizona Public Service (APS), April 15, 2024; ““Quarter 2 Termination Report,” Arizona Public Service (APS), July 15, 2024; “Quarter 3 Termination Report,” Arizona Public Service (APS), October 15, 2024; “Quarter 4 Termination Report,” Arizona Public Service (APS), January 15, 2025.
159 Salt River Project (SRP), 2025, data provided in response to request.
160 “Quarter 1 Termination Report,” Arizona Public Service (APS), April 15, 2024; ““Quarter 2 Termination Report,” Arizona Public Service (APS), July 15, 2024; “Quarter 3 Termination Report,” Arizona Public Service (APS), October 15, 2024; “Quarter 4 Termination Report,” Arizona Public Service (APS), January 15, 2025.
161 Wildfire AZ, 2024, data provided in response to request.
162 Wildfire AZ, 2024, data provided in response to request; “Home Energy Affordability Gap,” Fisher, Sheehan & Colton, Public Finance & General Economics, accessed March 11, 2025, https://www.homeenergyaffordabilitygap.com/03a_affordabilityData.html.
163 “Project SHARE,” Arizona Public Service (APS), accessed March 11, 2025, https://www.aps.com/en/Residential/Account/Assistance- Programs/Project-SHARE.
164 Kemper, Dave, “The American Rescue Plan Act (ARPA) Succeeded in Sustaining State and Local Government Services During the Pandemic,” Economic Policy Institute, May 28, 2025, https://www.epi.org/blog/the-american-rescue-plan-actarpa-succeeded-in-sustaining-state-and-local-government-services-during-the-pandemic-99-of-arpa-fiscal-recovery-fundswere-obligated-on-schedule/; “Quarter 1 Termination Report,” Arizona Public Service (APS), April 15, 2024.
165 Dave Kemper, “The American Rescue Plan Act (ARPA) Succeeded in Sustaining State and Local Government Services During the Pandemic,” Economic Policy Institute, May 28, 2025, https://www.epi.org/blog/the-american-rescue-plan-actarpa-succeeded-in-sustaining-state-and-local-government-services-during-the-pandemic-99-of-arpa-fiscal-recovery-fundswere-obligated-on-schedule/; “Quarter 1 Termination Report,” Arizona Public Service (APS), April 15, 2024.
166 Lawson, Ashley J. and Claire Mills, “Electric Utility Disconnections,” Congress.gov, January 31, 2023, https://crsreports.congress.gov/product/pdf/R/R47417.
167 Whitman, Elizabeth, “On 107-Degree Day, APS Cut Power to Stephanie Pullman’s Home. She Didn’t Live,” Phoenix New Times, June 13, 2019, https://www.phoenixnewtimes.com/news/aps-cut-power-heat-customer-dead-phoenix-summershutoff-11310515.
168 Randazzo, Ryan, “Behind on Bills? Here’s When Your Electric or gas Company can Disconnect Your Power in AZ,”AZCentral/The Arizona Republic, November 4, 2021, https://www.azcentral.com/story/money/business/energy/2021/11/04/arizona-regulators-pass-new-rules-utilitydisconnection/6197582001/.
169 Williams, Haley, “Regulated Arizona Utility Companies Won’t Disconnect Power in Extreme Heat,” 12News/CBS, June 4, 2024, https://www.12news.com/article/news/local/heatbeat/arizona-approaches-first- excessive-heat-warning-regulatedutilities-will-not-disconnect-power/75-a554031e-734d-4ab0-8c9a-033fc528321c.
170 “Crisis in Energy Affordability: Summer Shutoff Protections and Bill Support Fail to Adapt to a Warming World,” Center for Energy Poverty and Climate, July 2024, https://energyprograms.org/wpcontent/uploads/2024/07/shutoffprotections.pdf.
171 “Quarter 1 Termination Report,” Arizona Public Service (APS), April 15, 2024; ““Quarter 2 Termination Report,” Arizona Public Service (APS), July 15, 2024; “Quarter 3 Termination Report,” Arizona Public Service (APS), October 15, 2024; “Quarter 4 Termination Report,” Arizona Public Service (APS), January 15, 2025; Salt River Project (SRP), 2025, data provided in response to request.
172 Baker, Shalanda H., Sanya Carley, and David M. Konisky, "Energy Insecurity and the Urgent Need for Utility Disconnection Protections," Energy Policy 159 (2021): 112663. doi:10.1016/j.enpol.2021.112663.
173 “We’re Here to Help Keep You Connected,” Arizona Public Service (APS), accessed March 11, 2025, https://www.aps.com/en/Residential/Save-Money-and-Energy/Disconnections; “SRP Credit Policy,” Salt River Project (SRP), accessed March 11, 2025, https://www.srpnet.com/account/electric/residential/residential-credit-policy#4
174 “We’re Here to Help Keep You Connected,” Arizona Public Service (APS), accessed March 11, 2025, https://www.aps.com/en/Residential/Save-Money-and-Energy/Disconnections
175 “SRP Credit Policy,” Salt River Project (SRP), accessed March 11, 2025, https://www.srpnet.com/account/electric/residential/residential-credit-policy#4; Salt River Project, personal communication, 2025.
176 Maricopa County Public Health Department, 2025, dataset provided in response to request.
177 Maricopa County Public Health Department, 2025, dataset provided in response to request.
178 Maricopa County Public Health Department, 2025, dataset provided in response to request.
179 Putnam, Hana, David M. Hondula, Aleš Urban, Vjollca Berisha, Paul Iñiguez, and Matthew Roach, "It’s not the Heat, it’s the Vulnerability: Attribution of the 2016 Spike in Heat-associated Deaths in Maricopa County, Arizona," Environmental Research Letters 13, no. 9 (2018): 094022. doi:10.1088/1748-9326/aadb44.
180 “Phoenix records first 100-degree day of 2024,” KTAR News, April 21, 2024, https://ktar.com/story/5570982/phoenixrecords-first-100-degree-day-of-2024/; “Phoenix, AZ Weather History,” Weather Underground, accessed March 11, 2025, https://www.wunderground.com/history/monthly/us/az/phoenix/KPHX/date/2024
181 Lodermeier, Alison, "Credit Access and Housing Insecurity: Evidence from Winter Utility Shutoff Protections," Journal of Public Economics 230 (2024): 105064. doi:0.1016/j.jpubeco.2023.105064.
182 Lodermeier, Alison, "Credit Access and Housing Insecurity: Evidence from Winter Utility Shutoff Protections," Journal of Public Economics 230 (2024): 105064. doi:0.1016/j.jpubeco.2023.105064.
183 Lodermeier, Alison, "Credit Access and Housing Insecurity: Evidence from Winter Utility Shutoff Protections," Journal of Public Economics 230 (2024): 105064. doi:0.1016/j.jpubeco.2023.105064.
184 Baker, Shalanda H., Sanya Carley, and David M. Konisky, "Energy Insecurity and the Urgent Need for Utility Disconnection Protections," Energy Policy 159 (2021): 112663. doi:10.1016/j.enpol.2021.112663.
185 Memmott, Trevor, Sanya Carley, Michelle Graff, and David M. Konisky, "Utility Disconnection Protections and the Incidence of Energy Insecurity in the United States," iScience 26, no. 3 (2023): 106244. doi:10.1016/j.isci.2023.106244.
186 “Weatherization Assistance Program,” US Department of Energy, accessed March 11, 2025, https://www.energy.gov/scep/wap/weatherization-assistance-program; :Weatherization Assistance Program,” Arizona Department of Housing, accessed March 11, 2025, https://housing.az.gov/general-public/weatherization-assistanceprogram
187 “Weatherization Assistance Program,” SRP, accessed March 11, 2025, https://www.srpnet.com/customerservice/residential-electric/weatherization-assistance-program; “Weatherizing homes helps customers save money – and provides unexpected health benefits too,” Arizona Public Service (APS), September 2, 2021, https://www.aps.com/en/About/Our-Company/Newsroom/Articles/Weatherizing-homes-helps-customers-save-money-andprovides-unexpected-health-benefits-too; “Arizona LIHEAP FY2023 State Profile,” LIHEAP Performance Management, April 30, 2024, https://liheappm.acf.hhs.gov/sites/default/files/private/congress/profiles/2023/FY2023ArizonaProfile508Compliant.pdf; Meiners, Joan, “Arizona lands $47.5 million to weatherize homes against energy-draining heat, cold,” AZCentral/The Arizona Republic, April 5, 2023, https://www.azcentral.com/story/news/local/arizonaenvironment/2023/04/05/arizona-gets-47-5-million-to-weatherize-homes-against-heat-cold/70076609007/; “Maricopa County Home Improvement Program (MCHIP): Leveraging Funding to Achieve Holistic Home Improvements,” Maricopa County Human Services Department, accessed March 11, 2025, https://housing.az.gov/sites/default/files/CD%26R%20%20Session%201%20-%20Maricopa%20County%20Home%20Improvement%20Program%20%28MCHIP%29.pdf.
188 Meiners, Joan, “Arizona lands $47.5 million to weatherize homes against energy-draining heat, cold,” AZCentral/The Arizona Republic, April 5, 2023, https://www.azcentral.com/story/news/local/arizona- environment/2023/04/05/arizonagets-47-5-million-to-weatherize-homes-against-heat-cold/70076609007/.
189 Blodgett, Kathy, “Weatherization Assistance Program FY2024 Annual State Plan,” Arizona Department of Housing, July 1, 2024, https://housing.az.gov/sites/default/files/2024-08/FY2024%20AZ%20WAP%20State%20Plan%20Final_0.pdf; “LIHEAP Funds by Program Component: States and Territories,” LIHEAP Clearinghouse, December 10, 2024, https://liheapch.acf.hhs.gov/tables/components.htm; “Arizona,” LIHEAP Clearinghouse, July 9, 224, https://liheapch.acf.hhs.gov/profiles/Arizona.htm
190 “Maricopa County Home Improvement Program (MCHIP): Leveraging Funding to Achieve Holistic Home Improvements,” Maricopa County Human Services Department, accessed March 11, 2025, https://housing.az.gov/sites/default/files/CD%26R%20-%20Session%201%20%20Maricopa%20County%20Home%20Improvement%20Program%20%28MCHIP%29.pdf; “Emergency Home Repair Program Helps Maricopa County Homeowners in Need,” Human Services Case Studies, Maricopa County, May 12, 2023, https://www.maricopa.gov/CivicAlerts.aspx?AID=2727
191 “Maricopa County Home Improvement Program (MCHIP): Leveraging Funding to Achieve Holistic Home Improvements,” Maricopa County Human Services Department, accessed March 11, 2025, https://housing.az.gov/sites/default/files/CD%26R%20-%20Session%201%20%20Maricopa%20County%20Home%20Improvement%20Program%20%28MCHIP%29.pdf.
192 “Home Improvement Programs: Emergency Home Repair,” Department of Human Services, Maricopa County, accessed March 11, 2025, https://www.maricopa.gov/5214/Home-Improvement-Programs; “Weatherization Assistance Program: Weatherization Income Qualification Requirements,” Arizona Department of Housing, January 26, 2024, https://housing.az.gov/sites/default/files/2024-08/2024-Weatherization-Income-Qualification-LimitsEffective_1.26.2024.pdf.
193 “Weatherization Assistance Program,” US Department of Energy, accessed March 11, 2025, https://www.energy.gov/scep/wap/weatherization-assistance-program; “Weatherization Assistance Program,” Arizona Department of Housing, accessed March 11, 2025, https://housing.az.gov/general-public/weatherization-assistanceprogram.
194 “2024-2025 Weatherization Assistance Program State Plan, 2024-2025 HUD Annual Action Plan,” Arizona Department of Housing, April 10, 2024, https://housing.az.gov/sites/default/files/202409/PY24%20WAP%20%26%20AAP%20Public%20Hearing_0.pdf; “Weatherization Assistance Program: Weatherization Income Qualification Requirements,” Arizona Department of Housing, January 26, 2024, https://housing.az.gov/sites/default/files/2024-08/2024-Weatherization-Income-Qualification-LimitsEffective_1.26.2024.pdf; “Table DP03: Selected Economic Characteristics,” American Community Survey 5 Year Estimates, US Census Bureau, 2023, https://data.census.gov/table/ACSDP5Y2023.DP03?q=DP03&g=050XX00US04013
195 Tonn, Bruce, Michaela Marincic, and Erin Rose, "A Dollar Well Spent: Monetizing the Societal Benefits of Low-income Weatherization Programs in the United States," Energy Research & Social Science 107 (2024): 103341. doi:10.1016/j.erss.2023.103341; ”Weatherization Assistance Program Funding Report Program Year 2022,” National Association for State Community Service Programs, 2022, https://nascsp.org/wp-content/uploads/2023/12/PY22-WAPAnnual-Funding-Report-1.pdf; Fowlie, Meredith, Michael Greenstone, and Catherine Wolfram, "Do Energy Efficiency Investments Deliver? Evidence from the Weatherization Assistance Program," The Quarterly Journal of Economics 133, no. 3 (2018): 1597-1644. doi:10.2139/ssrn.2621817; Zivin, Joshua Graff and Kevin Novan, "Upgrading Efficiency and Behavior: Electricity Savings from Residential Weatherization Programs," The Energy Journal 37, no. 4 (2016): 1-24. doi:10.5547/01956574.37.4.jziv.
196 Martin, Carlos, Michael Bueno, Michael Johnson, Francisco Montes, Riordan Frost, “Targeting Weatherization: Supporting Low-Income Renters in Multifamily Properties through the Infrastructure Investment and Jobs Act’s Funding of the
Weatherization Assistance Program and Beyond,” Joint Center for Housing Studies, Harvard University, January 2023, https://www.jchs.harvard.edu/sites/default/files/research/files/harvard_jchs_weatherization_martin_etal_2023.pdf.
197 Martin, Carlos, Michael Bueno, Michael Johnson, Francisco Montes, Riordan Frost, “Targeting Weatherization: Supporting Low-Income Renters in Multifamily Properties through the Infrastructure Investment and Jobs Act’s Funding of the Weatherization Assistance Program and Beyond,” Joint Center for Housing Studies, Harvard University, January 2023, https://www.jchs.harvard.edu/sites/default/files/research/files/harvard_jchs_weatherization_martin_etal_2023.pdf.
198 “What is Weatherization?” Foundation for Senior Living, accessed March 11, 2025, https://www.fsl.org/weatherization/; ”Home Improvement Programs: Emergency Home Repair,” Department of Human Services, Maricopa County, accessed March 11, 2025, https://www.maricopa.gov/5214/Home-Improvement-Programs
199 Fowlie, Meredith, Michael Greenstone, and Catherine Wolfram, "Do Energy Efficiency Investments Deliver? Evidence From the Weatherization Assistance Program," The Quarterly Journal of Economics 133, no. 3 (2018): 1597-1644. doi:10.2139/ssrn.2621817; Zivin, Joshua Graff, and Kevin Novan, "Upgrading Efficiency and Behavior: Electricity Savings from Residential Weatherization Programs," The Energy Journal 37, no. 4 (2016): 1-24. doi:10.5547/01956574.37.4.jziv; Sandoval, Noah, Katelyn Stenger, Anthony D. Fontanini, Lixi Liu, and Philip R. White, "Cooling–not Weatherization–Ensures Access to Livable Indoor Conditions for Residential Buildings in Los Angeles," ACEEE Summer Study on Energy Efficiency in Buildings, 2024, https://www.aceee.org/sites/default/files/proceedings/ssb24/assets/attachments/20240722160736140_ccf0f65d-68c5489b-8985-22d6cc576e8d.pdf
200 “Whole House Weatherization,” U.S. Department of Energy, accessed March 11, 2025, https://www.energy.gov/scep/wap/whole-house-weatherizationhttps://www.energy.gov/scep/wap/whole-houseweatherization; “Home Improvement Programs: Emergency Home Repair,” Department of Human Services, Maricopa County, accessed March 11, 2025, https://www.maricopa.gov/5214/Home-Improvement-Programs.
201 Blodgett, Kathy, “Weatherization Health and Safety Plan,” Arizona Department of Housing, July 1, 2024, https://housing.az.gov/sites/default/files/2024-08/FY2024%20AZ%20WAP%20H%26S%20State%20Plan%20Final_0.pdf
202 Pigg, Scott, "National Weatherization Assistance Program Impact Evaluation–A Pilot Monitoring Study of Cooling System Consumption and Savings under the WAP Program," Oak Ridge National Laboratory, September 2024, https://weatherization.ornl.gov/wp-content/uploads/pdf/WAPRecoveryActEvalFinalReports/ORNL_TM-2014_339.pdf.
203 “Weatherization Assistance Program,” Office of Energy Efficiency & Renewable Energy, US Department of Energy, January 2021, https://www.energy.gov/sites/prod/files/2021/01/f82/WAP-fact-sheet_2021_0.pdf
204 ”Weatherization Assistance Program Funding Report Program Year 2022,” National Association for State Community Service Programs, 2022, https://nascsp.org/wp-content/uploads/2023/12/PY22-WAP-Annual-Funding-Report-1.pdf.
205 “Pre-WAP Program Examples,” National Association for State Community Service Programs, 2019, https://nascsp.org/wp-content/uploads/2019/08/Pre-WAP-Programs.pdf; Blodgett, Kathy, “Weatherization Health and Safety Plan,” Arizona Department of Housing, July 1, 2024, https://housing.az.gov/sites/default/files/202408/FY2024%20AZ%20WAP%20H%26S%20State%20Plan%20Final_0.pdf
206 ”Weatherization Assistance Program Funding Report Program Year 2022,” National Association for State Community Service Programs, 2022, https://nascsp.org/wp-content/uploads/2023/12/PY22-WAP-Annual-Funding-Report-1.pdf; “Weatherization Program Frequently Asked Questions,” Neighborhood Services Department, City of Phoenix, access March 11, 2025, https://www.phoenix.gov/nsdsite/Documents/Weatherization%20FAQ%20Sheet.pdf
207 Lewis, Jamal, Diana Hernández, and Arline T. Geronimus, "Energy Efficiency as Energy Justice: Addressing Racial Inequities Through Investments in People and Places," Energy Efficiency 13 no. 3, (2019): 419-432. doi:10.1007/s12053-01909820-z.
208 Gangloff, Mark, “Deadly Phoenix Sun Demands a More Forceful Defense,” Bloomberg, October 21, 2024, https://www.bloomberg.com/opinion/articles/2024-10-21/deadly-phoenix-sun-demands-a-more-forceful-defense; Canon, Gabrielle, “Grim New Death Records as Brutal Heat Plagues US South-west into the Autumn,” The Guardian, September 27, 2024, https://www.theguardian.com/environment/2024/sep/27/heat-wave-death-record-southwest; “CNN Looks at What it Takes to Survive in America’s Hottest City,” CNN, August 4, 2024, https://www.cnn.com/2024/08/04/weather/video/phoenix-hottest-city-in-america-cooling-center-weir-digvid; Canon, Gabrielle, “’Hell on Earth’: Phoenix’s Extreme Heatwave Tests the Limits of Survival,” The Guardian, July 14, 2023, https://www.theguardian.com/us-news/2023/jul/14/phoenix-heatwave-summer-extreme-weather-arizona; Lakhani, Nina, “America’s Hottest city is Nearly Unlivable in Summer. Can Cooling Technologies Save it?” The Guardian, January 27, 2022, https://www.theguardian.com/us-news/2022/jan/27/phoenix-arizona-hottest-city-cooling-technologies
209 Grigg, Nicole, “Arizona Indoor Heat Deaths: ‘These are People who Should not Have Died,’” ABC15 Arizona, May 22, 2024, https://www.abc15.com/news/local-news/investigations/arizona-indoor-heat-deaths-these-are-people-who-shouldnot-have-died; O’Dowd, Peter, “Can you Survive Summer Indoors Without AC? In Arizona, Many Don’t,” WBUR, May 3, 2024, https://www.wbur.org/hereandnow/2024/05/03/arizona-heat-deaths-ac.
210 Larsen, Larissa, Carina J. Gronlund, Kaan Cem Ketenci et al, "Safe at Home? A comparison of Factors Influencing Indoor Residential Temperatures During Warm Weather Among Three Cities," Journal of the American Planning Association 89, no. 3 (2023): 363-375. doi:10.1080/01944363.2022.2087724; Silva, Humberto, and Baron S. Fillpot, "Modeling Nexus of Urban Heat Island Mitigation Strategies With Electricity/Power Usage and Consumer Costs: a Case Study for Phoenix, Arizona, USA," Theoretical and Applied Climatology 131 (2018): 661-669. doi:10.1007/s00704-016-1985-5; Rajput, Mayuri, Godfried Augenbroe, Brian Stone et al, "Heat Exposure During a Power Outage: A Simulation Study of Residences Across the Metro Phoenix Area," Energy and Buildings 259 (2022): 111605. doi:10.1016/j.enbuild.2021.111605; Nahlik, Matthew J., Mikhail V. Chester, Stephanie S. Pincetl, David Eisenman, Deepak Sivaraman, and Paul English. "Building Thermal Performance, Extreme Heat, and Climate Change." Journal of Infrastructure Systems 23, no. 3 (2017): 04016043. doi:10.1061/(asce)is.1943-555x.0000349.
211 Hampo, Chima Cyril, Leah H. Schinasi, and Simi Hoque, "Surviving Indoor Heat Stress in United States: A Comprehensive Review Exploring the Impact of Overheating on the Thermal Comfort, Health, and Social Economic Factors of Occupants," Heliyon 10, no. 3 (2024). doi:10.1016/j.heliyon.2024.e25801; Silva, Humberto and Baron S. Fillpot, "Modeling Nexus of Urban Heat Island Mitigation Strategies With Electricity/Power Usage and Consumer Costs: A Case Study for Phoenix, Arizona, USA," Theoretical and Applied Climatology 131 (2018): 661-669. doi: 10.1007/s00704-016-1985-5; Neuman, Scott, “Your Air Conditioner Isn’t Built for This Heat,” July 23, 2019, National Public Radio, https://www.npr.org/2023/07/19/1188328688/heat-wave-air-conditioner-tips.
212 “Trees Are Cool,” Mesa AZ, March 5, 2025, https://www.mesalistens.com/treesarecool; ”Mesa Neighborhood Shade Tree Program,” Mesa AZ, accessed March 11, 2025, https://www.mesaaz.gov/Environment-Sustainability/Living-Green/AllAbout-Trees/Mesa-Neighborhood-Shade-Tree-Program; “HeatReadyPHX,” Office of Heat Response & Mitigation, City of Phoenix, accessed March 11, 2025, https://www.phoenix.gov/heat; Blandin, Venton, “Glendale Details Heat Mitigation Efforts During Excessive Heat,” ABC15 Arizona, July 27, 2023, https://www.abc15.com/news/region-westvalley/glendale/glendale-details-heat-mitigation-efforts-during-excessive-heat; Gore, Kate, “Keeping Tempe Cool: The Role of Urban Greening and Drecreasing Impacts of Extreme Heat,” The State Press, November 19, 2024, https://www.statepress.com/article/2024/11/community-tempe-urban-cooling.
213 “FY 2025 County Budget Includes Tax Rate Cut,” Office of Communications, Maricopa County, May 20, 2024, https://www.maricopa.gov/CivicAlerts.aspx?AID=2926&ARC=4970; Estes, Christina , “Facing Significant Budget Shortfalls, Phoenix City Manager Says, ‘Turbulent Times Ahead,’” KJZZ, November 13, 2024, https://www.kjzz.org/business/2024-1113/facing-significant-budget-shortfalls-phoenix-city-manager-says-turbulent-times-ahead; Koch, Mitchell, “Mesa Public Schools to lay off Some Staff in 2025-26 due to Funding Deficit,” Arizona Family, January 13, 2025, https://www.azfamily.com/2025/01/13/mesa-public-schools-lay-off-some-staff-2025-26-due-funding-deficit/
214 Schmeltz, Michael T., Elisaveta P. Petkova, and Janet L. Gamble, "Economic Burden of Hospitalizations for Heat-related Illnesses in the United States, 2001–2010," International Journal of Environmental Research and Public Health 13, no. 9 (2016): 894. doi:10.3390/ijerph13090894; Jenkins, Derek, Sasathorn Tapaneeyakul, and Vivian Ho, “Prices Versus Costs: Unpacking Rising US Hospital Profits,” Center for Health Policy, Baker Institute, September 6, 2024, https://www.bakerinstitute.org/research/prices-versus-costs-unpacking-rising-us-hospital-profits.
215 “Heat-Related Illness (HRI) Emergency Department and Inpatient Admissions (Hospitalizations) 2020-2024, Arizona Residents and Non-Residents,” Arizona Department of Health Services, accessed June 25, 2025, https://www.azdhs.gov/documents/preparedness/epidemiology-disease-control/extreme-weather/pubs/heat-relatedillness-emergency-department-and-inpatient-admissions-in- arizona-by-year-2020-2024.pdf?v=20250517.
216 Lodermeier, Alison, "Credit Access and Housing Insecurity: Evidence from Winter Utility Shutoff Protections," Journal of Public Economics 230 (2024): 105064. doi:10.1016/j.jpubeco.2023.105064; Valencia, Peter, “Maricopa County Breaks Alltime Record for Eviction Filings in 2024,” Arizona Family, January 3, 2025, https://www.azfamily.com/2025/01/03/maricopa-county-breaks-all-time-record-eviction-filings-2024/
217 Lada, Brian, “10 of the Hottest Cities in the US,” AccuWeather, June 4, 2024, https://www.accuweather.com/en/weather-news/10-of-the-hottest-cities-in-the-us/432421; Acosta, Tiffany, “New Here? This is What True Locals Mean When They say ‘Metro Phoenix’ and ‘the Valley,’” AZCentral/The Arizona Republic, February 7, 2024, https://www.azcentral.com/story/entertainment/life/2024/02/07/how-many-people-move-to-phoenix-metroevery-day/71964174007/.