

By March 2026, inflation dynamics in the US remain uneven. January data on the Consumer Price Index (CPI) exceeded expectations: the overall figure declined to 2.4% year-on-year (versus a forecast of 2.5%), core inflation fell to 2.5%, and the pace of growth in housing expenses slowed. Meanwhile, the core Personal Consumption Expenditures (PCE) price index, which the Federal Reserve prefers as a benchmark, reached 3% year-on-year in December, exceeding the Fed’s 2% target. Following the release of these statistics, the probability of a rate cut in June dropped from 70% to 50%.
US GDP in Q4 2025 grew by +1.4% year-on-year, significantly below expectations and previous periods, indicating a marked economic slowdown. A substantial contribution to the slowdown came from a reduction in federal spending amid a government shutdown. Additional impacts included a deterioration in the net export contribution and a deceleration in durable goods consumption.
Preliminary February data on the Purchasing Managers' Index (PMI) from S&P Global indicated a slowdown in growth in the private sector. The Composite PMI stood at 52.3, representing the slowest growth in 10 months. The Manufacturing PMI fell to 51.2, while the Services sector registered 52.3. This points to weaker new order dynamics and moderate business expansion
The employment report for January (published in February) showed steady job growth. During the reporting period, 130,000 new jobs were created. This marked a clear improvement compared to the hiring stagnation in 2025: private sector job numbers last year grew by an average of only 30,000 per month. The highest growth in January was seen in the healthcare (+82,000 jobs), social assistance (+42,000), and construction (+33,000) sectors. The unemployment rate decreased to 4.3% compared to 4.4% in December 2025.
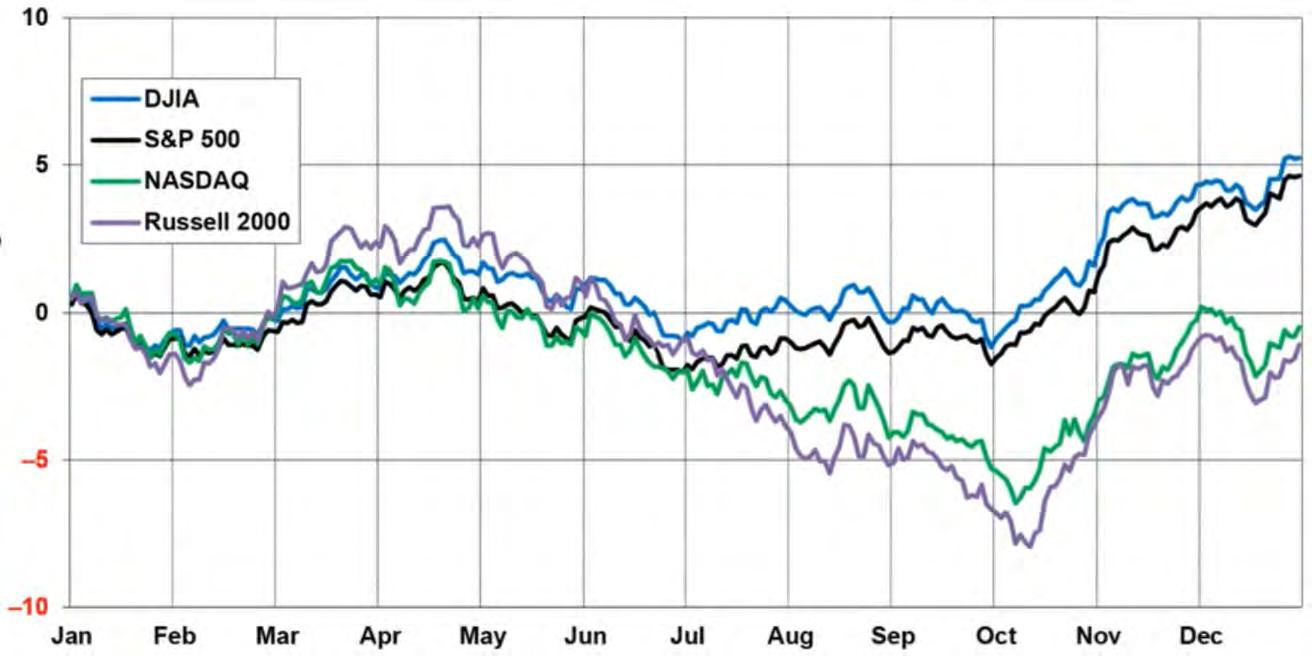
February is traditionally a weak month for the stock market: over the past 30 years, the average monthly return has been -0.3%. According to statistics for all years with midterm elections in the US, February is a weak period, but from March to May the market accelerates upwards, and from May it enters a broad sideways trend that lasts until October. The current market situation fits this seasonal pattern quite accurately.
Based on these seasonal cycles, our base case scenario is a continuation of growth at the index level and an expansion of the list of outperforming stocks. One of the interesting tactical opportunities at present is the information technology and software sector, which has undergone a deep correction since the beginning of the year
Source: Bloomberg, Astero Falcon analytics
Statistically, February is the weakest month in the first half of the year, a trend that is particularly pronounced in years when the US Congress holds midterm elections. Nevertheless, this is usually followed by a market recovery from March through May
The US earnings season for the fourth quarter of 2025 has concluded. S&P 500 earnings are growing at a double-digit rate of approximately 12–13% year-on-year, significantly exceeding the late December expectations of 8.3% earnings growth. Company revenues are increasing by an average of 8–9% year-on-year, marking the 21st consecutive quarter of positive growth.
Profitability remains high: the aggregate net margin of the S&P 500 for the quarter stood at 13%, close to record levels, and there is no significant margin pressure observed so far.
The best-performing sectors in terms of profit growth remain IT (around +30%), industrial companies, and the telecommunications sector (double-digit growth); the weakest are the consumer discretionary sector, healthcare, and real estate (around zero or a slight decline).
The giants of market capitalisation have ceased to be the sole drivers of growth: small-cap companies are showing improved momentum, while highly valued technology companies lag in share price performance despite strong financial results. Since October last year, the US equity market has experienced active rotation: the composition and number of non-technology sector stocks exhibiting outperformance relative to the index have expanded. Currently, shares of over 60% of companies have outperformed the S&P 500 index in terms of year-to-date returns, primarily driven by small-cap companies and firms from ‘old economy’ sectors such as energy, mining, and consumer durables
The consensus expects further acceleration of profit growth in 2026 to approximately 14% yearon-year. The forward P/E ratio for the next 12 months is around 21.5x, which is above the 5-year average of 20x but already closer to historical average levels.
The combined earnings of the "Magnificent 7" are growing at approximately 17–20% year-on-year, significantly outpacing the rest of the S&P 500 and still accounting for the lion’s share of the index’s earnings growth. Meanwhile, the market’s reaction to individual earnings reports was sharp and uneven: Microsoft shares fell by 7% following a strong report (revenue +17%, EPS +60% y/y, Azure +38%) due to concerns over AI monetisation and a slowdown in the cloud business. Meta’s results were a notable positive, with a 10% increase in its share price in one day amid revenue and EPS beating forecasts and aggressive investments in AI and advertising.
The final highlight was Nvidia’s earnings report on 25 February. The company once again delivered record results driven by continued explosive demand for AI chips in data centres. Revenue increased by +12% quarter-on-quarter and +78% year-on-year, while earnings per share rose by 145% year-on-year. However, the market responded rather sluggishly to these figures; following the release, the share price rose by only 2%, as high expectations had already been priced in
Source: Bloomberg, Astero Falcon analytics
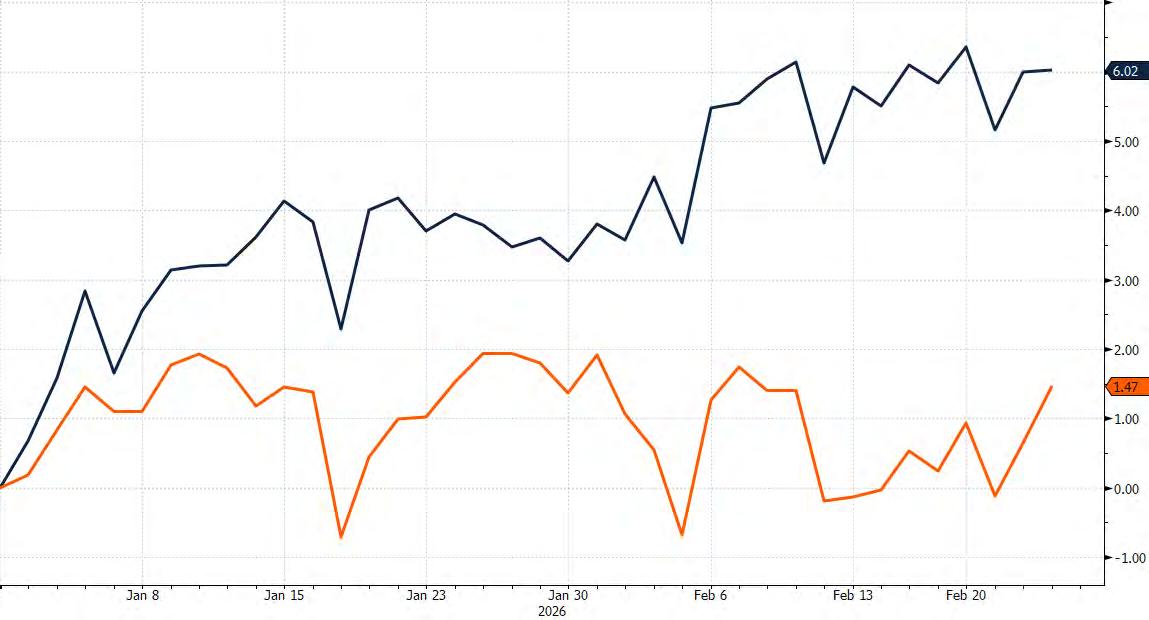
Since the beginning of the year, the equal-weighted S&P 500 index has outperformed the "classic" S&P 500 (in which large-cap companies have a higher weighting) by nearly 5% in terms of returns. This indicates asset rotation and the leading growth of mid-cap and small-cap companies
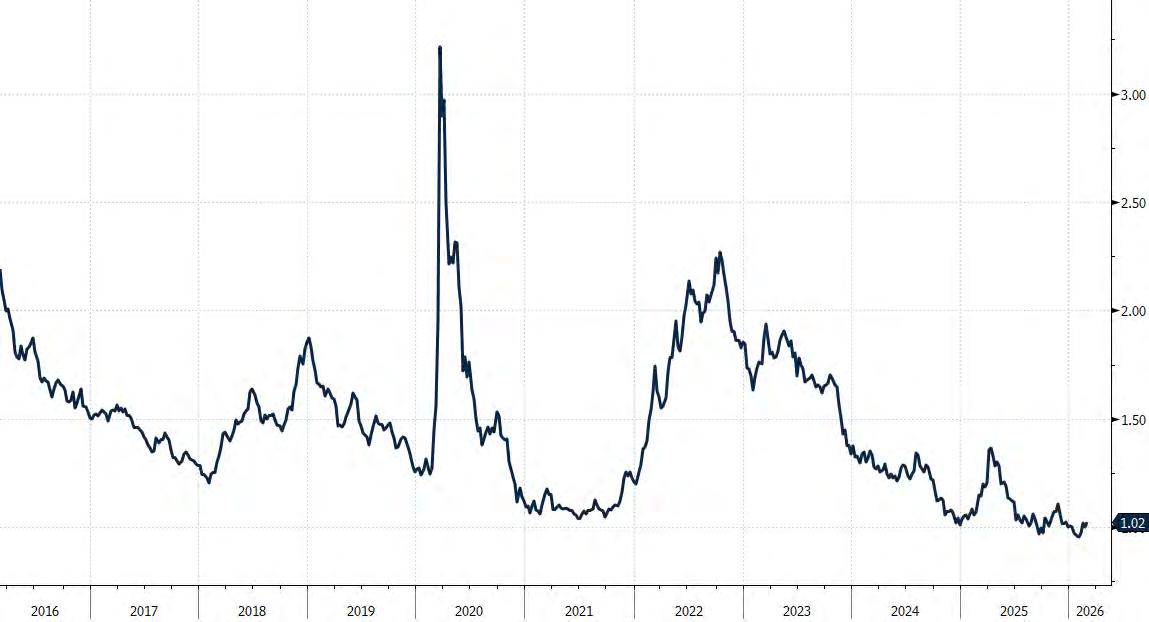
One of the most significant events in January and February 2026 was a sharp and deep correction in the shares of SaaS (Software-as-a-Service) companies, triggered by fears that autonomous AI agents would render a substantial portion of traditional corporate software obsolete. Since the beginning of the year, individual stocks in the sector have declined by 20%-50%, and in the first week of February alone, the total market capitalisation of these companies fell by $1 trillion. Many shares are trading significantly below their April 2025 lows.
As of Q4 2025, the revenue of IT sector companies in the US grew on average by 21%, with profits increasing by 31%, indicating that from a fundamental perspective the sector remains a leader in growth rates. However, since the beginning of 2026 there has been a significant compression of multiples: the average P/E of technology companies declined from 29x to 24x. We consider this dynamic paradoxical and attractive for long-term investments: the market is selling off precisely those stocks whose financial performance outpaces the market.
Concerns regarding AI are only partially justified, and a more likely scenario is that AI will not destroy but rather complement the services and business of SaaS companies.
Against this backdrop, a downturn occurred in other risk assets: in February, the correction simultaneously affected metals, cryptocurrencies, and technology companies. Investor risk appetite cooled significantly, and we consider this a favourable factor for continued growth.
In particular, the number of short positions on IGV (iShares Expanded Tech-Software Sector ETF) and the trading volume in this ETF have reached record highs – indicating extreme pessimism and investor capitulation. Although it is still premature to confidently assert that a bottom has formed, we believe that the 100-month moving average (currently at $70) will serve as strong support, and the current levels are already attractive for long-term purchases
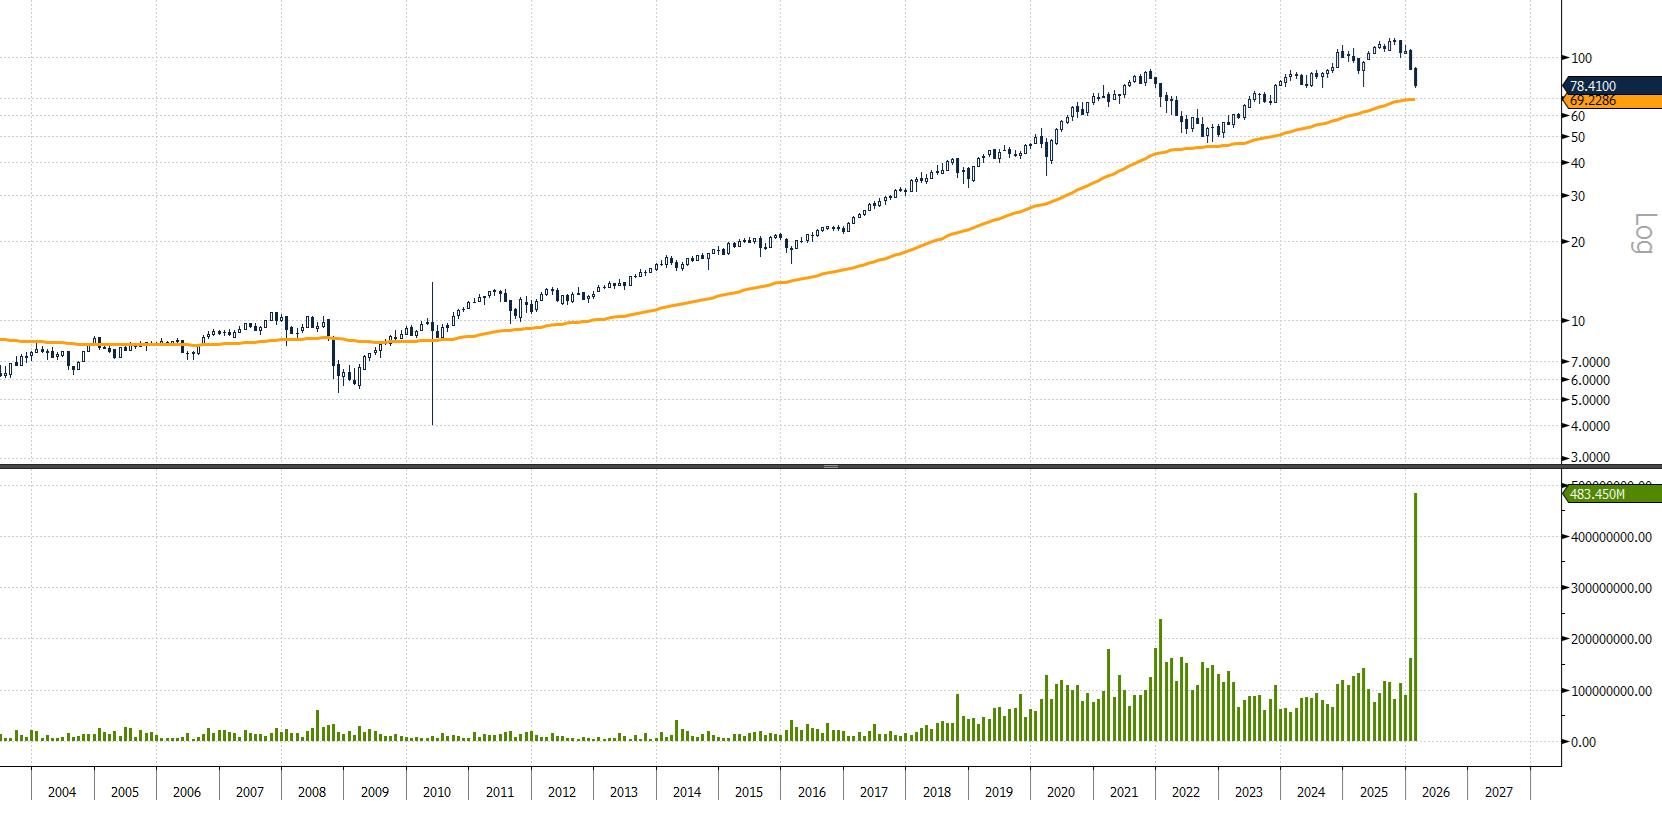
The popular IGV fund (consisting of software developer stocks) has corrected by 35% since October. Elevated trading volumes and the depth of the decline signal investor capitulation, but the combination of strong fundamental metrics and solid support at the $70 level make this fund attractive for purchases
Source: Bloomberg, Astero Falcon analytics
Despite good absolute yield levels, compensation for credit risk currently remains limited. Credit spreads in the investment-grade segment are near historical lows, while in the high yield segment they are significantly below long-term average levels.
In our view, the potential for further price improvement in corporate bonds is limited, whereas any negative surprise (rising inflation, deterioration of the macroeconomic situation, geopolitics, or weakening of companies’ financial positions) could trigger a correction. Simply put, the corporate credit market is currently pricing in a favourable scenario and leaves little “margin of safety” for errors.
The BBB segment stands out as the most vulnerable. A significant portion of new issuances related to the financing of large investment programmes, including projects in digital infrastructure and AI, is concentrated within this rating range. BBB securities are on the borderline with high yield: in the event of deteriorating conditions or rating downgrades, they are the first to come under pressure from forced sales by major institutional investors. At the same time, the additional yield compared to higher-quality securities (A/AA) is currently modest, despite substantially higher risks.
We adhere to a barbell strategy: a combination of short-term high-yield bonds and high-quality longterm sovereign securities, without adding investment-grade corporate bonds. In this combination, the role of high-yield bonds is to lock in an elevated coupon with limited sensitivity to interest rate changes and to maintain portfolio flexibility through regular maturities. The objective of long-term sovereign securities is to hedge the portfolio in scenarios of economic growth slowdown and monetary policy easing.
In the current environment, convertible bonds are also tactically attractive. In conditions of tight credit spreads, they allow for adding an equity market upside option while maintaining fundamental credit protection.
Elevated volatility surrounding the investment cycle in AI and uncertainty in trade policy increase the cost of the embedded option, while an active primary market broadens the range of instruments available, including in the infrastructure and digital services segments. The key to success remains a selective approach: focusing on issuances with a balanced sensitivity profile to equities (delta around 40–60%, allowing participation in the growth of underlying equities without turning the position into quasi-equity and preserving the defensive characteristics of the bond component), as well as on issuers with a transparent business model and stable cash flow generation.
Source: Bloomberg, Astero Falcon analytics
Spreads on BBB-rated corporate bonds remain low by historical standards. In the event of a rating downgrade, fund managers will sell such securities, and their current yield does not sufficiently compensate for this risk. Therefore, we consider this segment superfluous in bond portfolios.
In our January review, we wrote that “the $120 level (216.8% projection of the entire base formed in silver between 1980 and 2025) will become an important resistance that silver is not yet ready to overcome.” On 29 January, silver reached the $121 mark, after which a rapid and sharp correction occurred. On Friday, 30 January, the price of silver fell by 38% in a single day, marking the largest one-day decline in history.
At the local minimum, the price of silver fell to $64, which perfectly coincided with the 100-day moving average. On the weekly chart, the bottom of the decline also matched the 50% Fibonacci retracement level of the entire movement since September 2023. We view positively the fact that support at key technical levels held and the correction did not deepen further.
The correction in metals was likely caused by a large number of speculators using margin trading and borrowed funds. During February, global exchanges (notably the Chicago Mercantile Exchange) repeatedly increased margin requirements for open positions, making speculation in metals more expensive and forcing some traders to close long positions. After the closure of these “excess” margin positions, sentiment returned to healthier levels, and we believe that the upward trend is likely to resume
Gold serves as our benchmark among precious metals – and the February correction in it was virtually imperceptible. Within just two weeks, gold fully recovered all losses and is closing February at yet another record price. For us, this confirms that the bull market in precious metals continues. Another indirect confirmation of this is the shares of companies mining gold and silver: their prices are also closing February near their highs.
Since October 2025, cryptocurrencies have been in a downward trend, with a decline of more than 50% from their peak price. From a technical perspective, key support levels are located at 65,000, and the further dynamics of cryptocurrencies will depend on whether these levels hold. Currently, Bitcoin has fallen to the average breakeven price for miners and the average purchase price of large holders – both of these indicators represent a strong fundamental “floor”, below which the currency has rarely fallen in the past.
The local bear market does not negate our longterm positive outlook on cryptocurrencies, particularly Bitcoin. We believe that a weak phase of the halving cycle is currently underway, which may last up to another six months, but the longterm price targets for Bitcoin are positioned significantly above current levels
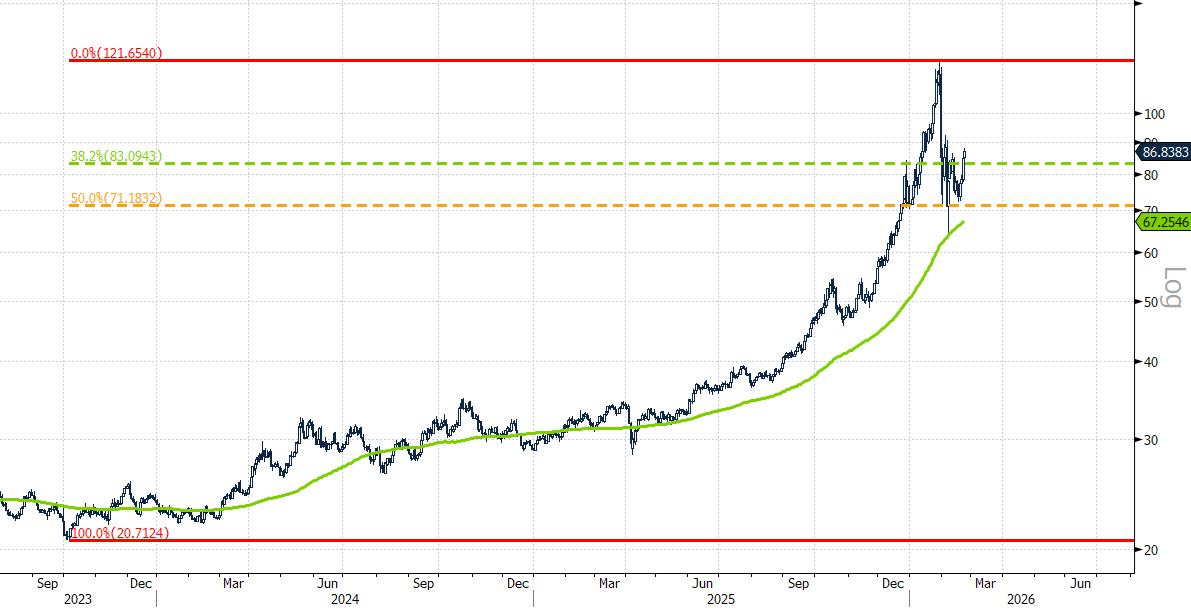
After reaching a record price of $120, silver sharply corrected. The fact that key support levels held indicates that the uptrend is not yet over
Source: Bloomberg, Astero Falcon analytics
AI attracts two-thirds of venture dollars — and the gap is widening. In 2025, AI and machine learning accounted for 65.4% of the total venture investment volume in the US, absorbing approximately $222 billion out of $339 billion (PitchBook Q4 NVCA Venture Monitor). Over the decade, this share has increased sixfold — from 10% in 2015 to 47.2% in 2024 and now nearly twothirds. AI also accounted for 39.4% of the total number of deals. Excluding AI, the core US venture investment market has contracted. The European market shows a similar picture: €23.5 billion was directed to AI startups (+30% y/y), while deal volume outside the AI sector declined by 5.7% to €42.7 billion.
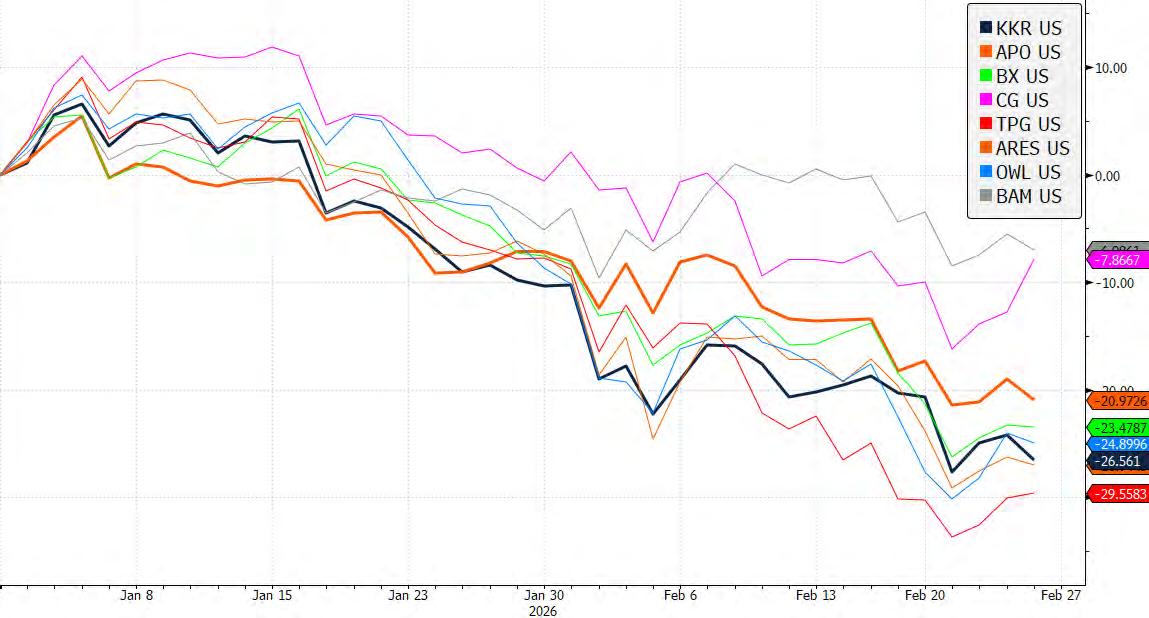
In February, Blue Owl Capital permanently restricted redemptions in its OBDC II fund and sold approximately $1.4 billion of loans to finance outflows — described by CNBC as a "canary in the coal mine." Agent AI is disrupting the business models of SaaS companies, which underpin around $3 trillion of the private credit market. The software segment accounted for 26% of BCRED’s (Blackstone) portfolio; Apollo proactively reduced its exposure from 20% to approximately 10%. According to UBS estimates, the default rate on private credit in the US could reach 13% if the disruptive impact of AI accelerates — three times higher than the projected default rate on highyield bonds. J.P. Morgan’s 2026 family office report shows that the average allocation to private credit is only 2.4%, yet investors with concentrated exposure to software need to conduct stress testing now
In 2025, half of all venture dollars were directed to just 0.05% of deals — a concentration not seen in fifteen years. Anthropic raised $15 billion in a latestage round in the fourth quarter; Project Prometheus secured $6.2 billion in an early-stage round. 52.4% of the total investment volume in the US was attracted by Silicon Valley — a historic high. The combined valuation of American "unicorns" stands at $4.3 trillion, of which $3.3 trillion is attributed to AI. Despite concerns about concentration, assets under management in venture capital reached a new peak of $1.02 trillion, surpassing the 2021 level for the first time, while the trailing twelve-month internal rate of return (IRR) turned positive at 7.8%.
The seventeenth annual Bain & Company report on the global private equity market introduced a phrase that will likely define the current investment cycle: "12 is the new 5." Ten years ago, a typical LBO deal involved 50% debt at 6–7% per annum with rising multiples — the management company only needed to deliver 5% annual EBITDA growth to achieve a 2.5x return over five years. Today, leverage levels stand at 30–40%, the cost of debt financing is 8–9%, and entry multiples have plateaued. Sponsors now need to ensure 10–12% annual EBITDA growth to achieve a similar outcome. The choice of management company increasingly depends on operational competencies — revenue optimisation, margin enhancement, AI integration — rather than financial engineering
Source: Bloomberg, Astero Falcon analytics
The private equity industry is under pressure: since the beginning of the year, the share prices of key players have declined by 10%-30% amid a crisis triggered by AI
Fixed Incom
Swiss Bond Index (SBI) AAA-BBB
Bloomberg Barclays Euro Aggregate Corporate TR
Bloomberg Barclays Pan-European High Yield TR
Bloomberg Barclays US Corporate High Yield TR
Bloomberg Barclays Sterling Corporate TR
Bloomberg Barclays China Aggregate TR
Bloomberg Barclays Asia USD High Yield TR
Bloomberg Barclays Global High Yield TR
JPM EMBI Global Total Return Index
Bloomberg Barclays Global-Aggregate T
Equitie
NASDAQ 100 Stock Index
S&P 500 INDEX
Dow Jones Industrial Average
MSCI World Index
MSCI Europe Index
MSCI Emerging Markets Index
SPI
SMIM
DAX
FTSE 100 Index
Hang Seng Index
Shanghai Shenzhen CSI 300 Inde
Nikkei 22
Commoditie
Gold
Silver
Copper
WTI
BRENT
Bloomberg Commodity Inde
Foreign exchang
EURCHF
CHFUSD
CHFGBP
EURUSD
EURGBP
GBPUS
Source: Bloomberg, Astero Falcon analytics
-0,83% 0,20% 1,33% 1,22% 3,98% 5,71% 5,62% 4,70% 2,84% 6,22% -3,67% 0,51% 10,24 5,69% 2,53% 1,04% 0,32% 0,23% -0,46 -0,24% -0,19% 0,87% -0,41% 0,62% -1,05
1,36 0,39% 1,64% 3,16% 3,51% 7,24% 15,00% 5,63% 6,35% 3,04% 9,39% 2,96% 2,29% 16,78
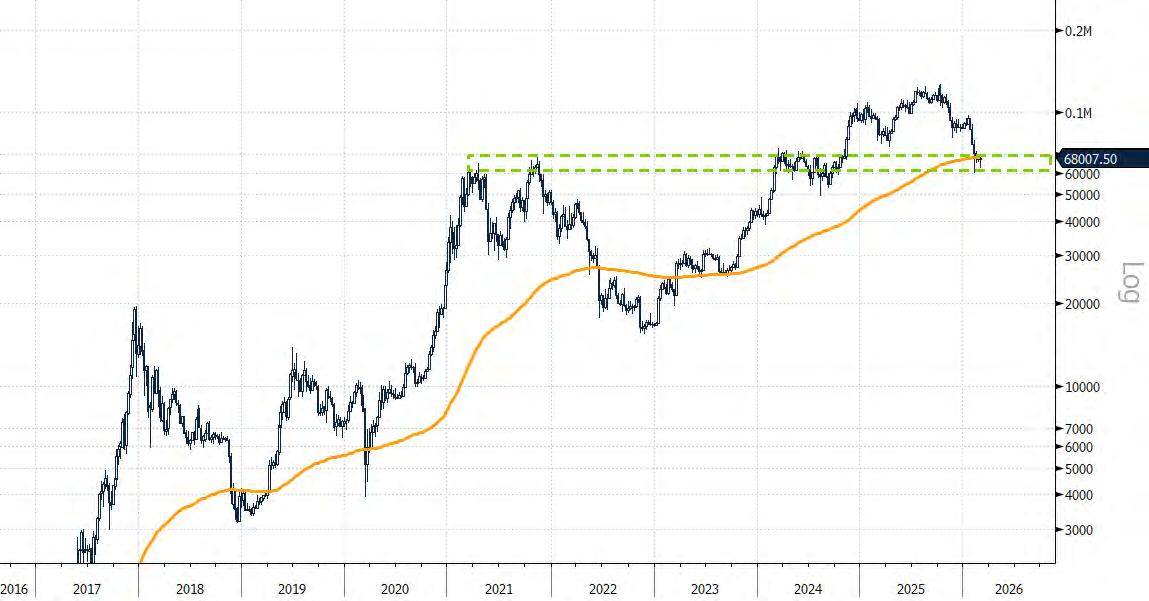
At the level of 65,000 dollars, Bitcoin has key support levels, and the further dynamics of the cryptocurrency will depend on whether these hold. This level also corresponds to the average price of large purchases and the current cost of Bitcoin mining. We believe that a medium-term bottom will form at the current levels, and the long-term upward trend is not yet complete
Source: Bloomberg, Astero Falcon analytics
This document is issued by Astero Falcon (DIFC) Limited (“Astero Falcon”), a company incorporated in the Dubai International Financial Centre and authorised and regulated by the Dubai Financial Services Authority (DFSA). This material constitutes a Financial Promotion for the purposes of the DFSA General (GEN) Module and is directed solely at Professional Clients, as defined under the DFSA Conduct of Business (COB) Module. It must not be acted upon by, relied upon by, or distributed to Retail Clients.
This document is provided for information and general market commentary purposes only. It does not constitute investment advice, investment research, an offer, solicitation, recommendation, inducement, or personal invitation to engage in any investment activity or to transact in any financial instrument or product. The content has been prepared without regard to the individual investment objectives, financial situation, or particular needs of any recipient and no assessment of suitability or appropriateness has been undertaken. Recipients should obtain independent professional advice before making any investment decision and should not rely on this document as the sole basis for any investment decision.
This material does not constitute “Investment Research” as defined under the DFSA Conduct of Business Rules and has not been prepared in accordance with legal or regulatory requirements designed to promote the independence of investment research.
Any forward-looking statements, opinions, projections, forecasts, or market expectations are inherently uncertain and subject to change. Actual outcomes may differ materially due to market conditions, interest-rate movements, macroeconomic developments, geopolitical events, regulatory changes, or other factors. Past performance is not a reliable indicator of future results.
Digital Assets & Cryptocurrencies
References to cryptocurrencies or digital assets are provided solely for market commentary purposes. Cryptocurrencies are not regulated by the DFSA unless classified as Investment Tokens or Crypto Tokens under the DFSA Rulebook. Such assets may be subject to extreme volatility, liquidity constraints, valuation uncertainty, cyber risk, and the risk of total loss of capital.
Risk Disclosure
Investments may involve, among others:
• market and price volatility
• credit and counterparty risk
• liquidity risk
• interest-rate risk
• currency risk
• regulatory and legal risk
• potential loss of capital
Data Sources
Information is derived from sources believed to be reliable, including Bloomberg and internal analysis. However, no representation or warranty is given as to accuracy, completeness, or timeliness, and Astero Falcon accepts no liability for any loss arising from reliance on this document. Information is stated as at the publication date unless otherwise indicated.
Regulatory & Onboarding Restrictions
Any potential engagement with Astero Falcon is subject to full client classification, KYC, and AML procedures in accordance with DFSA requirements. Astero Falcon is under no obligation to enter into any transaction or engagement as a result of this document.
Confidentiality & Distribution
This document is confidential and may not be copied, reproduced, forwarded, or distributed, in whole or in part, without the prior written consent of Astero Falcon. Distribution of this document may be restricted in certain jurisdictions and it is the responsibility of the recipient to ensure compliance with applicable laws.
© 2026 Astero Falcon (DIFC) Limited. All rights reserved. Office 33, Level 7, Gate Village 10, DIFC, Dubai, UAE Email: info@asterofalcon.com | Website: www.asterofalcon.com
Chief Investment Officer: Elena Nefedov