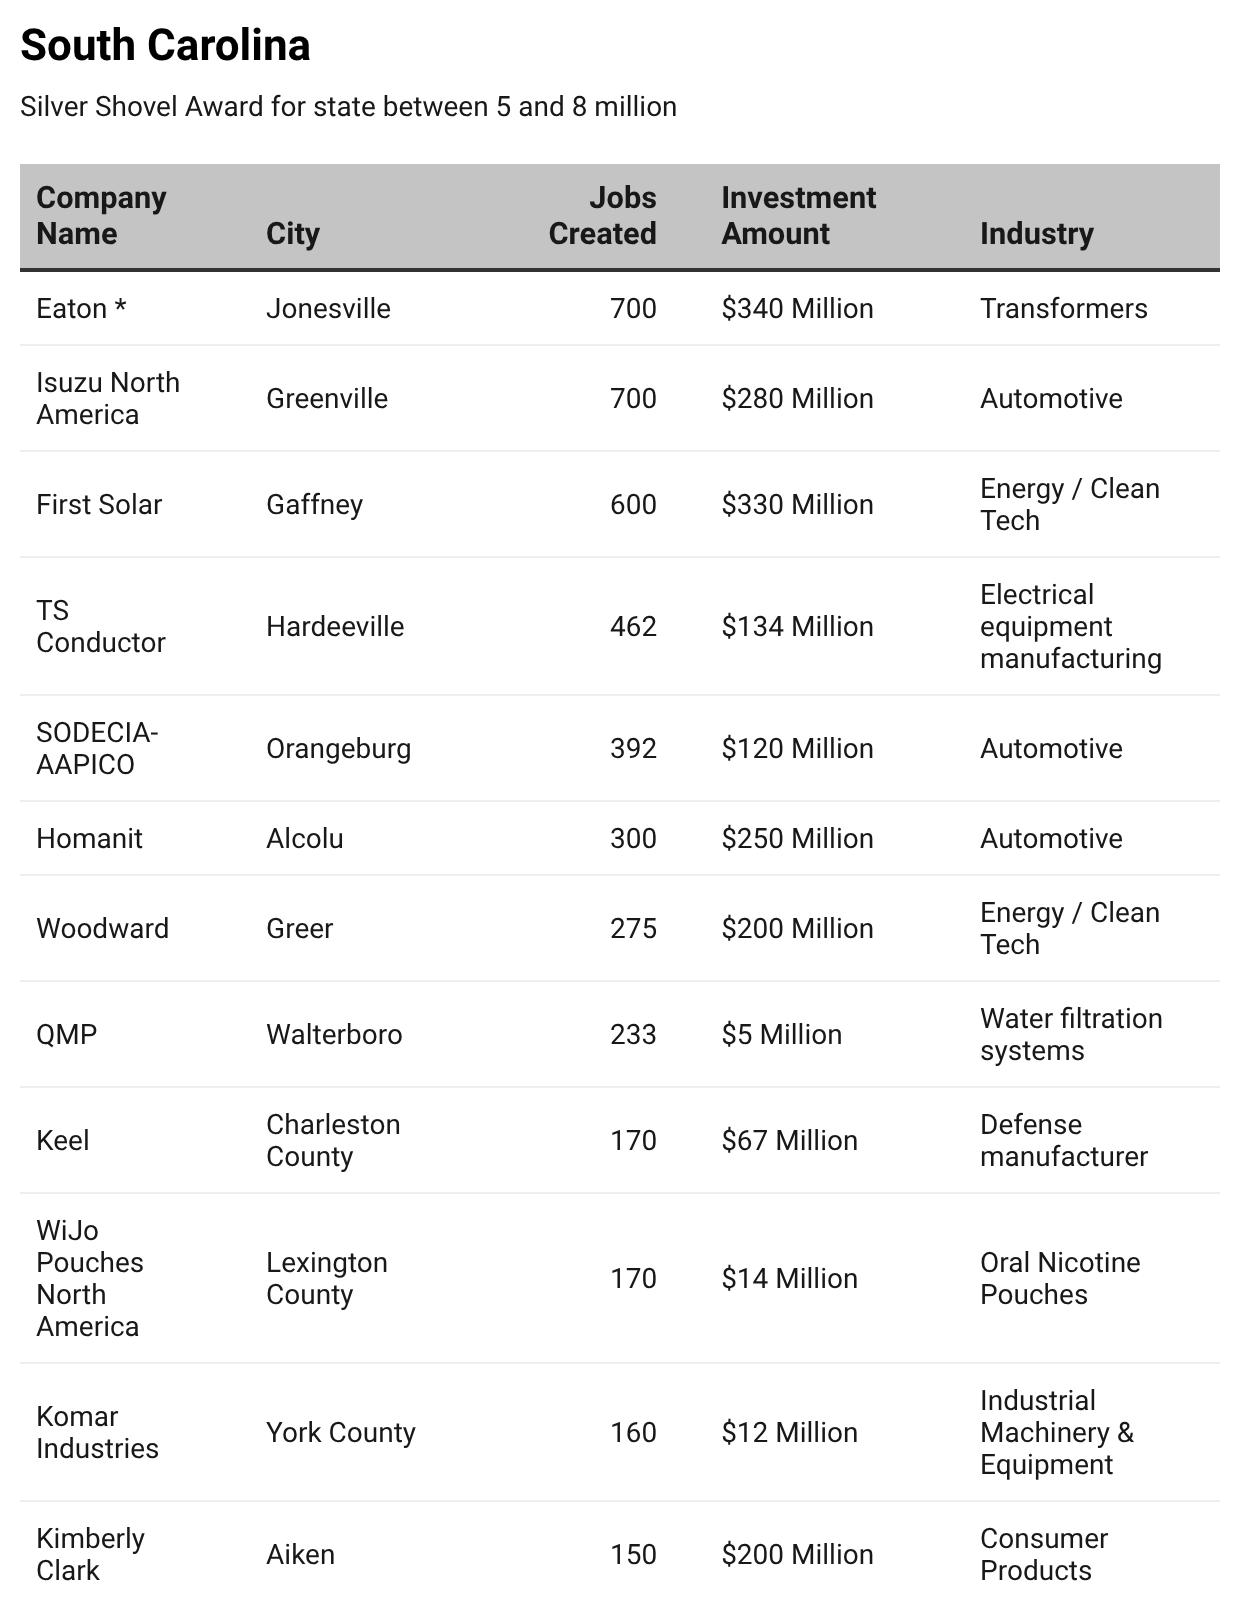
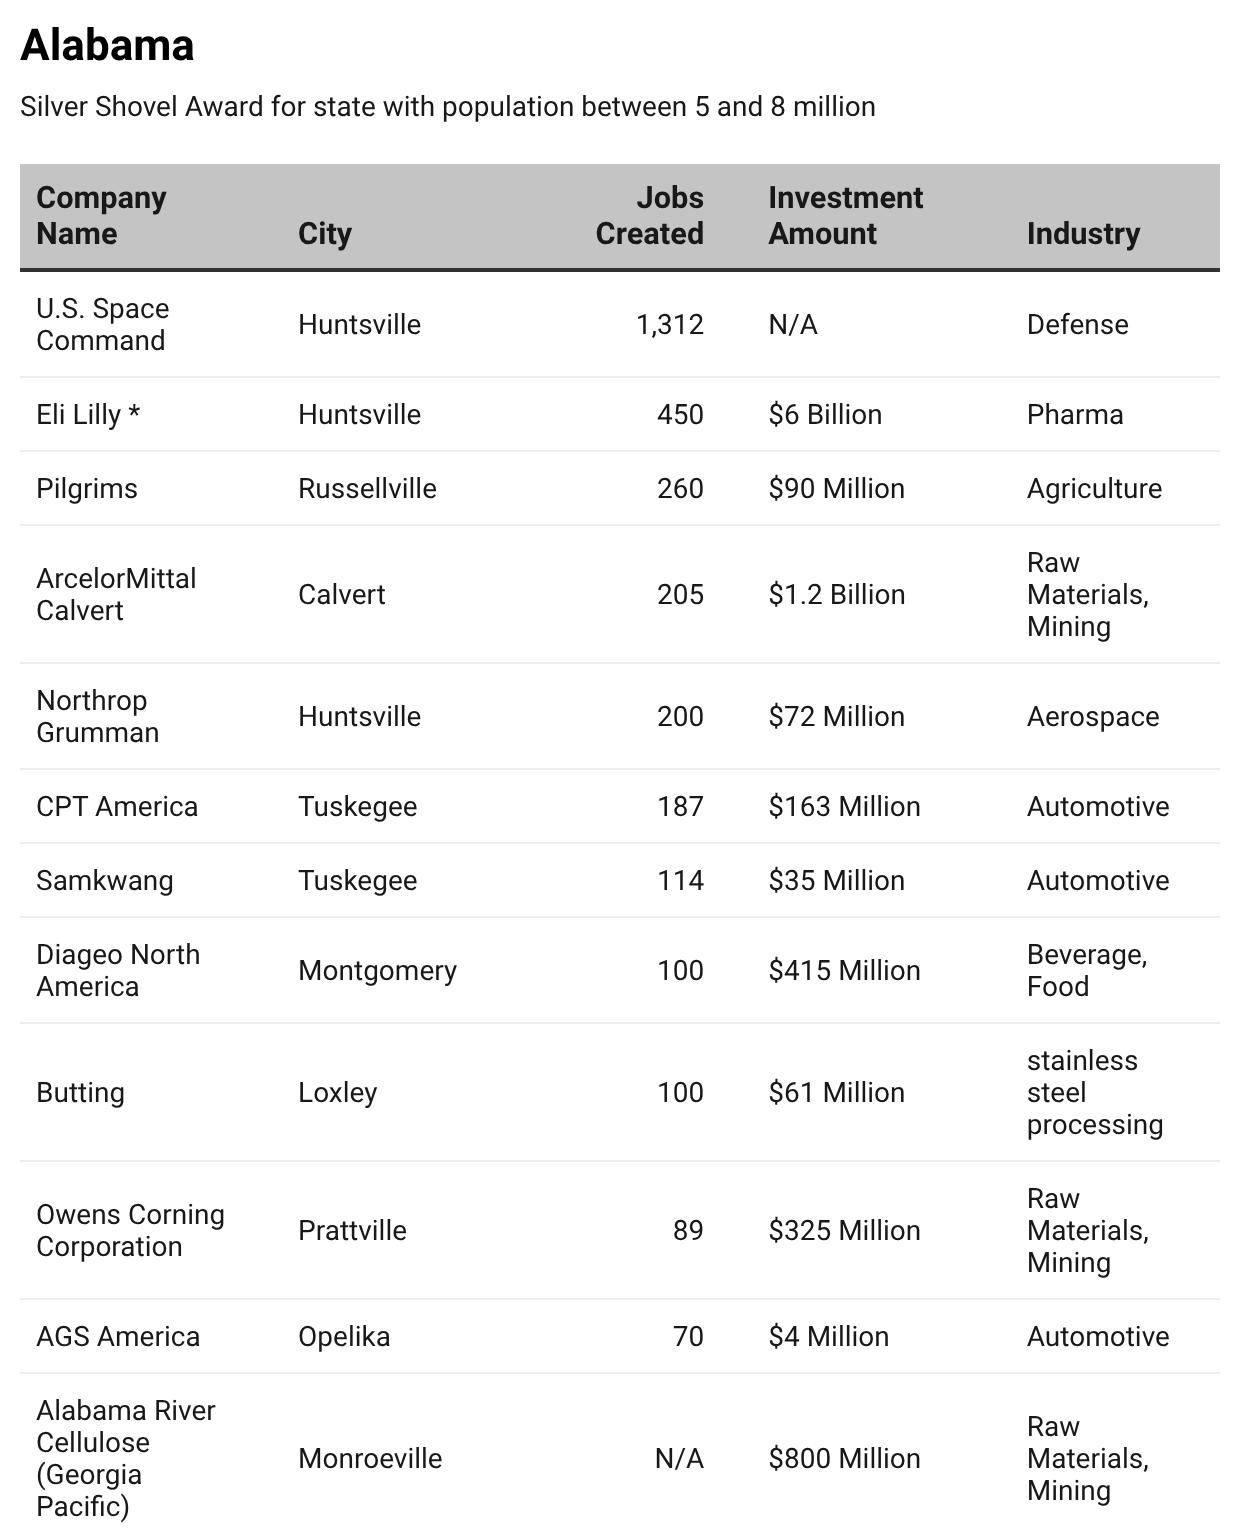
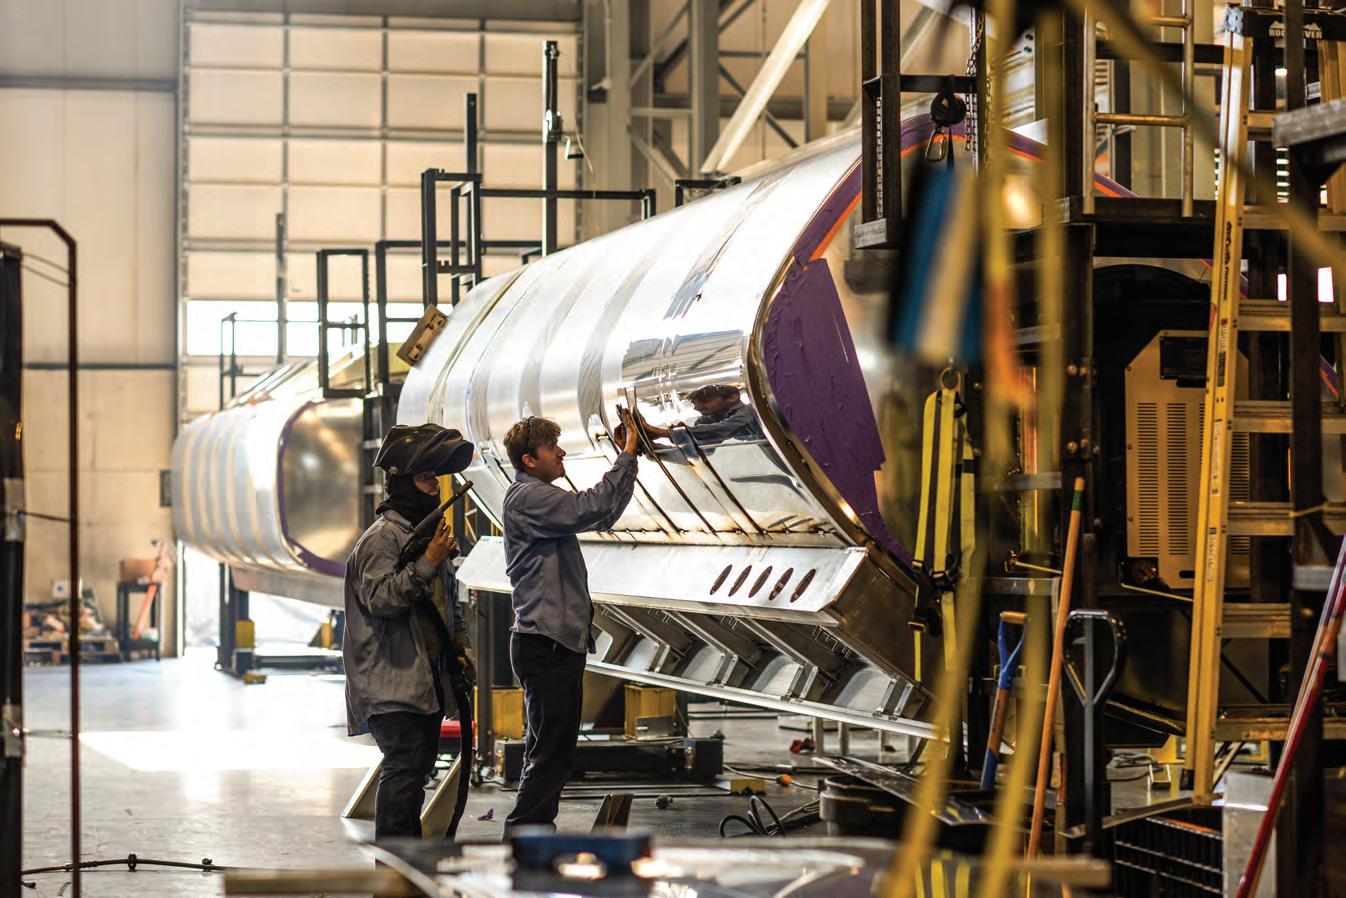
A site is only as great as the state it’s located in.
Every state has “shovel-ready sites.” Only Ohio has SiteOhio Certified Sites. The SiteOhio program goes beyond typical site due diligence and conducts a comprehensive analysis of commercial properties, business parks, and industrial sites to ensure they are construction-ready on day one. There’s a reason Ohio is ranked the #1 State in the Midwest for Doing Business, Top 5 Nationally.
HOW OHIO IS POWERING AMERICA’S NEXT INDUSTRIAL WAVE
With surging demand, business-friendly legislation and billions in investment, Ohio is building the energy infrastructure that factories, data centers and advanced manufacturers need to grow.
By JobsOhio
AI-driven data centers, automated advanced manufacturing and the digitization of our world are growing America’s appetite for electricity faster than at any point in a generation. States that step forward will capture an outsized share of growth, jobs and tax revenue for decades to come. Ohio is an attractive location because of its plentiful, lower-cost natural resources, reduced risk of natural disasters, affordable land and pro-business regulations.
As Ohio prepares for the future, JobsOhio, the state’s private nonprofit economic development corporation, is taking strategic steps to support the state’s energy production to meet increased demand. Since 2019, JobsOhio has secured more than 3,000 projects representing at least $99 billion in investments, 159,000 jobs and $9.2 billion in direct payroll. Most of those projects remain under construction — their full power requirements have yet to reach the grid. Forecasts put the peak electricity load 50 percent higher by 2034. Ohio’s strategy is backed by policy, capital and public-private coordination across natural gas, nuclear and the energy supply chain.
Enabling and investing in innovation. House Bill 15, Ohio’s first major energy policy overhaul in 17 years, passed with near-unanimous support and was signed into law by Gov. Mike DeWine in May 2025. The legislation provides favorable tax treatment for new power generation, requires siting decisions within 150 days and expands behind-the-meter generation, allowing large users to produce their own power. In addition to the revised policy, companies with eligible energy projects could receive
project assistance through JobsOhio’s $100 million Energy Opportunity Initiative — the five-year program is the only such program offered by a state economic development organization — directing grants, low-cost loans and talent services toward infrastructure, generation and nuclear supply chain projects.
Natural gas strength. Ohio is the leading oil producer east of the Mississippi River, and the Ohio Valley is projected to supply nearly half of the nation’s natural gas by 2040. Ohio, West Virginia and Pennsylvania are the only three states east of the Mississippi with sizable natural gas reserves and production. According to Cleveland State University’s Shale Investment Dashboard, cumulative shale-related oil and gas investment in Ohio through 2024 is estimated at approximately $114.6 billion. Of this, $82.5 billion has been in upstream industries, $22.5 billion in midstream industries and $9.5 billion in downstream industries. Nine new gas-fired generation projects are expected within five years, adding to the 16,430 megawatts already operational.
Nuclear renaissance. Centrus Energy recently announced plans to invest $1.57 billion to expand its uranium enrichment facility in southeastern Ohio — the only U.S. plant licensed to produce fuel for both today’s reactors and tomorrow’s advanced designs. Nearby, Oklo and Meta agreed to develop a 1.2-gigawatt nuclear power campus that begins preconstruction this year and targets completion by 2034. Meta and Vistra also announced an agreement in which Meta is purchasing 433 megawatts of incremental nuclear energy and capacity to
increase generation output at the Perry and Davis-Besse power plants in Ohio and Beaver Valley in Pennsylvania.
Building the workforce. Every megawatt needs people behind it. Centrus enlisted JobsOhio and its regional network partner, Ohio Southeast Economic Development, to help grow head count by approximately 60 percent by year’s end. JobsOhio’s Talent Acquisition Services program and the Energy Opportunity Initiative will identify opportunities for funding a portion of the company’s talent strategy, including investments to accelerate educational pathways at Ohio technical schools and universities. The state’s workforce ecosystem has a long history of helping companies hire for engineering and technician roles that Centrus is focused on.
A wide range of companies — from advanced manufacturing and automotive to chemicals and energy to aerospace and defense to AI and microelectronics — will find the power they need to grow in Ohio. Learn how JobsOhio can support your company’s growth goals at jobsohio.com.
This paid content was written by JobsOhio and approved by Area Development for publication.
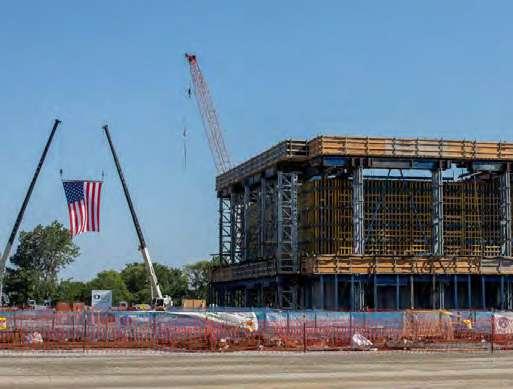
An industrial worker with a clipboard surveys her work place while an American flag hangs behind. Image courtesy of Centrus.
Ohio doesn’t just claim to be a better place to build. It backs it up with numbers and figures that can’t be denied. We’ve done the studies. Taken care of the utilities. And done the planning with the relevant state and federal entities. It’s no wonder Ohio’s ranked a top state in infrastructure and lowest cost of doing business…. Multiple years in a row.
CONGRATULATIONS TO TEAM OHIO
In recognition of the incredible service you provide, Ohio celebrates your achievements.
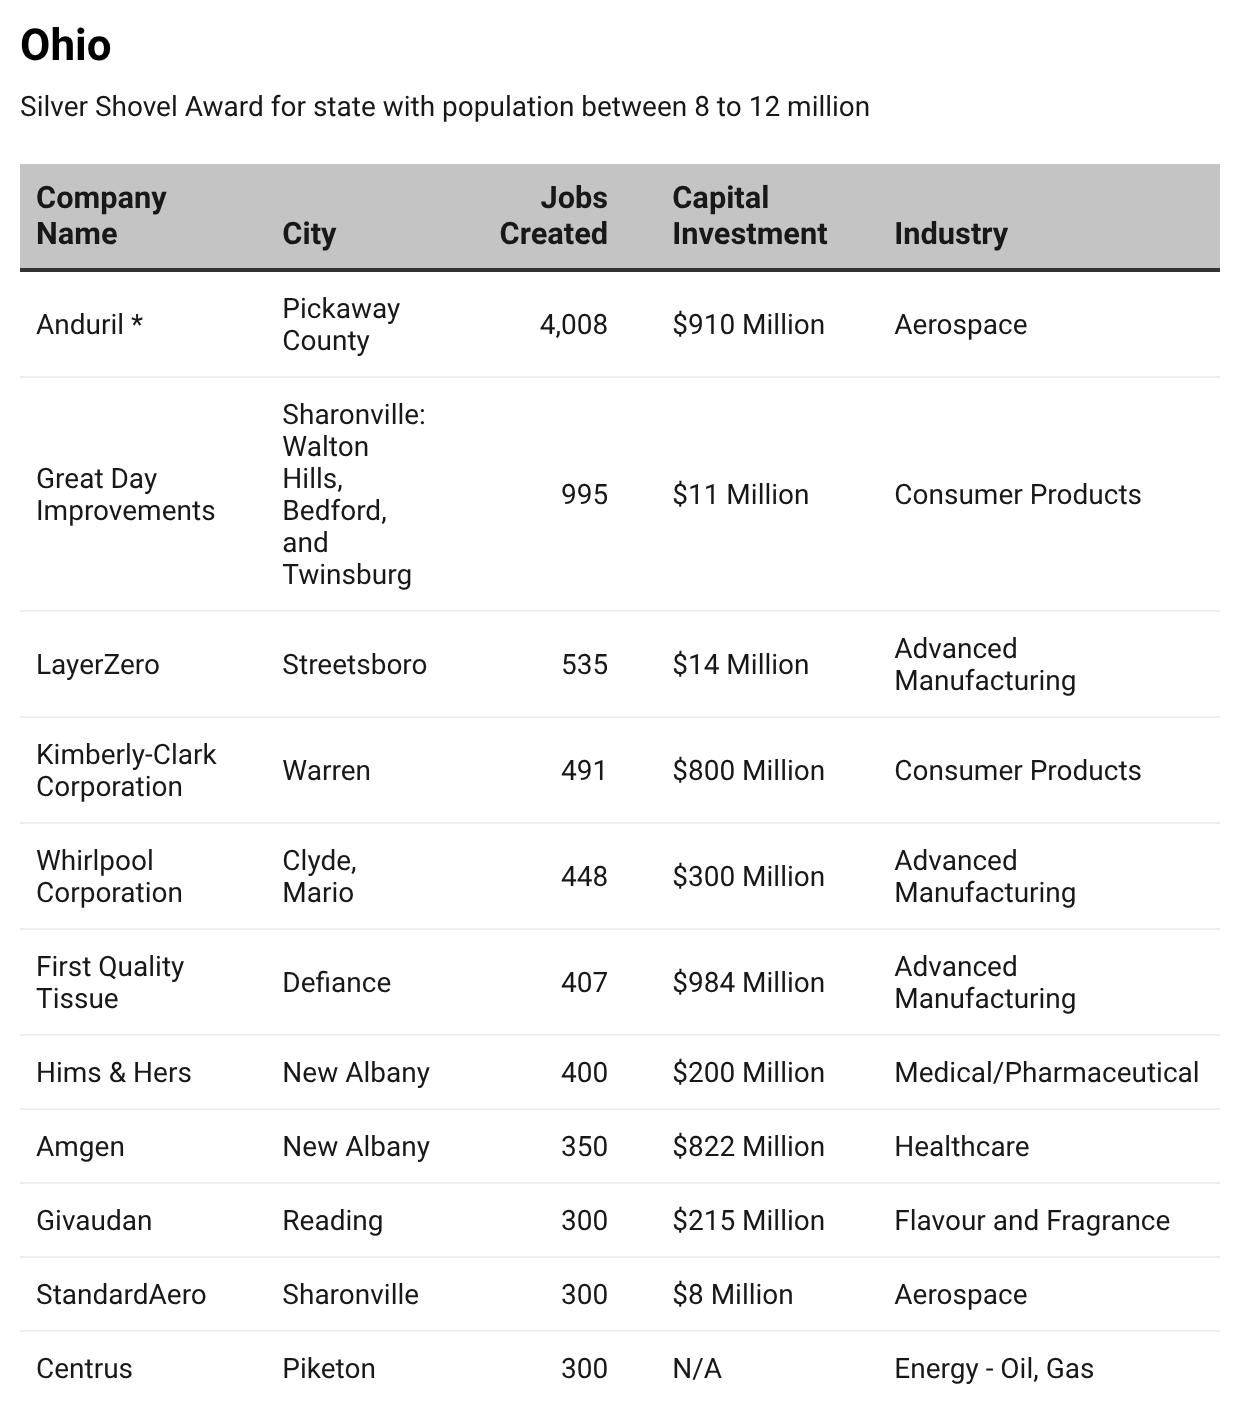
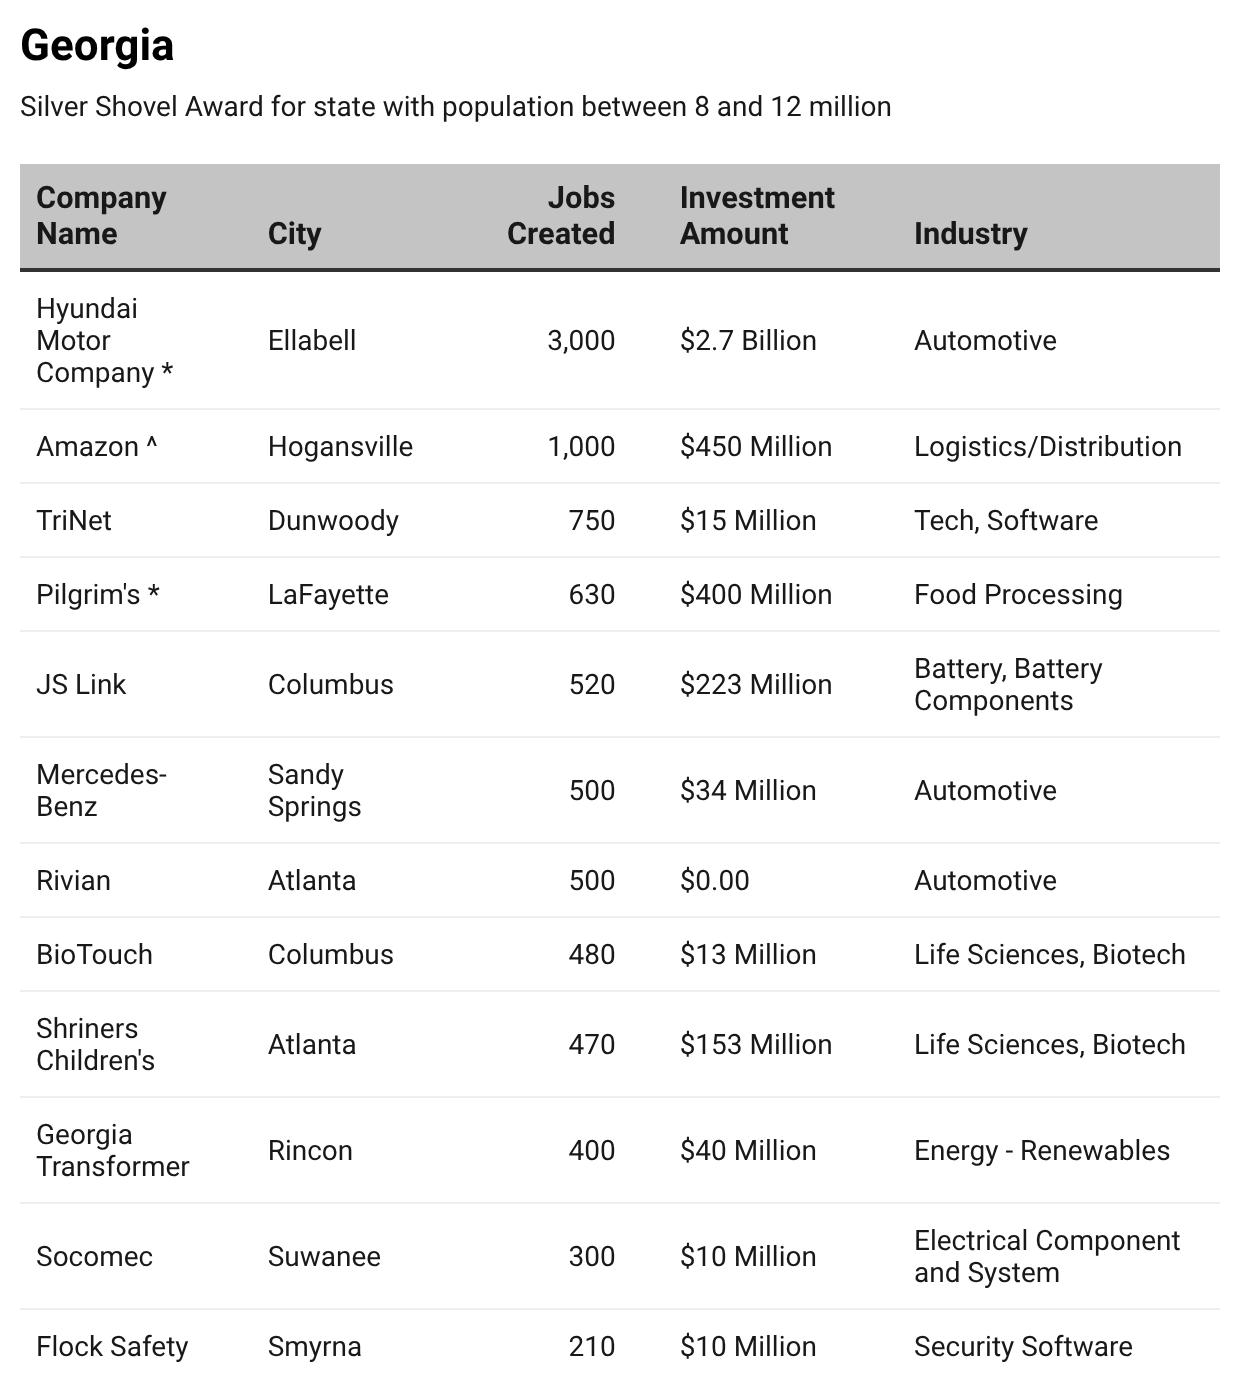
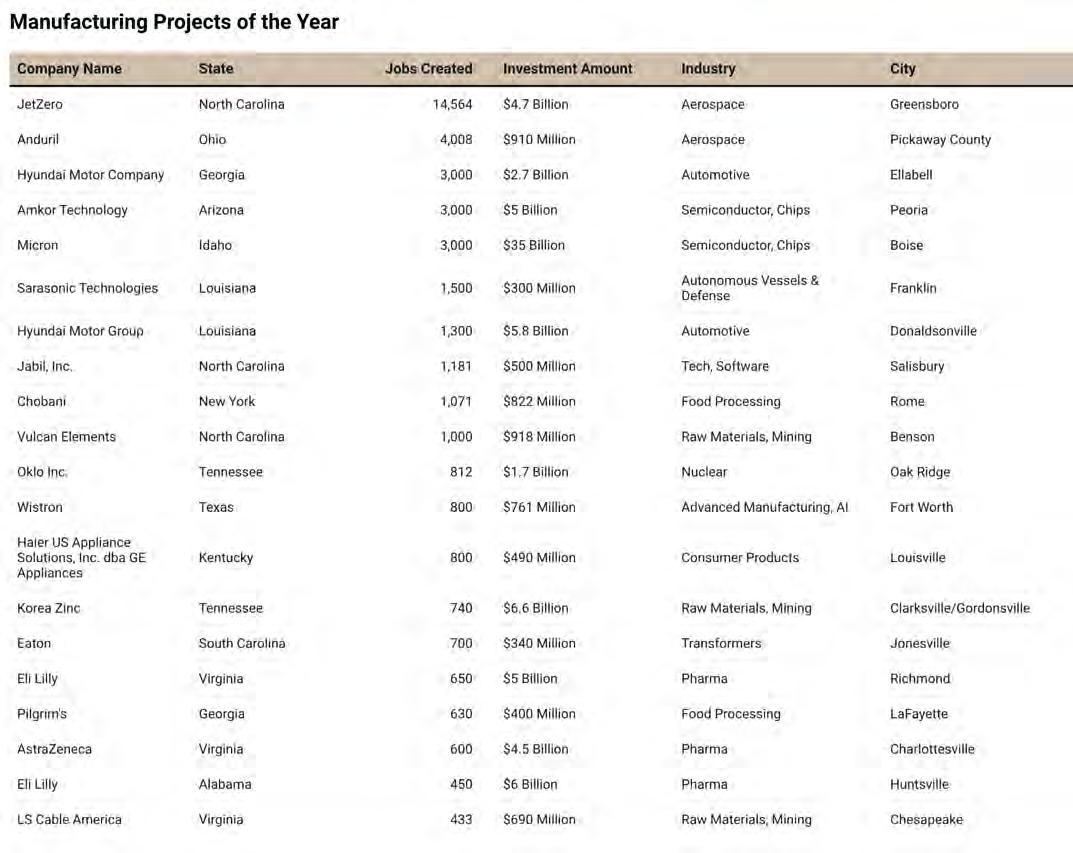
SILVER SHOVEL AWARD WINNER MANUFACTURING PROJECTS OF THE YEAR
The USA’s Best Project Deals page
34
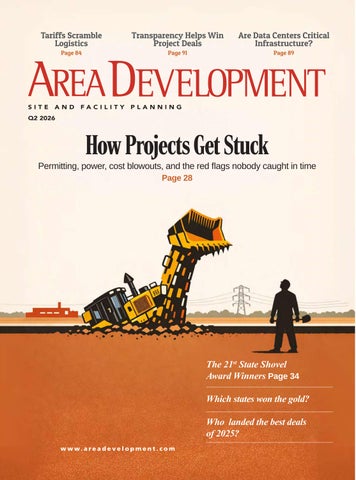
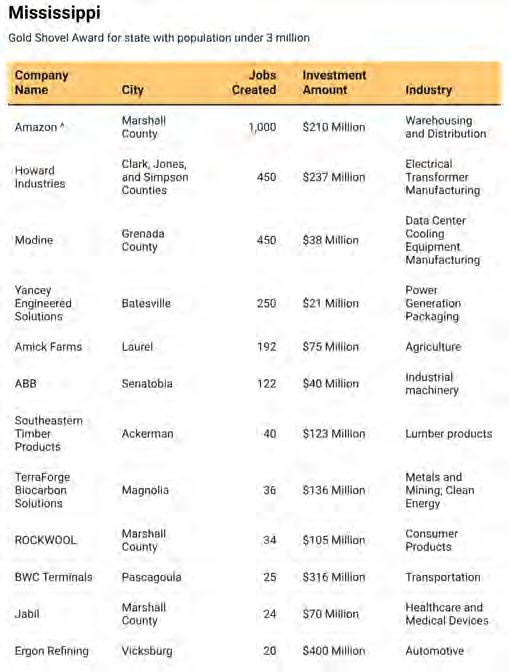
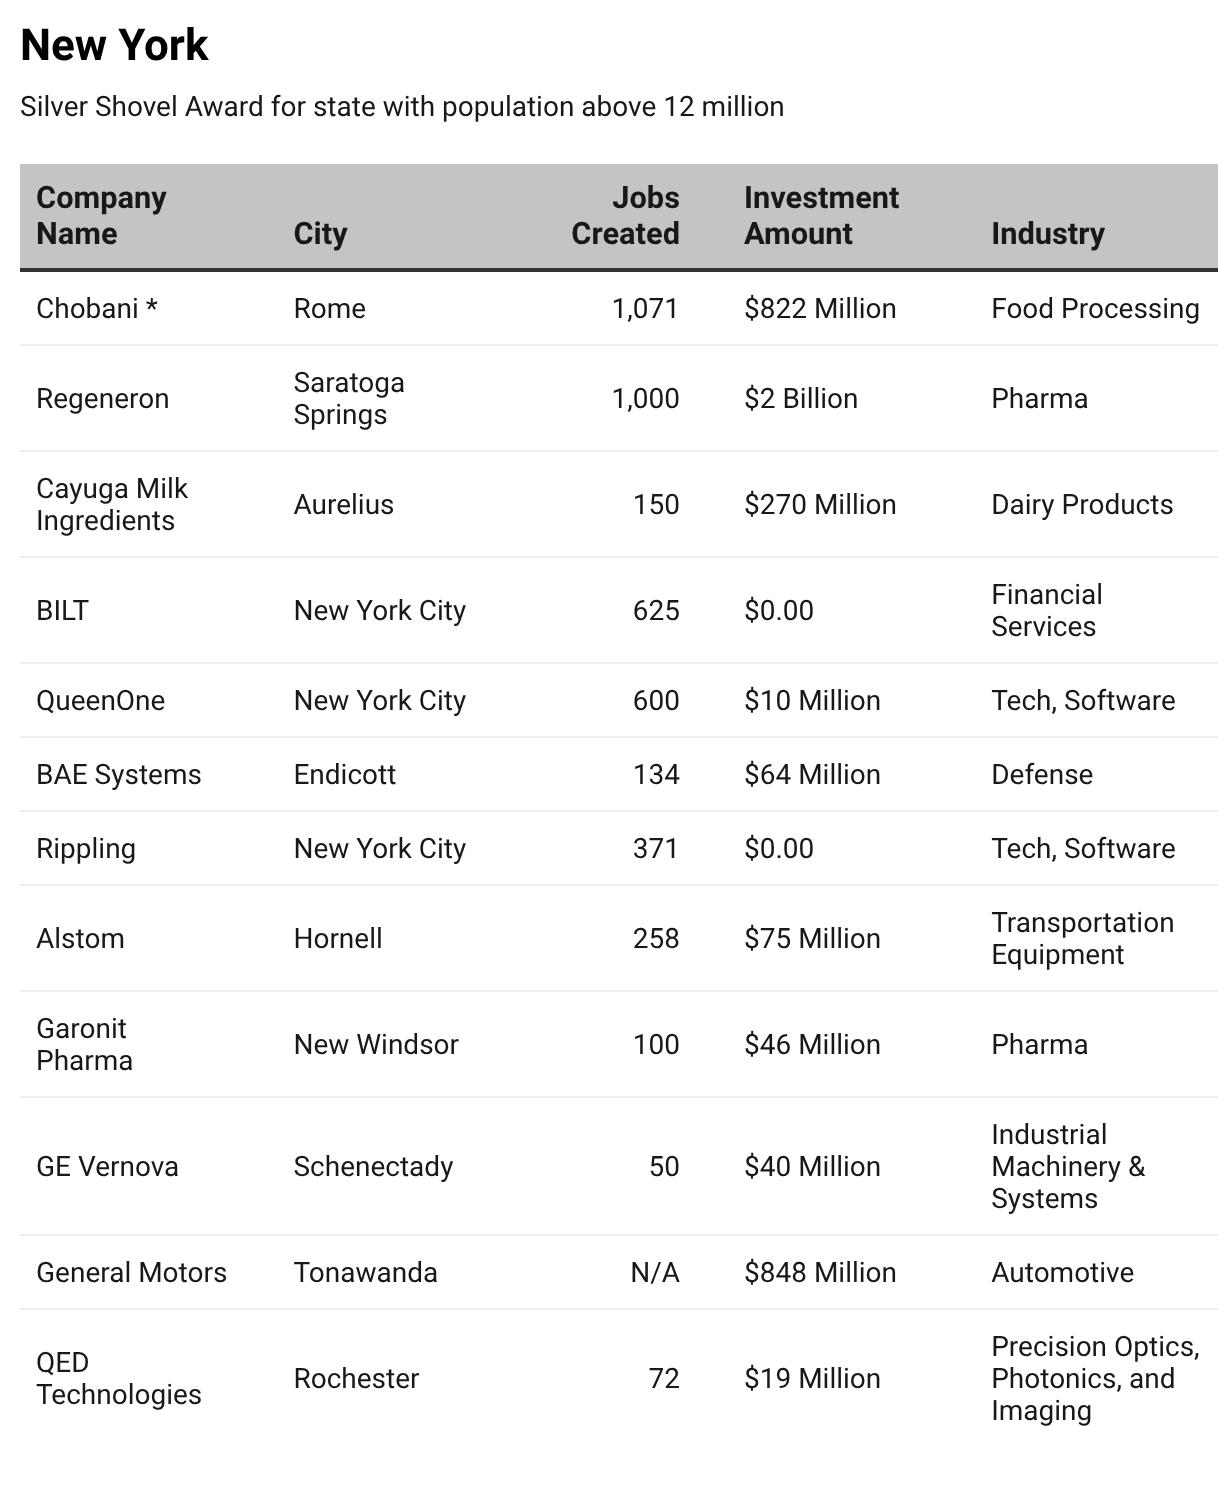
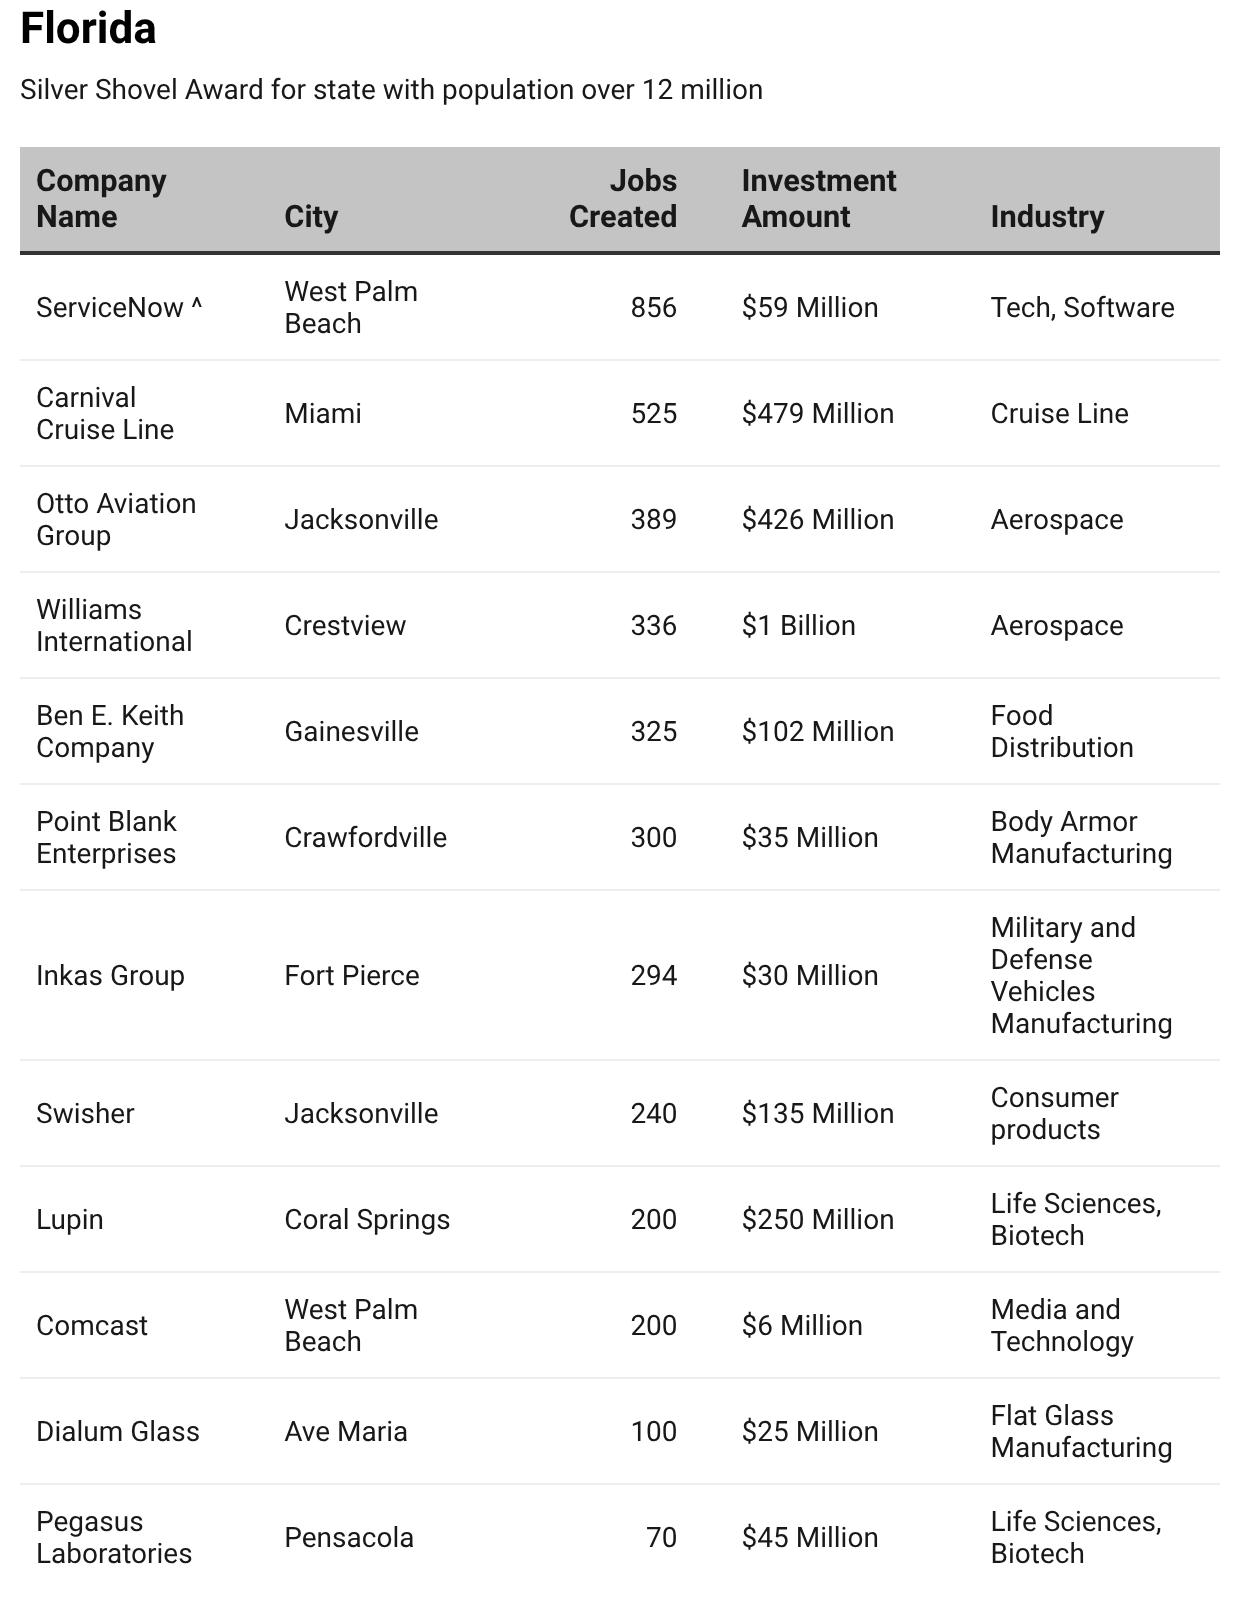
The 2026 Shovel Awards recognize the projects that delivered the largest investments, biggest job totals, and most significant economic impact in states across the country. See who took home the coveted Platinum Shovel!
How Projects Fail
page 28
Even the most promising projects can stall when critical risks are overlooked. From permitting surprises and infrastructure shortfalls to workforce gaps and environmental hurdles, site selectors and consultants share the red flags, costly mistakes, and preventable blunders that can derail a deal.
The life sciences market has moved beyond the boom years, but expansion has not disappeared. Companies are taking a harder look at cost, flexibility, and long-term operational needs.
Many incentive programs are designed for mature manufacturers with jobs and capital. Early stage biotech firms often need support long before they can meet traditional thresholds, leaving a critical gap in the innovation pipeline.
Scientific breakthroughs are only part of the challenge. Young biotech companies often struggle to navigate the transition from research to commercialization, facing obstacles in capital, facilities, and talent.
FEATURES
Data centers are reshaping the site selection map, but the real story is the race for generation, transmission, and grid capacity.
Defense spending, reshoring, and geopolitical risk are driving a new wave of manufacturing, logistics, and industrial facility investment.
Manufacturers are using AI to improve forecasting, inventory management, and logistics decisions in an increasingly uncertain world.
Communities that provide realistic timelines, accurate data, and clear communication are earning trust and winning projects.
saying about Office and HQ
Frontline Innovations and project insights from around the country
WISCONSIN IS A RISING FORCE IN BI OH EALTH AND BIOPHARMA MANUFACTURING
With research strength, manufacturing depth, and a statewide workforce strategy, Wisconsin is positioning itself as a destination for biohealth and biopharma growth
By WEDC
Wisconsin’s emergence as a national biohealth and biopharmaceutical manufacturing leader is no accident. Through strategic investment, research collaboration, and a long-standing commitment to workforce development, the state is building an ecosystem designed to support the future of healthcare innovation, from breakthrough discovery to large-scale manufacturing.
Today, Wisconsin’s biohealth industry contributes approximately $37.7 billion to the state’s economy each year and supports more than 58,000 jobs. A state once known primarily for its legacy manufacturing strength is now increasingly recognized for its leadership in personalized medicine, diagnostics, medical device production, and biopharmaceutical innovation.
That momentum accelerated in 2023 when Wisconsin earned federal recognition as a Regional Technology Hub, reinforcing the state’s growing influence in biohealth and biotechnology. The designation recognized Wisconsin’s unique combination of research excellence, manufacturing expertise, and collaborative infrastructure—a formula that continues to attract both global industry leaders and emerging startups.
At the center of Wisconsin’s success is its deeply integrated approach to innovation. Research institutions, private industry, economic development organizations, and government leaders work together to move discoveries from the laboratory to commercial application faster and more efficiently.
The University of Wisconsin-Madison remains one of the state’s most powerful innovation engines. Long regarded as a premier research institution, UW-Madison has helped drive advances in bioscience, data-driven healthcare, and precision medicine through initiatives such as the Wisconsin Health Data Hub and the state’s Biohealth Tech Hub. These efforts are creating new opportunities for companies developing next-generation therapies, diagnostics and manufacturing technologies.
Wisconsin’s manufacturing heritage also provides a critical competitive advantage. Wisconsin suppliers provide products worth $7.8 billion to the state’s biohealth industry annually—an indicator of the broad and deep supply chain that exists for biohealth companies in Wisconsin. Employment among medical equipment suppliers has risen steadily in recent years, underscoring the sector’s continued growth trajectory.
That combination of research and production capability has drawn major investment from some of the world’s leading life sciences companies.
In Madison, global biotech company Catalent announced a $45 million expansion designed to strengthen the company’s biologics manufacturing capabilities. In southeastern Wisconsin, Eli Lilly and Co. is investing $4 billion into a major expansion in Kenosha County to increase capacity within its global injectable drug manufacturing network. Meanwhile, Abbott’s acquisition of Madison-based Exact Sciences further
highlighted the state’s prominence in diagnostics and precision medicine innovation.
However, Wisconsin’s biohealth story extends beyond large-scale corporate investment. The state has cultivated an environment where startups, entrepreneurs, and midsize companies can grow alongside established industry leaders. That collaborative culture has become one of Wisconsin’s defining characteristics and is a key reason more than 2,200 biohealth companies now operate across the state.
Organizations such as BioForward play a major role in sustaining that ecosystem. As Wisconsin’s leading biohealth industry association, BioForward helps connect companies, researchers, educators, and policymakers while supporting the growth of the Wisconsin Biohealth Tech Hub initiative.
“Wisconsin is uniquely positioned to lead the future of biohealth innovation because of the strong partnerships between our research institutions, manufacturers, and workforce development organizations,” said John W. Miller, CEO of the Wisconsin Economic Development Corporation. “Companies here have access to world-class talent, cutting-edge research, and the infrastructure needed to grow and compete globally.”
Talent development remains another foundational pillar of Wisconsin’s strategy. For companies evaluating locations for expansion or relocation, access to a skilled workforce is often one of the most important considerations. Wisconsin has spent decades building that pipeline.
The state was the first in the nation to establish a technical college system, and workforce readiness continues to be a top priority. Wisconsin’s highly integrated technical college network now serves nearly 275,000 students across 16 colleges and nearly 50 campuses statewide, providing hands-on training aligned with industry needs.
That investment begins well before students enter college. Wisconsin has committed more than $5.5 million toward K-12 fabrication laboratories that provide hands-on science, technology, engineering, art and mathematics education. These programs expose students to advanced manufacturing and engineering concepts early, helping cultivate the next generation of biohealth and biopharma talent.
As the life sciences industry continues to evolve, Wisconsin is positioning itself not only as a center for innovation, but also as a destination where companies can successfully scale manufacturing, access world-class research, and develop the workforce needed for long-term growth.
For an industry increasingly focused on resilience, collaboration, and speed to market, Wisconsin offers a model for how states can successfully align education, research, and manufacturing to support the future of biohealth.
BUILD we
A Rising Tide
Each year, the Gold & Silver Shovel Awards offer a snapshot of where deals are landing—and why. This year’s competition was as tight as we’ve seen. States are not just competing on incentives or megasites, but on execution: speed to market, infrastructure readiness, and the ability to navigate an increasingly complex operating environment. We won’t give away the winners here, but what stood out in the judging process was how many projects had to clear higher bars than ever before—on timelines, on certainty, and on long-term viability.
That’s reflective of the broader state of site selection.
Demand remains strong across key sectors, but it is colliding with a more complicated reality. Trade policy continues to evolve in ways that are difficult to model. Supply chains are more diversified, yet still vulnerable to geopolitical shocks. Conflicts abroad are reshaping energy markets and redirecting capital toward defense and strategic industries. At the same time, higher costs of capital and tighter underwriting standards are forcing companies to be more selective, more precise, and less willing to take on risk.
2026 EDITORIAL ADVISORY BOARD
Scott Kupperman Founder KUPPERMAN LOCATION SOLUTIONS
Eric Stavriotis Vice Chairman, Advisory & Transaction Services CBRE
Brian Corde Managing Partner ATLAS INSIGHT
Amy Gerber Executive Managing Director, Business Incentives Practice CUSHMAN & WAKEFIELD
Alexandra Segers General Manager TOCHI ADVISORS
Dennis Cuneo Owner DC STRATEGIC ADVISORS
Courtney Dunbar Site Selection & Economic Development Leader BURNS & MCDONNELL
Ramya Gowda Managing Director, Global Strategy and Consultin NEWMARK
JC Renshaw Head of Supply Chain Consulting SAVILLS
AREA DEVELOPMENT
Publisher Dennis J. Shea dshea@areadevelopment.com
Sydney Russell, Publisher 1965-1986
Events / Business Development Director
Matthew Shea (ext. 231) mshea@areadevelopment.com
Media / Accounts Director
Justin Shea (ext. 220) jshea@areadevelopment.com
Nowhere is this recalibration more visible than in life sciences. After years of rapid expansion, the sector is entering a more measured phase—one defined by scrutiny around location decisions, workforce alignment, and the long-term functionality of space. Growth is still happening, but the criteria have changed.
What ties all of this together is a narrowing margin for error. Projects are still moving, but only where the fundamentals hold up under pressure. The states and regions succeeding in this environment are the ones that can offer not just opportunity, but confidence.
Editor
Chris Volney Managing Director, Americas Consulting CBRE
Matthew R. Powers, Lead Site Selection Consultant REDI SITE SELECTION
Scott J. Ziance Partner and Economic Incentives Practice Leader VORYS, SATER, SEYMOUR AND PEASE LLP
Chris Chmura, Ph.D. CEO & Founder CHMURA ECONOMICS & ANALYTICS
Alan Reeves Senior Managing Director, Global Strategy Consulting NEWMARK
Lauren Berry Director, Location Analysis and Incentives
MAXIS ADVISORS
Courtland Robinson Director of Business Development
BRASFIELD & GORRIE
Dianne Jones Managing Director, Business and Economic Incentives
Middlesex County, New Jersey is rewriting the economic development playbook — one relationship at a time
By Kimberly Graulein, Area Development Staff
The Northeast corridor doesn’t lack for life sciences real estate. What it often lacks is coordination — the kind that moves a deal from letter of intent to certificate of occupancy without late-stage permitting friction. That gap is where Middlesex County, New Jersey has built a measurable advantage.
Rather than competing solely on inventory, the county has focused on execution — aligning stakeholders early, mitigating risk, and accelerating timelines for companies navigating complex regulatory and development pathways.
“We operate as an extension of a company’s team,” says Sho Islam, Director of the Office of Business Engagement at Middlesex County. “From site selection through approvals, we coordinate every stakeholder at the table, so projects move forward without unnecessary delays.”
One focal point for that strategy is HELIX New Jersey: a 1.5-million-square-foot life sciences and innovation campus spanning three buildings, adjacent to a New Jersey Transit rail line. Among the largest projects of its kind in the state, HELIX represents a long-term institutional commitment to cluster development — not speculative space, but a platform designed to attract, grow, and retain companies across the innovation lifecycle.
That strategy is already taking hold with the county securing its first tenant. PharmaMedic, a Glasgow-based company leveraging AI to accelerate drug discovery for underserved conditions, selected Middlesex County for its U.S. expansion. The company will establish operations within Portal Innovations’ 30,000-square-foot incubator at HELIX — a decision shaped by more than real estate.
It reflects a deliberate ecosystem, grounded in geography, research infrastructure, and workforce depth.
Middlesex County sits at the midpoint of the Boston–Washington corridor, within roughly an hour of five major airports serving New York City and Philadelphia. With expanding Amtrak services, there are more options for same-day travel to Washington, D.C. — a meaningful advantage for life sciences firms navigating FDA engagement and federal partnerships.
The county’s research pipeline reinforces the location advantage. Rutgers University, produces a steady flow of STEM talent and commercialization activity. Princeton University contributes to the region’s broader innovation ecosystem and recruiting strength. Together, they sustain a deep, continuously replenished talent pool.
Cost competitiveness remains part of the equation. Middlesex County offers a more efficient alternative to markets like New York, Boston, and San Diego without
sacrificing access to talent, infrastructure, or capital.
“You’re not forced to choose between cost and capability here,” Islam says. “Companies can scale in a market that delivers both.”
For site selectors, however, the more consequential differentiator is how the county manages the deal itself.
New Jersey’s home rule structure — in which municipalities retain control over zoning and permitting — can introduce complexity that can derail projects late in the process. Issues that surface after capital is committed can stall timelines and undermine internal confidence in a location decision.
Middlesex County is structured to address that risk early.
Through its Office of Business Engagement, the county convenes municipal leaders, state partners including the New Jersey Economic Development Authority, Choose New Jersey, and key permitting stakeholders at the front end of a project. The objective is clear: identify constraints early, align decision-makers, and reduce the likelihood of costly delays.
That approach translates into execution. Genmab, the international biopharmaceutical company, selected Middlesex County with coordinated support across state and local partners. Made Scientific, a spinout from NJIT, remained engaged with the county over several years as its operational needs evolved before finalizing its location — a process defined by continuity and responsiveness.
“With Made Scientific, the priority was consistency,” Islam says. “We stayed engaged through every pivot and helped navigate each stage of the process — that’s what ultimately brings projects across the finish line.”
For corporate real estate teams, that level of process management has tangible value. Permitting delays doesn’t just affect schedules; they introduce risk into capital deployment decisions and weakens internal alignment. Middlesex County is not positioning itself as the lowest-cost option in the corridor. It is positioning itself as the lowestfriction one. For life sciences companies operating on compressed timelines and complex regulatory pathways, that distinction is decisive.
To learn more, contact the Middlesex County Office of Business Engagement at biz@co.middlesex.nj.us or visit www.middlesexcountynj.gov/biz.
This paid content was written by Area Development Magazine on behalf of Middlesex County based on an interview with Sho Islam, Director of the Office of Business Engagement, Middlesex County Department of Economic Development, New Jersey.
Ingredients: Supply chain resiliency. Legendary innovation. World-class talent. Exceptional quality of life. Fortified with 100% of your daily value of business support. Visit biz.DiscoverMiddlesex.com to schedule a meeting with an advisor in your industry. MOVE HERE. THRIVE HERE.
How Geopolitics Became A Site Selection Variable
Trade policy, tariffs, and global instability are reshaping where manufacturing projects land—and whether they move forward at all
By Alexandra Segers General Manager, Tochi Advisers
Geopolitics used to sit at the edges of site selection—a risk factor to note, a scenario to model, but not a driver of the decision. That has changed. For foreign direct investment projects in particular, geopolitical risk has moved to the center of the analysis.
Trade tensions across North America, the European Union, and key Asian trading partners are creating real hesitation among international investors. The question companies are asking before committing capital to a U.S. manufacturing location is no longer just whether the site meets technical requirements—it is whether the broader environment is stable enough to justify a 20- or 30year operational commitment.
The USMCA Review: A Structural Uncertainty
The United States–Mexico–Canada Agreement approaches its first major review in July 2026. This is not a formality. Built into the agreement is a checkpoint at which all three countries must decide whether to extend the deal for another 16 years, renegotiate its terms, or allow it to move toward expiration in 2036. For manufacturers, particularly in the automotive
sector, this review matters enormously. North American automotive supply chains cross borders multiple times before a vehicle is completed. Parts manufactured in Mexico ship to U.S. assembly plants; Canadian suppliers feed both. The trade rules that govern those flows—tariff structures, content requirements, rules of origin—are what make those supply chains economically viable.
If the agreement is extended cleanly, that stability allows investment planning to proceed. If it is renegotiated with significant changes, companies must reassess. If the outcome is uncertain for months, investment decisions slow. The uncertainty itself is a cost.
Supply Chain Exposure and the Chokepoint Problem
Geopolitical disruptions also affect the raw materials that manufacturing depends on. Critical inputs—copper, nickel, cobalt, aluminum—move through global trade routes that are increasingly subject to disruption. Supply chain planners who once treated those routes as reliable are now building in redundancy, nearshoring where possible, and evaluating sourcing strategies with geopolitical scenarios in mind.
This has direct implications for site selection. A location’s proximity to domestic or nearshore suppliers matters
more than it did a decade ago. Dependence on long or politically exposed transit routes is now a risk to be assessed, not assumed away.
Where Investment Is Going—and Why
The United States remains a compelling manufacturing destination: deep infrastructure, skilled workforce, large domestic market, and a legal framework that supports long-term investment. But companies are evaluating it in context. Mexico offers lower labor costs and USMCA-connected trade access. Emerging manufacturing hubs in Southeast Asia and North Africa offer targeted incentives and competitive cost structures. Each option carries its own geopolitical profile.
For foreign investors— particularly those from countries currently in trade tension with the United States—the calculation is more complex. Regulatory scrutiny through mechanisms like CFIUS (Committee on Foreign Investment in the United States) can add timeline uncertainty and cost. Some investors have redirected capital to Mexico or Canada for exactly this reason, seeking locations where geopolitical friction is lower even if other factors are less ideal.
Long-Term Commitments in a Short-Term Policy Environment
Manufacturing investments are inherently long-term. A
new plant represents a 20- to 30-year operational commitment, with capital deployed upfront and returns realized over time. Geopolitical conditions can change substantially within that window.
This mismatch—between the permanence of the investment and the volatility of the policy environment—is one of the defining tensions in site selection today. Companies must evaluate not just current conditions, but plausible scenarios: What happens to this site’s economics if a trade agreement changes? What happens to supply chain access if tariffs are introduced or withdrawn? What is the regulatory risk if political leadership shifts?
These are not hypothetical questions. They are now part of the due diligence process. Geopolitics has become a site selection variable—not because it always determines the outcome, but because ignoring it now carries costs that cannot be hedged away later.
Geopolitics used to sit at the edges of site selection... That has changed.
Why Water Isn’t a Universal Constraint for Data Centers
The real issue isn’t always supply but community vibes
By Kimberly Graulein Area Development Staff
When data centers enter a community, water is often the first concern to surface. Residents worry about wells running dry. Local officials brace for strain on municipal systems. Developers arrive with demand projections that can appear outsized at first glance.
Both sides have a point. “On paper, these data centers are just banks of computers that generate a lot of heat,” said Shannon Markham, vice president and regional manager for water at AECOM. “And water is often used as a cooling component, either directly or indirectly.”
That function is straight forward. What’s less clear— and often contested—is how much water is actually required, and under what conditions.
Developers typically present demand based on peak scenarios: the hottest day of the year, at full compute load, when cooling systems are under maximum stress. Those figures ensure reliability, not average use.
“They base their demand on the worst possible time,” Markham said. “What those don’t really reflect is reality on an average day basis.” That distinction matters, but it does not resolve the issue.
Peak demand is not hypothetical. Systems must be built to accommodate it, and in regions where infrastructure is constrained, those peaks can drive real costs—whether they occur daily or only a handful of times each year.
For site selectors, the takeaway is not to dismiss peak numbers, but to interrogate them. How often will those conditions occur? What infrastructure is required to support them? And who ultimately pays for that capacity?
The answers vary widely by region.
In water-stressed parts of the western United States, large new users—data centers included—face increasing scrutiny. Allocation, longterm supply, and competing demands from agriculture and residential growth are already under pressure. In those markets, water can become a limiting factor in site selection.
In the Midwest, the picture is more mixed.
“Compared to the West Coast, where they get a fraction of the rain we do, we’re in a different position,” said John Newsome, administrator of water for the City of Columbus, Ohio.
Many Midwestern systems were built to support heavy industrial use and now operate below capacity, creating potential openings for new demand.
“I do see an opportunity for some of the Rust Belt cities that have lost big manufacturing and population,” Newsome
said. “They have excess water.” But excess capacity on paper does not always translate to project readiness.
Water systems are localized. Treatment plants, distribution networks, and permitting frameworks all shape how—and whether—that capacity can be used. In some cases, infrastructure upgrades are required before a project can move forward. In others, competing growth—from residential development to other industrial users—can quickly absorb available supply.
Even in regions that are not water-constrained, water can still become a point of friction.
“Land use, energy demand, and water—they all come up,” Markham said, describing the sources of community opposition.
In practice, water concerns are rarely evaluated in isolation. They tend to be bundled into broader questions about how a project will affect a community—its resources, its costs, and its long-term trajectory.
“My energy rates are going to go up. My well is going to run dry,” said Trace Johnson, president of multiple businesses including AI and infrastructure, describing how projects are often perceived at the local level.
Those concerns are sometimes overstated. But they are not irrational.
Data centers are intensive users of both water and energy, and their demands
are highly concentrated. Even if average consumption is lower than peak projections suggest, the infrastructure required to support that peak must still be financed, built, and maintained.
That is where the conversation is shifting.
Rather than focusing solely on total water availability, communities and developers are increasingly looking at how water is sourced, delivered, and reused. Recycled water systems—long used in parts of the West—are gaining attention as a way to reduce pressure on potable supplies.
“Recycled water lessens our demand on potable water,” Newsome said.
For site selectors, reuse infrastructure can signal a higher level of readiness. But it also introduces additional complexity, from permitting to treatment standards to longterm system management.
“The Rust Belt cities that have lost big manufacturing and population ... have excess water.”
Mississippi is breaking new ground for business with record-setting speed to market. Shovel-ready sites and smoother processes coupled with collaborative communities and leadership help you turn the corner from investment to revenue faster.
Let’s break new ground together.
mississippi.org
2026 Corporate HQ Outlook: Smaller,
Fewer, and Pricier
Companies are making incremental, portfolio-level adjustments
By Area Development Research Desk
Across the major brokerage outlooks, the HQ conversation so far in 2026 has settled into something more practical than the last few years of debate. Hybrid is not temporary. Footprints are not going back to pre-2020 levels. And companies are no longer waiting to see how it plays out — they’re acting on it.
What that’s producing is not a collapse in headquarters demand, but a repricing of what headquarters space needs to do.
CBRE’s 2026 U.S. Office Outlook captures the structural imbalance clearly. Overall vacancy remains elevated — in many markets still in the high teens or higher — but that number obscures what’s actually happening inside portfolios. Demand is concentrating in newer, higher-quality assets, while older inventory continues to drag on the market (CBRE). CBRE notes that positive absorption is increasingly limited to top-tier buildings, reinforcing a widening performance gap that is now measurable, not anecdotal.
JLL’s workplace research adds the operational layer behind that shift. Across its global occupier base, the firm continues to see companies stabilizing around hybrid attendance patterns, typically in the two- to three-day inoffice range, which materially reduces peak occupancy requirements (JLL). That’s the driver behind footprint reduc-
tions — not cost-cutting alone, but utilization math.
The result is a consistent pattern: companies are taking less space, but paying more for it on a per-square-foot basis.
Cushman & Wakefield’s office market analysis reinforces that this is not simply a “Class A vs Class B” story. The firm points to sustained demand for buildings that offer amenities, transit access, and integration into mixed-use environments, while commodity office product struggles to compete (Cushman & Wakefield). In other words, quality is necessary, but experience is the differentiator.
That distinction matters for headquarters in particular. The HQ is no longer expected to house the entire workforce — but it is expected to function as the center of gravity for collaboration, culture, and decision-making. And that puts pressure on both design and location.
Newmark’s 2026 CRE Outlook suggests that occupiers are moving out of the “waitand-see” phase and into active portfolio restructuring, with more companies making longer-term commitments after several years of short-term extensions (Newmark). That shift is important. It signals that the market is no longer trying to predict the future of work — it’s operating within it.
Those decisions are increasingly consistent: Footprints reduced by 15–30 per-
cent from pre-pandemic levels; Greater allocation of space to collaboration and shared environments; Less tolerance for underutilized private offices and excess square footage.
Those trends are showing up directly in leasing behavior. Companies are consolidating locations, exiting secondary offices, and reinvesting in fewer, higher-impact headquarters environments.
Geography is still a live variable — but the narrative has matured.
Colliers’ 2026 Global Investor Outlook continues to point to strength in markets that combine population growth, labor availability, and relative cost advantage, particularly across the Sun Belt and select secondary metros (Colliers). But the large-scale relocations that defined the early pandemic period have slowed. Instead of wholesale moves, companies are making incremental, portfolio-level adjustments — adding hubs, resizing HQs, and balancing presence across regions.
That’s a more complex decision set for corporate real estate teams. It’s no longer a binary choice between New York and Austin, or Chicago and Nashville. It’s about how those locations work together — and what role the headquarters plays within that network.
Cost still matters, but it’s being weighed differently.
While incentives remain part of the equation, particu-
larly for large headquarters projects, companies are placing more emphasis on long-term operating conditions — access to talent, housing affordability, commute patterns, and quality of life. The last cycle of HQ relocations made clear that upfront incentives can’t offset weak fundamentals over time.
At the same time, construction and fit-out costs are not trivial. Even as leasing fundamentals stabilize, build-out costs remain elevated relative to pre-pandemic levels, reinforcing the trend toward smaller, more efficient spaces rather than large, speculative commitments.
Put together, the picture for 2026 is not one of recovery or decline. It’s one of selection.
The headquarters is still a core asset — but it has to justify itself in a way it didn’t five years ago. It has to be used. It has to attract people. It has to support how the company actually operates, not how it used to.
The questions are no longer Where can we get the most space? Or What incentives are available?
They are: Where will our people actually show up? How much space do we truly need at peak utilization? What kind of environment improves performance, not just presence?
Because in this cycle, the market isn’t short on office space. It’s short on office space that works.
And that’s what the next generation of headquarters will have to deliver.
In Maryland, life sciences companies move innovation from idea to impact faster
Locate here and join more than 3,300 life sciences companies operating alongside global research leaders including the National Institutes of Health, the Food and Drug Administration and Johns Hopkins University.
It’s one of the most concentrated life sciences ecosystems anywhere in the world — where scientists, global companies and federal partners work side by side to bring new therapies to market sooner.
Make Your Move to Maryland.
TOP 3 BIOPHARMA HUB
business.maryland.gov/lifesciences
Tennessee’s Global Moment: How Foreign Direct Investment Is Reshaping the Volunteer State
Tennessee’s surging foreign direct investment numbers—record capital, landmark deals, and a strategic focus on critical industries—signal a state competing and winning on the global stage.
By Kimberly Graulein, Area Development Staff
Tennessee has always had a gift for making outsiders feel at home. It’s a quality embedded in the culture—warm, direct, and built on handshakes that mean something. Over the past four decades, that same quality has quietly made Tennessee one of the most sought-after destinations for Foreign Direct Investment in the United States.
The story starts, as so many Tennessee success stories do, with a single landmark moment. When Nissan chose Smyrna for its first U.S. manufacturing facility in 1980, it wasn’t obvious that the decision would set in motion a generational shift in how the world views this state. But it did. Today, Tennessee doesn’t just attract international companies—it competes for them at the highest level and consistently wins.
The Numbers Tell a Compelling Story
In 2025, Tennessee committed more than 8,000 new jobs, and approximately half of those came from international investment. Of the $11.4 billion invested in the state last year, 70 percent originated from foreignbased companies. That figure—70 percent—is not a rounding error. It reflects a fundamental shift in Tennessee’s economic identity.
Since Governor Bill Lee took office in January 2019,
the state has landed 197 FDI projects representing nearly 28,000 job commitments and more than $23 billion in capital investment. In 2025 alone, 45 percent of all landed projects were FDI projects, the highest annual share in state history. At $7.8 billion, 2025 also marks the highest singleyear total for capital invested by foreign-based companies in Tennessee’s history.
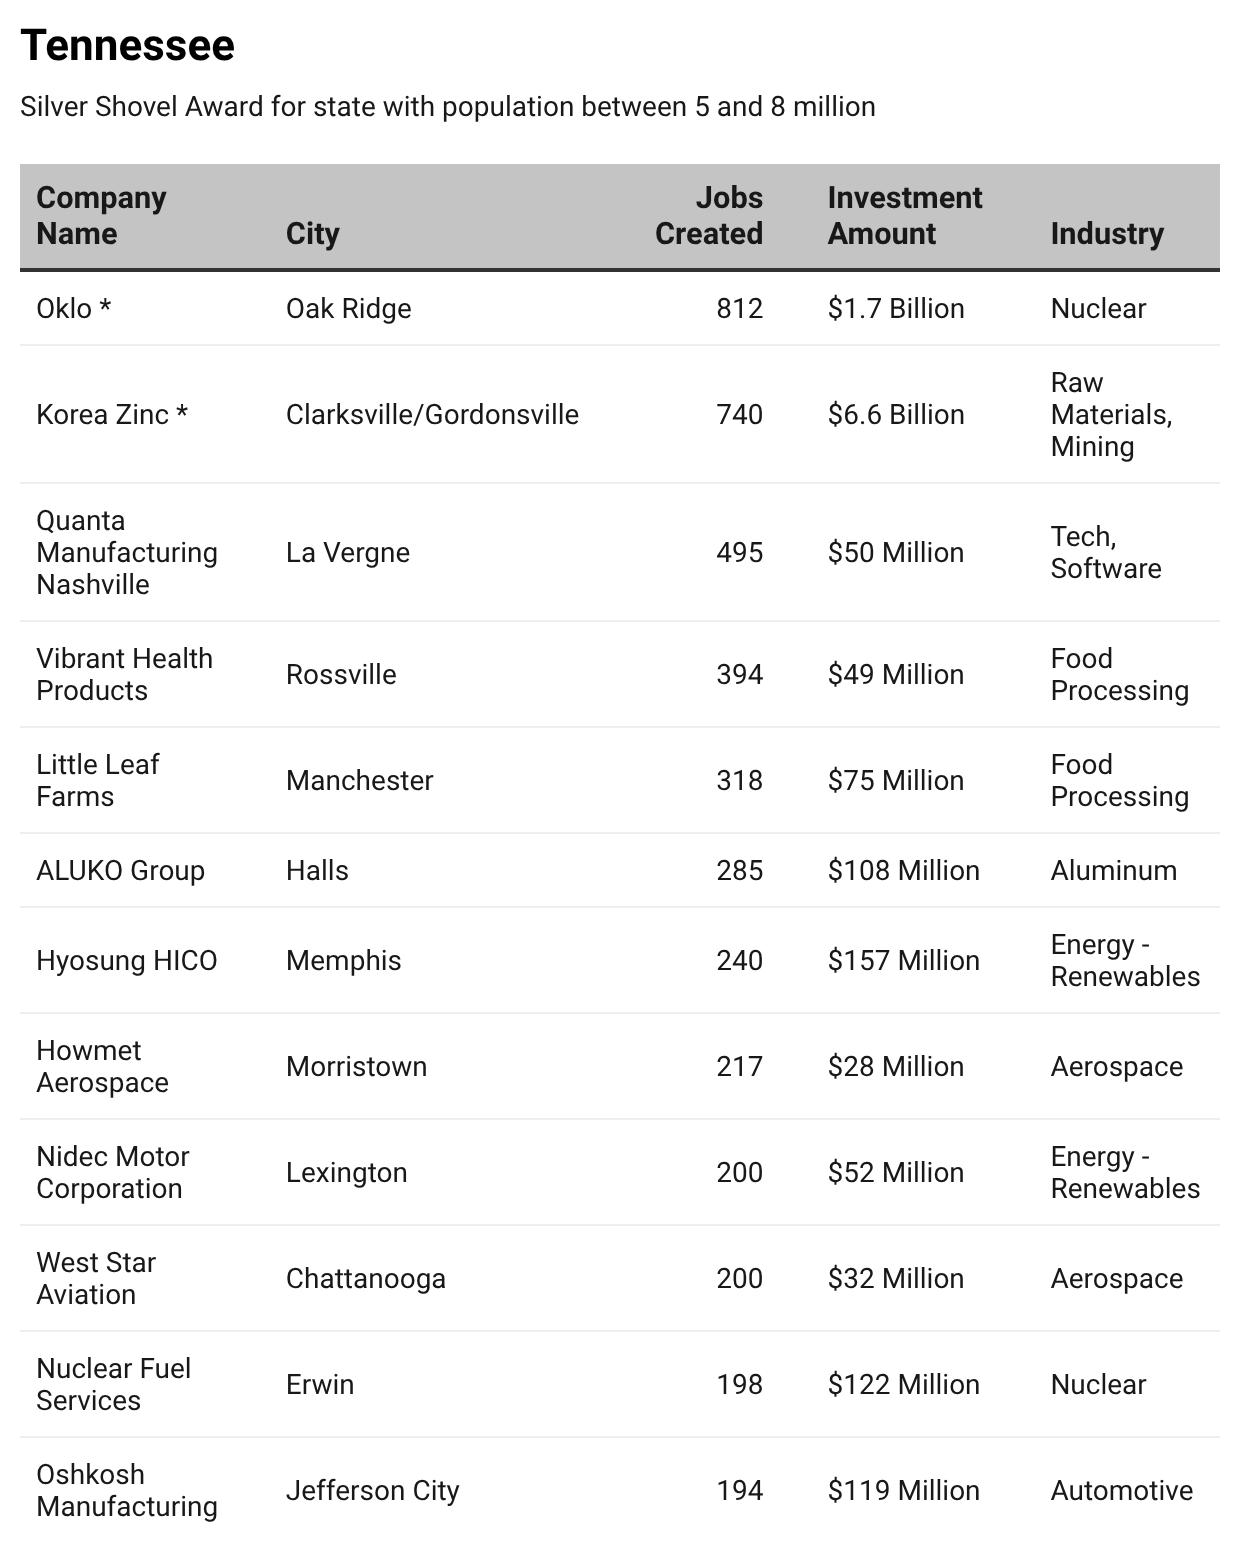
Japan remains the state’s all-time leading FDI partner, with 207 Japanese businesses employing more than 50,000 Tennesseans and representing over $21 billion in investment. But since 2019, South Korea has emerged as the state’s top partner in terms of both job creation and capital investment—approximately $11.5 billion and nearly 5,000 jobs across 20 projects. That relationship was on full display in late 2025, when Hyosung HICO announced its second expansion in six months at its Memphis headquarters, adding 240 jobs and $157 million in investment. The facility is now one of the largest domestic power transformer manufacturing operations in the country.
Competing in Critical Industries
Tennessee’s economic development strategy is deliberately focused on sectors that carry national significance: aerospace and defense,
pharmaceuticals and biotech, nuclear energy, and critical minerals. These aren’t merely high-growth industries—they are industries that matter to national security and longterm economic resilience.
That focus is producing historic results. Korea Zinc, the world’s leading nonferrous metal manufacturer, announced a $6.6 billion investment to locate its first U.S. operations in Tennessee—the single largest corporate investment in state history, surpassing the $4.5 billion commitment made by French nuclear company Orano USA just one year earlier. Orano’s Oak Ridge facility, designed to produce enriched uranium for U.S. reactors, represents exactly the kind of investment that will define Tennessee’s economic future. The company’s CEO noted that Tennessee’s proactive approach—developing a nuclear workforce pipeline and building out the regional supply chain—was central to the site selection decision.
On the defense side, Barrett Firearms Manufacturing announced a $76.4 million investment in a new Manufacturing & Technology Campus in Murfreesboro, which will serve as the global manufacturing hub for its Australian parent company, NIOA Group. And Sinova Global, a Canadian company, selected Lake County—Ten-
nessee’s most economically distressed county—for a $150 million silicon metal refining plant, demonstrating that the state’s FDI reach extends well beyond its major metro areas.
A Partnership Built to Last
What distinguishes Tennessee’s approach to FDI is the depth of the relationships it builds with international partners. When Nissha Medical Technologies, a subsidiary of Kyoto-based Nissha Co., Ltd., chose to relocate its engineering operations to Vanderbilt University’s campus, it wasn’t simply a real estate transaction. It was the formalization of an ongoing research collaboration with faculty and an investment in a talent pipeline that will generate returns for years.
That’s the model Tennessee is betting on: not just locations, but partnerships. Not just jobs, but ecosystems. The companies choosing Tennessee aren’t passing through. They’re building here—and increasingly, they’re expanding here too.
In a global competition for investment, Tennessee is no longer just a contender. It’s become a destination of choice.
This is a paid advertisement that was written by Area Development on behalf of Tennessee Department of Economic and Community Development.
The Aluminum Smelter That Could Rewrite America’s Industrial Map
By Kimberly Graulein
When Emirates Global Aluminium signed an MOU with Oklahoma Governor Kevin Stitt last April, the headline wrote itself: first new primary aluminum production plant in the United States since 1980. Four billion dollars. A thousand permanent jobs. A generational moment.
But the more instructive story is how Oklahoma structured the deal — and what it reveals about competing for heavy industrial projects in an era when they are rare, complex, and brutally contested.
Wes Seaman, a principal at Global Location Strategies, uses primary aluminum as a “signal industry” — a sector whose extreme requirements expose every constraint modern site selection faces. Smelters are electrically dominated, capital intensive, logistically constrained, and commodity priced on thin margins. They require not just cheap power, but durable, long-term power. They generate 40- to 60-year asset lifecycles that make community alignment and political stability as important as any infrastructure checklist.
The national backdrop is stark. Before 2000, the U.S. operated well over a hundred primary metals smelting facilities. By 2026, four remain active, while approximately 85 percent of American aluminum demand is met by imports. The industries
depending on that aluminum — aerospace, defense, automotive, data infrastructure, electric grid components — represent the core of what the U.S. has been trying to reshore for a decade. “When we go back and look at the true demand,” Seaman has observed, “we see a true national security gap.”
That context is what turned a site selection win into something with higher stakes than a ribbon cutting.
When it comes to what won the project, John Budd, CEO of the Oklahoma Department of Commerce, names three decisive factors without hesitation: power, logistics, and people. On power, Oklahoma’s energy competitiveness traces to the fracking revolution that drove down industrial electricity costs. Public Service Company of Oklahoma was embedded in the site selection process from the start. On logistics, Oklahoma holds an asset that routinely surprises outsiders: the deepest inland ice-free ports in the United States, via the McClellan-Kerr Arkansas River Navigation System, connecting to global shipping lanes through the Mississippi. That navigable water access is not incidental — it is a prerequisite for primary aluminum.
The deal’s financial architecture is where Oklahoma made its most consequential choices. The incentive package totals more than $275 million in direct support, with an additional $735 million in expected tax exemptions — structured as a longterm, performance-tethered payment stream rather than an upfront check. “A lot of companies want or ask for a big check up front,” Budd said. “In this case it’s harder for us to do it that way — but
also better for us.” Extending payments over time lets the state monitor ongoing performance, tying disbursements to whether EGA is actually delivering. It also happened to align with what EGA needed: a mechanism to offset longterm operating costs, not a capital infusion.
But the deeper innovation is what the state chose to underwrite. Oklahoma priced in the downstream ecosystem — the industrial hub it believed the smelter would anchor. “We saw the opportunity to create benefit for the state that exceeded just the core employment base of EGA,” Budd said.
That bet is already paying off. In January 2026, Century Aluminum joined as a 40 percent partner, and the plant was upsized to 750,000 tonnes per year, more than doubling current total U.S. production. A regional aluminum-focused industrial hub is now the explicit goal.
Groundbreaking is expected by end of 2026. First production is targeted for end of the decade. hub is now the explicit goal.
Why Utilities Are Now Looking at Flexible Loads
For most major projects today, the question isn’t incentives or workforce. It’s whether the power is there — and how long it will take to get it.
Across the United States, utilities are warning of multiyear delays for new capacity. Data centers, semiconductor plants, and advanced
manufacturing facilities are running into the same constraint: the grid can’t keep up. In many cases, projects aren’t being killed by cost or labor — they’re being delayed indefinitely by interconnection timelines.
A new approach is starting to emerge. Instead of waiting for new generation and transmission to come online, some utilities are rethinking how power is delivered from systems they already have.
At the center of that shift is Sacramento Municipal Utility District, which is experimenting with ways to unlock capacity from its existing infrastructure. Like most utilities, SMUD maintains reserve capacity to ensure reliability during peak demand. What’s different is that it is actively looking to put that capacity to work.
“You do have excess capacity on the system,” said Lora Anguay, SMUD’s chief energy resources officer. “So how do we tap into that excess capacity but not impact reliability?”
The answer increasingly involves treating large users as participants in the grid, not just consumers of it. Under “flexible load” structures, facilities — particularly data centers — can temporarily reduce demand or switch to on-site generation during periods of constraint. That frees capacity for other users and allows utilities to approve projects that might otherwise be delayed. “There are a lot of data centers that are interested in that model,” Anguay said.
Variations of this approach are emerging nationwide. In the Electric Reliability Council of Texas, large users are increasingly expected to
curtail demand during grid emergencies. Elsewhere, utilities are introducing tariff structures that bundle power delivery with flexibility commitments and on-site generation requirements.
Rather than pursuing only hyperscale users, Sacramento is also shaping demand to match what the system can realistically deliver — focusing on mid-sized, distributed loads in the 20- to 50-megawatt range that are easier to permit, faster to bring online, and better aligned with what the existing grid can absorb. In a market where interconnection queues stretch for years, the ability to negotiate access to power — rather than simply wait for it — may matter more than how much capacity a region has on paper. The utilities figuring that out now are becoming a different kind of economic development asset. The ones that aren’t are watching projects go elsewhere.
Getting Smart with Infrastructure Problems
Infrastructure has always been treated as a fixed input in site selection. Power, water, and buildings were designed for a specific purpose, built to capacity, and replaced when demand outgrew them. That model is starting to fail.
As AI, advanced manufacturing, and data center demand accelerate, infrastructure is no longer keeping pace. Permitting timelines are stretching. Build costs are rising. The traditional solu-
tion — expand capacity — has become too slow.
Raja Kadiyala, global head of digital solutions at Sidara, describes a different approach taking hold. Instead of building more infrastructure, operators are finding ways to use existing systems more intelligently. He calls the shift “active infrastructure” — systems that can sense conditions, respond in real time, and adapt to changing demand.
“The fastest infrastructure to build is infrastructure you don’t have to build,” he said.
The concept is already being applied in unexpected places. Kadiyala points to a municipal stormwater system that avoided a $300 million expansion by using forecasting and flow controls to manage capacity ahead of peak demand. Instead of increasing storage, operators used data to move water through the system before it became a problem — redirecting flow in anticipation of stress rather than reacting after the fact. The lesson translated directly: infrastructure that behaves intelligently can do more than infrastructure that simply scales.
The same logic is now being applied to power and industrial systems. Facilities are beginning to adjust demand dynamically — ramping down noncritical processes during peak periods, shifting workloads across locations, using on-site systems to smooth spikes — all to reduce strain on infrastructure without expanding it.
That reframes what “infrastructure-ready” actually means. A region with older systems that have been made adaptive may have more to offer than one that simply has more capacity sitting idle. For economic developers,
the question is shifting from what a region has built to how intelligently it can be operated — and whether the answer is visible before a project arrives, not after.
“If we can make it work with the existing systems,” Kadiyala said, “you’re going to be able to get that facility up and going much faster.”
As infrastructure struggles to keep pace with demand, the ability to optimize what already exists is becoming a competitive advantage — and increasingly, a deciding factor in where major projects land.
Buildings Are Becoming Part of the Competitive Stack with AI Help
For decades, buildings have been among the least dynamic parts of a company’s operations. Systems were installed, calibrated, and left to run until something broke.
That is starting to change.
Advances in AI and building software are turning facilities into continuously optimized systems — capable of adjusting performance in real time, predicting failures, and improving efficiency without major capital investment. The shift is less about any single platform than about a fundamental change in what buildings are expected to do.
The core change is a move from reactive to predictive operations. Rather than fixed conditions held constant until equipment fails, facilities are now being managed as living systems — adjusting
set points in response to weather, occupancy, production schedules, and grid conditions, sometimes every few minutes.
“We’re taking data from external sources, like weather, and what’s happening within the site, and then changing the set points every 15 minutes,” said Jamie Cameron, vice president of OpenBlue at Johnson Controls.
The maintenance model is changing as well. AI systems can identify when equipment is likely to fail before it does, shifting facility teams from reactive work toward planning and optimization. Buildings that once degraded over time can now maintain consistent performance across longer lifecycles.
At a portfolio level, the implications multiply. Companies operating across multiple sites can benchmark performance, identify outliers, and allocate capital more precisely than was previously possible.
“You can actually start to look at what’s your most efficient manufacturing site,” Cameron said, noting that data can surface differences in energy use, occupancy, and overall performance that would otherwise go undetected.
None of this shows up on a standard site checklist — but the gap between a facility that can be optimized and one that can’t is widening fast. As companies manage larger and more complex portfolios, that gap is starting to show up in costs, in reliability, and eventually in location decisions.
Buildings are no longer just assets to be maintained. They are becoming systems to be managed — and, increasingly, part of the competitive stack.
What’s behind Arizona’s growth?
Let’s talk about 140 years of safe, reliable and affordable energy.
Since 1886, Arizona’s growth and our story have been intertwined. Built on a commitment to deliver safe, reliable energy to the communities we serve. Today, Arizona continues to see unprecedented growth. Our top-tier reliability and low-cost energy have helped spur major economic development across the state in a variety of industries, including semiconductor, battery manufacturing, aerospace and defense, food manufacturing, and bio and life sciences.
Compared to industry averages in 2025, our average customer experienced less than one power outage and faced fewer minutes of interrupted service—despite Arizona’s extreme weather. Smart grid technology allows our crews to isolate and reroute power for quicker restoration times. We expect to add 9,805 MW of natural gas, renewable energy and battery storage to our system between 2025 and 2028—more than 90% of which will be carbon-free. In addition, we plan to invest more than $2 billion annually to maintain and improve infrastructure to reliably serve our customers.
Learn more about our commitment to powering Arizona’s growth at aps.com/economicdevelopment.
Philippe Mantelet
The Head of Global Engineering, Sites and Facilities at UCB — a Belgium-based biopharmaceutical company — talks to Area Development about overseeing one of the biggest projects of his 20-year career: a $2 billion large-scale biologics manufacturing facility in Georgia, that will anchor UCB’s U.S. supply chain for decades. come. Mantelet spoke with Area Development about what won the site, what keeps him up at night, and why failure isn’t even in the risk register.
You head Global Engineering, Sites and Facilities for UCB. Set the scene for us: What’s driving UCB’s push into U.S. manufacturing specifically?
We are facing a decade of growth — the products that we are proposing to our patients are really successful, so we need to upgrade our manufacturing capabilities. The U.S. patients are really important for us. We want to secure the supply of our products within the U.S. — to ensure that every patient in the U.S. will benefit from the most reliable and performant product delivered by our facilities. This is our strategic ambition, and this is why we decided to come and settle in the U.S.
What put Georgia and Gwinnett County over the top?
First, we have a history in Georgia. We have been here with our headquarters and commercial activities for more than 30 years now. So we have a specific relationship. Georgia and Rowen, a master-planned in Gwinnett, offered really a specific certainty — this end-to-end, large-scale collaboration. They are able to support state-of-the-art technology and
large-scale biology manufacturing. But also they are sharing with us a journey. UCB is a family-owned company with a vision for decades, almost a century — and beyond the technical capabilities they were offering, there is also this commonality in the vision we want to develop for the long term.
Were there other serious contenders, and what fell short?
There were, of course, some other sites. We visited a lot of sites, and I would say we were really impressed by the quality — most of them were meeting our criteria. Really, none of them failed. It’s just, as I was mentioning, Georgia, and Gwinnett County made the difference with this endto-end consistency regarding our history and also our project. It was a journey for us European guys coming to the U.S. — visiting different states, different counties, different pieces of land — and then finally landing in Gwinnett.
Speed to market — how much of a factor was site readiness?
We decided to come to the U.S. — it
was part of our strategic plan, and we were waiting to have confirmation of the success of our products — once we decided to go, we wanted to go fast. So of course we have been looking for sites that were ready, that were connected with utilities, power, but also with the sewers and the wastewater. It was really an important criteria for us, just to save time — also being sure that we would be able to have the right permits to build
What do you see as the biggest risks to your timeline?
On this kind of project, there are really things that we cannot control and things that are under our control. The design, construction, execution — I would say this is under our control. We are following a process, and we will deliver on time. What remains out of our control is what is external: obtaining permits on time, having access to resources, training and onboarding the talent, also having the regulatory approvals on time. This is out of our control, so it’s the main risk that I see today.
How deeply are you engaging with the state and local institutions on workforce?
Of course, it was part of the discussions we had with the state and the county. The location is just in between the two main universities in Georgia, which is really interesting for us. We will have to hire and onboard different levels of competencies — really highly technical, skilled people, but also supervisors, bioengineers, engineers, technicians. All of those people will have to be trained or experienced, and these are programs that we will need to develop with the support of the county and the state. Contributing to the value creation of a drug that will cure or make the life of a patient easier is a mindset and it takes time. Working for UCB, it’s not, “I’m doing my job eight hours a day and then I’m gone.” It’s, how can I contribute the best I can — being trained, bringing my knowledge, bringing rigorous operations into this value creation of a product for a patient.
How much did tariffs and supply chain uncertainty factor into the decision?
For UCB, this is really a long-term growth strategy. So of course, tariffs and all this geopolitical uncertainty has some impacts, but I would say we are not reacting to short-term policy dynamics. We are really building for the future. We don’t have a lot of sites, but each time we own a site, it is for decades. Investing in the U.S. today is part of our long-term strategy to secure the supply chain for U.S. patients, to avoid disruption, and to work in the most local ecosystem we can.
If you were advising a counterpart at another company going through a similar site search, what’s the biggest mistake to avoid?
To me, it’s just focusing on short-term opportunities. I will take the parallel: when you are looking for a place you want to live, — if you have a project, a long-term project, and if your ambition is clear - what is important is the place, it is
the environment. So avoid getting lost in the really wide ecosystem, or just taking a short-term decision, or just focusing on maybe the level of incentives you could get from the states. It’s important, it’s contributing — but in the end, it’s a generational project. It’s for decades. So protect yourself 15 or 20 years from now, just to be sure that you take a noregret decision.
Last question — how close did this project come to not happening?
Once it was decided, our executive management, our board of directors supported it. It’s really long-term planning — it’s based on our success today and, I think, in the future. We communicated seriously, we engaged a team seriously, and we will deliver seriously. Failing is not an option. It’s not even in our risk register. And there is no blocking point. The decision has been taken — and we are very impatient to accelerate.
Red Flags, Project Killers, and Blunders Every Site Selector Should Avoid
Industry experts from site selection, construction, law, and supply chain consulting weigh
in
on
what’s
derailing projects in 2026 — and what it takes to keep deals alive
By Andy Greiner, Editor
Site selection has always been a high-stakes game of timing, logistics, and negotiation. But the conditions shaping project decisions today are more complex, more compressed, and more punishing of mistakes than at any point in recent memory. The margin for error has shrunk to almost nothing, and the old playbook is increasingly obsolete.
To find out what’s really killing deals in 2026, Area Development went straight to the people in the room when projects go sideways. What we heard was a consistent story about speed, uncertainty, and the growing mismatch between how the private sector moves and how the public sector responds.
Permitting and Rezoning Delays: The Public Sector’s Achilles Heel
One of the clearest refrains from practitioners this year is that project delays are no longer primarily the client’s fault. The bottleneck has shifted.
“Where we’re seeing the delays happen is actually on the state and local side rather than the client side,” says Alicia Janesko-Hutchings, a site selection and incentives specialist with Cresa. “The permitting process often slows down the process. Sometimes NIMBYism at the
local level is also delaying the project. There needs to be more prep work done on that side of things.”
Janesko-Hutchings notes that the incentive process itself has become a source of friction.
“The incentive process isn’t really aligning with the way projects are making decisions so quickly nowadays. There’s definitely a disconnect there — the inability to respond quickly in terms of an incentive proposal, whether it’s approvals or application process. Those need to start aligning a little bit better, because the world of economic development has changed significantly and just continues to speed up.”
Patrick McMullen, CEO of Phillips Infrastructure Corp. — a family-owned heavy civil contractor approaching its 75th year in business — sees this from the contractor side daily. “The biggest delay in getting going, once the site is selected and someone wants to go, would be incomplete design and permitting,” he says. His COO, Jerry Arvidson, points to early contractor involvement and open communication with agencies as partial solutions, and stresses understanding wetland and waters-of-the-U.S. impacts early. “Having the contractor selected and the team early for early contractor involvement can help drive that,” Arvidson says. Having storm water control plans well thought out before the process
begins is critical — because doing it wrong costs time that can’t be recovered.
Stale Budget Data: The Construction Cost Trap
If permitting is the most common public-sector deal killer, construction cost miscalculation is its private-sector counterpart — and it’s almost entirely avoidable.
“A lot of times clients come in with preconceived notions around what a project could cost or should cost,” says Chris Urchell, Senior Manager of Real Estate Advisory at Baker Tilly. “They’re using old benchmark data around a previous facility, and they don’t really have a good understanding of how much construction cost has risen in the last couple of years or even months.”
The consequences play out in a painful sequence. A company gets informal estimates during feasibility, bakes those numbers into a board-level capital authorization, then discovers — deep into design — that detailed construction
costs are 30, 40, or 50 percent higher. “They’ve already talked to the banks. They’ve already gone to the board for approval and it’s information that’s outdated.” The project has to go backwards: back to the bank, back to the board, sometimes back to the drawing board on facility design.
McMullen at Phillips Infrastructure puts hard numbers on the inflation driving this dynamic. Skilled labor costs across their business are up roughly 30 percent over five years. Equipment acquisition costs have essentially doubled over five to seven years due to price increases from manufacturers like Caterpillar, Komatsu, and John Deere. Commodity inputs have followed. “All inputs are up — labor, commodities, equipment,” McMullen says. The fix is straightforward: connect companies to construction and engineering firms early, before numbers get locked into commitments that the market can no longer support.
Power Availability: The Hard Filter
Ask almost anyone in site selection what they’re watching most closely, and the conversation arrives at power.
What practitioners are describing in 2026 goes beyond a preference for available capacity. Power has become a binary filter.
“Even a location that is optimal from a logistics perspective, from a labor perspective — if the power cannot be supplied in sufficient quantity for a particular operation, then that facility or that location is filtered out,” says J.C. Renshaw, Head of S upply Chain Consulting for North America at Savills.
Renshaw points out that the challenge extends beyond r aw electricity availability to the full ecosystem of switching equipment, tr ansformers, and ancillary infrastructure. In a world where facilities are increasingly embedding automation and AI in their systems, these requirements are only growing. “Our clients have to make sure that their facilities are outfitted not just for today but for tomorrow,” he says.
Bond Dickinson, identifies financing conditions as one of the most significant — and underappreciated — sources of project stalls.
“Financing is a big piece of it — companies being able to support the business case for the project, either the economics penciling out, or actually just borrowing at a number they’re comfortable with,” MacNamara says. “Often lenders are very interested in teeing those up. But ultimately, when you get down to the hard numbers, those numbers don’t end up penciling out the way clients are willing to sign on the dotted line.”
The result is a pattern he encounters frequently: companies saying they’ll wait six months and watch how market conditions evolve. For companies collateralizing project loans with treasury stock, share price movements have a direct impact on borrowing capacity and cost of capital. At its root, MacNamara acknowledges, it comes back to the same theme running through nearly every stalled deal: uncertainty.
Courtland Robinson, Director of Business Development at Brasfield & Gorrie — a national, privately held contractor with more than 60 years of experience across industrial, commercial, healthcare, and data center markets — frames the issue in terms of scale. “Many of the campuses being cited across the country are going into fairly rural areas, and those rural areas don’t inherently have the infrastructure to support everything that campus is going to need at full build-out — from simple things like road and sewer to fire and police, to bigger regional infrastructure considerations.”
For Janesko-Hutchings at Cresa, utility partners have made real progress on transparency about delivery timelines. “I love seeing that,” she says. “But it still is delaying projects if it’s not meeting the client’s timeline.”
Financing Uncertainty: When the Math Doesn’t Work
Even when a site checks every box, deals can collapse when financing doesn’t come together. David MacNamara, an economic development attorney with Womble
The Tariff and Immigration Overhang
It would be impossible to survey deal-killers in 2026 without addressing the macro environment. One foreign direct investment specialist focused on international manufacturing projects describes the current situation as a two-part challenge: uncertainty and rising costs. “The uncertainty of what the tariffs are, the rising costs due to tariffs — and then immigration. The questions on who can come and who cannot come cause a lot of projects to slow down or reduce their scope.” For companies whose equipment is not made domestically and has to be imported, tariff-driven cost increases are direct and concrete. Janesko-Hutchings agrees that ongoing legal battles continue to cloud the landscape, even as some clarity has emerged.
The Speed Imperative — and What It Demands
Woven through all of these deal-killers is a common thread: speed. Robinson of Brasfield & Gorrie describes
the current environment as an “exponential age” — faster innovation cycles, shorter times to market, surging demand across multiple sectors. “Decisions have to be made faster. Yet there is an incredible amount of uncertainty in almost every facet of making capital project planning decisions.”
McMullen at Phillips Infrastructure describes companies launching projects before designs are complete and before all permits are in place. His firm built the initial site work for a major Ford manufacturing facility in West Tennessee under those conditions — what was bid was “not at all” what was ultimately built, as aggressive scheduling drove significant changes in the field. The project succeeded because Ford was a sophisticated owner who understood the environment. Most aren’t.
His advice to site selectors is pointed: bring the civil contractor into the process early. “They should put us in the car with them when they’re selecting their site. Tell us what their objectives are, what their timelines are, what the cost-schedule tradeoff means to them.” The civil contractor, he argues, is the tip of the spear on fast-track projects. If the civil side falters, everything downstream delays.
Ohio’s Model: What Alignment Looks Like
One example of what it looks like when the public sector keeps pace with the private sector comes from Ohio. J.P. Nauseef, President and CEO of JobsOhio, describes a model built explicitly around speed, access, and collaboration.
“Speed to put a deal together, access to a site that is ideal, ability to find talent, a focus on customer service, a working relationship with the administration and the legislature, and a network of economic development professionals working together are all ways JobsOhio competes and creates a competitive advantage for Ohio,” Nauseef says.
The results are concrete. Just last month, Sherwin-Williams celebrated the grand opening of its new headquarters in Cleveland, transforming the city’s skyline after out-of-state competitors made a serious run at pulling the company away. Earlier this year, Anduril Industries began drone production at its Ohio facility less than a year and a half after announcing the project — a timeline the company had made clear was non-negotiable. And when Intel surfaced as an opportunity, Ohio wasn’t even in the original consideration set. “We pulled together options from across the state, submitted a proposal in just three days, and were ultimately chosen from 40 other options,” Nauseef says — after a councilwoman’s call to a network partner set the whole thing in motion.
“JobsOhio is unique in that our model is private, allowing flexibility when addressing a company’s needs and challenges,” Nauseef adds. “When our partners at the state and local level are confronted with challenges, we’ll respond rapidly with solutions to navigate our clients’ needs.”
The Ohio story is instructive not just as a success case, but as a template. The deal-killers practitioners describe — slow permitting, misaligned incentive timelines, inadequate infrastructure, delayed decision-making — are all symptoms of a system that hasn’t adapted to the speed at which private capital now moves. The states and communities that close that gap are the ones that win the projects.
The Short Checklist
The experts interviewed for this article offer a consistent set of recommendations:
Get current construction cost estimates — not ballpark figures from previous projects or benchmarks from five years ago. Real numbers, from active contractors, matched to your actual facility requirements.
Treat power as a primary filter, not a secondary consideration. Understand not just what is available today, but what can be delivered on your timeline and at the scale your operations will require as they grow.
Bring the civil contractor into site selection, not just site construction. Their early read on geotechnical conditions, permitting complexity, and schedule achievability can save months and millions.
The deal-killers are well known. The difference, in 2026, is that there’s very little time to recover from them.
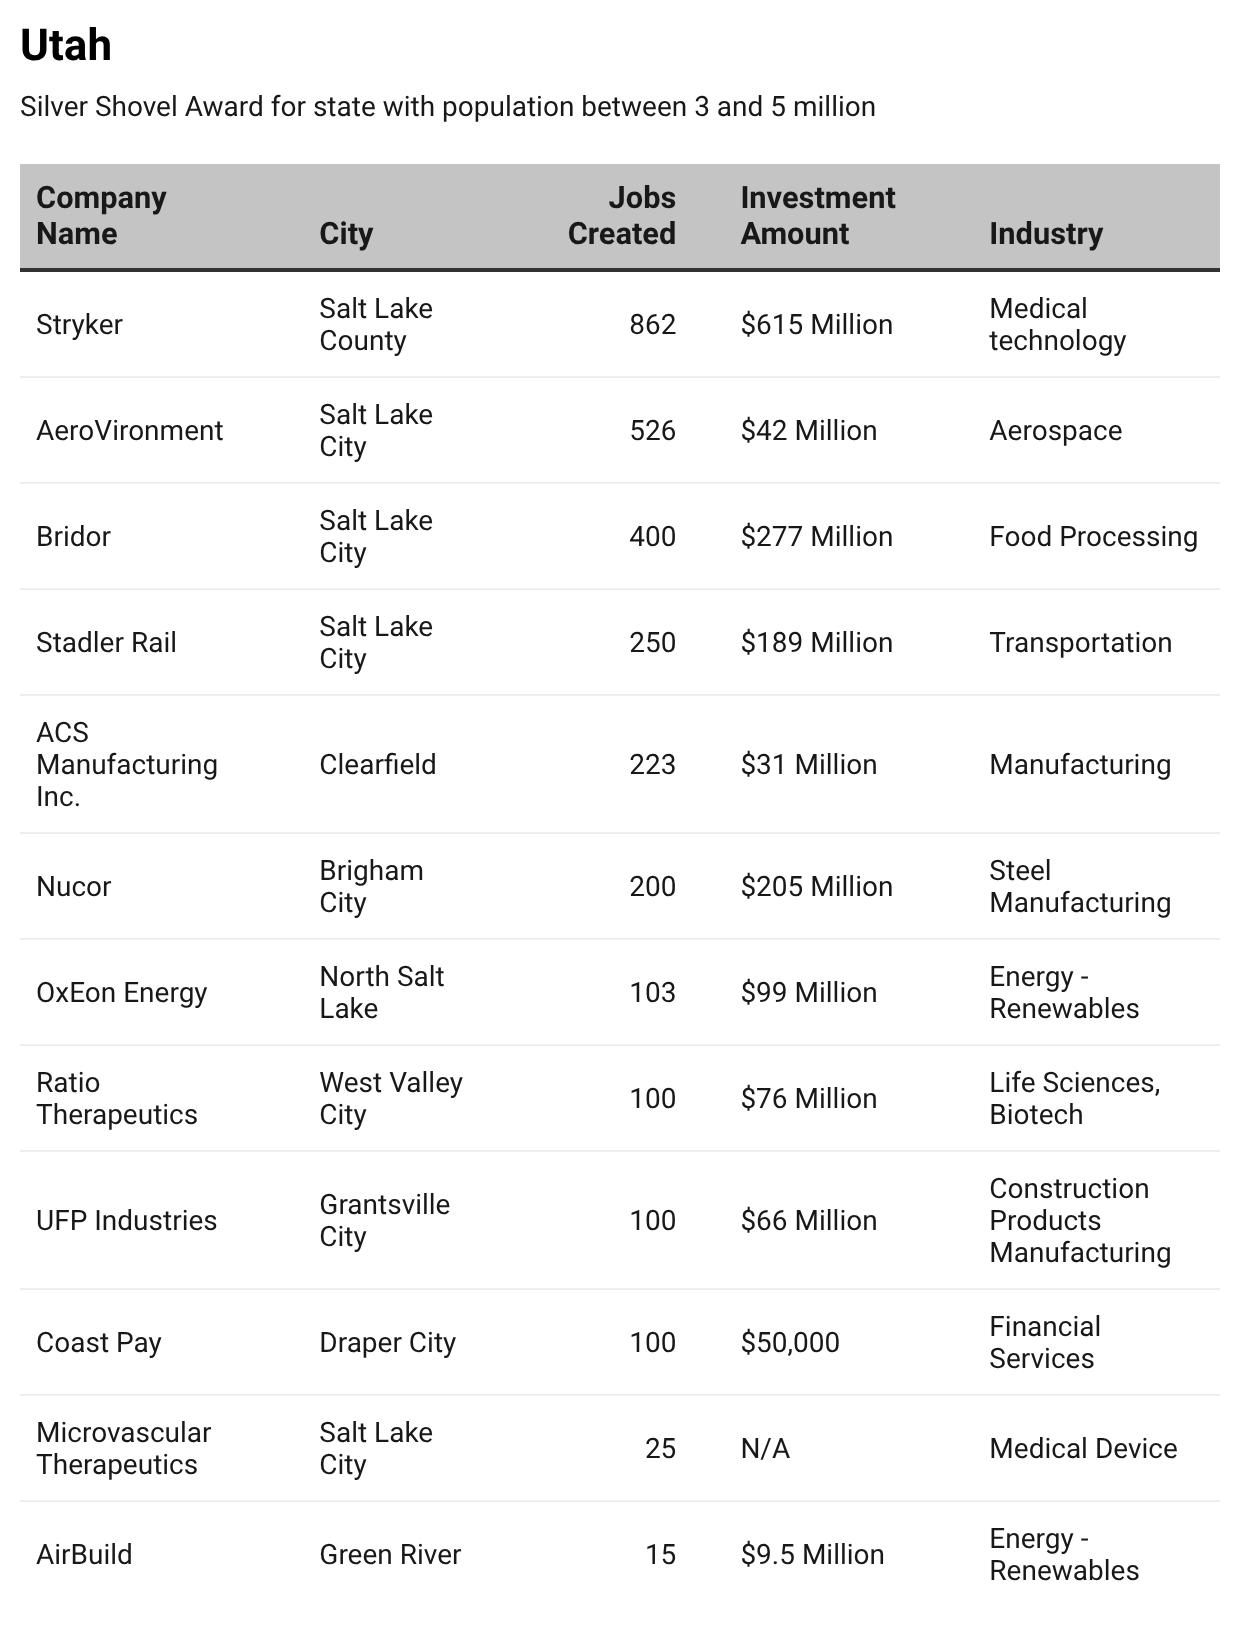
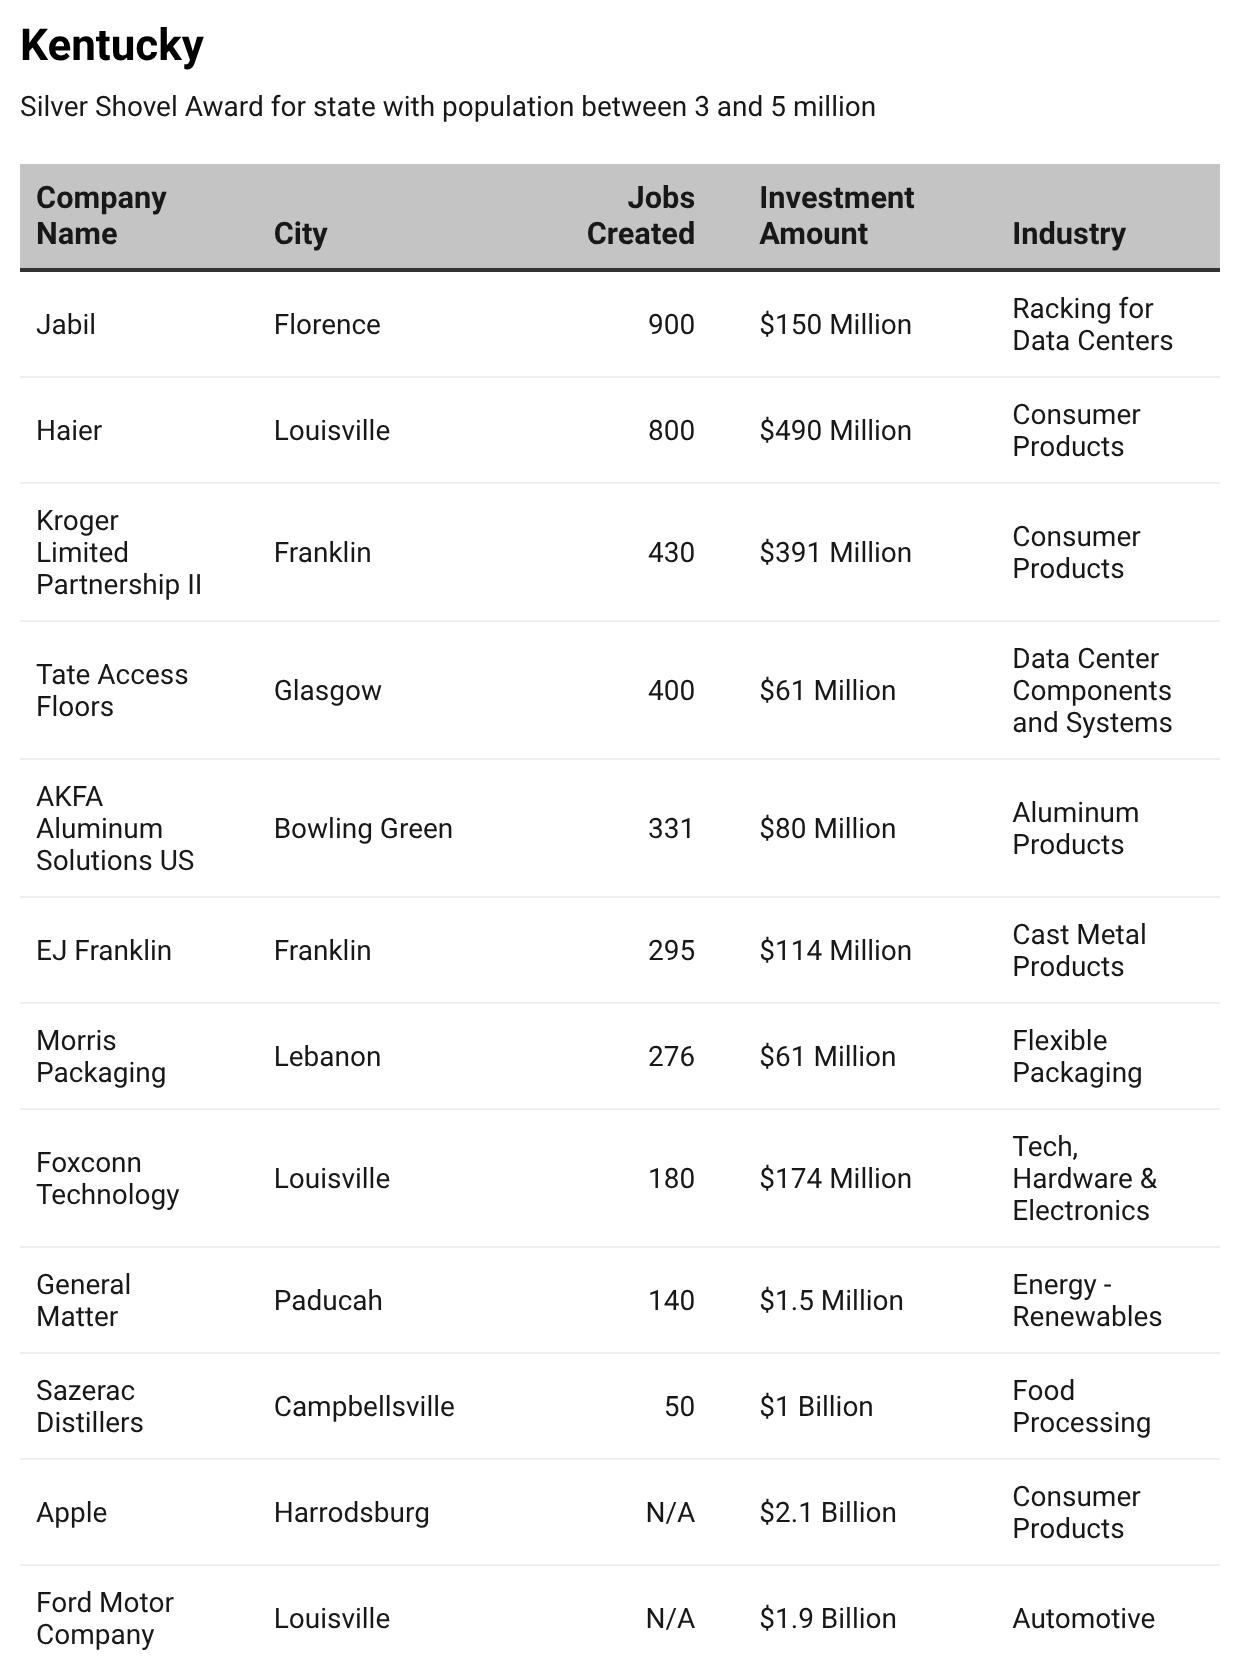
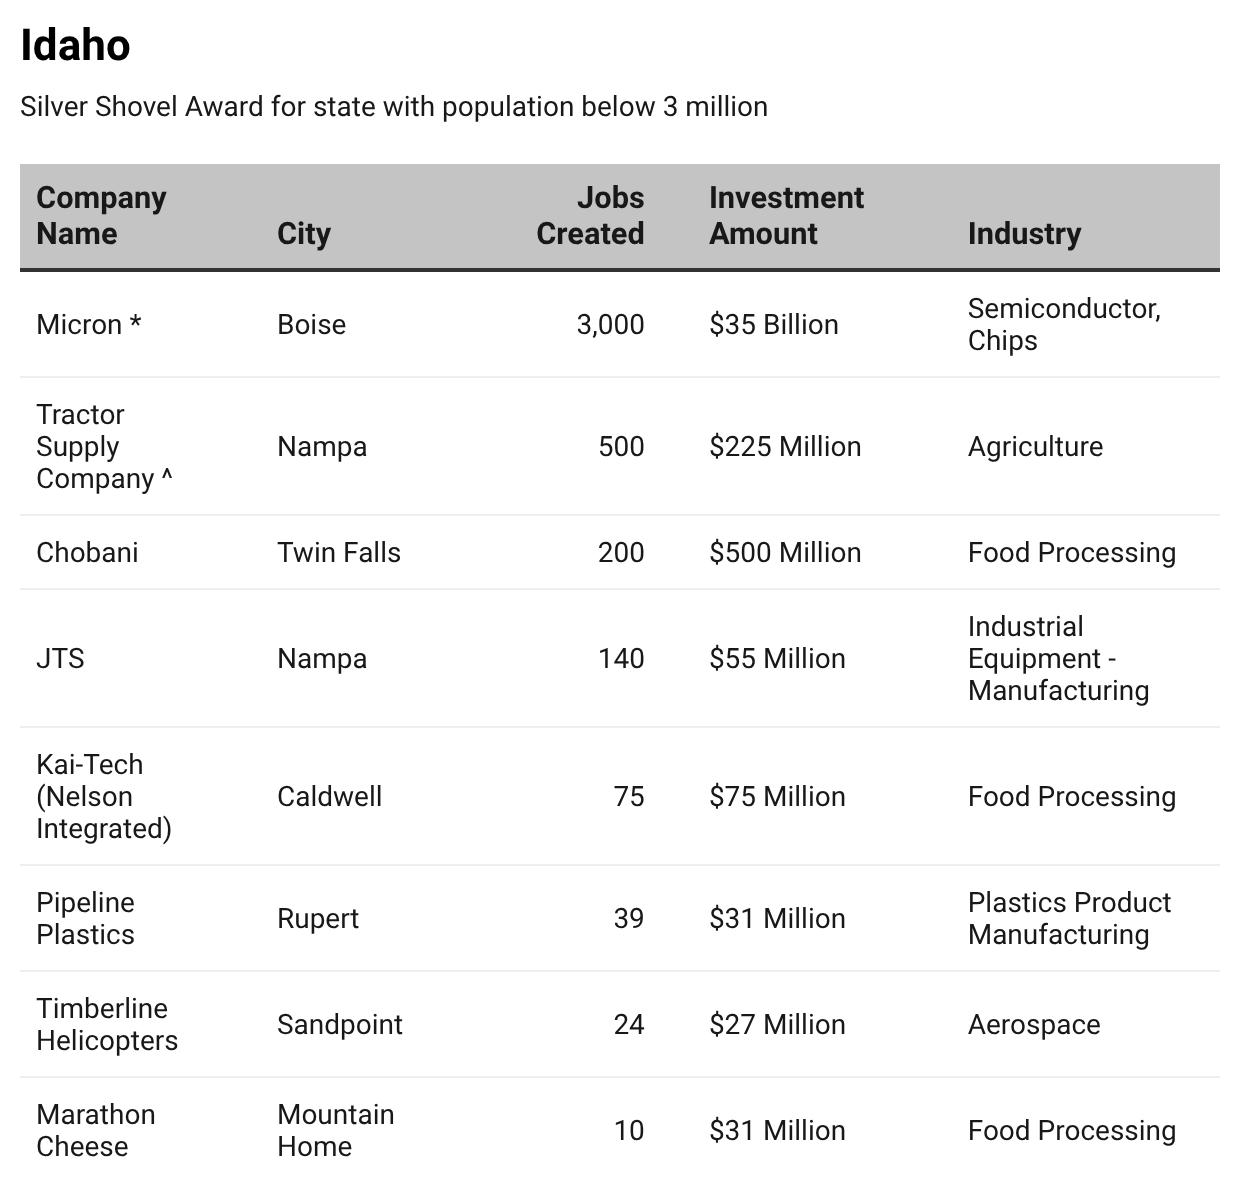
21 st Annual Area Development Shovel Awards
The American industrial economy is being remade in real time. These are the states leading the charge.
By Andy Greiner Editor
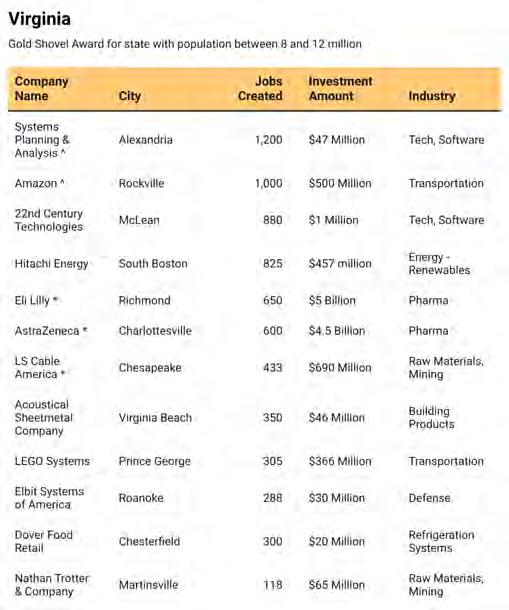
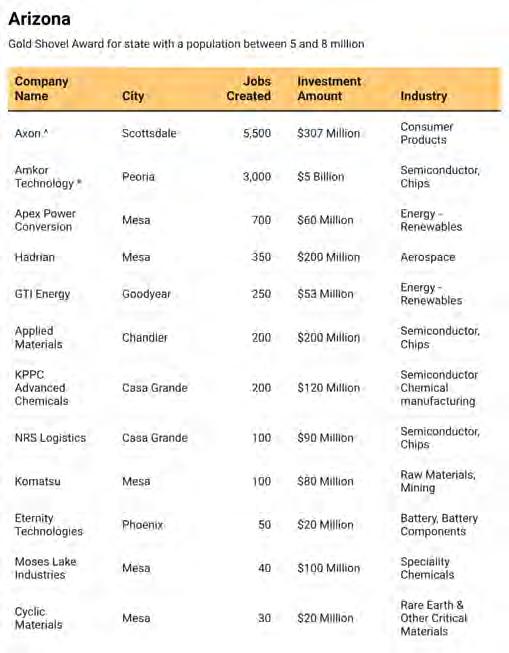
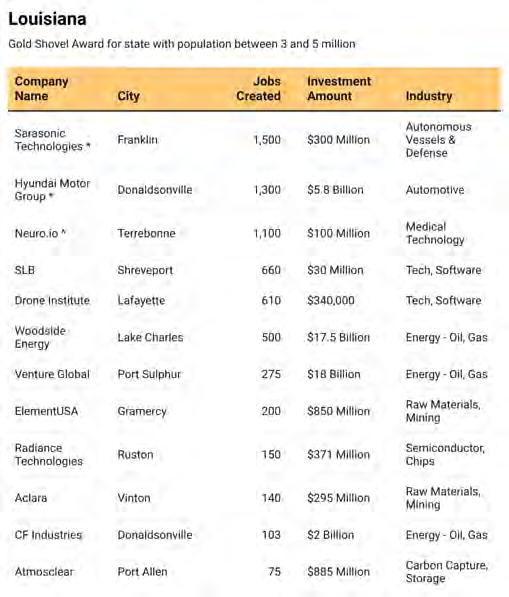
In the two decades since Area Development first started its State Shovel Awards, the economic development landscape has been remade several times over. We’ve watched the rise and partial retreat of the EV gigaplant era, the return of semiconductor fabrication to American soil, the explosive buildout of data center infrastructure, and a pharmaceutical renaissance driven by post-pandemic supply chain recalibration. Through all of it, the states that earn Shovel Awards have been at the center of the action — moving fast, thinking strategically, and landing the kinds of projects that define regional economies for a generation.
This year’s awards reflect a moment of unusual intensity. Capital is still moving — and moving at scale — even as companies navigate a more complex policy environment, shifting trade dynamics, and the ongoing challenge of building a workforce ready for advanced manufacturing. The projects behind this year’s awards span semiconductors and solar, aerospace and biomanufacturing, data infrastructure and distilled spirits. What they share is consequence: each one reflects a real bet, by a real company, on a real place.
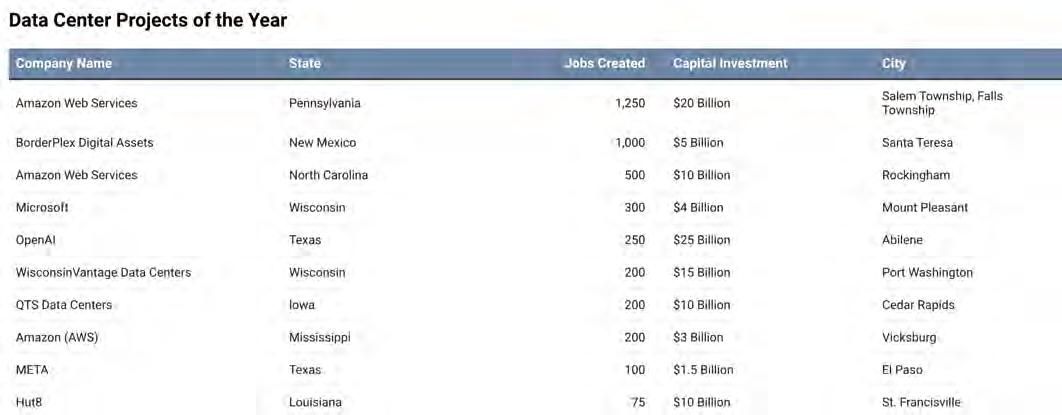
Each year, Area Development’s State Shovel Awards are given in five population categories to ensure fair comparisons. The Platinum Shovel recognizes the single most outstanding performer across all categories. New this year: the Data Center Project of the Year. Data center projects are evaluated in their own standalone category. The volume and scale of data center investment has grown to the point where including it in the broader rankings was skewing results and effectively disadvantaging states with strong manufacturing portfolios. Separating it out gives every category of investment the recognition it deserves.
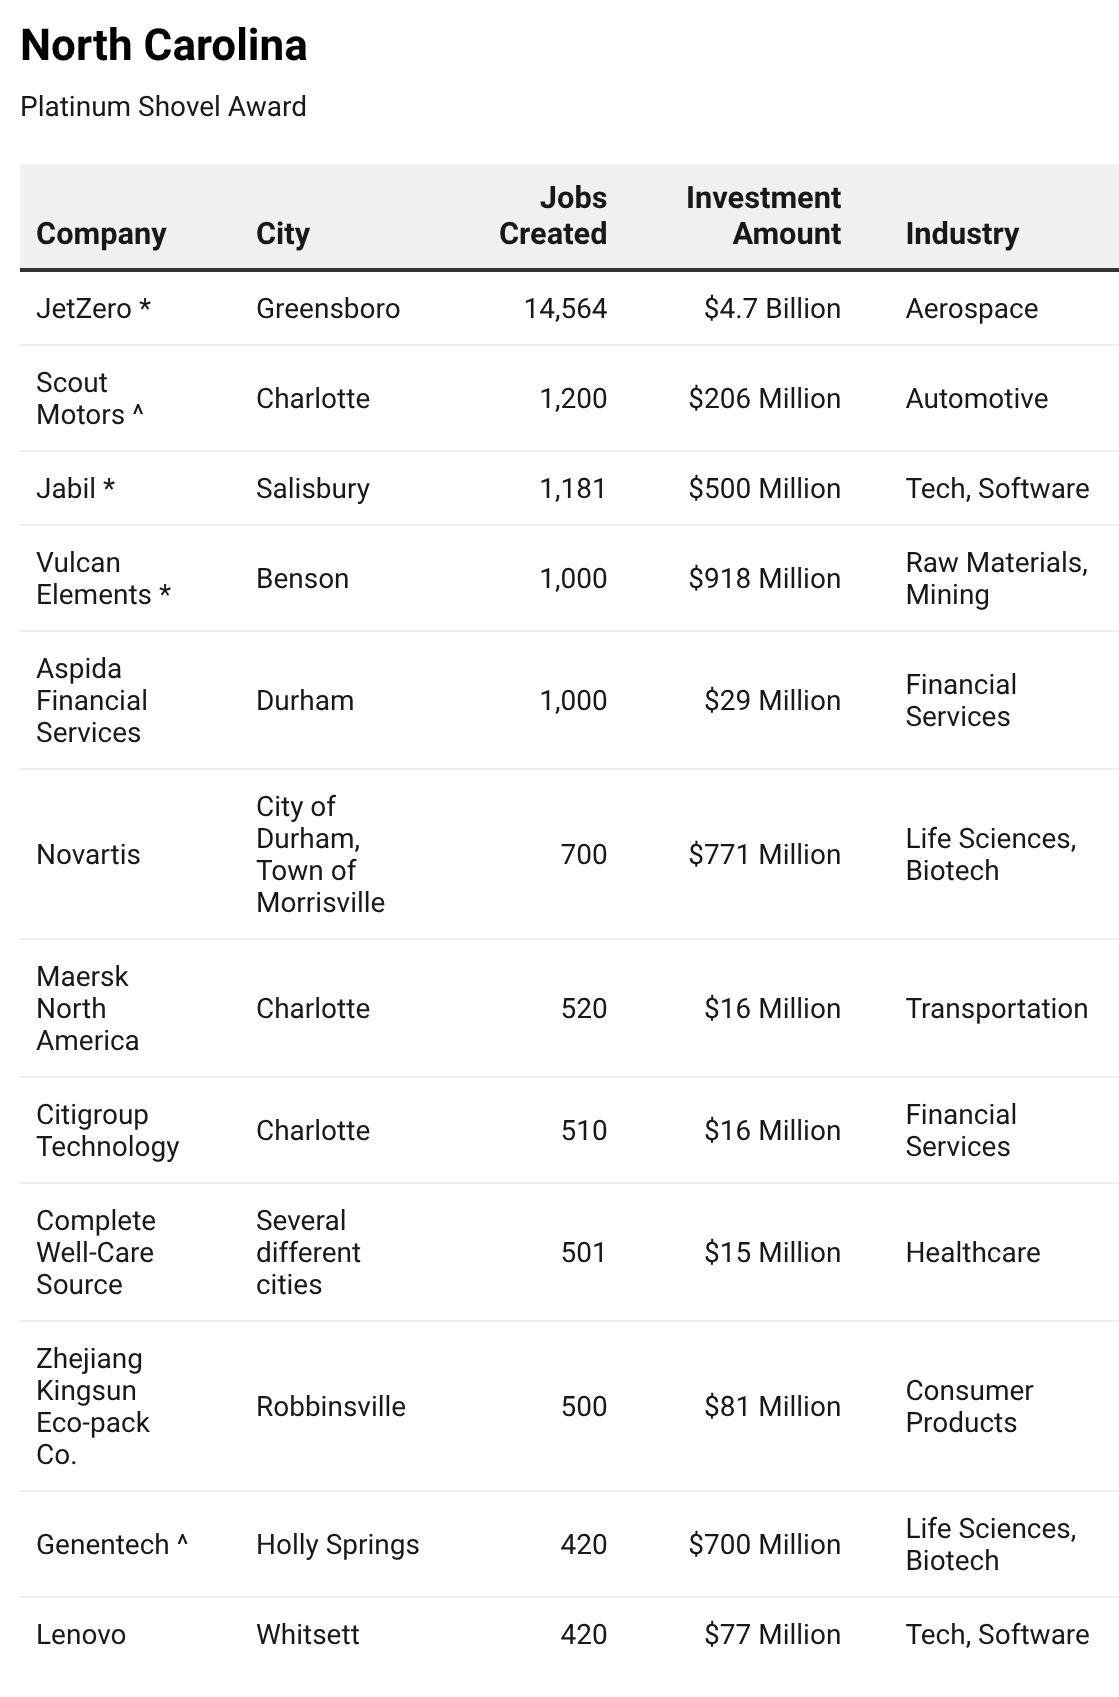
Platinum Shovel Winner: North Carolina (8 to 12 Million Population)
North Carolina’s Platinum Shovel this year is the product of extraordinary range — not just in dollar figures, but in the breadth of industries the state has managed to attract, retain, and grow simultaneously. From aerospace to biomanufacturing, from renewable energy to financial services, the Tar Heel State demonstrated in 2026 that it has built something more durable than a hot streak. It has built an ecosystem. The headline project is JetZero, the California-based blended-wing aircraft developer that selected Greensboro
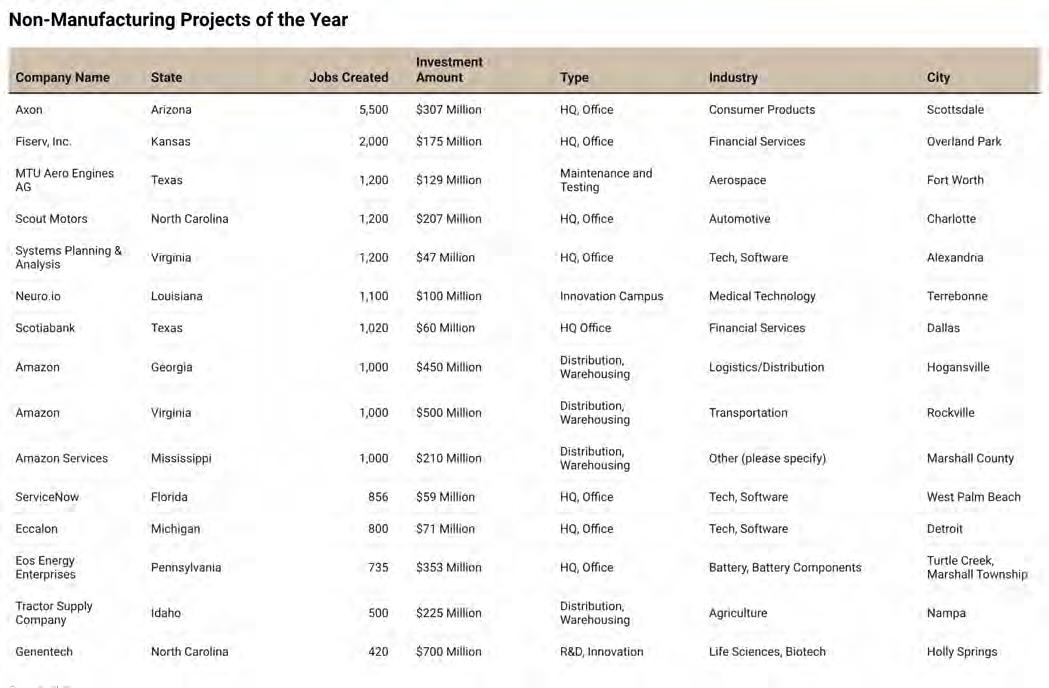
Non-Manufacturing Project of the year Manufacturing Project of the year
for a $4.7 billion manufacturing facility expected to create more than 14,500 jobs — the single largest job-creation commitment in this year’s entire award cycle. It is a transformative bet on the future of aerospace, and North Carolina’s selection signals that the state’s aviation workforce, logistics infrastructure, and research corridor were simply too compelling to pass up.
THE PARTNERSHIPS DRIVING VIRGI NIA’S BIOPHARMA SUCCESS
Virginia is pairing industry investment, academic partnerships and workforce development to build a resilient biopharmaceutical manufacturing ecosystem
By Virginia Economic Development Partnership
Last fall, Virginia’s life sciences industry transformed in the span of about a month. Biopharmaceutical manufacturing giants AstraZeneca, Eli Lilly and Company and Merck announced major projects in the commonwealth representing $12.5 billion in capital investment and 1,750 direct jobs. But just as encouraging was what came next.
Eleven days after the Merck announcement — the last of the three — the companies committed $120 million in private investment toward developing the Virginia Center for Advanced Pharmaceutical Manufacturing, a workforce training partnership with several Virginia institutions of higher education.
The Virginia Center for Advanced Pharmaceutical Manufacturing is just the most recent example of the spirit of collaboration and partnership that has helped drive the recent string of major investments. The Medicines for All Institute at Virginia Commonwealth University, a collaborative effort dedicated to making critical medicines more affordable and accessible by rethinking manufacturing, is one of the most established partnerships driving Virginia’s life sciences success.
Dr. Frank Gupton and Dr. Eric Edwards founded Richmondbased Phlow Corp. in 2020. That same year, Phlow was awarded a $354 million contract to expand the advanced pharmaceutical industrial base with new manufacturing facilities designed to reshore the development and manufacturing of essential medicines. Nonprofit generic drug manufacturer Civica Rx, a key partner in the initiative, built a $325 million sterile injection manufacturing facility in Petersburg to manufacture affordable insulin.
These organizations all played major roles in creating the Alliance for Building Better Medicine, the galvanizing Richmond-Petersburg regional coalition formed to build a regional biopharmaceutical ecosystem and create a resilient drug supply. A key part of the alliance’s efforts is academia and the private sector working hand in hand, with nearby institutions including Virginia Commonwealth University, Virginia State University and the Community College Workforce Alliance — the workforce development division of two Richmond-area community colleges, Brightpoint and Reynolds — all participating.
“That early work to stand up Phlow and Civica made collaboration possible,” said Joy Polefrone, APM Tech Hub regional innovation officer and the alliance’s founding executive director.
In 2023, the role of academia in supplying workforce talent to Virginia’s growing biopharma and advanced pharmaceutical manufacturing ecosystem received another boost with the announcement of the “Virginia Research Triangle,” which quickly evolved into a quadrilateral with the participation of Virginia Commonwealth University, the University of Virginia, Virginia Tech and Old Dominion University. Those universities, along with George Mason University and the College of William
& Mary, also joined forces with the Virginia Innovation Partnership Corporationfor the Lab-to-Launch initiative, aimed at accelerating the path from invention to startup by connecting university innovation with talent, capital and industry.
Much of the early work done by the Medicines for All Institute and the Alliance for Building Better Medicine laid the groundwork for industry and academia to engage seamlessly, from building new, highly specialized curricula to creating clear pathways from K-12 education through higher education.
Other states “look at us as a model on how you build this together,” Polefrone said.
This article was paid for and written by Virginia Economic Development Partnership and approved by Area Development.
Medicines for All Institute, Virginia Commonwealth University
Accelerating life sciences from discovery to delivery
Virginia is where life sciences and biopharma succeed. A collaborative ecosystem, skilled workforce, and business‑ready environment help companies move faster — from discovery to manufacturing to global scale.
Learn more about Virginia’s biopharma hub
University of Virginia School of Medicine
BIO-CAT, Inc., Fluvanna County
Medicines for All Institute, Virginia Commonwealth University
Scout Motors is planting a major automotive presence in Charlotte with a $206 million commitment and 1,200 jobs, while Jabil’s $500 million tech and software investment in Salisbury demonstrates that capital-intensive, low-headcount advanced manufacturing is finding a home here too. Vulcan Elements adds $918 million and 1,000 jobs in raw materials and mining in Benson — a sector that doesn’t always make the life sciences headlines but anchors industrial supply chains.
Life sciences remain a North Carolina calling card. Novartis is expanding across Durham and Morrisville with a $771 million investment and 700 new positions, while Genentech’s $700 million R&D and innovation hub in Holly Springs adds another 420 jobs to the Research Triangle’s already formidable biotech cluster.
Financial services are growing too — Aspida is bringing 1,000 jobs to Durham, and Citigroup Technology is adding 510 positions in Charlotte alongside Maersk North America’s 520-job transportation hub. Consumer products manufacturer Zhejiang Kingsun Ecopack Co. brings 500 jobs to Robbinsville, and Lenovo rounds out the roster with 420 positions in Whitsett.
Taken together, North Carolina’s 2026 project portfolio is a masterclass in diversification. No single sector dominates, no single metro carries the weight, and no single type of capital defines the story. That balance — hardwon and carefully cultivated — is exactly what a Platinum Shovel is meant to recognize.
Gold Shovel Winners: Outstanding Performance by Population Category
Texas (12+ Million Population)
Texas takes home the Gold Shovel in the largest population category for another year, anchored by a project slate that reflects the state’s growing centrality to the digital economy. Southwest Airlines is planting 2,000 jobs in Austin with a $19 million commitment, and Tesla is expanding in Brookshire with $190 million and 1,500 new positions. But the project that defines Texas’s 2026 story is Wistron’s $761 million advanced manufacturing and AI facility in Fort Worth — a manufacturing
Non-Manufacturing Project of the year Manufacturing Project of the year
project of the year that positions the state at the intersection of physical production and artificial intelligence.
Life sciences are taking root. Lilly’s $6.5 billion commitment in Harris County is one of the largest pharmaceutical investments in the state’s history, adding 615 jobs and anchoring a biomanufacturing corridor outside Houston. MTU Aero Engines AG rounds out the aerospace picture with 1,200 jobs and $129 million in Fort Worth
Food processing and consumer products continue to diversify the portfolio. Bridor USA is bringing 600 jobs and $410 million to Lancaster, and SPC Group adds 450 jobs in Burleson. The energy sector keeps pace with Space Exploration’s $280 million investment in Bastrop and Vinton Steel’s $229 million metal recycling operation in El Paso. Scotiabank’s 1,020-job financial services hub in Dallas and Wiwynn Corp’s 514-job tech operation in Socorro round out a roster that touches virtually every corner of a $2 trillion economy.
Virginia (8 to 12 Million Population)
Virginia earns the Gold Shovel in its population category with a project slate built on depth and strategic coherence.
WHERE THE WORLD BUILDS BIGGER
Taking home our 13th Gold Shovel Award from Area Development, Texas is where global companies innovate and where diverse industries thrive. Texas offers boundless opportunity to grow and scale faster. Home to the eighth-largest economy in the world and the best workforce in America, discover how Texas works for your business.
Congratulations to MTU Aero Engines and Wistron in Fort Worth and Scotiabank in Dallas on winning 2026 Project of the Year recognitions!
In Arizona, we never stop breaking ground.
Innovative companies from around the globe continue to choose Arizona to grow, invest, and lead. Major wins from 2025 included Amkor Technology’s state-of-the-art semiconductor advanced packaging and test campus in Peoria and Axon’s new global headquarters and manufacturing campus in Scottsdale. Both projects were recognized as Area Development 2026 Projects of the Year. Arizona has now earned eight Gold Shovel Awards, reinforcing the state’s record-breaking private-sector investment, expanding innovation ecosystem, and extraordinary economic momentum.
Arizona is where advanced technologies accelerate and bold ideas scale. From thriving semiconductor and advanced manufacturing sectors to unmatched connectivity and business-friendly leadership, the state continues to attract the world’s most forward-thinking companies. Beyond business, Arizona offers an exceptional quality of life — with breathtaking outdoor adventure, vibrant arts and culture, and attainable living — creating the ideal environment for talent, innovation, and long-term success.
The commonwealth attracted major wins in semiconductors, pharmaceuticals, energy, defense, and tech — and did so across a geography that stretches from the D.C. suburbs to the Southside.
Eli Lilly’s $5 billion pharma manufacturing facility in Richmond is a manufacturing project of the year and one of the most significant life sciences investments in state history, bringing 650 new jobs and reaffirming Virginia’s emerging role in pharmaceutical production. AstraZeneca adds another $4.5 billion and 600 jobs in Charlottesville, making Virginia one of the most active pharma states in the nation this year.
On the tech and software front, Systems Planning and Analysis brings 1,200 jobs to Alexandria, and 22nd Century Technologies adds 880 positions in McLean. Amazon’s $500 million distribution and warehousing hub in Rockville creates 1,000 jobs. LS Cable America’s $690 million raw materials and mining operation in Chesapeake — a manufacturing project of the year — adds 433 positions and strengthens the state’s role in infrastructure supply chains.
Hitachi Energy brings $457 million and 825 jobs in energy renewables to South Boston. Defense is represented by Elbit Systems of America in Roanoke with 288 jobs. LEGO Systems in Prince George adds 305 jobs in transportation, and Dover Food Retail rounds out the roster with 300 jobs in refrigeration systems in Chesterfield. Virginia’s ability to compete across this many sectors simultaneously is what earns it the Gold.
Arizona (5 to 8 Million Population)
Arizona reclaims Gold Shovel honors in the 5-to-8-million population category with a year defined by semiconductor dominance and surprising sector diversity. The headline is Amkor Technology’s $5 billion chip investment in Peoria — a manufacturing project of the year — creating 3,000 jobs and cementing Arizona’s status as one of the most important nodes in the domestic semiconductor supply chain. It joins a deepening cluster that includes Applied Materials in Chandler, KPPC Advanced Chemicals in Casa Grande, NRS Logistics in Casa Grande, and Cyclic Materials in Mesa — all reinforcing the full stack of chip-related manufacturing.
Consumer products punch above their weight this year. Axon’s $307 million headquarters operation in Scottsdale brings an extraordi-
Non-Manufacturing Project of the year Manufacturing Project of the year
Non-Manufacturing Project of the year
Manufacturing Project of the year
FFX MARKS THE SPOT
Where business comes to dent the universe
At the nexus of access and influence exists a place where the frontiers of the future are being reimagined. Here in Fairfax, businesses from rising startups to Fortune 500s find fertile ground to put down roots and scale to new heights. A community grounded in diversity of thought, we are the center of gravity where purpose and progress intertwine. In this place, icons come to reinvent, and the workforce of the future is being built today. From here, you can dent the universe.
www.fairfaxcountyeda.org
KANSAS: A FASTER PATH FROM AEROSPACE CONCEPT TO COMMERCIALIZATION
From advanced air mobility to defense manufacturing, Kansas offers aerospace companies a tightly integrated environment built for execution.
By Kansas Department of Commerce
Speed to market, access to test environments, workforce readiness, and supply chain reliability increasingly determine where projects land. Kansas offers a fully integrated platform that reduces friction across each of those variables.
Home to Wichita — long recognized as the Air Capital of the World — Kansas anchors one of the most concentrated aerospace clusters in the United States, with 34,000+ direct aerospace jobs, more than 65,000 total jobs supported, and over $24 billion in annual economic output.
Aerospace products account for more than 20% of the state’s exports, reinforcing Kansas’ role as a global production hub.
Execution Speed Built into the Ecosystem Kansas enables companies to move from concept to deployment without leaving the state.
OEMs, Tier 1 suppliers, and engineering firms operate alongside research institutions and workforce partners in a tightly connected environment. This proximity reduces handoffs, shortens development timelines, and simplifies scaling. Major employers such as Boeing, Bombardier and Textron Aviation anchor a mature supply chain, allowing companies to plug into existing production capacity rather than build from scratch.
The Kansas Advanced Air Mobility (AAM) Roadmap aligns public and private partners around a single objective: accelerate commercialization of emerging aerospace technologies by removing barriers between R&D, testing and production.
Workforce That is Already Industry-Aligned Kansas’ talent pipeline is connected
directly to aerospace employers and real-world applications, with average industry wages nearing $70,000 annually. Three of the state’s public research universities prepare students for postgraduation success in this sector:
• Wichita State University and the National Institute for Aviation Research (NIAR) — the largest universitybased aviation R&D center in the U.S. — support certification, testing, and advanced manufacturing for commercial and defense programs.
• University of Kansas provides advanced engineering and unmanned systems research.
• Kansas State University delivers applied training across pilot programs, UAS operations, and aeronautics.
Airspace and Testing Access That Reduces Time and Risk
One of the most significant constraints in aerospace development is access to airspace for testing and validation. Kansas offers:
• The Kansas Supersonic Transportation Corridor spans 770 nautical miles of FAA-authorized airspace and supports testing up to Mach 3 speeds.
• As a lead participant in the FAA BEYOND program — one of only eight nationwide — Kansas enables large-
scale UAS testing across diverse and uncongested environments.
For companies developing AAM, UAS or advanced propulsion systems, this translates directly into faster iteration cycles and fewer regulatory delays.
Integrated Defense and Commercial Opportunities
Kansas’ military presence — including McConnell Air Force Base, Fort Riley and Fort Leavenworth — creates opportunities for collaboration, testing and workforce transition.
In 2024, Kansas-based companies secured $1.6 billion in defense contracts, contributing to more than $4 billion in total federal defense spending statewide, supporting a stable and experienced supplier base with both commercial and defense capabilities.
Supply Chain Depth and Manufacturing Capacity
Kansas’ aerospace supply chain spans advanced materials, composites, avionics, aerostructures and precision manufacturing — one of the most complete general aviation ecosystems in the world.
Companies locating in Kansas gain immediate access to this established network, reducing ramp timelines, lowering capital requirements, and improving operational certainty. Where Aerospace Projects Get Done
For companies looking to move quickly, test efficiently, and scale with confidence, Kansas offers a clear advantage: an established aerospace environment built for execution. Learn more at kansascommerce.gov.
This article was paid for and written by Kansas Department of Commerce and approved by Area Development.
Bombardier has its U.S. headquarters in Wichita as well as the global headquarters for Bombardier Defense, a flight test center, and a service center that supports their entire family of jets.
nary 5,500 jobs — the largest single employment commitment in Arizona’s 2026 project roster — and signals that the state’s talent base extends well beyond the fab floor. Komatsu adds 100 jobs in Mesa in raw materials and mining, and Moses Lake Industries contributes 40 specialty chemical positions.
Energy and climate tech are growing. Apex Power Conversion brings 700 renewable energy jobs to Mesa, GTI Energy adds 250 positions in Goodyear, and Eternity Technologies contributes battery components manufacturing in Phoenix. Hadrian’s $200 million aerospace investment in Mesa adds 350 jobs. CarbonCapture’s carbon storage hub, also in Mesa, is one of the more forward-looking plays in the state’s portfolio. From chips to carbon, Arizona’s 2026 slate proves it is building for the long term.
Louisiana (3 to 5 Million Population) — Gold Shovel Winner
Louisiana earns the Gold Shovel this year on the strength of a project portfolio that reflects both industrial depth and a rapidly expanding role in the nation’s energy and technology future. The state landed major commitments across automotive manufacturing, data infrastructure, clean energy, metals, and advanced industrial production, with investments spread across both established hubs and emerging markets.
Meta’s $10 billion data center campus in Richland Parish — a non-manufacturing project of the year — stands among the largest economic development announcements in state history. Hyundai Motor Group reinforces the momentum with a $5.8 billion automotive and mobility investment in Ascension Parish, creating one of the year’s most significant manufacturing wins.
Woodside Energy’s $17.5 billion clean energy project in Calcasieu Parish further elevates Louisiana’s profile, while CF Industries, Strategic Biofuels, Hut 8, and Sarcos Technology add depth across energy, technology, and industrial sectors. Louisiana’s Gold Shovel this year is both deserved and unmistakable.
Non-Manufacturing Project of the year Manufacturing Project of the year
Non-Manufacturing Project of the year
THREEPEAT!
Through bold leadership and transformative tax reform, Louisiana is attracting global capital at an unprecedented scale, securing billions in investment from global leaders like Meta, Hyundai, and Woodside—proving that the world’s future in energy, innovation, and AI begins right here— in Louisiana.
LOUISIANA IS BUILT FOR BUSINESS. LEARN MORE AT OPPORTUNITYLOUISIANA.COM
Mississippi (Under 3 Million Population)
Mississippi’s Gold Shovel performance in 2026 is anchored by a surge of warehousing, advanced manufacturing, and energy infrastructure investment that reflects the state’s growing competitiveness in logistics-driven industries. Amazon leads the way with a $210 million distribution and warehousing operation in Marshall County, bringing 1,000 jobs and reinforcing Mississippi’s position along major freight corridors.
Howard Industries follows with $237 million and 450 jobs in electrical transformer manufacturing across Clark, Jones, and Simpson Counties — a critical infrastructure play given the national push to modernize the power grid. Modime adds 450 jobs in data center cooling equipment manufacturing in Grenada County, bringing $38 million in investment and connecting Mississippi to the booming data center supply chain.
The project list broadens into agriculture, industrial machinery, and clean energy. Amick Farms brings 192 jobs to Laurel, ABB adds 122 positions and $40 million in industrial machinery to Senatobia, and Southeastern Timber Products invests $123 million in Ackerman for lumber production. TerraForge Biocarbon Solutions makes a $136 million metals and clean energy play in Magnolia, and ROCKWOOL contributes $105 million in consumer products to Marshall County. BWC Terminals rounds out the story with $316 million in transportation infrastructure in Pascagoula. Mississippi’s Gold Shovel reflects a state competing smart and winning.
Silver Shovel Winners: Excellence Across the Map
The Silver Shovel Awards honor states that demonstrated outstanding economic development performance across their population categories — states that may not have captured the single headline number that defines a Platinum or Gold winner, but whose project portfolios reflect the kind of consistent, strategic execution that builds durable economic strength over time.
This year’s Silver class is as varied as any in the award’s history. New York is cementing its role in the domestic semiconductor revival. Florida is diversifying beyond its service-econ-
Manufacturing Project of the year
omy roots. Ohio is competing hard for next-generation defense manufacturing. Georgia is proving that automotive scale and tech growth can coexist in the same state. Tennessee is betting on nuclear. South Carolina is riding the electrification wave. Alabama is landing life sciences while holding its defense and aerospace ground.
From carbon capture infrastructure in the Gulf South to food and agricultural processing in the Great Plains, from data center campuses anchoring rural communities to precision manufacturing clusters anchoring mid-sized cities, the Silver Shovel states shaped the industrial map of 2026 in ways that will compound for years. Their stories follow.
New York (12+ Million Population)
New York’s Silver Shovel year is anchored by a pair of food and life sciences investments that signal the state’s industrial range extends well beyond the financial corridor. Chobani’s $822 million expansion in Rome — a manufacturing project of the year — creates more than 1,000 jobs and underscores that food innovation is as much a part of New York’s economic identity as Wall Street. Cayuga Milk Ingredients adds $270 million and 150 dairy products jobs in Aurelius, reinforcing the state’s deep agricultural manufacturing base.
The Silver Standard Northwest Florida
The Triumph Gulf Coast Fund is a performancedriven economic development tool created to strengthen and diversify Northwest Florida’s economy. Unlike traditional incentive programs that offer short-term financial support, Triumph invests in long-term capacity—workforce training, infrastructure, and site development — that improve the region’s competitiveness and directly support private investment.
Pharmaceutical Manufacturer
Escambia County
Protection Solutions Manufacturer
Wakulla County
Gas Turbine Engine Manufacturer
Okaloosa County
Discover more about the Triumph Gulf Coast Fund.
Regeneron invests $2 billion in Saratoga Springs with 1,000 jobs, deepening the state’s pharmaceutical manufacturing base. Corning Incorporated’s $371 million optical materials commitment in Canton reinforces the state’s role in advanced telecommunications infrastructure.
BAE Systems brings 134 defense jobs to Endicott, GE Vernova adds 50 positions in Schenectady with a $40 million clean energy investment, and General Motors commits $848 million to automotive operations in Tonawanda. Financial services firm BILT adds 625 jobs in New York City at no capital cost, joined by QueenOne with 600 tech and software positions. Alstom rounds out the list with 258 transportation equipment jobs in Hornell. New York’s breadth across sectors is its signature strength.
Florida (12+ Million Population)
Florida earns its Silver Shovel with a balanced portfolio that spans aerospace, life sciences, defense, and technology — sectors that reflect the state’s ongoing evolution from a servicedriven economy into a more diverse industrial base. ServiceNow leads the non-manufacturing side with a non-manufacturing project of the year designation, bringing 856 tech and software jobs to West Palm Beach with a $59 million investment.
Carnival Cruise Line’s $479 million commitment in Miami brings 525 jobs in maritime operations, Otto Aviation Group is investing $426 million in Jacksonville with 389 jobs, and Williams International commits $1 billion and 336 jobs to aerospace manufacturing in Crestview. Inkas Group adds 294 military and defense vehicle manufacturing positions in Fort Pierce. Life sciences show momentum. Lupin brings $250 million and 200 biotech jobs to Coral Springs, and Pegasus Laboratories adds 70 life sciences positions in Pensacola. Point Blank Enterprises contributes 300 body armor manufacturing jobs in Crawfordville, and Ben E. Keith Company adds 325 food distribution jobs in Gainesville. Swisher’s $135 million consumer products operation in Jacksonville rounds out a Florida portfolio that punches well above its historical industrial weight.
Non-Manufacturing Project of the year
Manufacturing Project of the year
WHERE VISION MEETS VELOCITY
Ohio (8 to 12 Million Population)
Ohio’s Silver Shovel this year is headlined by Anduril Industries’ $910 million aerospace investment in Pickaway County — a manufacturing project of the year — bringing more than 4,000 jobs and positioning the state as a major player in next-generation defense manufacturing. It is a landmark project for a state that has long anchored American industrial production and is now competing hard for the advanced manufacturing of the future. Consumer products and advanced manufacturing provide depth. Kimberly-Clark Corporation commits $800 million and 491 jobs to Warren, while Whirlpool Corporation invests $300 million and 448 jobs across Clyde and Marion. First Quality Tissue adds $984 million and 407 jobs in Defiance. LayerZero brings $14 million and 535 advanced manufacturing positions to Streetsboro.
Non-Manufacturing Project of the year Manufacturing Project of the year
WHERE MOUNTAINS
County combines strategic East Coast connectivity,
Healthcare and pharmaceutical investment rounds out the Ohio story. Hims & Hers brings $200 million and 400 jobs in medical and pharmaceutical production to New Albany, while Amgen adds $822 million and 350 healthcare jobs in the same city. Givaudan’s $215 million flavour and fragrance operation in Reading creates 300 jobs, and StandardAero adds 300 aerospace positions in Sharonville. Centrus contributes 300 energy and oil and gas jobs in Piketon at no reported capital cost. Ohio’s consistency across sectors and geographies remains one of the Midwest’s most reliable economic development stories.
Georgia (8 to 12 Million Population)
Georgia earns its Silver Shovel with a project roster defined by automotive scale, logistics depth, and the kind of sector diversity that reflects a mature economic development program. Hyundai Motor Company’s $2.7 billion commitment in Ellabell — a manufacturing
project of the year — creates 3,000 jobs and solidifies Georgia’s position as one of the South’s premier automotive states. It is the kind of anchor investment that transforms not just a community but an entire regional economy.
Amazon reinforces Georgia’s logistics infrastructure with $450 million and 1,000 distribution and warehousing jobs in Hogansville, while JS Link brings $223 million in battery and battery component manufacturing to Columbus with 520 jobs.
Pilgrim’s adds 630 food processing jobs in LaFayette, and Georg Fischer and Hwashin continue to build out the automotive supply chain with investments in Augusta and Dublin respectively.
Technology and life sciences are growing. TrNet brings 750 tech and software jobs to Dunwoody, while BioTouch adds 480 life sciences positions in Columbus. Shriners Children’s commits $153 million and 470 jobs in Atlanta, and Georgia Transformer invests $40 million in renewable energy in Rincon.
Continued on page 56
choosing to grow their business in Arizona.
Which States Had the Top Manufacturing Projects of the Year?
The manufacturing projects of the year read like a dispatch from the frontlines of American industrial reinvention. Aerospace, semiconductors, pharmaceuticals, and raw materials dominate a list that spans the country geographically and the economy structurally — from a revolutionary aircraft plant in North Carolina to a nuclear energy facility in Tennessee to a chip mega-campus in Idaho.
North Carolina's JetZero deal tops the list with 14,564 jobs and $4.7 billion — numbers that would be extraordinary in any year. Ohio's Anduril deal follows with 4,008 aerospace and defense jobs. Arizona and Idaho both land semiconductor projects of the year: Amkor Technology in Peoria and Micron in Boise, each creating 3,000 positions. Georgia's Hyundai Motor Company rounds out the top tier with 3,000 automotive jobs in Ellabell. Pharma and energy appear throughout the middle of the list. Virginia claims two manufacturing projects of the year — Eli Lilly in Richmond and AstraZeneca — adding 1,250 pharma jobs between them. Tennessee's Korea Zinc commitments represent $6.6 billion in raw materials investment. Alabama's Eli Lilly adds $6 billion and 450 pharmaceutical jobs. Louisiana's Sarasonic Technologies and Hyundai Motor Group bookend the state's autonomous systems and automotive ambitions.
The full list makes clear that manufacturing in America is no longer a single sector story. The states earning recognition this year competed across aerospace, chips, pharma, food, metals, and clean energy — and won. The breadth is as impressive as the scale. But if you're looking for Data Centers, we separated those out this year. See below.
Kentucky’s Shovel Award Starts Here. Louisville delivered more than $3 billion in new investment in 2025.
onelouisville.org | 502.625.0000 Ready to locate, expand, or invest? GE Appliances, Foxconn, and Ford Motor Company chose Louisville. Your next move starts here.
Automotive Aerospace & Defense Life Sciences
#1 $12.8B 96,000+ per capita motor vehicle production in the U.S. 85,000 advanced manufacturing jobs. 1,566 manufacturers.
“Truck Capital of America”Site Selection Magazine
1 in 8 Metro jobs tied to defense, aerospace, and cargo. Home to Kentucky’s Defense Innovation OnRamp – 1 of only 8 in the U.S. economic output
100,000+ sq. ft. BSL-2 lab space with end-of-runway UPS Airlines access. jobs
3M+ sq. ft. of temperaturecontrolled space at UPS Worldport & Labport.
Continued from page 53
Socomec contributes 300 electrical component jobs in Suwanee, and Flock Safety rounds out the list with 210 security software positions in Smyrna.
Tennessee (5 to 8 Million Population)
Tennessee’s Silver Shovel this year features two projects of the year that tell very different but equally compelling stories about where the state’s industrial economy is headed. Oklo’s $1.7 billion nuclear energy investment in Oak Ridge — a manufacturing project of the year — creates 812 jobs and places Tennessee at the forefront of the advanced nuclear renaissance, a sector that is drawing serious capital for the first time in decades. Korea Zinc’s $6.6 billion raw materials and mining commitment in Clarksville and Gordonsville — also a manufacturing project of the year — adds 740 jobs and represents one of the largest single investments in state history.
The rest of the Tennessee portfolio reflects a state with genuine industrial range. Quanta Manufacturing brings 495 tech and software jobs to Nashville, and Vibrant Health Products adds 394 food processing positions in Ross ville. ALUKO Group contributes 285 aluminum manufacturing jobs in Halls with a $108 million investment, and Hyosung HICO brings $157 million and 240 energy and renewables positions to Memphis.
Aerospace continues to grow. Howmet Aerospace invests $28 million in Morristown with 217 jobs, and West Star Aviation adds 200 positions in Chattanooga. Nuclear Fuel Services brings 198 jobs and $122 million to Erwin, while Nidec Motor Corporation adds 200 energy and renewables positions in Lexington. Oshkosh Manufacturing rounds out the list with 194 automotive jobs in Jefferson City.
What makes Tennessee’s Silver Shovel par ticularly meaningful is the coherence of the story it tells. Nuclear and mining at the top end, food processing and aluminum in the middle, aero space and automotive anchoring the base — it’s a portfolio that doesn’t lean on any single sector
Project of the year
Continued on page 60
Manufacturing
WHERE YES WORKS. FORT WORTH.
Fort Worth is central to the country and connected to what matters — a major market with nearly four million workers, infrastructure built to scale, and a culture where business and government work together. Here, YES isn't something you negotiate. It's built in.
Fort Worth is where YES works. Let’s put it to work for you.
Which States Had the Top Non-Manufacturing Projects of the Year?
This year's top non-manufacturing projects reveal just how vital digital infrastructure, logistics, and headquarters investment have become to state-level economic growth. Arizona leads the non-manufacturing list on jobs, with Axon's $307 million headquarters expansion in Scottsdale creating an extraordinary 5,500 positions — a reminder that corporate HQ investment can rival any factory in employment impact. Kansas follows with Fiserv's $175 million financial services campus in Overland Park, bringing 2,000 jobs and signaling that the Midwest's professional services economy is very much in play.
Distribution and warehousing round out the picture, with Amazon projects landing in Georgia, Virginia, Mississippi, and Idaho, reinforcing the e-commerce giant's role as one of the most consistent economic development partners in the country. Pennsylvania's Eos Energy Enterprises and North Carolina's Genentech contribute battery components and R&D innovation to a list that, taken as a whole, reflects an economy where the definition of "high-impact project" has permanently expanded.
GROWTH AND RECOGNIZED FOR IT
Continued from page 56
or single metro to carry the weight. Tennessee has spent years building the workforce pipelines, infrastructure corridors, and incentive structures that make this kind of breadth possible. In 2026, that investment paid off.
South Carolina (5 to 8 Million Population)
South Carolina’s Silver Shovel performance in 2026 is built on transformer manufacturing, electrification, and a broadening industrial base that is increasingly competitive on the national stage. Eaton leads the roster with $340 million and 700 jobs in transformer manufacturing in Jonesville — reflecting the critical national need for grid infrastructure investment — while Isuzu North America brings $280 million and 700 automotive jobs to Greenville.
Clean energy is a recurring theme. First Solar invests $330 million and 600 jobs in Gaffney in energy and clean tech, and Woodward adds $200 million and 275 positions in the same sector in Greer. TS Conductor brings $134 million and 462 electrical equipment jobs to Hardeeville, and Homanit adds $250 million and 300 automotive positions in Alcolu.
Defense manufacturing appears in Charleston County, where Keel contributes $67 million and 170 jobs, and QMP adds 233 water filtration positions in Walterboro. SODECIA-AAPICO brings 392 automotive jobs to Orangeburg, and Isuzu North America and Georg Fischer round out the automotive supply chain. Komar Industries adds 160 industrial machinery jobs in York County, and Kimberly-Clark contributes 150 consumer products positions in Aiken. South Carolina’s trajectory is clearly upward.
Alabama (5 to 8 Million Population)
Alabama’s Silver Shovel year is anchored by the defense and aerospace sectors, with a project portfolio that reflects the state’s longstanding strengths while pointing toward new industrial frontiers. U.S. Space Command brings 1,312 defense jobs to Huntsville at no reported capital cost — a federal presence that reinforces the region’s role as a national hub for space and defense operations. Eli Lilly’s $6
Manufacturing Project of the year
Manufacturing Project of the year
LEXINGTON COUNTY DELIVERS SPEED TO MARKET LEXINGTON COUNTY DELIVERS SPEED TO MARKET
“WiJo
Pouches demonstrates Lexington County’s speed to market advantage, advancing from a padded site to a completed building and beginning operations in under one year through strong partner alignment.”
— Nick Stomski, SIOR
Trinity
Partners
A premier South Carolina location for companies ready to grow, invest and move quickly.
When considering your next move, speed and certainty are critical. Lexington County, South Carolina, offers global and domestic companies a proven track record of stability at both the state and local levels, making it a strong location for entering and expanding in the U.S. market. With strategic market access, a strong industrial base, and a responsive economic development team, Lexington County helps companies move from site selection to operations with speed, certainty, and confidence.
Recent international investments by WiJo Pouches, Cardiff Products, and ATP Adhesives demonstrate Lexington County’s speed to market advantage. These projects show how quickly companies can move from groundbreaking to grand opening when the right partners are in place. In Lexington County, rapid execution is not the exception. It is how we do business.
Why Lexington County
• Strategic location in the Columbia MSA
• Robust interstate, air cargo, and freight rail infrastructure
• Strong manufacturing and logistics ecosystem
• Top ranked market for millennial migration
• Stable environment for business investment
billion pharmaceutical investment in Huntsville — a manufacturing project of the year — adds 450 jobs and signals that Alabama’s life sciences ambitions are serious.
Automotive investment continues to flow. CPT America brings $163 million and 187 jobs in automotive manufacturing to Tuskegee, while Samkwang adds 114 positions in the same city. ArcelorMittal Calvert invests $1.2 billion and 205 jobs in raw materials and mining in Calvert, and Alabama River Cellulose — a Georgia Pacific company — commits $800 million to raw materials in Monroeville.
Aerospace and defense round out the story. Northrop Grumman brings $72 million and 200 jobs to Huntsville, while Diageo North America adds $415 million and 100 beverage and food jobs to Montgomery. Owens Corning Corporation invests $325 million and 89 positions in raw materials in Prattville. Pilgrims brings 260 agriculture jobs to Russellville, and Butting contributes 100 stainless steel processing jobs in Loxley. AGS America rounds out the list with 70 automotive positions in Opelika.
Utah (3 to 5 Million Population)
Utah’s Silver Shovel performance in 2026 is built on medical technology, aerospace, and food processing — a combination that reflects the state’s ability to compete across very different industrial sectors. Stryker leads the roster with $615 million and 862 medical technology jobs in Salt Lake County, one of the larger medtech investments in the region this year. AeroVironment adds 526 aerospace jobs in Salt Lake City, and Bridor brings $277 million and 400 food processing positions to the same market.
Advanced manufacturing anchors the industrial middle of the portfolio. Nucor invests $205 million and 200 steel manufacturing jobs in Brigham City, and Stadler Rail brings $189 million and 250 transportation positions to Salt Lake City. ACS Manufacturing contributes 223 general manufacturing jobs in Clearfield, and UFP Industries adds 100 construction products positions in Grantsville City.
Energy and life sciences round out the picture. OxEon Energy brings $99 million and 103 renewable energy jobs to North Salt Lake, and Ratio Therapeutics adds 100 life sciences positions in West Valley City. Coast Pay contributes 100 financial services jobs in
Draper City. Microvascular Therapeutics brings a medical device presence to Salt Lake City, and AirBuild adds 15 renewable energy positions in Green River. Utah’s breadth of investment across sectors and geographies earned it a well-deserved Silver.
Kentucky (3 to 5 Million Population)
Kentucky’s Silver Shovel year is built on a foundation of consumer products, data infrastructure, and automotive reinvestment — with a few surprises that signal where the state is headed. Jabil leads the list with $150 million and 900 jobs in data center racking systems in Florence, while Haier brings $490 million and 800 consumer products jobs to Louisville.
Kroger Limited Partnership II adds $391 million and 430 consumer products positions in Franklin
Automotive investment remains strong. Ford Motor Company commits $1.9 billion to automotive operations in Louisville at no reported job cost — a modernization play that protects existing employment and positions the facility for next-generation vehicle production. Apple invests $2.1 billion in consumer products operations in Harrodsburg, also at no reported job figure, representing a significant vote of confidence in the state’s manufacturing capabilities.
Energy and packaging round out the picture. General Matter brings $1.5 billion and 140 energy and renewables jobs to Paducah, and Sazerac Distillers adds $1 billion and 50 food processing positions in Campbellsville — a reminder that Kentucky’s spirits industry remains a vital part of its economic identity.
EJ Franklin contributes 295 cast metal jobs in Franklin, Morris Packaging adds 276 flexible packaging positions in Lebanon, and Tate Access Floors brings 400 data center component jobs to Glasgow. AKFA Aluminum Solutions US adds 331 aluminum products jobs in Bowling Green, and Foxconn Technology invests $174 million and 180 tech positions in Louisville.
Idaho (Under 3 Million Population)
Idaho’s Silver Shovel is defined by one extraordinary project and a supporting cast that reflects the state’s emerging industrial identity. Micron Technology’s $35 billion semiconductor investment in Boise — a manufacturing project of the year — creates 3,000 jobs and represents one of the largest capital commitments in American manufacturing history. It transforms Idaho’s economic profile in a single stroke and positions the state as a critical node in domestic chip production for decades to come. Agriculture and food processing provide the depth that balances Micron’s scale. Tractor Supply Company invests $225 million and 500 jobs in agricultural operations in Nampa, and Chobani brings $500 million and 200 food processing jobs to Twin Falls. Kai-Tech (Nelson Integrated) adds $75 million and 75 food processing positions in Caldwell, and Marathon Cheese contributes 10 food
Manufacturing Project of the year
Non-Manufacturing Project of the year
Continued on page 68
Manufacturing Project of the year
Project Ready® Certified Sites. Vetted. Powered. Ready to go.
Because zero delay is power.
In today’s world, speed-to-market is everything. Mississippi Power knows that when you’re choosing a new location, you need confidence not questions.
That’s why we created the Project Ready® Certified Sites program: to deliver development-ready sites that are thoroughly vetted, risk-free and independently verified by the longest running economic development group in the state.
Discover the power of building in Mississippi.
Available, reliable, affordable power
Mississippi ranks in the top 10 for overall cost of doing business
Customizable contracts & fast-track permitting
Top 5 in logistics — prime SE location with port, rail and interstate access
Explore available sites
Data Center Project Of The Year
If one theme defines the non-manufacturing side of the economic development landscape, it is the data center — and the sheer scale at which hyperscalers, AI companies, and infrastructure developers are planting flags across the country. The Data Center Projects of the Year represent billions in capital investment and thousands of construction and operations jobs, and they are reshaping the economic geography of states that might not otherwise compete for high-tech investment.
Pennsylvania leads the list with Amazon Web Services' $20 billion campus in Salem Township and Falls Township — a commitment that positions the commonwealth as a major anchor of the East Coast digital backbone. Texas lands OpenAI's $25 billion data center in Abilene, one of the largest AI infrastructure investments ever announced. Wisconsin attracts both Microsoft ($4 billion, Mount Pleasant) and Vantage Data Centers ($15 billion, Port Washington) — a pairing that makes the state a genuine data center powerhouse.
New Mexico's BorderPlex Digital Assets brings $5 billion and 1,000 jobs to Santa Teresa, while Iowa's QTS Data Centers adds $10 billion and 200 jobs in Cedar Rapids. North Carolina lands Amazon Web Services in Rockingham with $10 billion and 500 jobs. Mississippi and Louisiana each claim Amazon and Hut 8 projects respectively, underscoring the Southeast's rise as a preferred destination for large-scale digital infrastructure.
These projects don't just represent capital — they represent long-term commitments to places. Data centers require power, water, land, and fiber, and the states that can deliver all four at scale are winning a competition that will define regional economies for the next generation.
Inkas® USA joins A-1 Industries of Florida, Accel International, Advanced Machine & Tool, Contender Boats, LactaLogics, Maverick Boat Group, OCULUS Surgical, Pursuit Boats, TAMCO and many more ….
Why St. Lucie?
Fast-growing regional workforce of 387,000+
“A”-rated public schools offer 58 career & technical programs
In 2025, 2,925 high school seniors graduated with 4,773 certifications
Aspen-award-winning state college offers 80+ career & technical programs
Florida’s most technologically advanced workforce training center supports the demand for trained manufacturing employees
Class A industrial/manufacturing space available now for immediate occupancy a global manufacturer of armored vehicles to our growing advanced manufacturing community.
Continued from page 64
processing jobs in Mountain Home. Industrial manufacturing rounds out the Idaho story.
JTS brings $55 million and 140 industrial equipment and manufacturing jobs to Nampa, while Pipeline Plastics invests $31 million and 39 plastics product positions in Rupert. Timberline Helicopters adds a small but meaningful aerospace presence in Sandpoint. Idaho’s 2026 Shovel is the story of a state landing the project of a generation while steadily building a more diversified industrial base around it.
Kansas
(Under 3 Million Population)
Kansas earns its Silver Shovel with a project portfolio anchored by financial services, life sciences, and the agricultural processing industries that have defined the state’s economy for generations — while adding new threads in business services and energy that point toward a broader industrial future. Fiserv leads the roster as a nonmanufacturing project of the year, bringing 2,000 financial services jobs to Overland Park with a $175 million investment.
Life sciences make a significant appearance. Intervet invests $860 million and 203 jobs in De Soto, adding pharmaceutical and biotech depth to a state more typically associated with grain and beef. SparkChange brings 441 business services jobs to Mission, and Advisors Excel adds $74 million and 150 business services positions in Topeka.
Agriculture and consumer products anchor the traditional economy. Real Kansas Meats contributes 131 jobs and $23 million in Fredonia, Spears Caney adds 181 consumer products jobs in Caney, and PTMW brings 140 consumer products positions to Manhattan. National Beef Packing Company makes a major no-reportedjob-cost commitment in Dodge City and Liberal, while CVR Refining CVL adds $203 million in energy operations in Coffeyville. Midwest Motor Express adds 199 transportation jobs in Kansas City, and Agiliti rounds out the list with 140 medical device positions in Hays. Kansas is a quiet, consistent winner
Non-Manufacturing Project of the year
Methodology
We compile the awards using project data submitted directly by state economic development agencies, and our own data. Submissions are evaluated on the basis of job creation, capital investment, industry diversity, and alignment with each state's broader economic development strategy. Projects are reviewed for credibility and completeness before inclusion.
Gold and Silver Shovel Awards are distributed across five population categories — under 3 million, 3 to 5 million, 5 to 8 million, 8 to 12 million, and 12 million and above — to ensure that states of different sizes are evaluated against comparable peers. The Platinum Shovel is awarded to the single standout performer across all categories. Manufacturing, Non-Manufacturing, and Data Center Projects of the Year are selected based on overall impact within their respective categories.
Powering Growth in South Carolina's Cooperative Territory
Our story is best told through the success of our members. Since 1988, South Carolina Power Team has been championing great stories through industry recruitment and by offering highly reliable power through South Carolina’s electric cooperatives. As an essential economic development partner, we continue to commit resources and incentives to help businesses thrive in South Carolina, and we play an essential role in the creation of job and career opportunities for those we serve.
Welcoming New Industrial Investment Across Cooperative Territory
From Reset to Ready: Understanding the Life Science Real Estate Market in 2026
How federal capital, private investment, and place are quietly reshaping U.S. manufacturing
By Deb Boucher Vice Chair, Cushman & Wakefield
Life science real estate markets are at a reset that’s a historical norm for the sector. The pattern of expansion, overheated peak and uneven correction is familiar both in the Research Triangle and across North America. How do we assess where the market actually stands, the structural forces shaping demand, and what real estate and site selection decision-makers should consider in the near and longer term?
The Oversupply Overhang: What the Numbers Say
The headline figures remain sobering for anyone with exposure to the top-tier life science markets. Leasable life science inventory across the United States stands at roughly 200 million square feet, with national vacancy running at approximately 23.5 percent. But that aggregate number masks a more acute problem in the markets that matter most. Boston, the San Francisco Bay Area and San Diego collectively account for around 130 million square feet
of that inventory — and vacancy in those three markets has climbed above 30 percent, a direct consequence of the speculative development boom that peaked around 2021–2022.
Boston, the global leader in life science venture fundraising — home to roughly 130,000 to 140,000 life science workers, with around 52,000 in pure R&D roles — is experiencing some of the most turbulent real estate conditions in the country. Average asking rents have fallen steadily since late 2023 and recently dropped below $80 per square foot for the first time since 2022. Still high in absolute terms, but the trajectory is unmistakable. There is also roughly 3.5 million square feet of new construction not yet reflected in vacancy counts, plus a significant volume of shadow sublease space expected to come to market over the next two years. When developers and leasing brokers in Boston describe current conditions, the language is grim. The absorption challenge is going to take time to resolve.
The San Francisco Bay Area presents a similar story, though its geographic spread across multiple submarkets — and the crossover with Silicon Valley’s technology sector — adds complexity (on the bright side, the AI boom has revived San Francisco Bay Area office leasing). San Diego, the third major hub, operates as a two-speed market: a core that has maintained sub-10 percent vacancy alongside an outer ring where rates have spiked sharply.
The silver lining for portfolio managers with assets in secondary and tertiary markets is interesting. Markets that did not attract the same wave of speculative capital find themselves in comparatively healthy supply-demand balance. In Raleigh-Durham, construction halted just as overbuilding took hold — partly by design, partly by virtue of being a smaller-scale market. Since that freeze, significant amounts of that spec-built space have been absorbed. (This accounts for the vacancy difference between 30 percent and low 23.5 percent when you include markets beyond Boston, the San Francisco Bay Area and San Diego.) A range of regional clusters find themselves with less egregious vacancy levels, precisely because they were not the Goliath-sized stars of the speculative boom. That said, there is a real tension worth flagging for smaller markets. Available product is essential to generating the initial prospect look. Even when a company ultimately moves forward with a ground-up development, they typically need to tour a handful of existing spaces first — it helps crystallize their program and builds familiarity with the region. If ready-to-go inventory gets absorbed and nothing new is built, a market risks becoming less visible at that critical early stage of site selection. It is never a perfect balance. The trick is knowing which imbalance you have and planning accordingly.
The Selective Recovery: Where Capital Is Actually Going
Precision matters when describing what “recovery” actually means right now, because it is not a broad-based rebound. In 2025, approximately eight percent of funding rounds were mega-rounds exceeding $100 million — yet those rounds represented roughly 50 percent of all venture dollars deployed. About 60 percent of U.S. biotech venture capital is flowing into two geographies: Greater Boston and the San Francisco Bay Area. Overall deal volume has retreated to levels last seen around 2015, a full decade before the bubble.
The companies most likely to require significant real estate — new laboratory buildouts, manufacturing facilities, regional R&D campuses — are, for the most part, already well-funded, established organizations. Smaller emerging companies are either operating lean or struggling to access capital. Investors who absorbed losses in the 2020–2022 cycle, and who are still contending with meaningfully higher interest rates than the pre-2022 era, have become what might be called asset-centric: gravitating toward single-focus companies with clean, comprehensible pipelines, smaller teams and clearer M&A optionality.
A single-asset company is simpler to fund, faster to evaluate and easier for a large pharma acquirer to absorb cleanly. That is the profile attracting capital right now — and it has real estate consequences. Lean, focused businesses need less space and can often gravitate toward shorter-term leases. The era of large, long-term speculative lab commitments from early-stage tenants is unlikely to return in the near term.
Three Forces Reshaping Demand: Patents, GLP-1 Maturation, and AI
Despite the challenging near-term supply picture, three structural forces are creating genuine, durable demand — while also reshaping what that demand looks like physically and geographically.
The first is loss of exclusivity, or LOE — the patent cliff. Large pharmaceutical companies have spent the past decade largely outsourcing their internal R&D, relying on licensing deals, partnerships and acquisitions to replenish pipelines as blockbuster drugs lose patent protection. The volume of LOE events coming over the next several years creates structural urgency that will not abate. A typical pharma business development team evaluates a thousand small companies to close deals with a handful, hoping one produces a new name-brand therapeutic that justifies the cycle. This drives sustained demand from well-funded pharma and biotech M&A targets and from the dealmaking infrastructure those transactions require.
The GLP-1 sector — which two years ago operated on a “slap that label on anything and it gets funded” basis — has matured into something more nuanced and, arguably, more sustainable. The market has moved well beyond the original obesity framing toward addiction, central nervous system indications, inflammation and new delivery modalities, including oral formulations. The easy wins are gone. Companies competing in the crowded core GLP-1 space now must genuinely differentiate: unlock a new indication, reach previously untreatable patients, or shift the care setting in a meaningful way. Even the largest players have felt the pressure — the dynamics between the major incumbents have made clear that even in a massive market, proximity to the category leader is no longer a viable strategy. GLP1-related development activity remains significant but increasingly favors specialized, focused operators.
The third force — AI-driven drug discovery, or computational biology — may be the most consequential long-term factor reshaping life science real estate. The applications cluster into four areas: AI-assisted drug discovery, which accelerates the identification and optimization of therapeutic molecules; insight platforms and infrastructure, which build the computational foundation for biological understanding; AI diagnostics, which accelerates disease detection and monitoring; and clinical response prediction, which uses computational models to project patient outcomes at scale. What unites these is the potential to compress laboratory timelines and reduce the volume of wet lab work required in earlystage discovery.
23.5 percent
that’s the national vacancy rate for life science real estate across the United States
percent
that’s the vacancy level in major hubs like Boston, the Bay Area, and San Diego
It is too early to draw hard conclusions, and intellectual honesty requires acknowledging that. But early signals are worth watching. The proportion of R&D company footprints allocated to laboratory space — which climbed above 60 to 70 percent during the peak cycle — appears to be retreating toward the traditional 50/50 office-lab split, or below it in some cases. Whether AI is the primary driver is unclear, but the directional shift is real. If computational tools meaningfully reduce bench time requirements over the coming decade, the demand profile for life science real estate could shift in ways that affect both total square footage and the lab-to-office ratios that landlords have been building to. This is not an imminent disruption — but it is something to track now, not later. Separate but related, exponentially advancing AI capabilities will also radically change the landscape of non-bench talent (and thus office space needed) — scientific writing for INDs, clinical trial protocol writing and management, scientific study report creation, etc., may need significantly reduced numbers of humans.
The China Factor: More Complicated Than the Headlines Suggest
The standard narrative — China as pure competitive threat, reshoring as the solution — is incomplete in ways that can lead to poor decisions. China’s life science presence is not going away. The country now accounts for approximately 30 percent of global clinical trial starts, has representation in over 40 percent of the top 50 R&D pipelines globally, and is party to roughly one-third of all life science licensing deals by value. The labor and facility cost advantage is extraordinary.
A recent firsthand experience illustrates the scale of that disparity. Working with a top Chinese CDMO that was seriously evaluating a U.S. brick-and-mortar operation, the numbers told a stark story: all-in costs — operational labor, facility expenses, the full picture — would run approximately 10 percent in China of what the same operation would cost in Raleigh-Durham, which is itself far from the most expensive U.S. market. The company ultimately passed on the U.S. location, and the debrief left no ambiguity about why.
T hat cost reality has direct implications for the “reshoring” conversation. Domestic manufacturing of some active pharmaceutical ingredients for patentprotected, high-value therapeutics is economically viable and is happening. But commodity API production cannot be competitively manufactured in the U.S. at the scale the drug substances are being used — the U.S. will not eliminate imported API anytime soon. Domestically manufactured demand is real, but it is concentrated in specialized, high-margin production, not broad-based pharmaceutical reshoring. Site selectors and portfolio managers should calibrate expectations accordingly.
The more actionable insight is that well-capitalized Chinese life science companies are actively seeking U.S. market access. Several major CDMOs and research organizations are evaluating U.S. real estate right now, looking for domestic footholds for regulatory, partnership and commercial purposes. China will be an important contributor to the world’s therapeutic technologies that ultimately the U.S. market will want access to. The U.S. will need to find ways to both compete and collaborate with China. Economic development organizations and
Continued on page 76
Source: Lightcast 2026.1 dataset – 2025 Estimates. Broward County
Lupin Announces Plans for a New Pharmaceutical Facility to Be Constructed in Coral Springs, Advancing Florida Employment Opportunities and U.S. Medicine Security
Global pharmaceutical leader Lupin announced a new pharmaceutical manufacturing plant in Coral Springs, a significant step in safeguarding the health and safety of Florida families and the nation.
With a projected cumulative investment of $250 million, including R&D, infrastructure and capital expenditures over a five-year period, the new site will have the capacity to accommodate the production of more than 25 critical respiratory medicines, including lifesaving albuterol inhalers.
By strengthening domestic manufacturing and enhancing supply chain diversification, this critical project will enhance medicine security and generate over 200 new longterm, skilled jobs by 2030 in Greater Fort Lauderdale/Broward County.
Learn more at LessTaxing.com
IN MONTGOMERY COUNTY, MARYLAND, COMPANIES ARE SHAPING THE NEXT GENERATION OF DISCOVERIES
Home to one of the nation’s largest biopharma clusters, Montgomery County is positioning itself for the next era of life sciences innovation
By Montgomery County Economic Development Corporation
Minutes from Washington, D.C., Montgomery County, Maryland is home to a thriving life sciences industry. Often considered the backbone of Montgomery County’s innovation economy, it is not a coincidence that the County anchors the third-largest biopharma hub in the nation and is the birthplace of the Human Genome Project—one of the most influential scientific endeavors in history. The County’s close proximity to 18 federal agencies and 36 federal labs, including the National Institutes of Health (NIH), National Institute of Standards & Technology (NIST), the Food and Drug Administration (FDA), top-tier higher education institutions, and a highly educated and diverse workforce, creates an environment where global corporations and emerging startups specializing in gene and cell therapies, vaccines, pharmaceuticals, manufacturing, and more, can easily attract and retain top talent.
Montgomery County is home to more than 350 life sciences companies doing ground-breaking work, including global leaders like AstraZeneca, Novavax, and United Therapeutics, as well as smaller, innovative start-ups and growth-stage companies like PMCDx and PediaMetrix, creating a unique environment where emerging companies can scale quickly while benefiting from established expertise and infrastructure.
Life sciences companies located in Montgomery County also benefit from the County’s vast technology business ecosystem. Montgomery County’s business community includes companies leading the way in quantum, AI/VR, advanced manufacturing, aerospace capabilities, cybersecurity, biotech, cleantech, medtech, robotics, CHIPS and advanced satellite and communications, that are accelerating the County’s position as a destination where companies at the intersection of life sciences and technology thrive.
The County’s I-270 Technology corridor provides continuous connectivity among innovative clusters of labs, headquarters, and ready-to-develop sites from north to south of the County, including Germantown,
A look at
Gaithersburg, and Rockville, which rank as three of the most ethnically diverse cities in the United States. The County’s Viva White Oak site, which also boasts the County’s first use of a Tax Increment Financing proposal, features 280 acres of mixeddevelopment and is expected to anchor additional life sciences companies, further expanding the local ecosystem. The former home to the COMSAT research facility, a 204-acre site in Germantown, is also available for development.
Specialized Talent Fueling Innovation
Montgomery County also has one of the most educated workforces in the nation, with 33 percent of adults aged 25 and older holding an advanced degree, which helps fuel the life sciences and technology ecosystems.
This deep talent pool is supported by a robust pipeline of educational and training programs. The Universities at Shady Grove—ranked among the top 20 public universities in the country—and Montgomery College, the number one community college in Maryland, play critical roles in workforce development, ensuring that students graduate prepared to join high-growth industries.
Together, these institutions help position Montgomery County as a thriving center for research, growth, and innovation. Initiatives like BioHub Maryland provide hands-on experience in biomanufacturing and research, ensuring
that companies have access to skilled workers at every level.
A Connected System of Partnerships
The well-established infrastructure and ecosystem in the County includes partnerships between local government, public-private partnerships, academic institutions, and industry organizations working together to support companies in all stages of growth. Here, entrepreneurs building the future find support through partners like the University of Maryland Institute of Health Computing, which brings together world-class researchers from the University System of Maryland’s partner institutions prominent in artificial intelligence, machine learning and the virtual/augmented reality fields with researchers and clinicians.
Recent investments, such as the launch of new biotech innovation labs in partnership with the Henry M. Jackson Foundation, are also expanding access to lab space and resources for startups developing cutting-edge technologies.
Turning Ideas into Reality
From vaccine development to advanced therapeutics and next-generation biotech, companies in Montgomery County are helping shape the future of life sciences. From high-end lab space and development-ready sites to workforce programs and public-private partnerships designed to help companies grow and thrive, Montgomery County provides the environment companies need to turn bold ideas into reality. Visit thinkmoco.com.
This article was written by Montgomery County Economic Development Corporation approved by Area Development Magazine.
the United Therapeutics Corporation campus in Downtown Silver Spring.
percent
That’s the share of U.S. biotech venture capital flowing into just Boston and the Bay Area
The pattern of expansion, overheated peak and uneven correction is familiar — but the scale of this cycle is different.
Continued from page 72
corporate real estate teams should be prepared to engage seriously with inbound interest.
Strategic Implications: What to Do Right Now
Several practical principles emerge for site selectors and portfolio managers navigating this environment.
Know your market’s actual strengths — not the aspirational version. The impulse to position every emerging market as a future Boston is understandable but often counterproductive. The more useful question is what specific research capabilities, university assets or talent pipelines actually exist in a region — and which life science companies would genuinely benefit from proximity to those assets. Building direct, ongoing relationships with technology transfer offices and active university researchers is essential. These people are not thinking about economic development; their world is their science. The economic development professional has to be the translator — building a working database of institutional strengths and identifying companies in relevant fields that might benefit from being nearby.
Expand the definition of the ecosystem. An AIenabled life science company may need nothing more than high-quality office space and proximity to computational talent. It is not a traditional lab tenant, but it is increasingly essential to the drug discovery pipeline. Life science campuses and parks that can accommodate both wet lab occupiers and data science-oriented companies will be better positioned to attract the full range of relevant tenants. The convergence between life science and technology is real, and being fluent in both the traditional life science pitch and the tech pitch is becoming a competitive differentiator.
Rethink the incentive toolkit. In markets where landlords are already offering substantial concessions to fill vacant lab space, cash incentives from economic development organizations may be partially duplicative. The more strategic approach is to preserve that financial capacity for situations where it is genuinely decisive, and invest instead in non-cash value drivers: streamlined permitting, clear regulatory pathways, pre-negotiated utility agreements and well-documented site readiness packages. Speed and process clarity have real monetary value to life science companies navigating internal approval processes that are often staggeringly complex. Demonstrating the ability to move fast — without bureaucratic friction — is worth more than many organizations realize, and it costs comparatively little to deliver.
For corporate real estate managers, the parallel question is whether portfolio positions reflect where life science activity is actually concentrating today, rather than where it peaked several years ago. Secondary markets with healthy supply-demand balance, supportive research infrastructure and competitive cost structures deserve fresh evaluation. Positions in oversupplied primary markets should be assessed against realistic absorption timelines.
Finally, act as an ecosystem steward, not merely a transaction facilitator. Life science cluster development is a multidecade commitment requiring the sustained coordination of universities, hospitals, developers, utilities and corporate partners. RTP is a useful model — but it did not happen overnight, and it required deliberate, durable governance structures. The clearest competitive advantage a market can offer sophisticated occupiers — who arrive with plenty of internal complexity of their own — is simplicity and clarity on the outside. Clean governance, transparent processes and well-connected local liaisons reduce friction at exactly the moments when it matters most.
The Road Ahead
T he life science real estate market of 2026 is neither the euphoric expansion of 2021 nor a sector in collapse. It is in a genuine reset — working through a supply overhang while the underlying scientific and commercial drivers remain intact. The patent cliff will sustain pharma acquisition activity for years. AI will continue reshaping the discovery process and, with it, the physical requirements of R&D. Capital will flow, but toward companies with clear differentiation and manageable complexity.
The organizations that emerge strongest from this period will be those that used the correction wisely: deepening market intelligence, sharpening positioning around specific research niches, and building the governance and stakeholder relationships that make them credible partners for sophisticated occupiers. The pendulum has swung. Knowing where it is heading — and being positioned accordingly — is the work of the present moment.
Cushman & Wakefield Vice Chair Deb Boucher leads a specialty practice group of local and national experts dedicated to all aspects of science and technology real estate. She is especially experienced advising users of technically complex, highly improved spaces as they navigate layered occupancy and exit strategies, spanning multiple markets throughout North America and the world.
The Missing Middle In Life Science Incentives
Pre-commercial Life Science companies aren’t getting the right incentives and that’s going to impact how the clusters of the future do or don’t set up.
By Brooklin Salemi Senior Managing Director, Newmark
early every state in the United States now recognizes life sciences as a key targeted industry for economic development purposes. It’s reflected in state and local targeted industry studies, strategic plans, workforce training initiatives, and incentive policy. The playbook often looks familiar: recruit a marquee life science manufacturing company, assemble an attractive incentive offer and market the win as proof of a growing cluster.
While this approach may offer short-term visibility, it overlooks a fundamental reality that puts states and regions at risk of building clusters that may lack long-term resilience and sustainability. The companies that will ultimately define the next generation of emerging life science hubs are rarely the ones that qualify for incentives. They are pre-commercial, sometimes capital-intensive and always scientifically ambitious — and they frequently fall outside
the design of most state and local incentive programs. This mismatch represents the “missing middle” of modern life science cluster strategy. Pre-commercial life science companies — including clinical-stage biotech firms, cell and gene therapy platforms and AI-driven drug discovery ventures — are not peripheral actors in regional economies. They are often the origin point of innovation ecosystems. These companies generate intellectual property, attract specialized talent, and catalyze the investment flows that ultimately lead to scaled companies, manufacturing facilities and long-term high-wage job creation. Yet despite their influence, they often slip through the cracks of current economic development incentive frameworks, a challenge that is common among nearly all states. The disconnect is two-fold: minimum eligibility requirements and how success is measured. Most incentive programs are built around employment thresholds, with many requiring at least 50 new jobs within a two-year period, wage requirements and capital investment minimums These metrics are well suited for large, revenue-generating companies with more predictable growth trajectories, but less so for pre-commercial life science companies that may employ small, highly specialized teams while
advancing high-value technologies. Meanwhile, the reality is a 25-person gene therapy company developing a breakthrough platform may have far greater long-term economic impact than a 250-person manufacturing operation, yet the latter is far more likely to qualify for meaningful state or local support. This is not just a technical oversight; it’s a gap in modern economic development strategy with real consequences for how and where life science clusters may form.
The Reality of Pre-Commercial Life Science Companies
Pre-commercial life science companies operate on fundamentally different timelines and generate different outcomes than the incentive programs designed to attract them. Their growth is tied to milestones, clinical progress, regulatory approvals and funding rounds. They often create a smaller number of new high-paying jobs, in the range of 10 to 35-plus over a one- or two-year period, making most discretionary incentive programs inaccessible. They may also generate little taxable income in their early years, rendering nonrefundable tax credits ineffective, and reimbursement-based incentives require
that’s the minimum number of new jobs many incentive programs require within two years.
upfront capital that early-stage companies are actively trying to conserve.
Compounding this challenge is the inherent risk aversion within public policy. Economic development organizations are understandably accountable for the stewardship of public funds, which leads to a preference for projects that can demonstrate near-term returns on investment. Pre-commercial life science companies, by contrast, embody uncertainty. Scientific risk, regulatory hurdles and long commercialization timelines make them difficult to underwrite using traditional incentive models. The result is a system that systematically favors later-stage companies — often at the expense of earlystage firms that will seed future growth. Yet if the goal is to build a durable, innovation-driven cluster, precommercial companies are indispensable. Their impact extends far beyond their initial footprint. They act as powerful magnets for highly specialized talent, primary drivers of capital inflows, provide external validation and generate ecosystem spillovers that are difficult to replicate through recruitment alone.
Incentive Policy Adaptation
So, what would adaptation of existing incentive policy look like? At a minimum, it would require reducing minimum eligibility requirements to qualify, particularly those tied to new job creation, and designing benefits that align more closely with company needs.
This could take several forms. States and localities could create carveouts that allow pre-commercial life science companies to access otherwise nonmonetizable benefits, or they could introduce new benefits tailored to early-stage growth. These might include subsidized wet labs and research space, FDA user-fee credits, extension of net operating losses, deductions for qualified orphan drug expenses or sales and use tax exemptions for certain property.
Conversely, more material changes include a shift in how success is measured and risk is evaluated. Innovation metrics, such as intellectual property generation, clinical trial activity, capital raised and strategic partnerships, generally offer a more accurate reflection of early-stage economic impact than job counts and capital investment alone. Incentive structures that recognize these indicators and align public support with the realities of scientific advancement will have the greatest impact and success in supporting early-stage companies. Accommodating these dynamics is, in part, what has allowed leading life science hubs to evolve into self-sustaining, innovationdriven markets.
As new incentive programs and benefits evolve, policymakers should avoid including nuances that fundamentally change their value proposition. Incentives that require companies to exchange equity stakes, intellectual property rights, research outputs or similar strategic assets are not support, nor are they acting in good faith by burying these terms in incentive agreements or lease language.
Implications for Pre-Commercial Life Science Companies Making Location Decisions
For pre-commercial life science companies deciding where to locate or expand, it is clear that most incentive programs were not built with their operating model in mind. But that does not mean the framework has nothing to offer. In some cases, states and local communities are using their discretion to make exceptions for early-stage life science companies that may otherwise struggle to qualify. In others, state-specific tax structures may provide an indirect path to monetization that can be leveraged. Ultimately, opportunities must be closely evaluated before they are disregarded.
Where Early-Stage Life Sciences Companies Get Stuck Scaling Their Real Estate—and How to Move Forward
Biotech firms face delays in programming, permitting, and infrastructure as they scale from lab to production
By David Klein Managing Partner, and Elijah Hodges, Associate, for Lee & Associates, San Francisco
The life sciences sector operates by a different set of rules than traditional commercial real estate. While general-use office buildings can accommodate a range of industries with modest modifications, life sciences facilities are highly specialized, requiring unique utilities, storage, structural specifications, and tailored layouts based on the tenant’s scientific focus, from wet and dry labs to clean rooms and biomanufacturing. This complexity becomes most evident as companies transition from early-stage research and development (R&D) to commercialization, especially biomanufacturing. For emerging firms, the move from lab to production is not just a real estate decision — it’s a defining operational inflection point and increasingly where many encounter friction and delays.
A Market in Transition and Well Positioned for Tenants
After a decade-long demand boom beginning in the early 2010s, the life sciences real estate market entered a more challenging phase. Development pipelines were disrupted by the pandemic, tighter capital, reduced funding, and a slowdown in IPO activity.
The result is elevated vacancy, reaching as high as 40 percent to 50 percent in some submarkets, including Northern California’s life sciences node centered on South San Francisco, and a clear shift toward a tenant-favorable environment. For early-stage biomanufacturing companies, this presents a rare window of opportunity. Landlords are more aggressive, competition is increasing, and occupiers are leveraging conditions to renegotiate their leases or relocate. At the same time, consolidation through mergers, closures, and acquisitions continues to reshape the landscape, triggering rapid expansion or vacancy shifts and increasing the importance of proactive real estate strategy.
Where the Process Breaks Down
Despite favorable conditions, many early-stage companies
struggle in the transition from R&D to commercialization to production. Friction typically arises in the programming and funding stage, well before a lease is signed, or during plan execution.
The most common issue is inadequate upfront programming. In a company’s speed to market, executives often underestimate the time, cost, and complexity required to define operational needs. For a 10,000- to 50,000-squarefoot biomanufacturing facility, this phase alone can take one to two years. Without that clarity, site selection becomes reactive rather than proactive.
Permitting is another bottleneck. Many properties lack the appropriate entitlement approvals for scaled life sciences work, especially biomanufacturing. Retrofitting entitlements onto existing facilities to loosen production caps, operating times, material handling, ingress and egress, and conditional-use permits requiring public hearings can delay projects significantly. In some cases, companies secure space before completing sufficient diligence, only to find regulations restrict future expansion.
Infrastructure constraints also play a growing role, particularly power availability. In some markets, limited electrical capacity can delay occupancy by up to two years if upgrades are required, posing serious risks for companies operating on tight funding and production timelines.
How to Avoid Missteps
A recurring theme among early-stage firms is the tendency to deprioritize real estate strategy and accept convenient, though more costly, solutions. Engaging specialized resources early in the planning stage can properly align real estate with a company’s growth trajectory. This requires the early onboarding of subject matter experts with experience in government relations, design and construction, site selection, resource availability, economic concessions, and more.
Another frequent misstep is overreliance on incubator space. While the best incubators offer space flexibility, ready access to shared infrastructure, and strong manage-
ment, companies often stay longer than prudent because it is perceived as easier than relocating. Consequently, this approach can constrain growth, create challenges associated with sharing space with co-tenants, and, most importantly, drive a steep increase in unit costs compared to a standalone facility.
Scaling into dedicated space requires calculated risk and ongoing sensitivity analysis across both quantitative and qualitative factors. Companies that succeed plan far ahead, commit to a defined program, and secure space aligned with long-term objectives, not just immediate needs.
A Shifting Geographic Landscape
Location strategy is also evolving. Traditional hubs like Boston and the San Francisco Bay Area remain dominant, but as these mature markets grapple with land constraints, high costs, taxes, strict environmental regulations, and other limitations, biomanufacturing is pushing further into emerging markets.
Secondary locations, including Texas and North Carolina, are gaining traction because of lower costs, available land, government subsidies, and strong academic ecosystems. The Texas Medical Center-anchored life sciences cluster in Houston has emerged as a national contender,
while areas such as Vacaville, Fremont, and Pleasanton near South San Francisco have attracted larger-scale biomanufacturing operations.
That said, location decisions remain highly dependent on programmatic needs, including access to specialized labor, proximity to research clusters, aligned government support, vendors, industry cohorts, and academic centers.
Aligning Real Estate With the Business
U ltimately, the transition from R&D to commercialization to production represents a series of strategic milestones requiring alignment between land, labor, resources, capital, and growth potential. Companies that navigate the process successfully treat real estate as a core component of their business strategy, investing early to define requirements, understand constraints, and structure for flexibility and scale.
Resources available to emerging life sciences companies include LabSpaceDirectory.com, Biscred’s Life Sciences Guide, and regional organizations like BioNJ and Life Sciences Pennsylvania.
In today’s market, the opportunity is there, but realizing it requires discipline, foresight, and informed decisionmaking before urgency dictates the process.
How Tariffs Are Rewiring Logistics
Industrial real estate is entering a new phase as policy, slowing e-commerce growth, and changing trade routes reshape where demand is strongest — and where vacancy is rising fastest
By Ermengarde Jabir, PhD, Director of Economic Research, Moody’s
Over a year on from “Liberation Day,” trading partners and trade routes have changed, propelled by a shift by firms toward importing from countries with more favorable tariff terms. While the effects have not been immediate on industrial commercial real estate, they are starting to cycle through, proving to be a major impediment to the property type reaching a stable growth path. Rather, performance metrics for the sector have decelerated significantly, although the blame cannot be placed squarely on trade policy alone. The unfortunate timing of trade policy uncertainty since the start of 2025 has coincided with a slowing sector where demand growth began a period of natural normalization following exuberant expansion within the sector, both in terms of vigorous supply growth and enthusiastic space uptake in the early 2020s. Previously sustained by strong e-commerce growth and investments in domestic manufacturing, industrial performance is now strained as these drivers have slowed significantly amid concerns over macroeconomic uncertainty, including employment and trade policy.
Languid demand growth related to consumer spending on goods stemming from job market uncertainty and headwinds related to broader trade policy have finally caught up to the prop-
erty type across subsectors. Effective rents slid in the first quarter of this year, albeit negligibly. This is notable because it is the first quarter since the third quarter of 2011 that rents have declined over a nearly 15-year span.
Omnichannel spending, which links brick-and-mortar retail with distribution and warehousing industrial, is sputtering as the growth rate of the e-commerce share of total retail sales plateaus. The figure reached 16.4 percent at the end of 2025, only up from 16.1 percent at the end of 2024. Thus, languid growth for this figure is proving a tailwind for retail as consumers continue to spend in-store. For context, the figure during the first quarter of 2020 stood at 11.9 percent, the highest reading until that point. While the level is robust, headwinds persist. The growth rate of the e-commerce share of retail sales has decelerated abruptly, with only a three-tenths percentage-point increase year over year between 2024 and 2025. Stagnation in e-commerce retail growth, a major tailwind for industrial property demand, spells performance inertia for warehouse/distribution and flex properties reliant on expanding demand for faster and more localized distribution channels.
Mild growth in total retail spending is underscored by generally sluggish consumer sentiment. The University of Michigan’s Consumer
Sentiment Index declined in April, reaching a record low of 49.8, revised upward from the 47.6 preliminary figure for the month. The previous record-low index reading of 50.0 was achieved in June 2022. For historical context, during the depths of the Global Financial Crisis in November 2008, the index only dipped to 55.3. The index has fallen sharply over the past year and a half, down approximately 24 index points since the end of 2024. Over the five-year period from April 2021 to April 2026, the index is down nearly 40 points.
The index has generally trended downward over the past two years, as listless job growth and, more recently, concerns regarding trade policy and rising consumer prices have weighed on it. Additionally, the period of stubbornly high inflation that cut into household discretionary incomes has restrained consumer spending on many nonessential goods, with seemingly no reprieve in sight as monthly inflation measures hover near or above 3 percent amid elevated oil prices. Consumers and businesses alike are facing higher energy prices because of the conflict in the Middle East, both at the pump, which makes consumers think
twice before driving to stores to purchase nonessential goods, and because of the pass-through effects that higher oil prices have on goods transportation.
of 2025
Trade inflows from high-tariff countries, such as China, have lessened while increasing from countries with more favorable terms, such as Mexico, shifting logistics networks. Thus, performance varies geographically, with port cities on the West Coast weakening as markets along the Northern and Southern borders, with land-route access to Canada and Mexico, exhibit greater resilience. The Northern border exhibits this quite clearly. Milwaukee, whose warehouse/distribution inventory has increased by a notable 3.7 percent from the first quarter of 2025 to the first quarter of 2026, has seen its vacancy rate decline by 100 basis points over the same period. Detroit, a far more mature market relating to goods trade with Canada given it sits right on the border across the river from Windsor, Ontario, experienced outcomes similar in directionality but less extreme in magnitude, with inventory growth of 0.3 percent year over year
and a decline of 10 basis points in the vacancy rate. Rochester and Syracuse, meanwhile, although still in upstate New York, do not have proximate land routes for trade, and neither experienced increases in supply during the period and saw vacancy rates rise by 20 and 50 basis points, impacted by broader conditions generating a slowdown in the industrial sector. Buffalo is an anomaly and highlights just how locationally idiosyncratic performance for the warehouse/distribution subsector has become. Though directly on the border with Canada, separated only by the Niagara River, Buffalo experienced no supply growth, and its vacancy rate rose by 10 basis points.
Concurrently, West Coast markets are facing high vacancy growth, dually plagued by high inventory growth and a reduction in goods imported from key export markets across the Pacific Ocean, such as Orange County and San Bernardino/Riverside. In the San Francisco Bay Area, even without inventory expansion, markets such as Vallejo-Fairfield are experiencing steep increases in vacancy rates. At the Southern border, however, El Paso, along with smaller yet still key warehouse/distribution markets for international trade, including Brownsville, Laredo and McAllen,
are experiencing more modest vacancy increases despite outsized inventory growth.
Despite the property type’s positive long-term prospects based on the projected growth of demand drivers, in the short run, the sector continues to underperform compared with its expected equilibrium, as softening growth for the e-commerce demand driver is a point to keep under consideration. On the other hand, domestic manufacturing incentives are expected to sustain industrial property activity. The construction pipeline indicates that the number of projects expected to be completed in 2026 is much lower than in previous years, with only approximately 80 million square feet expected to be delivered.
Nonetheless, stabilizing demand indicates that the vacancy rate will drop slightly to 7.8 percent by the end of 2026, while asking and effective rent growth will pick up to about 2 percent for the year. Following previously exponential growth in the early 2020s, performance has cooled over the past two years, with a notable increase in the vacancy rate driven by the volume of new supply at a time when demand deterioration has prevailed, unable to escape the downward pressure all CRE is facing.
SMALL TOWN SPIRIT.
GLOBAL INDUSTRIAL POWERHOUSE.
There’s a reason the world’s most innovative companies are choosing Clarksville-Montgomery County, Tennessee. It’s not just our strategic location, it’s our proven ability to deliver on the most ambitious projects in the nation. Congratulations to Korea Zinc on receiving the Project of the Year Award.
Executive
Defense Spending Surge Is Reshaping U.S. Industrial Investment
Aerospace, maritime, and infrastructure projects abound
By Geoffrey J. Troan, Senior Managing Director, Vista Site Selection
While commercial and foreign direct investment has cooled considerably heading into 2026, one sector of the U.S. economy is experiencing a renaissance unlike anything seen in decades: defense aerospace. For site selectors and industrial developers paying attention, the implications are profound — and the window for smart positioning is now.
A Changing Investment Landscape
On the commercial side, the story is one of caution. Foreign direct investment outside of defense-related activity has slowed markedly, with international firms deterred by shifting U.S. policy and the kind of tariff unpredictability that makes it difficult to build a business model that will survive a boardroom. The reality is straightforward: if tariffs are to be used as a policy tool, stability is essential. Uncertainty, by contrast, freezes capital.
Domestically, higher interest rates — a world away from the near-zero cost of money during the Obama era — have tightened the filter on which projects move forward. That’s not entirely a bad thing. Higher borrowing costs force better project screening, weeding out marginal ventures and focusing capital on genuinely viable opportunities.
Defense: From $500 Billion to $1.5 Trillion
The contrast with the defense sector could not be sharper. When Obama-era budgets hovered around $500 billion per year for defense and NASA combined, the trajectory was modest. Today, the defense budget has nearly doubled to just under $1.0 trillion, with
the executive office requesting $1.5 trillion for the current fiscal period. Layer on top of that an additional $150 billion in supplemental legislation, and the pending Ships Act — which would offer a 25% federal tax credit for shipyard investments and a 33% credit for building U.S.-flagged commercial vessels — and you have a capital formation environment without modern precedent.
The Maritime Opportunity
Nowhere is this more visible than in maritime. The U.S. Navy is undertaking a sweeping recapitalization: replacing the entire Ohio-class ballistic missile submarine fleet with Columbia-class boats, sharply expanding Virginia-class attack submarine production, and adding new missile destroyers, frigates, and the proposed Trump-class battleship. The goal is to grow the fleet from roughly 300 ships to 350 or more — enough to address a Pacific threat while maintaining an Atlantic deterrent.
This naval buildup is catalyzing a broader rebirth of U.S. commercial shipbuilding. The country’s largest shipyards — historically military yards that took on commercial work to fill capacity gaps — are now positioned to anchor an entirely new commercial shipping industry. The recently completed shiplift-based shipyard in Jacksonville, Florida, is one example; at least two additional Florida facilities are in the approval process. And the growth is not limited to coastal yards. Significant shipbuilding activity continues along the Great Lakes and inland river systems — a reminder that, as the industry says, it’s the systems inside the ship, not just the hull, that represent the bulk of the investment.
Air, Ground, and the New Drone Frontier
The aerospace story extends well beyond the waterline. The Air Force is extending the service lives of legacy platforms — F-18s, B-52s, C-130s — while simultaneously accepting steady deliveries of new F-35s and F-16s from Lockheed Martin and advancing Boeing’s next-generation F-47. Capacity at the three Air Logistics Centers (Tinker, Hill, and Warner Robins) is already strained, forcing more maintenance work into the private contracting community — creating durable demand for qualified MRO vendors.
On the ground, Army contractors are being asked to double and triple weapons system production within two to three years to replenish depleted stockpiles. And across every domain, the Russo-Ukrainian conflict has validated an entirely new category: autonomous systems. Drone fighters, drone submarines capable of lying dormant for months, battlefield surveillance platforms — companies like Shield AI, Anduril, and Saronic are leading a new
generation of defense innovators who require more software talent than traditional capital investment.
Infrastructure Investment and State Incentives Align
For the first time in decades, the Pentagon appears committed to paying for the infrastructure upgrades the defense industrial base needs. Many facilities date to the World War II era and are at or beyond the end of their useful lives. The Defense Production Act Office has seen its budget bolstered, Initial Production Facilitation funds are embedded in major contract structures, and facility-specific grants are available at the federal level. Meanwhile, states and localities — well aware that aerospace jobs routinely pay in excess of $100,000 annually — are competing aggressively to attract and retain this workforce.
The international market adds another layer of demand. The demonstrated failure of Russian and Chinese military hardware in
Ukraine, Iran, and Venezuela has refocused allied nations on the value of American-built systems. Having the second-best military technology, as events have made clear, is not a strategic advantage — it is a liability. Despite some turbulence in F-35 international sales, global appetite for U.S. defense products remains strong.
The bottom line: every military contractor in this space is being pushed to expand production significantly — driving demand for new facilities, new tooling, and new talent pipelines. And history tells us that the technologies developed under these conditions rarely stay inside the fence line. Microwave ovens, cell phones, GPS, the internet itself — all are the commercialized descendants of military research. The next wave is already in motion
Geoffrey J. Troan is Senior Managing Director and Founder/Partner of Vista Site Selection, a data, analytics, and incentives firm focused on aerospace, and an ancillary company of Vorys, Sater, Seymour, and Pease, LLP.
The Infrastructure of Intelligence
Why the next economic map will be drawn in megawatts, not square feet
By Shannon Curley, Executive Managing Director, Business Consulting at JLL
We are in the middle of the largest infrastructure buildout of our lifetimes, and most people still think we’re talking about real estate.
We’re not.
The asset class the industry used to call a “data center” — the windowless shell, valued per square foot, tucked along a fiber route — is gone. What’s replacing it is energy infrastructure that happens to have a building on top of it.
That pivot, from real estate to energy, is the single most important thing site selectors, economic developers, and community leaders need to internalize right now. Because the next economic map isn’t going to be drawn in square feet. It’s going to be drawn in megawatts.
The Metric Has Flipped
For about fifteen years, this business was valued in dollars per square foot. You’d talk about the shell, the rack density, the fiber route, and the lease rate. Power was assumed. It was a line item on the utility bill.
That world is over.
Today the governing metric is dollars per megawatt. Power isn’t a line item anymore — it’s the entire pro forma. Every site tour I do now starts with a transmission map, not a plat.
We have moved, in about 24 months, from Office Parks to Industrial Power Campuses. A legacy colocation facility was 20 to 50 acres on a 138kV drop. A modern hyperscale campus is 500 to 1,000 acres at 345kV. The gigascale AI clusters now being scoped are 1,500 acres and up, a gigawatt-plus of demand, and 500kV service. This is heavy industry. It just doesn’t look like it.
The Math Nobody Wants to Look At
Here’s what’s actually driving all of this.
U.S. load growth forecasts nearly doubled between 2023 and 2024 — AI workloads, transportation electrification, and reshored manufacturing all landing on the grid at the same time. Meanwhile, about eleven gigawatts of firm, dispatchable generation retires every year, and most of what’s coming online to replace it is intermittent. Run the numbers. We’re shedding roughly 83 gigawatts of firm capacity this decade while adding close to 90 gigawatts of new load. To replace one gigawatt of dispatchable reliability with solar nameplate, you need four to five gigawatts of panels.
We are not building fast enough. A structural power shortage is expected to peak between 2028 and 2030, and that timeline isn’t hypothetical. It’s in the queue studies.
W hich means growth isn’t going where land is cheap. It’s going where firm power exists.
Where the Growth Is Actually Going
The legacy markets are effectively capped. Northern Virginia and Silicon Valley have run out of room on the grid. Dallas and Atlanta are tightening fast.
The runway is a corridor across the Midwest and South with diverse generation, transmission headroom at 345kV and above, and a willingness to plan.
Call it the Power Belt.
Behind-the-meter generation will keep solving today’s speedto-market problem, but it’s a bridge, not a destination. The longterm winners will invest in 345kV-and-above transmission corridors now, so when the temporary fixes hit their limits, a second wave of deployment has somewhere to land. Nuclear co-location, grid-enhancing technology that squeezes 30% more capacity from existing wires, and eventual small modular reactor integration will all find homes in the regions that did that groundwork.
These Are Not Bad Neighbors
I want to push back on something I hear in nearly every town hall.
The modern campus is one of the quietest industrial neighbors a community can attract. Closed-loop cooling uses less water in a year than an 18-hole golf course. Acoustic engineering keeps the property line under 55 decibels — quieter than the nearest highway. Traffic is a fraction of a logistics facility. No school-age children. Minimal sewer load. The campus typically pays for the substation that makes everyone else’s power more reliable.
The cost-of-community-services math is hard to argue with — about twenty cents of services for every dollar of revenue, versus more than a dollar for residential.
That’s the tax base of heavy industry with the traffic profile of a library.
The Right Historical Parallel
When I’m trying to help a community see where they sit in history, I don’t reach for the dot-com era. I reach for the railroad and the interstate.
In the 1860s, towns that secured a depot thrived. Towns bypassed by the rail became ghost towns. In the 1950s, the Federal Highway Act redrew the map around I-80 and I-95, and those decisions defined fifty years of winners and losers.
Fiber and firm power are the asphalt and steel of this cycle. A region without them will be flyover country in the intelligence economy, no matter how nice the downtown looks.
What to Actually Do
T he playbook isn’t complicated. It’s just rarely done in the right order.
First, identify. Map every 138kV-and-above line in the region. Overlay fiber. Catalog parcels above 500 acres. Know what you have before anyone asks.
Second, entitle. Build technology overlay districts. Pre-approve compatible uses. Get environmental studies done before the first site selector calls.
Stay in continuous conversation with your utility and transmission operator — not transactional, continuous. And lead the conversation with your residents. If you don’t, the loudest voice on social media will lead it for you.
The Window
The infrastructure of intelligence is being built right now. W hether any of it gets built in your region is a choice. A nd the window to make that choice is measured in months, not years .
Transparency Is A Competitive Advantage
Even well-positioned projects can falter when critical details emerge late
By Beth Buckner, Member, Taxation, Moore & Van Allen and Dianne Jones, Managing Director, Business and Economic Incentives, JLL
is a recognizable cadence to genuine partnership — quick responses, proactive updates, a willingness to engage — and companies and their consultants notice it immediately. Being transparent also naturally invites scrutiny of whether the other communities on the list are being equally forthcoming.
A community with real challenges that is visibly working to address them will often out-compete a community with fewer problems that is not engaged. Disclose with the intent to assist, and you become a partner rather than just a location on a shortlist.
The Fees Nobody Mentions Until It’s Too Late
Local fee structures are among the most common sources of latestage surprise, and they are often material to project budgets. They tend to be policies tucked inside ordinances or utility rate schedules that outside consultants may not think to ask about — but that you almost certainly know.
There is a moment in almost every economic development project that nobody wants to talk about: the moment when the celebration fades and reality sets in. The announcement has been made, the community is excited, and then something surfaces — a $250,000 tap fee, a privilege tax buried in a local ordinance, a road that cannot handle industrial truck traffic. By that point, the damage is done. Trust erodes. Companies question their decision. Relationships built over months of work begin to sour.
The antidote is straightforward: disclose. Early, fully, and with the intent to help solve problems rather than conceal them. As Kofi Annan observed, knowledge is power and information is liberating. The communities that consistently win projects — and keep companies satisfied long after the ribbon-cutting — have made transparency a discipline, not an afterthought.
Transparency as a Differentiator
W hen companies are evaluating multiple locations, local economic developers hold a genuine informational advantage. They know the quirks, the fees, the permitting timelines, and the infrastructure gaps that no outside research will uncover. The question is whether to deploy that knowledge proactively or wait and hope nothing inconvenient surfaces on its own.
The fear is that disclosure will knock a site off the list. In practice, the opposite tends to happen. When a community surfaces a known issue and comes prepared to help solve it, it demonstrates something more valuable than a perfect site: it shows what kind of partner that community will be over the long life of a project. There
Impact fees are a prime example. In Utah, for example, there is a mandatory building permit fee of 1 percent that applies in addition to often significant one-time impact fees authorized in some municipalities that, when combined, can exceed 1 percent of project new development costs — on a large project, these fees accumulates quickly. Privilege taxes layered on top of lease rates can shift the economics of an entire site comparison; in some Arizona municipalities a 7 percent privilege tax changes the monthly cost picture substantially. Tap fees can reach six figures when a tenant needs to upsize a water line. In one case, a company had modeled every line item carefully, assumed a water line upgrade would be minor, and was handed a $250,000 bill they had never anticipated. Electrical inspection fees in some states apply as a percentage of total infrastructure cost — which for a large manufacturing facility is enormous — and business license fees in states like South Carolina can cascade across multiple counties depending on where employees work and deliveries are made.
The solution is disclosure paired with a plan. In one state, we worked with a county that identified a significant electrical inspection fee on a large manufacturing project and proactively approved a project-specific cap — helpful to the budget and to the relationship in equal measure. In Utah, where an impact fee could not be waived, a deferral preserved cash flow during construction and early operations, when capital is most constrained. In South Carolina, a request for a partial impact fee waiver was granted because the community was committed to finding a path forward to win the project. The timing of disclosure matters as much as the disclosure itself: surface a fee early with a mitigation strategy already attached and the message is clear — you have already started working on it.
Know the Full Permitting Path
Economic developers who know only their local permitting process are operating with incomplete information. State-level approvals — environmental permits, DEQ sign-offs, Army Corps involvement on sites with wetlands — can add months to a schedule a company has already committed to. Not knowing those requirements does not make a community look cautious; it makes them look unprepared.
The communities that win on permitting have built relationships with state agencies before they need them. DEQ offices, environmental agencies, and Department of Transportation teams all conduct pre-submission meetings. They will tell you what they need before you submit, flag issues in advance, and help keep a project on track. Being able to walk a company through that process with confidence signals a great deal about how the rest of the project will be managed.
Site-specific environmental considerations deserve their own attention. In Florida, a species of skink can only be tested for dur-
ency still wins: a county that had not closed a sewer funding gap was honest with an incoming company about where things stood and asked them to join in advocating for a state allocation. They agreed. Sometimes the right answer is not “we’ve solved this,” but “we’ve started, and here is how we finish it together.”
Grant Mechanics: Details That Determine Outcomes
Infrastructure grants are powerful tools whose mechanics can create complications if not understood early. In many states, infrastructure funding flows only to the county, not the company, meaning the county must run a separate public bid process. If a company has already retained a contractor and included offsite improvements in that scope, unwinding the arrangement is time-consuming. Getting ahead of this — telling a company early that a particular grant requires a county-run bid so those items should stay out of their contractor scope — prevents a predictable problem.
Disclose with the intent to assist, and you become a partner rather than just a location on a shortlist
ing two windows each year — March through May, and October through December — using plywood planks laid across the site and checked weekly for footprints. Missing the window adds months. Every state has an equivalent: seasonal clearing restrictions, protected species surveys, coastal review layers. Companies arriving for the first time will not know to ask. Several states, including North Carolina, have formalized concierge permitting with a dedicated Department of Commerce liaison to DEQ for large projects. If your state offers something similar, make sure prospective companies know about it.
Infrastructure Gaps: Surface Them, Solve Them
As the inventory of ready industrial sites contracts, more projects are landing on rural parcels where real infrastructure gaps exist. Power may be miles away. Sewer needs extending. Roads are not built to industrial standards. None of these are automatic deal-killers — but they become deal-killers when they surface too late.
We worked on a rural county site where the sewer line was three miles away and the extension cost was $3.8 million. Under most circumstances, that conversation ends quickly. In this case, the county had already permitted and designed the extension and had $1 million committed toward it. We went to the Department of Commerce with one specific ask: close the $2.8 million gap, nothing else. The state delivered. The project will bring 217 jobs at a $68,000 average wage and $150 million in investment to a community that would have lost every bit of it without that preparation.
Road capacity is increasingly catching projects off guard as industrial development moves further from established highway corridors. DOT standards for industrial access roads are non-negotiable, and the cost of bringing a substandard road up to those standards falls to the company if the issue has not been addressed in advance. Getting to DOT early creates options that disappear once a project is underway. And when a gap cannot yet be fully solved, transpar-
Timing creates additional complexity. Infrastructure grants often require a local match tied to property tax incentives that do not generate revenue until a facility is on the tax rolls — potentially three or more years after the infrastructure is needed. Understanding this sequence early makes solutions possible: accelerated incentive payments, company-funded construction with county reimbursement, or bond structures that smooth the cash flow gap. One detail matters enormously: unless very carefully structured, reimbursements paid to a company in the form of a grant are taxable income; payments made directly to a contractor are not. Companies that do not know this can face unexpected tax liability.
Incentive compliance deserves equal candor. Some programs carry reporting requirements that exceed the realistic capacity of a lean operations team. Steering a company toward a simpler program they will actually receive serves everyone better than loading them with incentives they will never claim or potentially lose. As Benjamin Franklin put it, an investment in knowledge pays the best interest.
Setting the Standard
The communities that consistently win have internalized a simple discipline: surface everything, solve what you can, and be honest about what you are still working on. They know state permitting timelines, not just local ones. They have working relationships at DEQ, DOT, and Commerce. They have answers ready on fees and have started on infrastructure gaps before anyone arrives to ask.
This requires genuine work — building agency relationships before you need them, thinking through the full cost picture, and being willing to say “here is a challenge” in the same breath as “and here is what we are doing about it.” The reward is not just one project won. It is a compounding track record of trust, because the communities that are prepared to be real partners become, over time, the communities that everyone wants to work with.
Can AI Help This Supply Chain?
A technological revolution immediately tested by world events
By J.C. Renshaw, Head of Supply Chain Consulting – North America, Savills
Were’s a question worth pondering: if AI can reduce your supply chain forecasting errors by 20 to 50 percent, reduce inventory carrying costs by 35 percent, and cut lost sales from stockouts by 65 percent — what does that do to your facility footprint? Because that’s the question I think site selectors and corporate real estate executives need to start asking, and many of them aren’t asking it yet.
Those numbers aren’t projections. They’re what leading companies are already achieving with AI-enabled demand planning and inventory management systems, according to research from McKinsey, Gartner, and others. And when you stack them together, the implications for real estate are significant. A 35
percent reduction in inventory levels across a distribution network doesn’t just improve balance sheet efficiency — it changes how much space you need, where you need it, and how you think about lease commitments.
The global AI in supply chain market is currently on a trajectory to reach $41 billion by 2030, growing at nearly 40 percent annually. Gartner projects that 60 percent of supply chain planning will be powered by generative AI by 2027. PwC expects 90 percent of supply chains to be AI-augmented by 2030. These aren’t fringe predictions — they represent the emerging consensus among the researchers and practitioners who study this most closely. Machine learning isn’t just accelerating supply chain operations; it’s accelerat-
BUILT FOR BUSINESS. READY FOR WHAT’S NEXT.
Kentucky’s growth is built through disciplined planning and responsible investment.
At LG&E and KU, we carefully evaluate energy needs and plan infrastructure responsibly to support advanced manufacturing, data centers and emerging industries. With new generation and transmission investments moving forward, we’re building the capacity to power what’s next. In 2025, we supported 92 projects representing 4,500 jobs and $5.7 billion in investment — while maintaining safe, reliable and affordable service for all customers.
Learn why businesses choose LG&E and KU: lge-ku.com/economic-development
Supply Chains
ing the discovery process itself, compressing timelines that used to play out over years into months.
The most consequential near-term application, from a real estate standpoint, is inventory and production forecasting. Traditional forecasting models are built on historical patterns. They’re reasonably good in stable environments and fall apart in volatile ones — which is to say, they’ve been falling apart pretty consistently for the past five years. AI-driven models ingest a far wider range of inputs: real-time demand signals and customer/consumer behaviors, supplier lead times, geopolitical risk indicators, port throughput data, even weather patterns. They update continuously rather than in periodic planning cycles. And in an environment defined by disruption, that matters enormously.
For a site selector or corporate real estate executive, this translates into a practical planning challenge. The assumptions underlying a facility decision — how much space, what clear height, how many dock doors, what lease term makes sense — are increasingly being shaped by AI-enabled operational models that your clients may still be in the process of or contemplating adopting. If their AI implementation reduces required inventory by a third, the 500,000-square-foot distribution center you’re underwriting today may need to look different than it would have three years ago. That conversation is worth having proactively.
A Landscape of Compounding Disruption
Of course, AI doesn’t exist in a vacuum, and neither do the supply chains it’s being asked to optimize. The backdrop against which all of this is happening — tariffs, geopolitical risk, cost volatility, nearshoring pressure — is genuinely difficult to plan around, even with better tools. At Savills, a significant portion of what my team does is network optimization: helping companies figure out where their facilities should be, which markets they should serve, and how to balance proximity to suppliers against proximity to customers The math is always about transportation — minimize distance, maximize service levels, keep costs manageable. What’s changed is the volatility of the inputs and variables.
Consider what’s happened to container shipping rates on the China-to-U.S. West Coast corridor since 2020. A container that cost $3,000 to $4,000 to ship pre-pandemic spiked dramatically during COVID, crashed back down, then spiked again — driven by a sequence of disruptions that reads like a stress test: COVID closures, the Russian invasion of Ukraine, Panama Canal drought restrictions, Houthi attacks on Red Sea shipping, the Francis Scott Key Bridge collapse, a brief ILA strike, and then broad-based tariff announcements that froze orders almost overnight. Each of these events is visible as a distinct spike in the rate and volume data. Taken together, they illustrate something important: there is always something going on in supply chains that disrupts the flow of goods. The question is no longer whether disruption will happen, but how quickly your network can absorb it.
Import volatility at the top nine U.S. ports neared COVID-era highs in mid-2025 as tariff deadlines triggered a wave of frontloading, followed by a sharp pullback as orders were canceled. Vessel tracking data captured the dynamic vividly: immediately after broad-based tariffs were announced, ships clustered off the Chinese coast as importers froze purchases. Within about a month of the
policy being walked back, traffic patterns had largely normalized. The whipsaw is real, it’s measurable, and it’s exactly the kind of signal that AI-enabled forecasting and planning systems are designed to interpret faster than human planners can.
Port Volumes Tell a Resilience Story
W hat’s worth noting, amid all this volatility, is that aggregate port volumes have held up surprisingly well. Of the nine major U.S. ports tracked in our Savills research, most grew their year-to-date TEU volumes in 2025 compared to 2024. Los Angeles handled 9.5 million TEUs, up slightly. Long Beach processed 9.0 million, up 2.9 percent. Savannah reached 5.3 million, Houston 4.0 million. Only Seattle/Tacoma and Virginia saw meaningful year-over-year declines. The global economy, measured by the actual flow of goods into U.S. markets, has proven more durable than the disruption narrative would suggest.
The practical implication for real estate strategy is that the push toward nearshoring and domestic manufacturing — while genuine — has not yet produced a significant reduction in importdependent supply chain activity. Clients tell me they want to reduce their overseas exposure. Many are taking real steps to do so. But the containers are still moving. The nearshoring thesis is playing out as a supplement to existing global flows, not a replacement for them, at least for now. That means the industrial markets that serve as import gateways — Southern California, Savannah, Houston, the Northeastern corridor — retain their strategic relevance even as Texas border markets and Mexico-adjacent logistics hubs grow in importance.
The Texas border data is particularly instructive. Container crossings at Brownsville, McAllen, Laredo, and El Paso remain 48.2 percent above 2023 levels at 8.7 million containers annually, even with a slight dip in 2025. Industrial construction in Texas border markets is running at multiples of the national rate as a share of inventory, reflecting genuine occupier demand rather than speculative development. That’s the nearshoring thesis in action — not as a replacement for trans-Pacific trade, but as a parallel system being built to hedge against it.
Rhetoric Versus Reality on Reshoring
The manufacturing announcement picture is more complicated. Savills Research tracks U.S. manufacturing projects of 500 or more jobs, and the data over the past decade tells a nuanced story. New announcements have risen significantly over the past year — 53,416 jobs announced in the trailing 12 months, representing $42.2 billion in capital investment. But stalled projects are also at historically high levels, running well into negative territory on our tracking chart. Activity has risen even as previously announced projects are being canceled or put on hold at rates we haven’t seen before.
When you look at where the genuine activity is concentrated, three sectors account for 75 percent of new manufacturing project announcements in 2025: aerospace and defense at 49 percent, grid and energy at 16 percent, and digital infrastructure at 9 percent. These are not consumer goods factories or general industrial facilities. They are highly specialized, capital-intensive projects with long lead times and specific infrastructure requirements — power access chief among them.
A project like JetZero’s all-wing aircraft facility in Greensboro, North Carolina, with 14,500 jobs and $5 billion in capital investment targeting a 2028 opening, is real and consequential. But it’s a different animal than the broad-based manufacturing renaissance that some of the headline numbers imply.
The power constraint is real and deserves more attention than it typically gets in real estate discussions. Grid capacity is increasingly a binding constraint on where advanced manufacturing and data center projects can actually land. The total capacity in the interconnection queue at the end of 2023 was nearly 2.6 terawatts — more than twice the current U.S. generating capacity. Half the country faces high risk of power shortfall within the next decade. For site selectors, this means power availability is no longer a checkbox item — it’s a primary location filter for an expanding category of industrial demand.
What This Means for Your Next Decision
Th e industrial market fundamentals, taken in aggregate, remain solid. U.S. inventory stands at 17.2 billion square feet, vacancy has held at 8.2 percent, quarterly net absorption came in at 48.9 million square feet in Q4 2025, and asking rents have stabilized around $9.61 per square foot. Third-party logistics
providers now account for 41 percent of leasing activity — up from 23.3 percent five years ago — reflecting the broader shift toward outsourced logistics as companies seek flexibility in an uncertain environment.
Against that backdrop, a few principles seem durable regardless of how the specific disruptions of 2026 play out. AI adoption in supply chain planning is accelerating faster than most real estate professionals have internalized, and the operational changes it enables — leaner inventory, faster replenishment cycles, more dynamic network configurations — have direct implications for facility sizing and lease structure. Proximity to customers remains the anchor of network strategy, because service level expectations that Amazon established are not going away. And flexibility has genuine option value in an environment where policy can shift a supply chain overnight.
The companies best positioned for the next five years are not the ones that guessed right about any single disruption. They’re the ones that built networks — and real estate footprints — capable of absorbing surprises. AI is increasingly the tool that makes that kind of adaptability achievable. The question for everyone in this room is how quickly that reality gets priced into location decisions.
Beware of Incentives Trickery
Chasing incentive dollars is a great way to end up in the wrong place for the wrong reasons
By Daniel Young, Director of Economic Development at Moore & Van Allen PLLC
It’s a rare exception for something good to come from a project that asked what their incentives would be when they first walked in the door. So many more things go into a location decision that have a greater long-term impact than incentives. Sure, you get a little financial “pop” for a good incentive package, but what about when the pop goes away? Do you have what you need to be successful?
Might as well get the most obvious issue out of the way upfront: the site consultant getting paid based on the amount of incentives the project receives. It has never been clear why a company would compensate a site consultant this way. The consultant is not incentivized to find you the best site, only the one with the biggest number. This frequently puts your best interests at odds with those of the person you are paying to guide one of the most consequential decisions your company will make.
One major international company came in on a large project that went on a site woefully lacking the required public infrastructure. In economic development anything is possible — the question usually comes down to time and money. Do the public entities have the money, and will the required time frame to complete the improvements meet the company’s needs? In this case, the powers that be deemed the cost doable, and if everything fell into place, including a massive wetlands permit, the time frame could be met. Hundreds of millions of dollars were committed for infrastructure, site work and plain incentives. The first sign something odd was going on was when the consultant asked for what amounted to a rounding error on a project of this magnitude to “seal” the deal.
The night before the company team was to finalize the selection, the consulting team asked to go down the list of all the incentives being offered to “make sure everything was captured.” The list went item by item — grants from all manner of sources, their respective approval processes, property tax
relief, even corporate income tax credits that were worth pennies on the dollar but on paper added tens of millions.
When the conversation got to utility providers, things took an odd turn. The site was customer choice for multiple utilities, two of which had ample infrastructure already in place. One was much smaller and really wanted the project; the larger one wanted the business but was less aggressive. The rates were basically the same. The incentive list only contained the incentives from the smaller company, even though it was pretty well accepted they were going with the larger provider. The argument could be made that the incentive had been secured for the project and the company had simply chosen not to accept it — but it is indicative of how the goals of the client and consulting service are not always aligned when the consultant is paid based on total incentives. In the past four years, one company refused to pay the bill they were handed and another project went to court. Neither opened a facility on the recommended site despite committing and publicly announcing.
From the public sector side, a company asking up front for the location with the most incentives was a sign they might not have their financing in place or hadn’t read the fine print. Many states have incentives set up to provide the most rural and economically distressed areas greater financial benefit — grant dollars awarded at a different rate, additional sources of funding, higher tax credits. After being burned a few times, it’s hard not to conclude there are people who prey on exactly that.
In South Carolina, a project employing 200 people at $25 an hour looking in the most rural areas could expect a state-level incentive package of around $29 million. That same project in an urban center likely becomes $1.5 million. The primary reason: job creation credits drop from $25,000 per job for five years to $1,500 per job for five years, and the company likely won’t qualify for the wage rebate program either, because at $25 an hour they are not paying the required per capita income level in an urban area.
Not too long ago, one company saw numbers like these and thought the state was going to write them a check. The faces in the room changed when the explanation came that credits could only be used against corporate income tax liability. Under a single-factor formula based 100% on sales in the state, it takes an awful lot of income to use that many credits. Rural areas deserve love, but there is a reason incentives are higher there. Can you find the workforce you need? Is the infrastructure in place?
MVA recently worked on a project that went into one of the state’s lowest-tiered counties because the client found a building that fit their needs. It also happened to be adjacent to a metropolitan area and sit on an interstate. The building drove the location decision. The incentives just happened to be available.
Incentives are important but should be considered the icing on the cake, not the reason the cake was made.