A.P. Moller Holding’s statutory statement on CSR in accordance with section 99b of the Danish Financial Statements Act. The CSR report is part of the Annual Report for 2025.
A.P. MOLLER HOLDING
This report represents the statutory consolidated statement of A.P. Møller Holding A/S on CSR in accordance with section 99b of the Danish Financial Statements Act. It represents policies, activities, and results achieved in 2025 for entities owned and controlled by A.P. Møller Holding A/S.
A.P. Møller Holding A/S (A.P. Moller Holding) is 100% owned by A.P. Møller og Hustru Chastine Mc-Kinney Møllers Fond til almene Formaal (the A.P. Moller Foundation), one of the largest, industrial foundations in Denmark.
As the parent company of the A.P. Moller Group, our purpose is to build and develop businesses that have a positive impact on society – ‘nyttig virksomhed’. We drive long-term value and growth in our businesses. Through engaged and valued ownership, we leverage our family name, values, insights, and global networks to set our businesses up for success.
‘Nyttig virksomhed’ is a key element in our investment strategy, and we are open to reconsider ownership of a business, if its business model does not have a positive impact on society. Hence, social responsibility is integrated into our purpose and is core in everything we do.
Striving for good governance is part of our ethical culture, and we continue to update our policies and systems to secure a solid basis for our future activities as an engaged investment company.
We focus highly on mitigating the risk of being abused by third parties that A.P. Moller Holding engages with. This is especially relevant in relation to our investments, where we always conduct proper and adequate due diligence measures on relevant counterparties such as advisors, co-investors, etc.
An example is our Anti-Bribery and Corruption policy which illustrates our zero tolerance towards fraud and bribery. This is one of the cornerstones in our overall framework for how to exercise due care to prevent bribery and corruption internally as well as in relation to third parties acting on behalf of A.P. Moller Holding. The policy provides overall guidelines in relation to procedures to be followed when investing, when interacting with other business relationships, e.g. government officials, and in relation to gifts and hospitality, etc.
As an international investment company with a broad range of investment activities, A.P. Moller Holding has a significant influence on society. We acknowledge the responsibilities that this entails and make an effort to ensure that we are recognised as a trustworthy group of companies.
The Board of Directors of each of our portfolio companies define their own specific CSR policies and Codes of Conduct. We are represented on each board, and these representatives ensure that CSR policies, including human rights, climate change, and environmental impact, are enforced. Policies are adapted to meet the circumstances in which each of the affiliates operate.
CSR POLICIES AT A.P. MOLLER HOLDING
At A.P. Moller Holding, being a good corporate citizen is an integral part of the way we do business, globally as well as locally.
We are committed to work internally and with our business relations to promote responsible practices. Our aspiration is to ensure that all our business relations acknowledge our values and share our commitment to conduct business in an ethical, legal, and socially responsible manner. Continually, we strive to improve the performance of our business relations within the areas of human rights, labour standards, and the environment, and to work against any form of corruption, fraud, and bribery.
We strongly believe that high standard governance measures will create value for all parties and contribute to establish a long-term sustainable relationship with our business partners, our employees, and the societies in which we operate.
We expect our suppliers to avoid participation in or knowingly benefit from any kind of corruption, money-laundering, market abuse, extortion, or bribery.
Furthermore, we expect our suppliers to respect all applicable laws and regulations and prevailing industry standards.
As such, we expect our suppliers to integrate environmental considerations in their activities and strive for continuous improvement by minimising any adverse effects of their activities on the environment.
We expect our suppliers to provide a safe and healthy working environment for all their employees. This includes high focus on respectful treatment, equal opportunity rights, freedom of association and collective bargaining, compliance with applicable working hours, etc.
The CSR reports of our portfolio companies – each outlining company-specific policies, activities, and results for 2025 – are enclosed in this report

WE ARE GUIDED BY OUR FIVE CORE VALUES

CONSTANT CARE
Take care of today, actively prepare for tomorrow

HUMBLENESS
Listen, learn, share, and give space to others

UPRIGHTNESS
Our word is our bond

OUR EMPLOYEES
The right environment for the right people

OUR NAME
The sum of our values: passionately striving higher
APMH INVEST
In the fully owned holding company, APMH Invest A/S, A.P. Moller Holding decides upon and includes investments’ CSR policies in the continuous assessment of which companies should be invested in.
As of 31 December 2025, the investment companies fully owned by and/or where A.P. Moller Holding controls the entity comprise:
• APMH Invest A/S
• APMH Invest V ApS
• APMH Invest IX ApS
• APMH Invest X P/S
• APMH Invest XI ApS*
• APMH Invest XIII ApS
• APMH Invest XIV ApS
• APMH Invest XVI ApS
• APMH Invest XVIII ApS
• APMH Invest XX A/S*
• APMH Invest XXI ApS
• APMH Invest XXII ApS
• APMH Invest XXIV ApS
• APMH Invest XXV ApS*
• APMH Invest XXVI A/S*
• APMH Invest XXVII A/S*
• APMH Invest XXIX ApS
• APMH Invest XXX ApS
• APMH Invest XXXIII ApS*
• APMH Invest XXXIV ApS*
• APMH Invest XXXV A/S
• APMH Invest XXXVII Aps
• APMH Invest 38 ApS*
• APMH Invest 39 ApS*
• APMH Invest 40 ApS*
• APMH Invest 41 ApS*
• APMH Invest 42 ApS*
• APMH Invest 43 ApS*
• APMH Invest 44 ApS*
• APMH Invest 45 ApS*
• APMH Invest 46 ApS*
• APMH Invest 47 ApS*
• APMH Invest 48 A/S*
• APMH Invest 49 A/S*
• APMH Invest 50 K/S
• APMH GE P/S
• APMH GE II P/S
• APMHI GP ApS
• A.P. Møller Maritime ApS
• AIF I Sponsor Invest K/S
• C2X LTD and subsidiaries
• Iv3 Aqua Holding A/S
• Iv3 Aqua Corporation and subsidiaries
• Vioneo Holding AG and subsidiaries
• APMH Invest Singapore PTE. LTD.
* Dormant companies as of 31 December 2025.
Being owned by A.P. Moller Holding, APMH Invest A/S takes its origin in the same values and commitments towards CSR as A.P. Moller Holding. Hence, APMH Invest is committed to make investments in an ethical, legal and socially responsible manner.
A.P. MOLLER - MAERSK
The sustainability statement from A.P. Moller - Maersk’s Annual Report for 2025 is enclosed on the next pages.
Sustainability statement
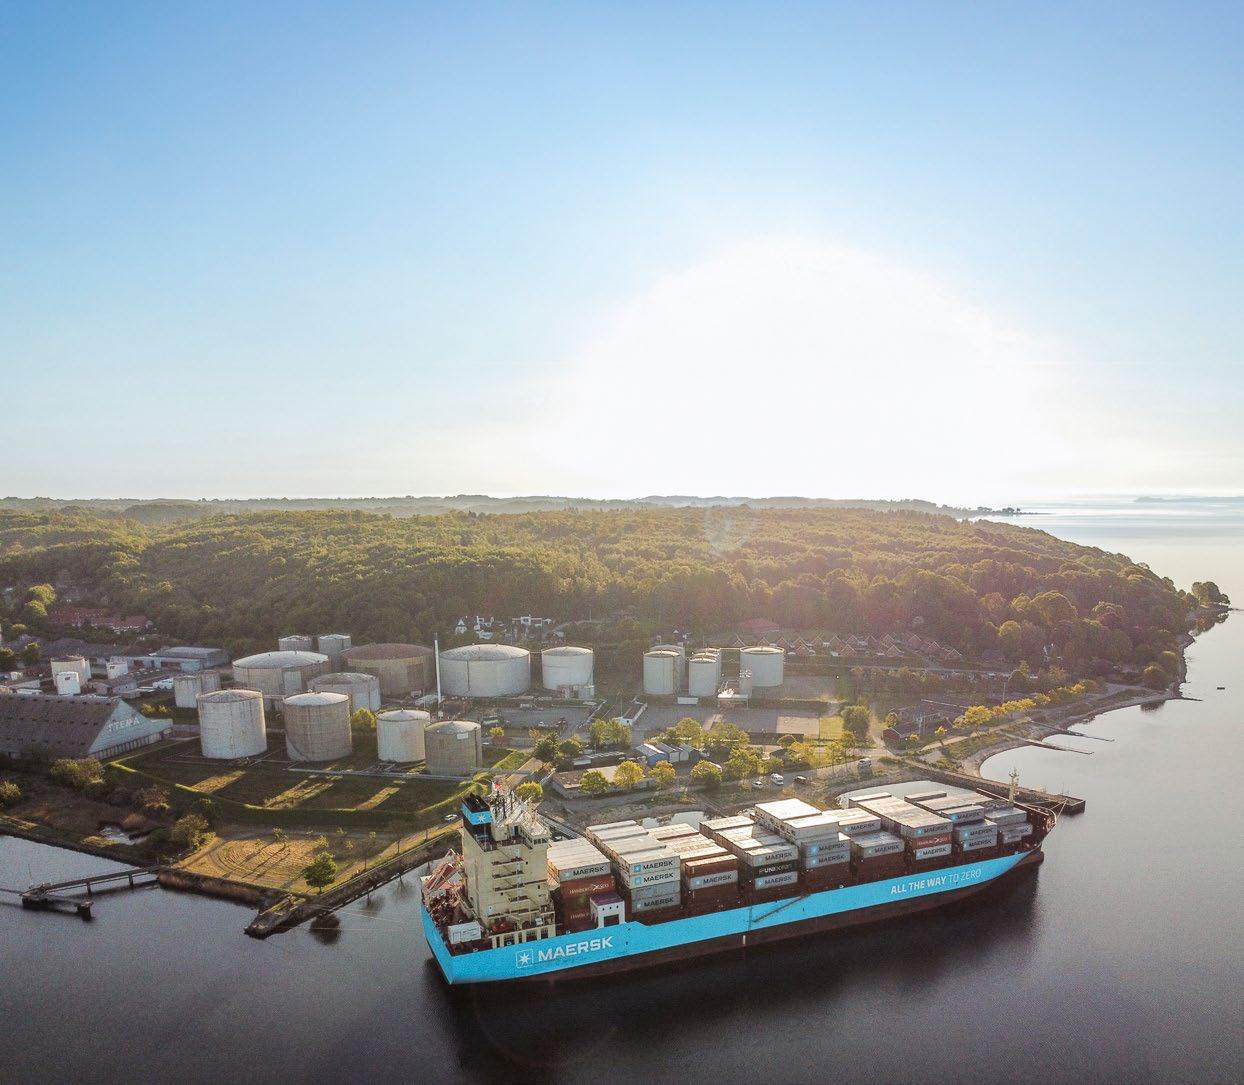
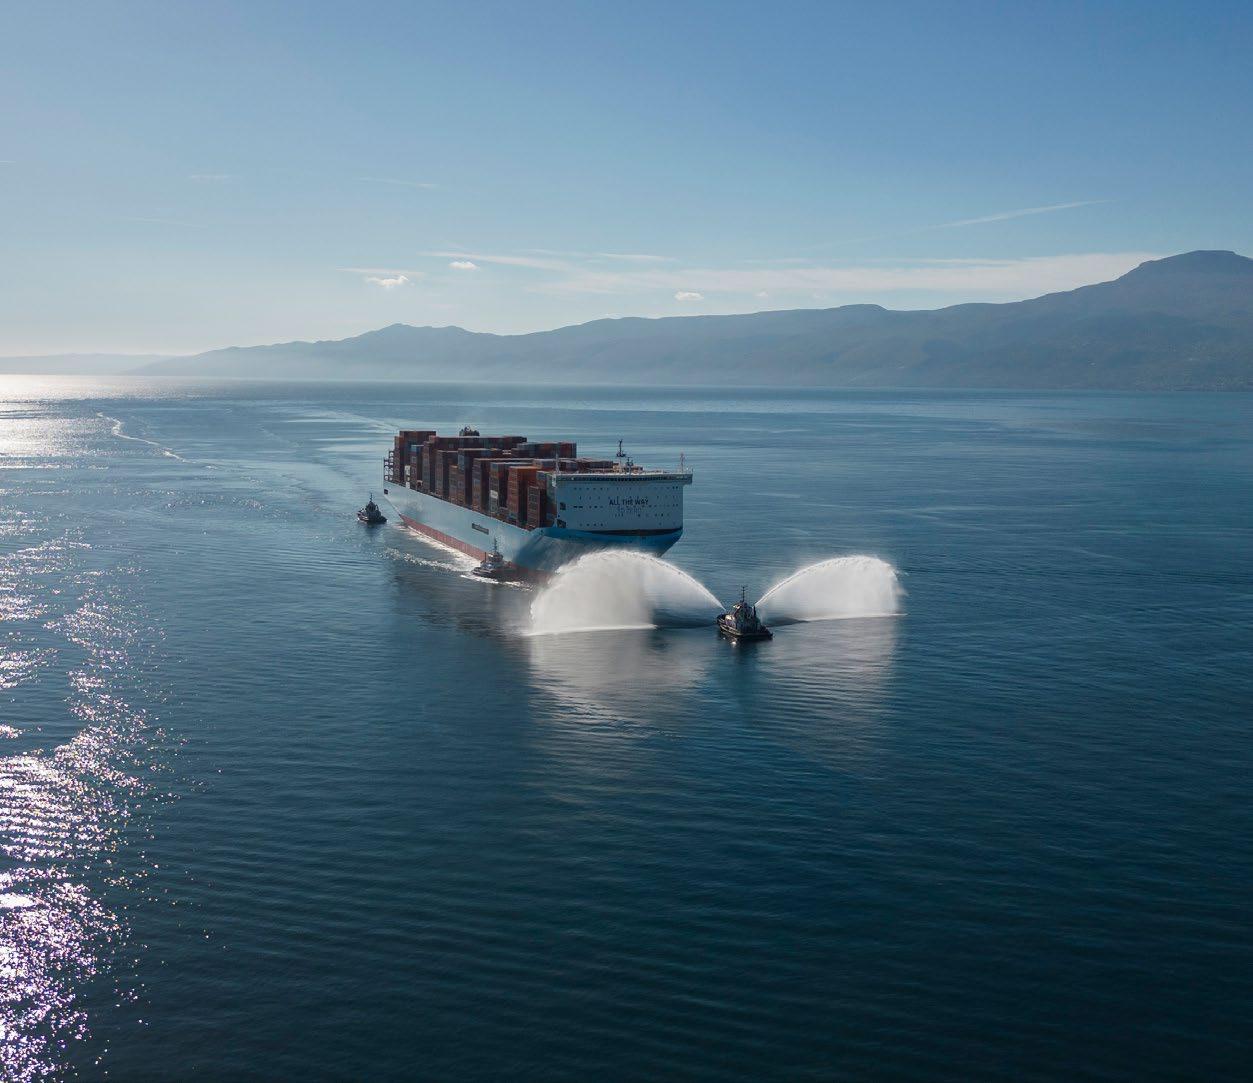
The industry’s first e-methanol bunkering
Laura Mærsk, Maersk’s first dual-fuel methanol vessel, received the first e-methanol from the newly inaugurated Kassø facility in Denmark in May 2025. Developed by European Energy in collaboration with Mitsui & Co., Kassø is the world’s largest commercial e-methanol plant and the first of its kind to produce e-methanol at scale.
Kassø operates entirely on renewable energy sources using biogenic CO₂ from biogas and waste incineration combined with renewable electricity.
General information
Environmental information
Social information
Governance information
Appendix
General information Executive summary
A.P. Moller - Maersk (Maersk) continued to work towards its sustainability targets in 2025 while navigating a challenging operating environment marked by disruptions and geopolitical volatility. Maersk took tangible steps in our energy transition plan during 2025, including taking delivery of 10 new dual-fuel methanol vessels, and the successful implementation of the Gemini Cooperation, that amplified efficiency improvements. The year was marked by the need to continue re-routing vessels around the Cape of Good Hope, which resulted in longer sailing distances and increased fuel consumption throughout 2025.
In 2025, we recorded an increase in total greenhouse gas emissions, landing at 85.4m tonnes, and above our 2022 baseline of 82.8m tonnes. The increase is attributed to our scope 3 value chain emissions and mainly driven by an increased sale of marine fuels and containers to third parties and from taking delivery of 10 new dual-fuel methanol vessels. We had no fatalities among our own or contracted workers (non-employee workers) working under our responsibility across all operations. We deepened our commitment to providing a safe and inspiring work environment through our people and culture programmes and strengthened safety and security standards. Maersk also continued to ensure that we operate based on responsible business practices across our global scope, from protecting the environment and ecosystems to expanding sustainable procurement integration and further developing our data ethics and AI approach.
Our progress on these topics is unfolded in the respective sections of the following chapters.

Sustainability strategy and governance
Double materiality assessment
Sustainability due diligence
Stakeholder engagement
Basis of preparation
Sustainability strategy and governance
Our sustainability efforts are anchored in our business strategy, our Purpose and Core Values, and informed by our material sustainability impacts, risks and opportunities. In 2025, we initiated a review of our sustainability strategy to ensure that our commitments and efforts remain fit for purpose, considering key changes in the external context, our customers’ need for resilient supply chains and our ambition to do better in a constantly changing world.
2025 was characterised by significant geopolitical volatility, putting pressure on international institutions and collaboration, and elevating levels of conflict. Tariffs and trade tensions took centre stage in policy discussions about global trade and logistics, bringing increased focus on the resilience of global supply chains, while the momentum of the shipping industry’s energy transition remained challenged.
Against a backdrop of rapid change, we worked closely with customers to enhance supply chain resilience, supported by the reach and adaptability of our global network. Geopolitical tensions and conflict-affected areas continued to require heightened focus on due diligence related to trade controls, sanctions screening and export compliance to identify and manage risks when operating in conflict zones.
Security disruptions in the Red Sea continued well into 2025, extending the re-routing of our network via the Cape of Good Hope and adding significantly to transit times and fuel consumption. As was the case in 2024, this has led to an increase in greenhouse gas (GHG) emissions from shipping and continued reliance on higher emission transport modes.
2025 was also one of the warmest years on record. Both frequency and severity of extreme weather events, such as floods, wildfires and droughts continued to increase, further affecting global supply chains.
In Panama, for example, drought-driven restrictions at the Panama Canal disrupted just-in-time supply chains, forcing vessels to seek longer routes, while drought-induced low water levels caused schedule disruptions in Northern Europe.
Widely different expectations continue to evolve around the contributions and responsibilities of companies in addressing broader societal issues, from climate action and environmental sustainability to human rights, social impact and inclusive workplace practices. As a global company, we work with a diverse range of stakeholders from all parts of the world and operate in accordance with local regulations. We continue to act in accordance with our fundamental values and culture, accommodating and embracing differences in values, opinions and perspectives, and doing what is meaningful for our business and customers.
Against this backdrop, A.P. Moller - Maersk (Maersk) continues to pursue our sustainability ambitions with a clear focus on long-term business value, while supporting customers as they turn their priorities into practical, scalable solutions across diverse regulatory and reporting environments.
Our sustainability strategy
By integrating global logistics, we improve the flow of the foods, goods and materials that sustain people, businesses and economies across the world.
In line with our integrator strategy and guided by our values, our sustainability priorities focus on issues that matter to our business, our customers, our society and where we can make a meaningful impact.
• We act as a catalyst for the energy transition in shipping and logistics
• We ensure a safe and inspiring environment for our people to grow, develop and thrive
• We operate based on responsible business practices
No company can drive transformative change alone. We depend on collaborative innovation and supply chain partnerships with customers, suppliers, peers and regulators that share our ambition to do better in a constantly changing world.
Sustainability governance model
Responsibility for sustainability and ESG is anchored with Maersk's Board of Directors, which endorses the overall sustainability strategy and targets.
At the Board level, three committees are responsible for sustainability and ESG-related aspects as reflected in the committee charters:
The Energy Transition Committee, which replaced the previous ESG Committee in 2025 and supports the development of the company’s strategic direction on energy transition-related matters including our netzero ambition, while securing competitive operating margins, acting both as a sounding board to management and supporting the Board. The Board oversees other ESG-related matters.
The Audit Committee oversees Maersk’s double materiality assessment, external ESG reporting, data quality and internal controls.
The Remuneration Committee reviews sustainability-linked targets as part of the long-term incentive programme for the Executive Leadership Team (ELT). Read more in the Remuneration Report.
At the executive level, dedicated sponsors are allocated to Maersk’s material sustainability categories. This sponsorship includes driving initiatives forward and accountability to the full ELT and the Board of Directors for the development of and delivering on targets and policies. Responsibility for executing on the sustainability strategy resides with dedicated teams within relevant functional areas reporting to the respective ELT sponsors.
Risk and Compliance Committee
The Risk and Compliance Committee (RCC) is the main executive governance forum for sustainability and ESG as well as other key risk and compliance processes and topics across Maersk, including our internal Commit governance framework and the Enterprise Risk Management (ERM) process.
To facilitate oversight and support decision making for strategic dilemmas and risks through the year, progress updates are compiled quarterly for strategic and prioritised targets and KPIs. These updates, as well as deep dives into individual categories are overseen at the quarterly meetings of the RCC and subsequently, if relevant, discussed with the full ELT.
On an operational level, cross-functional steering committees and working groups facilitate coordination, ensuring that relevant functional and business areas are included in strategic decisions and supporting implementation across business areas.
Sustainability governance in A.P. Moller - Maersk in 2025
Board of Directors
Endorses sustainability strategy
Executive Leadership Team
Defines sustainability strategy and oversees implementation
Key corporate functions (cross-category)
Strategy | Sustainability | Finance
Facilitates sustainability strategy and oversight, guides and enables category owners
Category-specific governance
Social
Energy transition
Rabab Boulos, Chief Operating Officer
Energy transition
Environment and ecosystems
Rabab Boulos
Safety and resilience ELT sponsor
Responsible department
People and culture
Susana Elvira, Chief People Officer
People function
Human rights
Caroline Pontoppidan, Chief
Corporate Affairs Officer
Sustainability
Employee relations and labour rights
Susana Elvira
People function
Safety and security
Rabab Boulos
Safety and resilience
Caroline Pontoppidan Compliance
Responsible
Patrick Jany, Chief Financial Officer Tax Citizenship
Caroline Pontoppidan Sustainability
Data and AI ethics
Navneet Kapoor, Chief Technology and Information Officer Technology
Sustainability integration in governance and risk frameworks
In addition to the dedicated sustainability governance model outlined above, some sustainability topics are also integrated into other internal governance processes, including Commit, Maersk’s governance framework. Sustainability is integrated into Commit through the Code of Conduct and specific Commit rules in relation to Health, Safety, Security and Environment (HSSE), global employee relations, anti-corruption, sustainable procurement as well as data privacy and data ethics. Each rule has a designated owner in the organisation who is responsible for compliance. Progress oversight on implementation and compliance is performed on an ongoing basis through impact and risk assessments such as self-assessments performed for the Global Employee Relations Rule, compliance checks for Anti-Corruption Rule and site inspections for the HSSE Rule. Executive oversight of compliance with Commit is managed through the annual internal assurance process, anchored with the RCC.
In addition, the ERM process also incorporates sustainability-related risks as part of the annual risk assessment covering the entire business and overseen by the RCC and the Audit Committee.
Maersk’s Employee Code of Conduct provides guidance on what we stand for as a company, and it governs how each brand, business unit and employee within Maersk engages with customers, authorities, colleagues, suppliers, the community and other stakeholders. It serves as the overarching policy document for many sustainability topics, including climate, with an objective to minimise harm to the environment through a scope focused on decarbonisation in alignment with the SBTi.
Double materiality assessment
A.P. Moller - Maersk’s (Maersk's) sustainability strategy and reporting is anchored in a double materiality assessment (DMA) aligned with the European Sustainability Reporting Standards (ESRS). It captures the material sustainability-related impacts, risks and opportunities across our operations and value chain.
Maersk’s DMA is used to identify, define and assess material impacts, risks and opportunities within the areas of environment, social and governance across our own operations and value chain. For more information on the scope of and approach for Maersk’s DMA, see Basis of preparation on page 58. The DMA is reviewed annually to ensure that our material IROs and associated topics continue to adequately reflect changes in our business model and the external environment. Since the previous assessment in 2024, our internal context has remained largely unchanged, while external developments prompted a revalidation of the assessment to confirm continued relevance of the results.
The process involved internal impact and risk owners, and subjectmatter experts reviewing and adjusting the assessments, where necessary. The updated assessment was approved by Executives in our Risk and Compliance Committee and the Audit Committee. Climate change remains a key material topic for Maersk, with two main climate-related risks identified: transition risks, which have for a long time been part of our enterprise risk landscape, and physical risks, assessed through detailed analyses. As such, the assessment reconfirmed materiality of climate change mitigation and adaptation. For social topics, the assessment reconfirmed the materiality of human capital, employee relations, labour rights and safety. In 2025, we have amended our IROs related to diversity, equity, and inclusion to focus on equal rights and equal treatment. While most topics are material from an impact perspective, remediation costs, reputational risks and the ability to attract and retain critical talent are also financially material. Within governance, the assessment reconfirmed business ethics, sustainable procurement, data and AI ethics, and responsible tax as material categories.
While no significant changes to material topics were identified, adjustments were made to individual IROs particularly for nature-related topics. These adjustments were triggered due to our effort to strengthen the LEAP framework that also informs the DMA, which provided a more granular view of impact hotspots across our activities and segments. This refinement led to targeted scope adjustments for certain impacts identified in 2024. For example, we expanded the scope of impacts of spread of invasive species to cover more transport modes, including air and rail freight. Moreover, we refined our scope of impacts related to ecosystem degradation and biodiversity loss caused by construction of land-based assets to focus only on construction and expansion activities, rather than all locations. The scope adjustments have not changed the disclosures included in the report for 2025, however, more emphasis has been put on the environmental and social impact assessments that we complete in connection with our construction and expansion activities compared to the previous report. While our LEAP assessment is more granular this year, IROs for pollution, water use and the circular economy were assessed through a desktop study at group level, not at location level. In 2025, we continued efforts to align and streamline processes between our DMA and Enterprise Risk Management (ERM) framework. This work resulted in the full integration of the financial risk assessment dimension of the DMA into Maersk’s ERM process, creating stronger governance and the embedding of sustainability-related risks in our overall risk oversight.
Maersk reports on 29 IROs representing the areas where Maersk has material impact on people and the planet or faces material financial risks and opportunities. Given our global presence and the diversity of our operations, this list does not provide an exhaustive overview of all IROs relevant to Maersk. We continue to actively monitor and address additional topics below the threshold.
None of the identified material risks are expected to cause material adjustments to carrying amounts of liabilities reported in the financial statements in the next annual reporting period.
Environment Social Governance
Climate change IRO type
Climate change mitigation
Greenhouse gases emitted from our operations, suppliers and business partners in the value chain
Transition risks related to policies and market demand for decarbonisation of the shipping industry
Climate advocacy/lobbying for policy interventions on energy transition in shipping and logistics
Climate change adaptation
Financial risks due to physical impacts of climate change to assets and operations
Environment and ecosystems
Pollution
Air pollutants from vessels and landside/air transportation
Pollution from hydrocarbon spills from vessels and landside operations and from containers lost at sea
Discharged wastewater to the sea
(e.g., scrubber, bilge, sewage and grey water)
Ecosystem health and biodiversity
Disturbance of species due to vessel traffic and underwater radiated noise
Ecosystem degradation and biodiversity loss caused by land use and habitat disruption resulting from construction of land-based assets
Spread of invasive species
Waste management
Waste generation during operations
Responsible ship recycling
Environmental impacts during decommissioning of vessels
Sourcing of critical resources
Environmental impacts resulting from the steel value chain
Environmental impacts resulting from the fossil fuel and biofuel value chain
People and culture IRO type
Attracting and retaining critical talent
Inability to retain and attract the right workforce for key critical capabilities
Discrimination and harassment in the workforce
Negative impacts of harassment creating an unsafe working environment for vulnerable groups in our workforce
Lack of equal treatment
Safety & security
Safety of our workforce
Risks of work-related injuries, life-altering incidents and fatalities
Exposure to global/local security risks
Exposure to global/local security risks
Employee relations and labour rights
Forced labour
Forced labour, such as debt bondage and withholding of passports
Working hours and adequate wages
Excessive hours worked for contracted frontline workers
Ensuring that workers are paid an adequate wage
Adequate housing and sanitation
Adequate housing and sanitation facilities for own and contracted workforce
Legal and regulatory compliance
Impact and risk of cases of noncompliance on anti-corruption laws, international sanctions or transport of illegal goods
Grievance and remedy
Access to grievance and remedy for affected stakeholders
Sustainable procurement
Supplier relationship management
Risks of noncompliance with Maersk’s standards by our suppliers
Payment practices
Ensuring timely and fair payment practices to suppliers
Data and AI ethics
Ethical use of data and AI
Ethical use of our stakeholders’ data and protection of individuals’ right to privacy
Responsible
tax
Tax governance
Risk of different interpretations and tax controversy
Sustainability due diligence
A.P. Moller - Maersk (Maersk) is committed to conducting business responsibly and respecting human rights, which is embedded in our Values, Purpose and Code of Conduct and guided by international standards. Due diligence is a cornerstone of our approach to responsible business: It enables us to identify, mitigate and monitor potential adverse environmental and social impacts linked to business activities in our operations and value chain.
While regulatory uncertainty remains at EU and global levels, stakeholder expectations are clear: customers, suppliers, investors and civil society increasingly expect that companies are identifying and managing social and environmental risks across the value chain. We welcome regulatory measures that align national specific requirements for responsible business conduct, and create a level playing field. We remain committed to continuously improving our practices to ensure that human rights and environmental considerations are integrated into relevant due diligence processes and sustainability governance mechanisms. We see this not only as a responsibility for global companies like Maersk, reinforcing trust in our brand, but also as an opportunity to support our customers in strengthening the resilience of their supply chains.
Human rights
Respect for people is anchored in our Purpose and Core Values. We are committed to respecting human rights across our operations and value chain in line with the UN Guiding Principles on Business & Human Rights, the OECD Guidelines for Multinational Enterprises on Responsible Business Conduct, and the UN Global Compact. These commitments are formally reflected in our public human rights policy statement, Code of Conduct and Supplier Code of Conduct, available on Maersk.com
Our risk-based approach to human rights due diligence combines standalone human rights assessments plus integrating human rights into existing due diligence processes, including operational governance and risk frameworks such as Commit, upstream supplier and third-party labour risk assessments, third-party management integrity screening of high risk suppliers, low-emissions fuel sourcing due diligence, internal audit and downstream measures like customer screening, cargo due diligence, responsible ship recycling and mergers and acquisitions (M&A) reviews.
The Corporate sustainability function centrally governs human rights due diligence and acts as business and human rights advisors to the business, whilst managing salient risks is anchored within relevant functions across the organisation.
Assessing salient human rights issues
Human rights assessments are key to understanding our human rights risks at a corporate level and prioritising our mitigation efforts. Applying the methodology outlined in the UN Guiding Principles, our approach serves two purposes; first, to identify salient impacts on people across our operations and value chain; and secondly, to prioritise specific issues for action (see table to the right), informed by the risk saliency and current management maturity.
In 2025, we began work to refresh our corporate human rights saliency assessment, with support from external experts, to validate existing risks and capture emerging risks, mainly driven by a shifting external environment with increased geopolitical tensions and conflicts. This assessment will be finalised in early 2026, and work will then continue to review, update and/or develop action plans to address our salient issues. We actively monitor and work to address our salient issues, understanding that progress often requires longterm focus and commitment, especially when operating in difficult environments or with systemic challenges.
Downstream due diligence
As a global company with a footprint all over the world, we serve all types of customers, including companies, institutions and states, and are present in many geographies. In an increasingly complex world, with conflicts and high-risk areas, our due diligence on our services has increased in line with the changing context. Keeping our people safe has always been our primary priority. In addition, we have continued strengthening our compliance screening policies and procedures to support our downstream due diligence framework. This work will continue in 2026.
Prioritised salient human rights risks
Working conditions, including wages, benefits, working hours and adequate accommodation
Potentially affected stakeholder group (at highest risk)
Non-employee workers and
Reference in the report
Key stakeholders and how we engage with them
Stakeholder engagement
Proactive engagement with stakeholders is essential to delivering on our strategic ambitions and creating long-term value. Listening to and acting on stakeholder input helps shape our priorities, inform decisions and strengthens our ability to manage risks and opportunities. Our stakeholder landscape spans seven key stakeholder groups consisting of both affected groups and users of our published information and including vulnerable populations such as indigenous communities and underrepresented groups in our workforce. A detailed overview is provided in the table to the right.
Across A.P. Moller - Maersk (Maersk), engagement responsibilities sit with key functions that regularly report insights to the executive leadership team and relevant committees. For example, workforce engagement is anchored in the People function and Safety & Resilience, or in Sustainable procurement, depending on the topic and whether input comes from Maersk’s own employees, employees of our suppliers or unions representing broader workforce populations. In 2025, Maersk hosted its first Sustainable Procurement Awareness Week, engaging suppliers, customers and industry experts to share knowledge and strengthen ESG collaboration. The event raised awareness and emphasised the interdependence of customer outcomes and supplier commitments, reinforcing the shared responsibility in driving sustainability across the value chain.
For parts of our business that interact directly with local communities, for example our terminal operations, proactive engagement is vital to maintaining our license to operate by understanding local needs and creating opportunities for shared value. At Pier 400 in Los Angeles, local outreach prompted APM Terminals to intensify engagement around workforce development, environmental stewardship and emergency preparedness. By listening and responding to community input, we addressed operational challenges, built trust and reinforced our commitment to responsible business conduct.
Employees, contingent workers and value chain workers
Stakeholder expectations of Maersk Key engagement channels
Meaningful work, fair treatment and wages, safe working conditions, a sense of belonging for all and good development opportunities.
Customers Solutions that can ensure responsible business practices and lower supply chain emissions.
• Daily manager/colleague interactions
• Engagement and inclusion surveys
• Grievance mechanisms
• Engagement with unions and interest groups
• Supplier audits
• Regular business interactions and ongoing supplier assessment
• Strategic customer council and customer satisfaction surveys
• Partnerships and collective action alliances
Authorities, regulators and standard setters
Compliance with regulation and industry leadership on the transformation to net-zero.
Suppliers and business partners
Fair and transparent business opportunities and partnerships on strategic issues.
Investors and analysts Strategies, plans and actions to mitigate short and long-term risk to the business model.
• Engagement with local, national and international agencies and authorities
• Standard-setter collaboration on topic-specific research, pilots and implementations
• Industry associations, collective action alliances and strategic partnerships
• Contract management
• Supplier relationship management framework
• Supplier surveys, workshops and capabilitybuilding programmes
• Industry forums and associations
• Regular engagement through, e.g., earnings calls, conferences, events, roadshows and meetings, including the Annual General Meeting
• Investor surveys and ESG ratings
• Collective action alliances
Local communities and nature
Responsibility and accountability towards material issues in areas of highest impact.
Civil society organisations Responsibility and accountability towards material issues and positive contributions in areas of highest impact and leverage.
How stakeholder input is used
Provide valuable input to ESG programmes and shape actions and improvement plans to address any issues.
• Environmental and social impact assessments, corporate social responsibility initiatives
• Engagement with community representatives and employees
• Collective action alliances and partnerships
• Scientific studies
• Bilateral engagement with local, national and international agencies
• Collective action alliances
Informs product development and shapes solutions. Customer feedback on providing greater value is directly linked to our integrator strategy.
Ensure we adhere to regulations. Help us identify opportunities for collaboration and initiatives across the ESG agenda and to push for regulations towards industry-wide decarbonisation.
Build understanding of the effectiveness of supplier practices and engagement. Enhance value chain visibility, including fair working conditions and supplier ethical business conduct.
Helps us understand how the company is perceived in comparison to other investment opportunities. ESG ratings additionally help identify gaps in ESG management and emerging trends.
Local communities help us better understand the needs and constraints of nature where we operate, informing decisions to invest and procure resources and to mitigate negative impacts in operations and the value chain.
Access to valuable insights, expertise and best practices which help us identify potential risks or opportunities and shape ambitions and actions.
We take an active role in standard setting, development of solutions and advancement of the sustainability agenda through participation in cross-industry partnerships such as the UN Global Compact, Smart Freight Centre and the World Business Council for Sustainable Development, on topics core to the energy transition, environmental and social responsibility of shipping and logistics. One example is ocean health and the impact of the shipping industry in this regard, where we have provided input to organisations such as World Economic Forum and the Taskforce on Nature-Related Financial Disclosures on frameworks to assess the shipping industry’s impact.
Insights gathered through such engagements inform our strategy refresh, reaffirming that even amid a rapidly changing global landscape, our commitments remain fit for purpose. We continue to align with stakeholder expectations while delivering on our sustainability ambitions and supporting customers and investors in achieving theirs, while ensuring that we safeguard the rights and needs of our people, communities, and the environment wherever we operate.
Engaging with customers
In a rapidly changing environment, we work closely with customers to strengthen the resilience of their supply chains, and collaborate on shaping solutions and practices that support both Maersk’s sustainability ambitions and those of our customers.
Decarbonisation remain the key focus of customer engagement. Across industries, customers seek logistics partners that match their own climate ambitions. More than 50% of Maersk’s top 200 customers have now set, or committed to setting, emission reduction targets, including science-based, net-zero or other targets – reflecting a shared urgency to act on climate change. In 2025, Maersk engaged with many customers from varying industries, for example actively supporting customers such as Inditex, Sabic, Nestlé, Bridgestone and others in transitioning to lower-GHG-emission supply chains through Maersk's decarbonisation solutions. Our long-standing partnership with HP was recently recognised when Maersk was awarded the Sustainable Impact Champion at HP’s 2025 Supplier Summit for our joint work on logistics decarbonisation.
Several initiatives in 2025 aimed specifically to adapt solutions to the diverse needs of customer segments at different stages of maturity in their sustainability journey. Based on customer feedback, we developed blended ECO Delivery Ocean products spanning different fuel blend options, allowing our customers to balance cost considerations with decarbonisation ambitions. Also in 2025, the ECO Delivery Ocean products were added to Maersk.com, and with the go-live on Maersk.com in June 2025 the overall number of customers opting for ECO Delivery Ocean offerings increased to 460 during 2025, a 34% year-on-year increase.
While this growth is encouraging, the current cost of GHG emission abatement remains a significant barrier for many customers, underscoring the need for effective global climate regulation to close the price gap between traditional fossil fuels and low-emission alternatives.
Beyond ocean transport, Maersk supports increased customer demand for end-to-end decarbonised logistics through a continued expansion of inland decarbonisation solutions such as electric trucks and rail options in multiple countries. In Chile, for example, Maersk launched a third-party fleet of electric trucks in 2025 together with Sotraser, capable of hauling up to 25 tonnes on urban and interurban routes. With Grundfos, our collaboration spans both ocean and landside decarbonisation – combining ECO Delivery Ocean to reduce ocean emissions with the deployment of electric trucks in Denmark. We also engage with customers on innovative solutions for hard-to-abate sector decarbonisation.
Citizenship
Maersk’s approach to corporate citizenship is rooted in meaningful engagement at global and local levels with partners and communities, guided by Our Purpose, Core Values and stakeholder expectations. We take an active role in supporting local communities, non-profit organisations and customers on environmental and social initiatives. Our efforts are focused on five priority areas aligned with our business model and global presence: disaster relief and preparedness, empowering people to trade, protecting the natural environment and oceans, education and health and safety.
In early 2025, devastating wildfires struck Los Angeles, and Maersk mobilised to support affected communities. This included donations to local initiatives supporting impacted business and workers, and to the LA Fire Department Foundation. Maersk also provided forklifts to the California Office of Emergency Services, supplied containers to non-profits for resource distribution and delivered meals to local fire stations.
In Vietnam, APM Terminals sponsored the construction of a swimming pool for students at Doan Duc Thai school in Cat Hai District – an initiative targeted at addressing a local safety risk and promoting well-being for children.
On the environmental front, one example in 2025 was a partnership with Garbage In Value Out (GIVO), a climate tech start-up in Nigeria that reduces plastic waste and promotes circularity. The partnership converts recycled materials into products such as flowerpots and personal protective equipment, while creating a sustainable waste management system in Apapa Wharf and Onne Community.
Maersk’s annual Go Green campaign aims to engage colleagues across our operations on environmental stewardship topics, raise awareness and create a platform for collective action with the communities where we operate. The theme for 2025 was ‘Green Every Day’, and initiatives at local offices and sites focused on for example energy and water conservation, waste segregation and reforestation, with on- and off-site volunteer events carrying out trash clean-ups and recycling competitions.
In addition to local initiatives, Maersk engages in global partnerships that leverage our expertise and resources to address systemic challenges while strengthening stakeholder relationships. A notable example is Maersk’s membership of the United Nations-led Logistics Emergency Teams (LET), joining forces with industry peers to provide pro bono support during humanitarian crises and natural disasters.
In 2025, Maersk contributed to LET activations related to humanitarian relief for Gaza, through the donation of a logistics hub in Amman, and in South Sudan, supporting the transport of foodstuffs in response to the severe hunger crisis in this conflict-affected region.
Basis of preparation
A.P. Moller - Maersk (Maersk) has prepared this sustainability statement in accordance with the EU's Corporate Sustainability Reporting Directive (CSRD), the European Sustainability Reporting Standards (ESRS) and section 99a of the Danish Financial Statements Act.
The report focuses on material sustainability topics identified through our double materiality assessment (DMA), which was updated in 2025.
The DMA results have shaped the scope and content of this statement, ensuring alignment with regulatory requirements and stakeholder expectations. In 2025, we have continued to apply the phase-provisions as per the EU regulation.
Scope
As part of our DMA, Maersk evaluates material impacts, risks and opportunities (IROs) across our operations and value chain. Our business model spans Ocean transportation, Logistics & Services and Terminals, connecting global supply chains.
The assessment covered both upstream partners, such as shipyards, fuel suppliers, equipment manufacturers and manning agencies, and downstream stakeholders, including retailers, manufacturers, freight forwarders, customs authorities and port operators. It also considered communities impacted by our operations and workers within Maersk’s own and contracted workforce. Selected policies, actions and targets extend to our value chain, where relevant.
Material IROs identified through the DMA have been mapped to ESRS disclosure requirements to determine the information included in this report. For IROs covered by topical standards, we report the material datapoints specified in the ESRS. For entity-specific topics, minimum disclosure requirements form the basis for reporting on policies, actions, targets and metrics. Where data visibility is limited, we apply industry analyses, scientific research and stakeholder insights to identify high-risk areas and vulnerable groups. No material IROs were identified for consumers and end-users, as Maersk operates a business-to-business model.
Time horizons
Maersk applies time horizons as per ESRS 1 when assessing IROs: shortterm (reporting year), medium-term (1–5 years) and long-term (beyond 5 years). For some material IROs like climate-related physical risks, impacts occur on the short, medium and long term. In this report, we state the time horizon as the first occurrence of the impact, i.e. shortterm for climate-related physical risk.
Identification and assessment of material impacts
To determine impact materiality, Maersk uses an internally developed scoring methodology for each of the 10 ESRS topical standards. Impacts are assessed across the value chain, considering stakeholder groups and high-risk areas, informed by our human rights impact assessment. For social topics, scoring is differentiated for own employees, nonemployee workers and value chain workers to capture stakeholderspecific impacts.
Where possible, we build on existing due diligence processes such as the recent human rights assessments and internal management systems. Environmental impacts are informed by Maersk’s 2025 LEAP assessment, which identified dependencies and impacts using scientific studies and databases.
Severity (scale, scope and irremediable character) and likelihood are scored from 1 to 5 and weighted 50/50 for most topics. For human rights-related topics, severity carries a higher weight (75%). A threshold score of 3 ensures inclusion of significant or critical impacts in external reporting.
Identification and assessment of material risks and opportunities
As part of the DMA, Maersk assesses sustainability-related risks that could lead to financial or reputational impacts, including those linked to environmental and social dependencies. Risk assessment aligns with our ERM framework, considering magnitude and likelihood. In 2025, we advanced scenario-based modelling to quantify ESG risks, including inherent and residual risk scores, and
applied thresholds to capture the highest monetary exposures. While emerging risks are monitored, such as increased water use for biofuel production, none are currently material. Work continues to refine data, expand modelling and include modelling of financial opportunities in future assessments.
Engaging with key external stakeholders
Our assessment incorporates insights from internal experts and external stakeholders, including specialists in climate, nature, governance and human rights. Through ongoing engagement channels, we gather input on priority topics, which informs materiality assessments and guides the development of ESG initiatives and KPIs.
Data consolidation
Unless otherwise stated, the ESG performance data and information included in the sustainability statement are reported based on the same consolidation principles as the financial statements. Thus, the ESG performance data include consolidated data from the parent company, A.P. Møller - Mærsk A/S, and subsidiaries controlled by A.P. Møller - Mærsk A/S. Similarly, unless otherwise stated, our policies apply to all Maersk entities, employees and everyone working under Maersk’s control. Data are collected per legal entity and per activity and consolidated in Maersk’s financial consolidation system.
For entities and assets under Maersk’s operational control but not consolidated within the parent company or its subsidiaries, the financial consolidation principles outlined above do not apply. Operational control refers to situations where Maersk or one of its subsidiaries has full authority to establish and implement operating policies at the entity, such as operationally controlled investees in associates, joint ventures or unconsolidated subsidiaries. This authority is assessed based on contractual arrangements. These entities and assets are included in the sustainability statement for reporting.
For GHG emissions reporting, we follow the GHG Protocol and include scope 3 value chain emissions in our reporting as well.
Uncertainties and estimates
Preparation of ESG performance data requires Management to make estimates in some areas, which affect the reported data. Management forms its estimates based on historical experience, independent advice, external data points, in-house specialists and other information believed to be reasonable under the circumstances. Read more about uncertainties and estimates in the accounting policies relating to the ESG performance data.
To minimise risks of reporting errors in relation to ESG performance data, including areas with uncertainty, internal controls and validation processes are established.
Changes affecting the ESG performance data in 2025
Social
Diversity, equity and inclusion
We enhanced waste reporting from vessels by using actual amounts recorded in electronic logs for all Maersk Line vessels (320+). This provides a more accurate basis for extrapolating waste from owned and time-chartered vessels compared to previous sample-based methods. We also updated conversion factors from m³ to tonnes for all MARPOL
Annex V categories and improved hazardous/nonhazardous waste classification. Waste data reported in prior years have not been restated as we did not have electronic logs for all Maersk Line vessels at that time.
Total weight of steel consumed
We revised the KPI methodology to reflect steel procured during the year, replacing the previous approach based on container production and bill of material weights. Figures for 2024 have been restated accordingly.
Assets at material physical risk
In 2025, we are using the Swiss Re Risk Data Services platform to assess our exposure to climate-related physical risks. With the Swiss Re Risk tool, we can update our material risks on an annual basis. This is a change compared to previous years, where our reporting was based on a Cambridge Centre for Risk Studies assessment from 2022. As such, the numbers reported in prior years are not comparable.
By the end of 2025, our KPIs and targets expired. For the period since 2021, we had KPIs and targets for women in management (job level 4+), women in leadership (job level 6+), target nationalities in executive leadership (job levels 8 and 9) and diversity in teams. Against our targets of having 40% women in management and 30% target nationalities in executive leadership by 2025, we landed at 36% and 19%, respectively. Going forward, we will continue to report KPIs in accordance with regulatory requirements. As such, we have restated the KPI ‘Gender distribution at top management level’ in accordance with the definition of the Danish Financial Statements Act.
Safety
For 2025, we have added breakdowns on the number of lost time incidents (LTIs) and lost time incident frequency (LTIf) for own employees and non-employees (contractors) to comply with ESRS. Numbers for 2024 have been restated accordingly.
Engagement survey
In 2025, we changed our survey provider. This means that while the KPI and target of being in the top quartile of the global benchmark remained the same, and the 2025 result of 83 put us in the top 10% of the global benchmark, it is not directly comparable with the numbers reported in the previous year. Maersk’s score for 2025 will be the baseline for measuring engagement going forward, and prior years data have been removed from the reporting.
Governance
Whistleblower reports
Whistleblower cases reported now exclude ‘out-ofscope’ cases. These have previously been reported separately, therefore indicating no change in the methodology for classification. The prior year figures for ‘count of whistle-blower cases’ has been restated to align with the updated definition.
Discontinued KPIs
For 2025, we have discontinued the following KPIs: ‘employee relations and labour rights training’, ‘data and AI ethics training’, ‘operating expenditures (OPEX) in conjunction with major incidents and deposits’, and ‘% of operations covered by a risk assessment on compliance and business ethics risks’.
The employee relations and labour rights and data and AI ethics training KPI have been discontinued as the topics are now an integrated part of our Code of Conduct training. The operating expenditures (OPEX) in conjunction with major incidents and deposits KPI have been discontinued due to the immaterial amounts of operational expenditures Maersk has in relation to such activities. The % of operations covered by a risk assessment has been discontinued as more dynamic and function-specific assessments are being rolled out in the coming years.
Environmental information
Overview of our material impacts, risks and opportunities related to Environment.
Climate change mitigation
NO CHANGE Greenhouse gases emitted from our operations, suppliers and business partners in the value chain
Our operations and value chain activities result in direct and indirect emissions of greenhouse gases (GHG) impacting the environment. Climate change caused by emission of GHGs may also have adverse negative impacts on people’s livelihoods and well-being and on nature/biodiversity.
NO CHANGE Transition risks related to policies and market demand for decarbonisation of the shipping industry
Lack of political and market support for decarbonisation of the shipping industry present a reputational risk to Maersk of not being able to transition fast enough to meet our science-based targets.
NO CHANGE Climate advocacy/lobbying for policy interventions on energy transition in shipping and logistics
Financial opportunity related to stricter and more ambitious regulation towards industry-wide decarbonisation and a just and equitable transition to support our decarbonisation targets.
Climate change adaptation
NO CHANGE Financial risks due to physical impacts of climate change to assets and operations
impact Financial risk Financial opportunity
1 Amendment: Scope narrowed to focus on construction and expansion projects, where we potentially have the biggest impact. Previously, operation of assets were also in scope.
2 Amendment: Scope expanded to also include land and air transportation. Previously, only spread of species from ocean transportation was in scope.
Where Own operations
Value chain Time Short term
Pollution
NO CHANGE Air pollutants from vessels and landside/air transportation
Adverse impacts on air quality due to emissions of NOx, SOx PM, BC, CO and NMVOCs, primarily from our vessels.
NO CHANGE Pollution from hydrocarbon spills from vessels and landside operations and from containers lost at sea
Where
Where
Where
Adverse impacts to the environment and people related to hydrocarbon spills to the ocean, aquifers and soil from vessels and at our land-based facilities, and impacts from the loss of containers at sea, resulting in the release of pollutants into the ocean and accompanying costs for Maersk to clean up polluting materials.
NO CHANGE Discharged wastewater to the sea
(e.g. scrubber, bilge, sewage and grey water)
Where
Financial exposure of our assets towards climate-related physical risks/hazards and disruption of operations and networks. Where
operations Time
Adverse impacts arising from the discharge of wastewater from vessels, including scrubber water, bilge water, cargo bilge water, wash water, grey water, treated and untreated sewage and boiler water.
Ecosystem health and biodiversity
AMENDED1 Ecosystem degradation and biodiversity loss caused by land use and habitat disruption resulting from construction of land-based assets
The construction of warehouses and terminals can harm biodiversity and ecosystems, particularly when these are located in biodiversity-sensitive areas.
NO CHANGE Disturbance of species due to vessel traffic and underwater radiated noise
Vessel speed, underwater noise and disturbances from concentrated ship traffic can disrupt ecosystems and species, negatively affecting the development and reproduction of marine species. These impacts may lead to biodiversity loss and direct harm to species, such as whales.
AMENDED2 Spread of invasive species
Adverse impact of vessels transporting organisms (via biofouling) spread across large areas. The spread of invasive alien species can lead to the disruption of coastal ecosystems and contribute to the spread of disease.
Waste management
NO CHANGE Waste generation during operations
Adverse impact related to waste generation and disposal from operations, particularly in locations with inadequate waste management infrastructure.
Responsible ship recycling
NO CHANGE Environmental impacts during decommissioning of vessels
operations
operations
Adverse impacts related to breaking and recycling of own vessels, including waste generation and pollution as well as worker safety. Inability to recycle ships due to regulatory changes or increased number of vessels in the pipeline can also pose a financial risk to Maersk through increased cost of recycling.
Sourcing of critical resources
NO CHANGE Environmental impacts resulting from the steel value chain
Actual and potential adverse impact from the procurement of non-recycled steel for production of containers and vessels. The impacts are related to pollution, water use, ecosystem degradation, disturbance of species and potential biodiversity loss.
NO CHANGE Environmental impacts resulting from the fossil fuel and biofuel value chain
Actual and potential adverse impact from the procurement of fossil-based fuels and biofuels. The impacts are related to pollution, water use, ecosystem degradation, disturbance of species and potential biodiversity loss.
Climate change
In 2025, A.P. Moller - Maersk (Maersk) continued driving the investments and actions that underpin our transition plan towards our 2030 and 2040 validated science-based targets. While it is our firm belief that the energy transition is to the benefit of our customers and society at large, and to our shareholders and our business while mitigating transition risks, our progress comes with clear understanding of the complexity and dependencies of this journey. Our ability to progress against these targets remains greatly dependent on externalities that affected the entire transportation and logistics sector this year.
Ongoing attacks on commercial shipping in the Red Sea and Gulf of Aden necessitated the continued re-routing of Asia-Europe trade around the Cape of Good Hope for the safety of people, vessels and cargo. Similar to 2024, this led to longer voyages, capacity shortages and port congestion, which all contributed to increased fuel consumption and GHG emissions.
Trade tensions, tariff and policy volatility, as well as shipping rate fluctuations and inflationary pressures also created significant uncertainty in 2025. Climate-related disruptions further plagued supply chains, from flooding and drought to record heatwaves in Europe and severe storms in the US and Asia. These demanding realities challenged our customers’ ability to prioritise decarbonisation efforts.
The most significant dependency for decarbonisation at an industry level, however, remains the need for effective global climate regulation to close the price gap between traditional fossil fuels and low emission alternatives. The current cost of GHG emission abatement is simply too high for many customers, and closing this gap is critical to ensuring and accelerating shipping’s energy transition.
The decision of member states at the IMO Marine Environment Protection Committee meeting in October 2025 to postpone a vote on its Net-Zero Framework (NZF) for marine fuel standards and GHG emission pricing by one year – after previously approving draft regulations in April – illustrates the complexity of this challenge. The postponement represents a loss of momentum for the shipping industry’s efforts to decarbonise.
Maersk continues working to understand the implications of the delay of the NZF and to what extent it will impact our transition plan towards 2030. Against this complex backdrop, Maersk maintains its 2030 climate targets, fully aware of the difficulty and scale of the work ahead, as well as the critical dependency on global regulation. Our strategy is to act and invest decisively in areas we control, including network and asset efficiency, as outlined in our transition plan, while driving stakeholder engagement and advocating for progress in areas with external dependencies.
Climate transition plan towards 2030
Climate transition plan Financing our transition plan
Climate change mitigation
Greenhouse gases emitted from our operations, suppliers and business partners in the value chain
Transition risks related to policies and market demand for decarbonisation of the shipping industry
Climate advocacy/lobbying for policy interventions on energy transition in shipping and logistics
Maersk’s climate transition plan is built upon the key levers and scenarios that will enable us to achieve our climate transition plan targets for 2030 and 2040, while accounting for critical uncertainties and operational complexities. The plan covers GHG emissions from both our own operations and our broader value chain, encompassing our end-to-end logistics offerings across ocean, land and air.
With our current climate transition trajectory, we are aware that we have gaps, and we depend on certain external factors for successfully reaching our near-term 2030 climate targets. Our level of control varies across our decarbonisation levers, therefore our management approach to climate change mitigation must accommodate these dependencies as a key consideration.
Our transition plan encompasses two fundamental decarbonisation drivers – efficiency measures and energy shifts. Within energy efficiency, the first two levers focus on improving the efficiency of our network and assets – our largest contributors of shorter-term emissions reductions and areas where we have the greatest operational control. Strengthening efficiency across our Ocean network, including the Gemini Cooperation, launched in 2025, and our fleet of owned and time-chartered vessels and ongoing fleet renewal plan, are central to achieving our 2030 targets. While efficiency measures will deliver significant progress, they are only one part of the equation, and in isolation they will not be sufficient to reach net-zero emissions by 2040. The other critical driver of decarbonisation is energy shifts, covering three levers: electrification of owned assets, energy shifts of business partners, and fuel shifts.
Electrification, while for now a smaller contributor to Maersk’s transition plan, is central to reducing scope 1 emissions in logistics and terminal operations and scope 2 emissions where renewable electricity is available. We directly control the electrification of owned sites and assets in Logistics & Services and APM Terminals but depend on local infrastructure, technology and policy readiness for availability of renewable electricity. For non-owned assets, including third-party trucking, progress relies on local partners and EV charging and renewable grid capacity.
The fuel shift lever targets vessel emissions through alternative lower-emission fuels such as biodiesel, bio- and e-methanol and liquefied biomethane. Its success depends on scaling lower-GHG-emission fuels supply and infrastructure, which is in turn dependent on stronger global regulations such as the IMO Net-Zero Framework to close the cost gap with fossil fuels.
Towards 2030, efficiency measures will have the greatest impact on reducing GHG emissions in our transition plan. From 2030 to 2040, fuel shifts toward lower-emission energy solutions such as alternative marine fuels and electrified transport will become increasingly important. Finally, achieving our long-term 2040 goals is now more than ever dependent on developments in international policies and standards, fuel markets, infrastructure and renewable investments, and available technology.
Our transition plan is approved by the Executive Leadership Team and the Board of Directors. The transition plan includes three possible scenarios for the IMO Net-Zero Framework, optimistic, base case and pessimistic, each with different implications for lower-GHG-emission fuels scaling and demand and therefore a corresponding need to adapt our transition plan. With the postponement of IMO’s adoption of its NZF, uncertainty on pricing of fuels remain and while we are working to understand the implications of this to our plan, we see a possible move from a base-case fuel shift scenario towards a more pessimistic fuel shift scenario in our transition plan.
The levers and the current actions supporting our progress are unfolded in the respective sections of this chapter, with greater details on our impacts, risks and opportunities. The ‘Gaps to targets’ shown on the transition plan illustration pertain to emission reduction measures that rely on consensus in international policies and standards, acknowledgement and adoption of market-based mechanisms such as bookand-claim, and technological advancements.
Climate ambitions are central to our sustainability strategy and embedded in annual business planning. Required CAPEX and OPEX for achieving climate targets are allocated through business and financial planning for relevant segments.
The Chief Operating Officer owns the transition plan and execution, and the ELT and Board regularly discuss key market trends, progress against science-based targets, and the implications of IMO regulation to integrate the energy transition into business planning.
Our Green Finance Framework (GFF) enables funding for emission-reduction projects through various instruments. It aligns with EU Taxonomy criteria and covers areas such as newbuild and retrofitted vessels, warehouses, terminals and electrified equipment. Read more about the Green Finance Framework here.
Since 2021, Maersk has applied an internal shadow carbon price of USD 75 per tonne of GHG in investment decisions. This price, based on abatement costs and future carbon tax expectations, is used for projections – not actual emissions – to ensure regulatory and carbon cost considerations in all investment committee decisions.
Efficiency measures
The first and most impactful lever of our transition plan towards 2030 is improving the efficiency of our Ocean network. Asset efficiency is another lever for decarbonisation, which focuses on advancing the design, technology, and composition of our global fleet of more than 700 owned and time-chartered vessels.
Network efficiency
Throughout 2025, Maersk continued sailing around the Cape of Good Hope in Africa due to regional conflicts in the Middle East necessitating a further detour from the most efficient route. Red Sea re-routing and the longer journey has remained a challenge for our decarbonisation performance in terms of additional fuel consumption during the reporting year. Despite the challenges, in 2025, we improved the Energy Efficiency Operational Indicator (EEOI) to 10.8 gCO2/t nm, compared to 11.1 in 2024, marking a record low for the third consecutive year and bringing our fuel spend to a level closer to our 2022 baseline. The EEOI is a key measure of efficiency in Ocean operations, expressing emissions of CO2 per unit of transport work (tonne cargo times nautical mile).
2025 was also the year where Maersk made a significant transition from one ocean network operation to another. With the successful implementation of the Gemini Cooperation (Gemini), we have a continued focus on operational excellence and ensuring efficient execution of our entire network i.e. covering both Gemini and our remaining network.
Gemini implementation
In 2025, Gemini became fully operational in collaboration with our partner Hapag-Lloyd, who shares a net-zero emissions ambition. The new East-West network is built on an innovative design and includes 29 mainliner services and an extensive network of interregional shuttle services transshipping in strategically located hubs.
Our Gemini services nearly halve port calls per service compared to traditional networks, significantly reducing the number of stops a container makes from origin to destination. With its new modular design, it is better at absorbing disruptions without consuming additional fuel, i.e. if a vessel is delayed at one port, it does not need to speed across the entire service string to recover its schedule. In 2025, we continued exploring how the network supports our science-based targets and our customers’ decarbonisation goals.
Network execution
Our network execution efforts aim to maximise efficiency across both Gemini and the traditional Maersk ocean network by planning vessel journeys and managing sailing speeds. In terminals, Port Moves Per Hour (PMPH) is an important productivity measure of port call turnaround times. PMPH improvements allow vessels to maximise sailing times at lower speeds, which consumes less fuel, and to avoid too much speed variation. APM Terminals hubs have boosted productivity by 14% over two years, cutting time of port stays by 15-20%. Beyond physical assets, digital tools are also key efficiency drivers. Our Star Connect AI-driven fleet energy efficiency platform lets us improve journey planning and managing vessels while sailing. APM Terminals uses AI solutions like Port Mirror – a digital twin for simulating operations and predicting congestion – and Berth Planner for vessel line-ups and berth optimisation. Significant efficiency synergies also exist between our vessel and terminals operations, i.e. Gemini hubs will use the most efficient berth opportunities to further maximise sailing times and reduce sailing speeds.
Dependencies
Maersk maintains strong control over its ocean network and APM Terminals, enabling independent and continuous efficiency improvements through operational excellence.
Energy Efficiency Operational Indicator (EEOI) is a key measure of efficiency in Ocean operations, expressing emissions of CO2 per unit of transport work (tonne cargo times nautical mile).
Since 2021, we have improved our EEOI from 13.0 to 10.8 in 2025, indicating an efficiency improvement of 17%, primarily due to improved network and operational efficiency, stronger vessel utilisation and consumption of lower-GHG-emission fuels.
Integrating social impacts into the transition plan
Maersk’s transition plan is supported by strong policies and governance to manage the social implications of decarbonisation. This includes addressing workforce impacts from electrification and mitigating risks to local communities from lower-GHG-emission fuel development. Maersk also retains audit rights under offtake agreements during methanol facility construction and production.
Number of vessels
vessels
Own vessels – dual fuel
(TC) vessels
Asset efficiency is the second lever of our transition plan to mitigate climate change. The scope of our work within asset efficiency includes the overall design, onboard energy efficiency optimisation, technology and composition of our fleet, including a mix of owned and time-chartered vessels, and the operational flexibility this provides in reducing GHG emissions while also meeting network demand. Our ongoing fleet renewal strategy is another key factor for Maersk to ensure a gradual and continuous upgrade of our shipping capacity to dual-fuel vessels capable of sailing on lower-emission fuels. In addition to using loweremission fuels, the new vessels are more efficient in terms of fuel and energy consumption and replace less efficient older tonnage.
Efficiency retrofits of Maersk’s owned and time-chartered vessels
In 2025, Maersk progressed on its asset efficiency journey and completed more than 425 fuel saving initiatives on 230 of its owned vessels. During 2025, Maersk took delivery of 10 highly efficient dual-fuel methanol vessels, bringing our total fleet of dual fuel vessels to 19, with an additional six vessels scheduled for delivery in 2026. Our engagement with time-chartered (TC) vessel owners has proven more impactful to our asset decarbonisation efforts than initially expected and we have in addition to retrofitting our own fleet rolled out a large-scale efficiency programme for our time-chartered fleet in 2025. In total, we have completed approximately 215 retrofit initiatives on 150 TC vessels during the year. The TC vessels are not owned by Maersk and the investment cost for these initiatives is split between Maersk and the vessel owners. We will also take delivery of eight highly efficient dual-fuel TC vessels on long-term agreements in 2026.
Key vessel efficiency retrofits include changing propellers, adding pre-swirl devices that improve propulsive efficiency of the vessel, and replacing bulbous bows designed to match vessels actual operational hence minimising waves generated by vessels and lowering fuel consumption. Other retrofit initiatives include technologies that either minimise vessels required auxiliary energy demand or improve cost of producing energy. Examples include auxiliary engine waste heat recovery systems which enable steam generation from engine heat, and installation of shaft generator systems contributing to significant fuel savings.
Onboard energy and voyage optimisation
Another key driver for vessel efficiency is Maersk’s ongoing work to reduce fuel consumption from onboard energy production and to optimise voyages for both safety and energy efficiency. During 2025, new features were added to our suite of vessel performance products and sea, and shore colleagues have delivered strong progress in our focus areas of improving main engine specific fuel oil consumption, reducing the load of vessel operational activities (e.g., pumps, ventilation, heating/cooling, lights and auxiliary systems), and boosting the level of utilisation of onboard fuel saving technologies like waste-heatrecovery systems and shaft generators.
Dependencies
We rely on our TC owners for operating our 397 (as of 31 December 2025) chartered vessels with fuel efficiencies in mind. With the current scaling of our fleet renewal programme, we will have more of our TC fleet sailing on dual-fuel vessels from 2027 and onwards.
Energy shifts
The second part of our transition plan is shifting to energy with lower climate impact. In our Ocean business, this includes securing and switching to new fuels like biodiesel, e- and biomethanol and liquefied biomethane. In Logistics & Services and Terminals, we switch from using fossil fuel-powered trucks, warehouse vehicles and terminal container handling equipment to electric alternatives. This shift also includes the use of renewable electricity to reduce scope 2 emissions.
Fuel shifts
During 2025, we have seen low appetite for investments into fuel-shift projects and we expect continued slowdown in momentum for at least a year pending IMO’s decision in 2026. One significant milestone in 2025 was the first e-methanol bunkering of Laura Mærsk – the world’s first methanol-capable container vessel – at the opening of the world’s largest commercial e-methanol plant in Kassø, Denmark. The Kassø facility produces e-methanol using biogenic CO₂ from biogas and waste incineration combined with renewable electricity. As such, 2025 has been a year of learning for Maersk, since we now have hands-on experience in sourcing, taking delivery of, and operating vessels on e-methanol.
Maersk’s requirements for lower-GHG-emission fuels
1) All lower-GHG-emission fuels must be certified by a third party to ensure credibility and have a proof of sustainability.
2) We look at lifecycle GHG savings; all fuels must meet the minimum reductions of the EU Renewable Energy Directive which is 65% for biofuels and 70% for e-fuels compared to referenced fossil fuel.
Global regulation needed to support the energy transition Our transition plan is significantly dependent on the regulatory landscape, especially our ability to shift to lower-GHG-emission fuels. At an extraordinary session of the International Maritime Organization’s (IMO) Marine Environment Protection Committee in October 2025, member states decided to postpone a vote on the its Net-Zero Framework until later in 2026. This signature regulatory framework – the first of its kind in any sector – would lay the foundation for closing the price gap between lower-GHG-emission fuels and fossil-based fuels. The decision represents a loss of momentum in addressing climate change in the ocean supply chains that deliver 80% of the world’s goods. At the same time, the continued negotiations indicate that a majority of IMO member states back global regulation. Maersk will continue contributing its technical and industry expertise to these ongoing discussions throughout 2026, with the hope of reaching a positive vote later in the year.
Many companies, including Maersk, are acting on their targets. But with regulatory uncertainty delaying investments in vessels, fuel production and infrastructure, the price gap for low-GHG fuels is likely to persist. Maersk continues working to understand the implications of the delay to our transition plan.
In 2025, regional GHG regulatory frameworks, including FuelEU Maritime and EU ETS, have increased the complexity of operating a global network. With each regulation having different standards and criteria, the need for allocation of lower-GHG-emission fuels to cover the compliance requirements of different regulations and customer demands in the most cost-effective manner, complexity is added. To reduce complexity and create a level playing field, Maersk continues to support rules at a global level.
Advocating for ambitious global regulation
During 2025, Maersk has provided technical and industry expertise advocating for an ambitious IMO NZF agreement that will create a level playing field for all parts of the value chain and support closing the price gap between lower-GHG-emission and fossil fuels. Moreover, we have supported the development of fuel standards that ensures that broader sustainability impacts are considered, covering not only climate, but also critical environmental and social topics.
Developing our fuel portfolio
At Maersk, we pursue a multi-fuel and technology pathway approach, and during 2025, we continued to expand and execute our fuel portfolio strategy. With high uncertainty in the lower-GHG-emission fuels market, we recognise the need to keep expanding our portfolio while preserving a fuel-agnostic strategy to ensure continued relevance. We will continue our approach for fuel testing, including exploring the use of ethanol, and in the longer term we expect that our portfolio will also include other fuels and technologies such as ammonia.
3) Maersk’s preference is for second-generation feedstocks such as wastes and residues.
As part of our ongoing efforts to secure a robust and responsible pathway toward full decarbonisation, in 2025 we initiated a targeted review of our fuel sustainability policies to assess the potential role of selected first-generation, crop-based fuels such as ethanol in our transitional fuel mix. This review is being conducted under robust sustainability criteria covering lifecycle greenhouse-gas emissions, traceability, certification standards and responsible sourcing practices, and reflects our efforts to secure reliable access to low-GHG-emissions fuels during the global scale-up of e- and bio-methanol and other advanced alternatives. The review aims to strengthen resilience in our fuel strategy and ensure alignment with evolving regulatory frameworks while upholding our climate ambition to reach net-zero greenhouse gas emissions by 2040.
In addition to climate impacts, when assessing the lifecycle impact of new fuels, we consider a broad range of indicators such as deforestation. We use lifecycle assessment and also consider indirect effects of fuel use such as indirect land use. Our lifecycle analysis of prioritised current and possible future lower-GHG-emission fuels for ocean shipping is governed by two policies, which are available online:
Maersk methanol sustainability requirements
Maersk biofuel sustainability requirements
Securing lower-GHG-emission fuels for current and future operations
As part of our multi-fuel portfolio approach, Maersk signed an initial framework fuel supply agreement with UK based Avenir Marine Limited which is a wholly owned subsidiary of Avenir LNG Limited in H2 2025 to deliver liquefied biomethane, a lower-GHG-emission fuel also known as bio-LNG. The first volumes are expected in 2027 in alignment with the first dual-fuel liquefied gas vessels entering Maersk’s time-chartered fleet.
Trials onboard Laura Mærsk also took place in 2025 with e-methanol fuel blends mixed with 10% and 50% ethanol. The goal is to create flexibility so customers with different abatement cost sensitivities can continue working towards their decarbonisation targets. The trials will continue in 2026, as Maersk learns the impacts of different fuel blends on vessel engines and operations.
In 2026, Maersk will receive the first volumes of bio- and e-methanol from our 2023 landmark offtake agreement with Goldwind in China as the facility nears commercial production. Maersk’s target to offtake a significant 500,000 tonnes of fuel from Goldwind annually creates market demand certainty, enabling technology and cost efficiency investments that will bring scale to lower-GHG-emission fuel markets which does not exist today. Maersk also signed a long-term biomethanol offtake agreement with LONGi Green Energy Technology Co., Ltd. in 2024 which is in development.
Dependencies
Adoption of a global framework via the IMO. The availability and flexibility of lower-GHG-emission fuel blends that are allowed in different regional markets is a second external dependency.
Electrification of owned assets
Our Terminal and Logistics & Services operations are not significant contributors to Maersk’s overall GHG emissions, however electrification of terminal, warehousing, and land transportation activities are key levers that contribute to our science-based targets as part of our energy transition plan. Electrification also brings benefits far beyond emissions. Cleaner air means healthier communities. Less equipment noise creates better working conditions for operators. And energy independence reduces reliance on diesel imports, which is vital in some markets.
Electrification of terminals
For APM Terminals, the main levers for reducing GHG emissions are: 1) the switch from fossil-fuelled equipment to electric container handling equipment, targeting scope 1 emissions; 2) enabling a reliable supply of renewable energy for our terminals, targeting scope 2 emissions; and 3) the deployment of shore-to-ship power solutions for vessels at berth to reduce GHG emissions from auxiliary engines. From 2023 to 2024, APM Terminals conducted pilots to streamline operations for large scale adoption of Battery Electric Container Handling Equipment (BE-CHE), including training employees how to safely operate BE-CHE equipment. In 2025, the focus shifted to broader deployment. This includes the procurement of individual BE-CHE in, e.g., Kalundborg, Denmark and Khalifa Bin Salman Port, Bahrain, to replace assets at end of life. It also includes the milestone of our newbuild Rijeka Gateway terminal in Croatia in September 2025, which is fully powered by renewable electricity and run almost entirely with electric equipment.
Several types of BE-CHE, e.g., electric trucks, have become standardised and reached technical maturity. Other key terminal equipment, such as straddle-carriers, remain challenging due to a lack of industry standards on, e.g., charging solutions. To accelerate adoption, APM Terminals continues to run straddle-carrier pilots and, together with the Zero Emission Port Alliance, published industry guides on standardising battery electric Straddle Carriers, battery safety and battery circularity. APM Terminals also signed a landmark agreement with SANY Marine in June 2025 to replace some 500 diesel-powered terminal tractors with battery-electric models by 2030, and entered a strategic
partnership with Contemporary Amperex Technology Co., Limited – a global leader in electric battery technology – to develop high-performance batteries and system-level solutions for BE-CHE.
To address our scope 2 emissions, APM Terminals is targeting to shift to 100% renewable electricity by 2030. In 2025, approx. 62% of APM Terminals’ electricity was powered through renewable sources, up from 46% in 2024. This progress was mostly driven by securing a Power Purchase Agreement covering our APM Terminals Tangier TC1 and MEDPort Tangier terminals in Morocco.
These initiatives have resulted in a reduction of more than 16% in absolute scope 1 and 2 emissions in our Terminals in 2025 compared to our 2022 baseline, up from 8% in 2024.
Moving towards 2030, the focus will be 1) deploying BE-CHE equipment at scale in all terminals; 2) enabling a reliable and renewable supply of electricity and 3) designing and building efficient shore power solutions in partnership with port authorities.
Electrification of Logistics & Services activities
In 2025 we completed deployment of the planned incremental 17 own electric trucks in Germany coupled with the expansion of charging infrastructure deployments, with our location in Duisburg being a prime example. We also made a first-time investment into 2 heavy duty electric trucks in Vietnam. Both cases with daily operation run by local trucking partners. We continue to see market demand for electric trucks, but the business case for cost parity is still not a given in all cases and require further market pressure from the full eco-system. Further it underlines the importance of a cross-party collaboration with our trucking partners to keep expanding and scaling our offerings across locations.
Improving the energy efficiency of our land-based logistics facilities including warehouses, distribution centres and depots, is another key action area. It includes the electrification of equipment such material and container handling equipment, and addressing the energy efficiency of our buildings. Maersk opened two state-of-the-art warehouse facilities in Asia during 2025 featuring advanced technologies to minimise their environmental footprint, as well as sophisticated warehouse management and automation systems.
In Lin-gang, Shanghai, we opened a 113,000 m2 omni-channel fulfilment logistics centre to serve customers in China, across Asia-Pacific,
and beyond. A Maersk Mega Distribution Centre (DC) also opened in Malaysia, boosting our local warehouse footprint by over 30% and creating our largest Asia Pacific contract logistics facility. Both sites incorporate solutions for energy efficiency, water conservation and lower-impact design, including solar panel rooftop installations, smart LED lighting and rainwater harvesting systems. Lin-gang expects its solar panels to meet 70% of its electricity demand and has applied for LEED Gold certification. The Mega DC is Green Building Index (GBI) Gold and LEED Gold certified.
We continue to forecast that the transition to renewable electricity is expected to generate savings compared to traditional electricity sources in aggregate across our Terminals and Logistics & Services portfolio.
Dependencies
Electrification of terminals
Electrifying terminal equipment is dependent on standardisation and technical maturity, which drives cost parity and therefore scale. The ability to operate electric equipment is dependent on the stability and reliability of the local grid infrastructure, which may require investments to ensure sufficient capacity and back up in case of outages.
Terminals are dependent on the availability of renewable electricity from local grid operators to reach its renewable energy targets. Many terminals are located in areas where renewable energy markets are not mature.
Energy shifts of business partners
In our landside logistics business, we continued working with our business partners to provide low emission transport and customer emission visibility in 2025. The two main customer value drivers are to get reliable and as low emitting transport as possible; and to have emission visibility for their own reporting.
Energy shifts of our business partners is a key lever in Maersk’s transition plan to reduce our scope 3 emissions. As Maersk follows an ‘asset light’ approach to road transportation investments, we are highly reliant on local partners to add lower-emission landside transport. The current ecosystem is diverse and scattered, however the industry is approaching a tipping point and the business case for local partners to invest in EV assets is improving and is expected to drive adoption at scale in the coming years.
In Latin America, Maersk partnered with a local transportation provider to introduce electric trucks into its service offerings in 2025, including 24 tonne capacity cargo trucks with a range of 220-300 km per charge. These electric trucks are supported by 100% renewable energy charging stations, and designed for urban, interurban, and port routes.
In Denmark, Maersk is in the process of implementing electric vehicles for the customer Bestseller in close collaboration with several local trucking partners. The first electric trucks were deployed in 2025 with scaling plans in place for 2026.
published a guide for suppliers on how to implement EV trucking solutions, including planning, process, and risk and cost avoidance.
Together with SFC, Maersk also supported and co-created an EV Deployment Guideline to be openly shared with SME truckers to take advantage of the learnings made by Maersk in own early technology investment and deployments and build confidence to make the energy transition with their own fleets.
Dependencies
Our ability to deploy solutions for our customers is dependent on three interrelated factors; cost parity vs. traditional fossil fuel transport, which lowers costs and thereby creates demand certainty. Demand certainty lowers investment risks, which catalyses grid capacity and charging infrastructure investments, which in turn drives cost parity.
Especially legislators play a key role in setting ambitious but firm medium to long-term emission reduction targets that will act as guiding directive for demand certainty leading to cost parity, enabling investments into scaling across the eco-system from cost of the vehicle to grid capacity and public charging infrastructure.
Electrification of Logistics & Services activities
For Logistics & Services, our ‘asset light’ approach to trucking and rail places a high dependence on local partners to add capacity and develop local low-emission offerings.
In many locations, Maersk leases logistics facility space or does not operate the buildings. Therefore, we are dependent on building/property owners and facility management companies to make efficiency investments.
In Czech Republic, Maersk continued expanding our offerings of transportation with electric trucks to new customers. Together with a local trucking partner, we deployed several vehicles for the customer Škoda Auto a.s. These trucks, with a range of 500+ km on a single charge, have demonstrated that technology is now at a stage where electric trucks can be deployed without daily operational impact.
Partnering for change
Maersk has during 2025 partnered with the Smart Freight Center (SFC) and contributed to its Fleet Electrification Coalition that promotes the electrification of trucking to reduce GHG emissions of road transportation. As an example of this, we are supporting an SFC pilot to create a long-haul EV truck corridor along the key trade route between Los Angeles, California, and El Paso, Texas, and have
Top 5 assets exposed to physical climate risks
APM Terminals
Lázaro Cárdenas
Lazaro, Mexico
revenue loss 2025 (AEL)
Brasil Terminal
Portuário
Portuario, Brazil
Material damage and revenue loss 2025 (AEL)
Physical climate risks exposure
Climate change adaptation
Financial risks due to physical impacts of climate change to assets and operations
The global socio-economic cost of climate-induced severe weather events is staggering, and 2025 was marked by devastating wildfires in North America and Europe and flooding in many countries in Africa and Asia.
SSP1: Sustainability 1-2°C
SSP2:
Port of Tanjung Pelepas
Tanjung Pelepas, Malaysia
Material damage and revenue loss 2025 (AEL)1
South
China
Oceangate
Container Terminal Guangzhou, China
South Florida Container Terminal Miami, USA
In 2025, Maersk conducted a climate risk assessment to evaluate physical impacts on land-based assets and operations. The study covered more than 1,400 own and third-party assets, including terminals, warehouses, offices, and data centres, to identify exposure to hazards such as flooding, storm surge, windstorms, heatwaves and water stress. The assessment was conducted in partnership with Swiss Re using its Risk Data Services platform, which enabled hazard modelling and risk quantification. The study applied three climate scenarios based on shared socioeconomic pathways (SSPs), namely SSP1–2.6 representing a sustainability trajectory with 1-2°C warming, SSP2–4.5 as a middle-of-the-road scenario with 2-3°C warming, and SSP5–8.5 reflecting fossil-fuelled development with 3-5°C warming. The primary modelling was based on SSP2–4.5. Assets were mapped against prevailing hazards, and Annual Expected Loss (AEL) was calculated for property damage and business interruption, including projections for 2050 and 2100.
The assessment combined portfolio-level and asset-level analysis, identifying the top 100 assets by value and highlighting localised exposures and regional hotspots in the United States, Europe and China. Based on these findings, Maersk is developing resilience strategies, site-specific assessments and mandatory climate risk reviews for new projects. On-site assessments at three APM Terminals, including Lázaro, Mobile and Pipavav, led to a focus for future actions such as topographical surveys, infrastructure reviews, evaluation of off-site dependencies, enhanced maintenance and emergency response plans, and expanded property programs supported by a central climate documentation repository. While we do not have a specific target for physical climate risks, our ability to deliver on our customer commitments requires us to ensure that our network is operational. As such, we have contingency plans in place for hubs and assets across our operations.
EU Taxonomy reporting
The EU Taxonomy is a classification system for which economic activities can be considered environmentally sustainable. The EU Taxonomy regulation is evolving, and our reporting is evolving accordingly. For 2025, Maersk has applied new simplified reporting tables and guidance for screening our maritime transport activities. These changes have impacted both our presentation and numbers. See the full overview of the results on pages 116-118
For 2025, our aligned revenue increased to 9%, up from 5% in 2024. Similarly, our taxonomy-aligned CAPEX reached 19% in 2025, on par with 2024. Taxonomy-related OPEX is less material to Maersk due to the way it is defined under the regulation, as it is limited to repair and maintenance costs and does not include running costs such as fuel, which represent Maersk’s most material operating expenditures.
Of the aligned revenue, 5% or USD 2.4bn relates to Ocean transportation activities. A further USD 17m (0.03%) originates from activities in Logistics & Services, such as road and rail transport. The remaining 4%, or USD 2.2bn, has been generated by our Terminals.
Of the aligned CAPEX, 15% or USD 1.3bn relates to Ocean transportation. This includes USD 1.3bn milestone payments for new vessel construction and USD 19m in CAPEX additions for enhancements of existing aligned vessels. In addition, we invested USD 2m in EU Taxonomy aligned retrofits of our existing fleet.
Lastly, while there was no aligned CAPEX in Logistics & Services, the electrification of Terminals contributed 4%, or USD 332m, of aligned CAPEX in 2025.
All of Maersk’s aligned OPEX 11%, or USD 106m relates to the repair and maintenance of aligned, revenue generating assets such as vessels, trucks and terminals.
Although taxonomy-aligned activities continue to increase, Maersk is still in the early stages of its journey to decarbonise the end-to-end value chain. We therefore see a high share of eligible revenue, CAPEX and OPEX, but a significantly lower share of revenue, CAPEX and OPEX, related to taxonomy-aligned activities. As aligned assets come into operation, we see a modest, gradual increase of taxonomy-aligned revenue and a continued, steady increase in the taxonomy-aligned CAPEX in line with our decarbonisation strategy and transition plan going forward.
Activities included in Maersk’s EU Taxonomy reporting1
Ocean
6.10 Sea and coastal freight water transport
Aligned revenue in the Ocean segment is related to 22 conventional vessels as well as 19 dual-fuel vessels that meet the technical screening criteria. Aligned CAPEX relates to 1) capital expenses in relation to existing vessels; and 2) milestone payments for the ordered dual-fuel vessels incurred during the year. Aligned OPEX is the repair and maintenance expenditures in relation to aligned vessels incurred during the year. Non-eligible Ocean activities include revenue related to Maersk Energy Markets (marine fuel sourcing and sales) and any CAPEX/OPEX related to containers, which fall outside the scope of eligible maritime transport activities.
6.12 Retrofitting of sea and coastal freight and passenger water transport
Aligned CAPEX represents efforts to improve our existing fleet with regards to efficiency and dual-fuel capabilities.
Logistics & Services
6.6 Freight transport services by road
6.19 Passenger and freight air transport
Freight transport by road and air are anchored within Logistics & Services segment. Only freight done by electrified assets is considered aligned in relation to road transport. Non-eligible Logistics & Services activities consist of a broad range of logistics, fulfilment, warehousing, customs, cold-chain, depot, and IT-enabled supply-chain services that support and optimise customer operations but fall outside taxonomy-defined transport activities.
Terminals
6.1 & 6.2 Passenger interurban and freight rail transport
Passenger and freight rail transport is anchored with the Terminals (and Logistics & Services) segment. Only transport done by electrified assets is considered aligned.
6.16 Infrastructure enabling low-carbon water transport
Aligned revenue, CAPEX and OPEX in the Terminals segment, represent efforts to decarbonise port infrastructure, supporting ocean-based transportation, and are linked to electrical equipment used to operate the terminals.
Non-eligible activities relate to terminal concession rights and operational software.
Cross segments
7.4 Installation, maintenance and repair of charging stations
Aligned CAPEX represents investments into charging stations across all business segments.
7.6 Installation, maintenance and repair of renewable energy technologies
Aligned CAPEX represents investments into on-site renewable electricity installations across all business segments.
7.7 Acquisition and ownership of buildings
Eligible CAPEX and OPEX reflect our expenditures for leased and owned buildings across the business, such as logistics facilities, warehouses, and office buildings.
1 For more details on what is included in EU Taxonomy reporting please see our accounting policies on page 118
Taxonomy-aligned
Taxonomy-eligible but not aligned
Non-eligible
Performance data
Gross scopes 1, 2, 3 and total GHG emissions
E1-6_01
E1-6_08
E1-6_02
E1-6_04 E1-6_07
E1-6_09 E1-6_10 E1-6_11
E1-6_12
In 2025, there has been a 2% increase in total GHG emissions. This is primarily driven by an increase Scope 3 emissions by 4% compared to 2024. Scope 1 emissions remained stable in 2025 compared to 2024. The achieved efficiency in the ocean network and implementation of the Gemini Cooperation (Gemini) during the year as well as retrofitting of vessels and voyage optimisation was offset by the continued need for re-routing of vessels around the Cape of Good Hope and increased fuel consumption from air cargo transportation.
The increase in scope 3 was driven mainly by increased emissions in Category 2, Capital goods, Category 11, Use of sold products and Category 12, End of life treatment of sold products, related to Maersk taking delivery of an increased number of vessels, and increased volumes of traded maritime fuels, and containers sold in 2025 compared to 2024.
Our location-based scope 2 emissions have increased in 2025 compared to 2024 due to our electrification efforts. At the same time, our market-based scope 2 emissions showed a reduction of 12% due to switching to renewable sources of electricity in Morocco and increased usage of solar power in Bahrain.
ACCOUNTING POLICIES
Scope and consolidation
The consolidation of greenhouse gas (GHG) emissions data is based on the financial consolidation approach and stated in accordance with the GHG Protocol: direct emissions from owned and long-term leased-in assets as defined by IFRS 16 (scope 1), indirect emissions from purchased electricity and district heating (scope 2), and value chain emissions (scope 3), which include emissions related to short-term leased-in and long-term leased out assets as defined by IFRS 16.
Emissions reporting for operational controlled entities
In 2025, it has been assessed that Maersk does not have operationally controlled investees in e.g., associates, joint ventures or unconsolidated subsidiaries. This implies that the scope and treatment of entities under financial control and operation control do not differ for 2025. Thus, no separate disclosures are provided for Maersk’s GHG emissions, including operationally controlled investees in e.g., associates, joint ventures or unconsolidated subsidiaries. Maersk is annually reviewing its contractual arrangements in line with CSRD requirements.
Emission conversions and calculations
GHG emissions are calculated using conversion factors for energy consumption and other GHG gases. Primary schemes used for activity-based calculations are Sixth Assessment Report (AR6, 2022), European Monitoring and Evaluation Programme/European Economic Area (EMEP/EEA air pollutants database, 2023), International Energy Agency (IEA, 2024), Global Logistics Emissions Council (GLEC) framework, (updated 2025), and Department for Environment, Food and Rural Affairs (UK) (2025). The Comprehensive Environmental Data Archive 6 (CEDA 6) (2022) is used for spend-based estimates.
Relevant spend emissions are adjusted using the latest data from Oxford Economics (Q3 2025) to ensure comparability with the base year of the spend-based emissions factors, adjusting for inflation rates. The principles for choosing among the schemes for default conversion factors are:
• The most recent and internationally recognised schemes are preferred
• Specific industry schemes can be included when not in conflict with the above.
Gross scope 1 GHG emissions
Gross scope 1 GHG emissions is the sum of all UNFCCC/ Kyoto gases converted to CO₂ equivalents. UNFCCC/Kyoto gases comprise: CO₂, CH₄ and N₂O, which are calculated based on amount of direct energy (i.e. the fuels stated under ‘Energy consumption’) that are consumed/combusted, and HFCs, PFCs, SF₆ and NF₃, which are based on direct consumption at entities/vessels controlled by Maersk.
Percentage of scope 1 GHG emissions from regulated emission trading schemes
Percentage of scope 1 GHG emissions from regulated emission trading schemes is the share of Maersk’s gross scope 1 GHG emissions covered by the EU ETS.
Gross location-based scope 2 GHG emissions
Gross location-based scope 2 GHG emissions is the CO₂ equivalents’ converted sum of CO₂, CH₄ and N₂O, calculated based on consumed electricity and district heating bought from a third party and using location-based IEA emission factors.
Gross market-based scope 2 emissions
Gross market-based scope 2 GHG emissions is the CO₂ equivalents’ converted sum of CO₂, CH₄ and N₂O, calculated based on consumed electricity and district heating bought from a third party and using country-specific market-based factors for EU countries and the US and IEA factors for other countries. In markets where Maersk procures renewable electricity, this is used as part calculating the gross market-based scope GHG emissions, provided appropriate EAC documentation is available.
Significant scope 3 GHG emissions
Value chain GHG emissions (scope 3) are the CO₂ equivalents’ converted sum of CO₂, CH₄ and N₂O from Maersk’s value chain activities. Scope 3 emissions are calculated primarily using activity data, and when not available, complemented with spend data. Activity data such as transport work and energy quantities are used to calculate the most material categories such as 3, 4 and 11. Categories 1, 2 and 4 (services where no direct activity data) are computed using spend data. Of the 15 scope 3 categories in the GHG Protocol, 12 categories are currently determined as applicable to Maersk’s business model and activities. The excluded categories are:
• Category 9 – downstream transportation and distribution, since we do not produce products that we need transportation for.
• Category 10 – processing of sold products, since our business model is transport and logistics services for our customers’ goods.
• Category 14 – franchises, since we do not have franchises.
Thus, value chain GHG emissions comprise of emissions relating to:
• Category 1 – purchased goods and services, which are reported based on financial data and includes goods and services for our operations.
• Category 2 – capital goods, which is reported based on life cycle assessments (based on LCA methodology) and reported capital expenditure (spend based). This category covers capital investments such as new asset purchases, retrofit of vessels and dry docking. We include the full scope 3 impact in the year of investment.
• Category 3 – fuel and energy-related activities, which is reported based on actual fuel procured and consumed.
• Category 4 – upstream transportation and distribution, which is reported based on transportation data recorded in operational systems. The resulting emissions are estimated following the Global Logistics Emissions Council (GLEC) methodology per transport type. For supporting logistics-related activities like towage services, financial data is multiplied by relevant emission factors.
• Category 5 – waste generated in operations, which is reported based on amounts and types of waste. The enhanced waste reporting using actual amounts from Maersk A/S vessels has helped improve the corresponding scope 3 emissions, both hazardous (incl. sludge) and non-hazardous waste.
• Category 6 – business travel, which is reported based on activity-data for our direct air travel and procurement data for other business travel related activities.
• Category 7 – employee commuting, which is reported based on employee headcounts per location, estimated commuting distance and transportation modes.
• Category 8 – upstream leased assets, which is a spendbased estimate of emissions from leased assets that is not reported in scope 1 and 2.
• Category 11 – use of sold products, is based on activity data for fossil fuels distributed by Maersk to third parties, estimated fuel use of liners calling APM Terminals, and estimated emissions from the use of refrigerated containers produced by Maersk Container Industry.
• Category 12 – end-of-life treatment of sold products, which is reported based on activity data for end of life and retreatment of sold new and second-hand reefers.
• Category 13 – downstream leased assets, which is reported based on fuel consumption from vessels, tugs and planes leased to third parties.
• Category 15 – investments, emissions are calculated to the extent of the equity share in non-controlled joint ventures and associates using financial data and corresponding factors. Total gross scope 3 emissions is the emissions related to the 12 significant scope 3 categories outlined above.
Total GHG emissions
Total GHG emissions have been stated as both the sum of scope 1, scope 2 – location-based and scope 3 emissions as well as scope 1, scope 2 – market-based and scope 3 emissions.
Annual % target /base year
The annual % target/base year is the percent average annual emission reduction per year required to meet Maersk’s 2030 target. The annual % target/base year is calculated using the following formula:
1emissions in target year emissions in target base year target year – base year
Uncertainties and estimates
GHG emissions from upstream transportation and distribution activities are modelled using the EcoTransIT World (ETW) online tool. In cases, where Maersk does not have access to information of the actual fuel consumption and/or route information of third-party transportation activities, we use the ETW and its worldwide transportation route network and vehicle model data set to estimate the emissions from such activities. Maersk uses actual activity data from its transport management systems for the GHG modelling in ETW.
The actual data from Maersk’s systems that are used for the modelling are:
• Origin and destination details.
• Carrier mode to be considered for segregation of transport mode. Presently it can contain ocean, air, trucks, rail and vans.
• Carrier actual weight.
When using spend data to estimate emissions in purchased goods and services, as well as some procured services and transport, the uncertainty of using adjusted spend factors as proxy for activity is higher. Maersk is working on reducing the reliance on spend based data by upgrading its systems and accounting processes, and will limit the use of these sources to improve the accuracy of its calculations.
The share of Maersk’s total scope 3 emissions for 2025 that have been modelled using the ETW tool is 30.44%.
Progress towards Maersk’s 2030 and 2040 targets
During 2025, Maersk’s absolute scope 1 emissions remained stable, our renewable electricity sourcing increased to 38%, compared to 29%, and our scope 3 emissions increased by 4%, compared to 2024.
Compared to Maersk’s baseline in 2022, we have reduced our absolute scope 1 emissions by 1% and scope 2 market-based emissions by 26%. Our scope 3 emissions have increased by 7% in the same period, primarily driven by an increased amount of maritime fuel volumes traded and containers sold, as well as taking delivery of more dual-fuel vessels during 2025 compared to previous years.
With regards to Maersk’s sub-targets regarding maritime operations, we had a 1% reduction in scope 1 and scope 3 WTW emissions from own container shipping operations and a 10% reduction from subcontracted container shipping operations, compared to our 2022 baseline. The scope 1 emission reduction from all other sources was 11% and 22% for fuel and energy-related activities combined with upstream transportation, owing primarily to a decrease in marine diesel oil consumption.
ACCOUNTING POLICIES
Main targets
Absolute reduction in total scope 1 emissions
The absolute reduction in total scope 1 emissions is stated as a percentage reduction of scope 1 in the reporting year (2025) compared to the base year (2022) and previous year.
Renewable electricity sourcing (scope 2)
Renewable electricity sourcing is stated as the percentage of renewable electricity consumption of the total electricity consumption in the reporting year.
Absolute reduction in total scope 3 emissions
The absolute reduction in total scope 3 emissions is stated as a percentage reduction of scope 3 in the reporting year (2025) compared to the base year (2022) and previous year.
Sub-targets – Marine operations
Absolute reduction in scope 1 and scope 3 well-to-wake emissions from own container shipping operations
The absolute reduction in scope 1 and scope 3 well-towake emissions from own container shipping operations is stated as the percentage reduction of scope 1 and scope 3 well-to-wake emissions from own container shipping operations in the reporting year (2025) compared to the base year (2022) and previous year.
Absolute reduction in scope 3 well-to-wake emissions from subcontracted container shipping operations
The absolute reduction in scope 3 well-to-wake emissions from subcontracted container shipping operations is stated as the percentage reduction of scope 3 well-towake emissions from subcontracted container shipping operations in the reporting year (2025) compared to the base year (2022) and previous year.
Sub-targets – Other operations
Absolute reduction in scope 1 emissions from all other sources
The absolute reduction in scope 1 emissions from all other sources is stated as the percentage reduction of scope 1 emissions for all other (non-maritime) operations, including emissions from terminals, landside logistics and air freight operations in the reporting year (2025) compared to the base year (2022).
Absolute reduction in scope 3 Fuel and energyrelated activities and upstream transportation
The absolute reduction in scope 3 Fuel and energyrelated activities and Upstream transportation emissions is stated as the percentage reduction of scope 3 Fuel and energy related activities (Category 3) and Upstream transportation (Category 4) for all other (non-maritime) operations in the reporting year (2025) compared to the base year (2022) and previous year.
Absolute reduction in scope 3 emissions from the use of sold products covering distributed fossil fuels
The absolute reduction in scope 3 Use of sold products covering distributed fossil fuels is stated as the percentage reduction of scope 3 Use of sold products (Category 11) relating to distributed fossil fuels in the reporting year (2025) compared to the base year (2022) and previous year.
Absolute reduction in scope 3 emissions from all other sources
Absolute reduction in scope 3 emissions from all other sources is stated as the percentage reduction of scope 3 emissions for all other (non-maritime) operations in the reporting year (2025) compared to the base year (2022) and previous year.
Annual % target/base year
The annual % target/base year is the percent average annual emission reduction per year required to meet Maersk’s 2030 target. The annual % target/base year is calculated using the following formula:
1emissions in target year emissions in target base year target year – base year
How Maersk ensures consistency of GHG emission reduction targets with GHG inventory boundaries
Maersk has validated near-term and net-zero climate targets by Science Based Targets initiative (SBTi), a widely recognised global standard for corporate target setting. Maersk’s climate inventory follows the requirements of the Greenhouse Gas Protocol, covering all greenhouse gas emissions.
Maersk’s climate inventory follows the financial control approach for target setting, which translates to a 100% inclusion of emissions from activities by subsidiaries and an equity share of emissions for joint ventures and associates included under scope 3.15 Investments.
Maersk currently has near-term and net-zero climate targets for scope 1, 2 and 3, and complementary sub targets in line with the requirements of SBTi’s maritime sector decarbonisation guidance. Maersk’s near-term target covers >95% of scope 1 and 2 and >66% of scope 3; the net-zero coverage is >95% and >90% respectively.
These thresholds are in line with SBTi requirements. The emissions reduction targets are gross targets, meaning that GHG removals, carbon credits or avoided emissions are not currently considered as means of achieving the GHG emission reductions.
Maersk ensures its climate targets are relevant and follow the latest climate standards by means of a recalculation policy of climate inventories and targets. The recalculation policy is publicly available and follows the latest requirements of the Greenhouse Gas Protocol and Science Based Targets initiative (SBTi), outlining the types of changes and thresholds that trigger a recalculation and restatement of previously reported greenhouse gas emissions. Please see the Maersk recalculation policy. Maersk endeavours to ensure consistency, accuracy, completeness and comparability in public reporting of emissions and externally committed greenhouse gas reduction targets.
GHG emission intensity
The GHG emission intensity has increased compared to 2024, with location-based GHG emission intensity being 1.59k CO2e/USDm and a slightly lower market-based emission intensity 1.58k CO2e/USDm. This change is due to an increase in total GHG emissions compared to 2024 along with a corresponding decrease in revenue for the year.
ACCOUNTING POLICIES
GHG emission intensity
GHG emission intensity is the GHG emissions expressed per unit of revenue (million) – based on total GHG emissions (sum of reported scope 1, scope 2 – location-based and scope 3 emissions) and revenue as stated in the income statement of the consolidated financial statements.
Ocean energy efficiency (EEOI)
1 Not covered by the Independent Auditor’s limited assurance report.
In 2025, Maersk continued to increase the energy efficiency of our fleet, despite the continued fuel consumption increase due to longer distances around the Cape of Good Hope for part of the fleet. The full implementation of East-West network (via the Gemini Cooperation) produced a significant EEOI improvement in the second half of the year, stemming from a more efficient network design and execution. Additionally, Maersk has continuously focused on network optimisation and maintained a relentless focus on vessel utilisation within our operations, resulting in year-on-year efficiency improvement (measured in grams CO2 per tonne-nautical mile). Maersk has also continued to invest in and expand proven initiatives, including operational efficiency via Star-Connect, and driving improved performance with terminals. Retrofits focused on energy efficiency and shore power enablement in both owned and time-chartered vessels have also continued successfully.
These initiatives have delivered efficiencies at a scale to significantly reduce the impact of increased fuel consumption caused by longer routes and have enabled us to continue driving down EEOI, achieving a record of 10.8 in 2025, down from 11.1 in 2024
ACCOUNTING POLICIES
Energy efficiency operational indicator (EEOI)
The energy efficiency operational indicator (EEOI) covers container vessels under Maersk’s operation. EEOI is defined by IMO in MEPC.1/Circ.684 and is calculated as gCO₂/(Tonne cargo x Nm). In practice, we calculate EEOI on voyage level and aggregate it in the following way:
(g CO2 voy 'n1' + g CO2 voy 'n2' +...+ g CO2 voy 'nx') ((Tonne cargo x Nm)voy 'n1' + (Tonne cargo x Nm)voy 'n2' +...+ (Tonne cargo x Nm)voy 'nx')
The reported data from vessels is transmitted ashore on a 24 hour basis and consolidated into consumption reports. Calculations are then made to ascertain the tonnes of cargo moved as well as distance sailed. Further, fuel consumption is converted into CO2 emissions using relevant emission factors per fuel type reported. Calculations are made on a per voyage level and aggregated afterwards across voyages and divided by the aggregated transport work for the period to arrive at the EEOI figure for the reporting period.
The data sources are:
• g CO₂ – Based on fuel consumption, from departure voyage 1, to departure voyage 2, multiplied with relevant CO₂ factor (3.114 for HFO and LFO, 3.206 for MDO and 0 for biofuels).
• Tonne cargo – Calculated via draft and displacement tables, subtracting vessel weight and ballast water and fuel stock.
• Nm – GPS distance from departure voyage 'n1', to departure voyage 'n2'.
For 2025, Maersk recorded 417k tonnes CO2e biogenic emissions not included in its scope 1 inventory, a 50% decrease compared to 2024. This is primarily related to a lower consumption of biofuels in Maersk’s Ocean operations.
ACCOUNTING POLICIES
Biogenic emissions not included in scope 1
Biogenic CO2 emissions result from the combustion or biodegradation of biomass. Biomass is defined as any material or fuel produced by biological processes of living organisms, including organic non-fossil material of biological origin (such as plant material), biofuels (such as liquid fuels produced from biomass feedstocks), biogenic gas (such as landfill gas) and biogenic waste (such as municipal solid waste from biogenic sources).
In Maersk’s current inventory, the calculation of biogenic CO2 is limited to the combustion of fuels based on biogenic feedstock in Maersk’s scope 1 GHG emissions. This may expand based on evolving international standards detailing the treatment of biogenic emissions in corporate inventories.
E1-5_05
1 Not covered by the Independent Auditor’s limited assurance report.
For 2025, the total energy consumption decreased by 1% compared to 2024. This decrease was mainly driven by increased efficiency in the ocean network, implementation of the Gemini Cooperation, voyage optimisation and increased asset efficiency. In 2025, changes in our fuel mix resulted in a significant decrease in consumption of fuels from renewable sources and a corresponding increase in consumption of gas fuels and other fuels, including grey methanol. During the year, Maersk increased its consumption of self-generated renewable energy by more than three times compared to 2024, primarily due to the increased usage of solar power in Bahrain.
ACCOUNTING POLICIES
Scope and consolidation
Energy consumption data is collected per legal entity per energy type, and the figures are consolidated line by line. To ensure completeness in reported data from our offices within legal entities, office standards have been developed, which can be used for offices with no production or warehouses. The office standards define average consumption values per FTE and are only used if other more accurate information is not available.
Total energy consumption
Total energy consumption is the sum of fossil energy consumption and renewable energy consumption.
Fossil energy consumption
Fossil energy consumption encompasses all fossil-based energy consumption that is consumed/combusted at Maersk controlled entities/vessels. Fossil energy consumption includes the following:
Energy intensity and mix
EFRAG
Indicator
• Fuel oil, including heavy fuel oil, marine diesel oil, gasoline, diesel and kerosene
• Gas fuels, including liquefied petroleum gas (LPG), liquefied natural gas (LNG) and natural gas
• Other fuels, including heating oil and cylinder oil
• Electricity and heating
Renewable energy consumption
Renewable energy consumption encompasses all renewable energy consumption, including renewable electricity, heating and fuels from renewable sources that are consumed at Maersk-controlled entities/vessels. Renewable electricity includes electricity from solar panels, wind turbines and batteries, covering on-site self-generated and purchased renewable electricity from the grid. Fuels from renewable sources include biofuels and e- and bio-methanol. Thus, renewable energy consumption is reported as: • Renewable electricity • Fuels
1 Not covered by the Independent Auditor’s limited assurance report.
For 2025, the energy intensity was 2.23 GWh/USDm, a slight increase from 2.18 compared to 2024. This was driven by a lower revenue compared to energy consumption for the year.
The share of renewable energy consumption reduced to 2 in 2025 compared to 3 in 2024, primarily due to the decrease in the consumption of fuels from renewable sources. 98% of Maersk’s total energy consumption was derived from fossil fuel sources in 2025.
ACCOUNTING POLICIES
Energy intensity (based on revenue)
Energy intensity is the total energy consumption in high climate impacts sectors per unit of revenue (USDm), as stated in the income statement of the consolidated financial statements. All of Maersk’s energy consumption is considered as related to high climate impact sectors.
Share of renewable energy consumption
The share of renewable energy is the percentage of total energy consumption that is derived from renewable energy sources.
Share of fossil fuel sources in energy consumption
The share of fossil fuel sources in energy consumption is the percentage of total energy consumption that is derived from fossil-based energy sources
Renewable energy production
Maersk’s renewable energy production has increased 3 times compared to 2024 and is related to on-site solar installations that produce electricity, which is used on-site. Electrification of assets and investments in on-site renewable energy installations are part of Maersk’s transitions.
ACCOUNTING POLICIES
Renewable energy production
Renewable energy production is the total amount of renewable energy produced in Maersk’s operations
during the reporting year. The total reported production comprises of the consumption, storage and sale of renewable electricity to the grid.
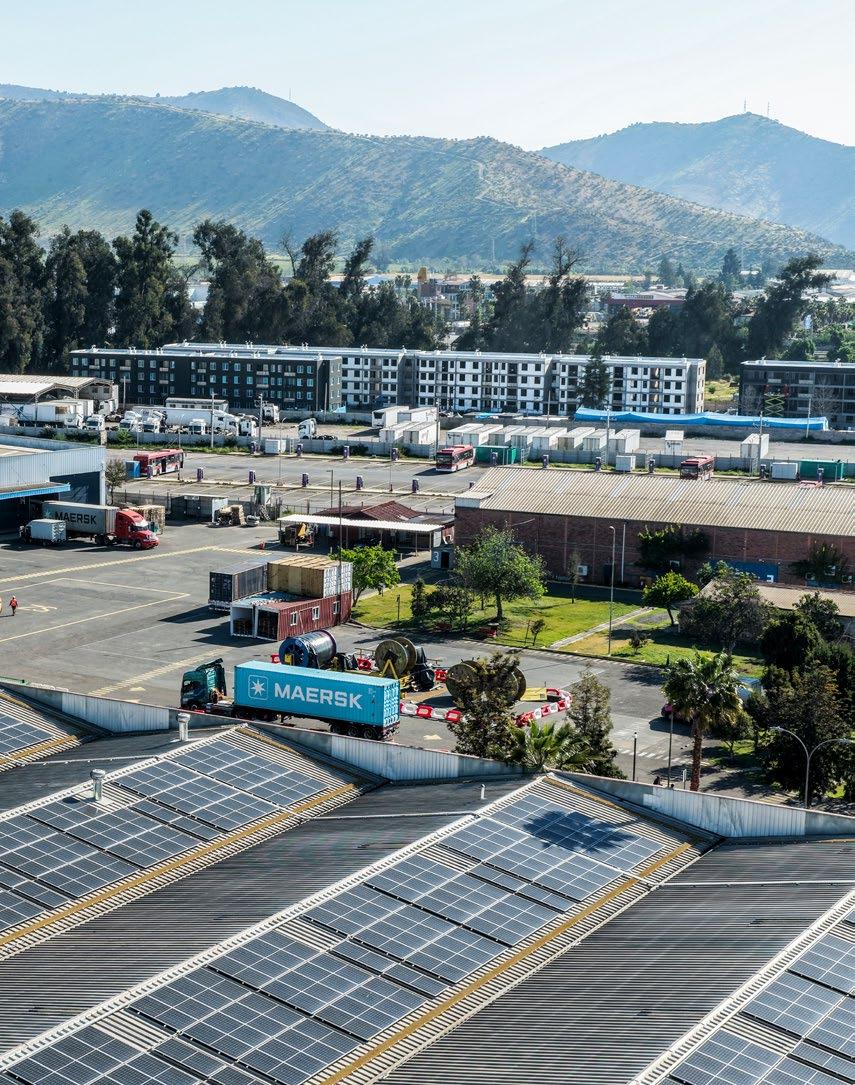
Environment and ecosystems
A.P. Moller - Maersk (Maersk) is committed to conducting business safely and responsibly while minimising environmental impact. This includes the careful use of natural resources – such as land and raw materials – alongside proactive management of biodiversity and ecosystem risks. It also extends across our value chain, covering critical resource sourcing and responsible ship recycling.
In 2024, Maersk initiated an assessment using the Taskforce on Nature-related Financial Disclosure’s LEAP (Locate, Evaluate, Assess, Prepare) framework to identify and evaluate key nature-related issues. This work laid the foundation for strengthening environmental initiatives across our global operations and aligning our actions with international standards. In 2025, we advanced this approach by integrating LEAP findings more deeply into our environment management frameworks.
These efforts position Maersk to meet upcoming environmental and biodiversity requirements, including the UN High Seas Treaty, and the revised ISO 14001:2026 Environmental Management Standard. The updated ISO standard introduces explicit consideration of biodiversity and climate resilience, as well as stronger requirements for supply chain environmental accountability.
Environmental and ecosystem management at Maersk spans multiple functions and business segments, supported by dedicated teams responsible for compliance and initiatives addressing the specific risks of each operation. Key activities include standardised waste management across our landside businesses, global standards such as our Environmental and Social Impact Assessment process, and integrated Health, Safety, Security and Environment management frameworks. These efforts often address interconnected environmental topics and create synergies with our energy transition and social responsibility objectives, particularly in areas such as responsible ship recycling and sourcing of critical resources, including steel and fuels.
Ecosystem health and biodiversity
Maersk strives to minimise impacts on ecosystems and biodiversity and actively participates in mitigating risks to the world oceans and restoring land health in critical habitats. The LEAP framework is a cornerstone of our approach to managing nature-related risks, enabling us to identify and understand impacts as well as risks.
IROs
Ecosystem health and biodiversity
Ecosystem degradation and biodiversity loss caused by land use and habitat disruption resulting from construction of land-based assets
Disturbance of species due to vessel traffic and underwater radiated noise
Spread of invasive species
Targets and progress
Currently, Maersk does not have group-wide targets specifically addressing ecosystem health and biodiversity. However, we continuously monitor performance across both landside and ocean operations to better understand our impacts.
Key actions
Maturing our LEAP approach
Maersk’s business segments vary significantly in their nature-related risks and in the maturity of their LEAP implementation. APM Terminals is currently the most advanced, as its fixed locations make it easier to identify risks and conduct detailed evaluations and assessments.
Logistics & Services faces ecosystem and biodiversity risks primarily linked to land expansion at existing and greenfield sites, as well as construction-related impacts. In 2025, we focused on laying the groundwork to mature the LEAP approach across all segments. This foundation will enable expanded efforts in 2026, as Maersk aims to embed LEAP as a strategic tool and value driver for the business.
Assessing ecologically sensitive locations
To evaluate our presence in ecologically sensitive areas, we utilised data from the World Database on Protected and Conserved Areas, the World Database of Key Biodiversity Areas as well as the IUCN Red List of Threatened Species. Initial findings based on the geolocations of our sites per 1 October 2025, indicate that 61 (of 62) terminals, 888 (of 919) inland logistics facilities, and 407 (of 420) offices are in or near ecologically sensitive locations. Our key biodiversity impacts from locations come from greenfield construction and expansion projects of existing sites. In 2025, we had 22 of such projects, where environmental assessments were performed in accordance with local regulatory requirements.
Building an improved Ocean base-level risk understanding In 2025, our Ocean segment contributed to the TNFD’s new guidance for assessing material nature-related risks in the maritime sector. Trials using the new guidelines are underway and will continue into 2026. We also continued improving our StarConnect AI-powered fleet energy efficiency platform’s capabilities to monitor our presence in marine protected areas and particularly sensitive sea areas, integrating new updates to the World Shipping Council’s Whale Chart. Maersk continued to actively engage with regulators, states, shipping associations, scientific institutions and NGOs in the development of Underwater Radiated Noise (URN) Management, in line with IMO guidelines. Furthermore, at the 2025 UN Ocean Conference (UNOC3),
Maersk committed its entire operated fleet to the 10,000 Ships for the Ocean initiative, enabling our vessels to serve as voluntary observation stations. This allows us to provide real-time oceanographic data that supports improved climate models, maritime safety and global ocean monitoring.
Policies and approach
Maersk’s Environment & Ecosystems Policy Architecture provides a unified framework that guides employees in minimising material environmental impacts. It sets out principles aligned with our environmental management systems and global policies, covering key areas such as pollution prevention, ecosystem health and biodiversity protection, and responsible waste management. This architecture ensures consistency across our operations and supports compliance with international standards and local regulations.
Maersk enforces a strict zero-tolerance policy against the transportation of illegal wildlife and timber, as outlined on Maersk.com We also prohibit the carriage of any products derived from sharks or whales. In addition, we maintain rigorous internal controls to prevent misdeclaration and unauthorised transboundary movement of hazardous waste, including plastic scrap, battery waste, and industrial waste. Maersk complies with international conventions to perform pest control, ensuring vessels adhere to the Company Pest Control Plan and actions are taken to ensure the spread of invasive pests are managed during their respective high seasons. With regards to the spread of species via biofouling, Maersk is committed to improving anti-fouling performance whereby all vessels are coated with anti-fouling paint and regular inspections are performed in line with vessel’s Biofouling Management Plan. In addition, to improve environmental friendliness of anti-fouling paints, a switch to ultralow biocide antifouling systems has been initiated for the fleet. These measures reflect our efforts to protecting biodiversity, supporting global conservation efforts and ensuring compliance with international environmental regulations.
Pollution and waste
As a global logistics provider operating across ocean, land, and air, we acknowledge our responsibility to minimise environmental impacts, particularly in pollution and waste management. We are also seeing growing expectations from customers and port authorities for zero spills into the marine environment.
Key actions
Improved incident management process for spills
In 2025, APM Terminals improved their incident management process for spills, combining previously separate incident reporting and incident management standards for increased transparency and response consistency. Updates were also made to the spill prevention and management standard for landside businesses in Maersk, ensuring risk-based prevention measures and updated training for facility personnel.
Improved waste management
Air pollutants from vessels and landside/air transportation
Pollution from hydrocarbon spills from vessels and landside operations and from containers lost at sea
Discharged wastewater to the sea
(e.g., scrubber, bilge, sewage and grey water)
Waste management
Waste generation during operations
Targets and progress
Pollution
No major uncontained hydrocarbon spills and releases to the environment. In 2025, Maersk did not record any major spills (above 10 m3) to the environment.
Waste
While we do have Ocean-related ISO 14001 targets in place for waste and pollution, we do not have any long-term waste targets at Maersk, we work with continuous improvement of our waste management practices across all our business segments.
In 2025, for the first time, all Maersk-operated vessels had available garbage e-logbooks to capture actual waste generated from vessels, which improved efficiency and accuracy of waste data management. Further actions are ongoing with shore side waste reception facilities to improve line of sight of eventual waste handling and treatment. In line with our objective to reduce overall waste generation onboard, we have set clear goals to minimise plastic waste across our fleet. In 2025, we successfully piloted circular economy-based projects with focus on plastic/polymer and electronic waste to further minimise the environmental impact. At our landside operations, and following the 2024 Global Waste Assessment conducted across landside business segments, APM Terminals focused on setting up a global waste management governance framework and conducting gap analyses at their respective sites to these standards in 2025. In Logistics & Services, we rolled out an updated Waste Management standard, Waste Management Plans, and training modules for operational personnel through the new Waste Coordinator program. Both segments conducted waste assessments workshops during the year while engaging with local HSSE teams in waste inventories, segregation and responsible disposal.
APM Terminals zero-waste framework in Los Angeles
There are also increasing customer expectations and regulatory requirements to reduce waste. A key achievement for Maersk during 2025 was the establishment of a zero-waste framework in Pier 400 in Los Angeles, as part of its broader net-zero emission ambition. It is likely that such local policies will increase and require additional compliance actions and reporting across our businesses.
Container handling practices
To mitigate the risk of lost containers at sea and improve safety, in 2025, Maersk rolled out a parametric roll risk management solution that enables crews to optimise route planning by incorporating realtime weather forecasts, along with an alert system thereby avoiding adverse seas that could cause dangerous rolling conditions. In addition, advanced technology lashing systems, equipment and software to compute nonlinear real-world conditions that impact lashing forces and container stability were developed and installed onboard. Maersk has made key contributions, as active participants, in the TopTier Joint Industry Project since its launch in May 2021. This science and research-based project was successfully concluded at end-2024 and submitted the final report to the IMO in 2025. To complement the TopTier work, Maersk conducted own technical research and model testing to identify the key contributing factors for container loss and shared these findings at the IMO and remains engaged in the regulatory improvements and development.
Policies and approach
Maersk’s Environment & Ecosystems Policy Architecture provides a unified framework that guides employees in minimising material environmental impacts. It sets out principles aligned with our environmental management systems and global policies, covering key areas such as pollution prevention, ecosystem health and biodiversity protection, and responsible waste management. This architecture ensures consistency across our operations and supports compliance with international standards and local regulations.
Maersk actively mitigates pollution risks by following a comprehensive management framework and strict guidelines for prevention and response across all land and sea operations. These measures include air quality management, chemical handling protocols, spill prevention standards and detailed emergency response procedures, In Maersk’s Ocean business, pollution is regulated through the International Convention for the Prevention of Pollution from Ships (MARPOL) and International Maritime Organization (IMO) regulations.
Responsible ship recycling
Maersk is committed to responsible ship recycling, ensuring all end-of-life vessels are dismantled safely, ethically and with minimal environmental impact, protecting workers, supporting certified yards and reducing harm. As global demand for large-vessel recycling grows, financially robust and responsible practices are critical to enable the fleet’s transition to lower emissions by introducing new vessels and retiring old ones. Channelling these retired assets back into production also helps the shipping industry, including Maersk, to decarbonise the global steel value chain.
as several other regulatory frameworks also exist. Maersk supports the Hong Kong Convention and engages with institutions and regulators to establish it as the global legal standard for ship recycling.
Increasing global capacity for recycling large vessels
Maersk is collaborating with partners to develop commercially viable solutions for the scaling of ship recycling facilities capable of handling post-Panamax vessels, including Memorandums of Understanding and Letters of Intent at locations including Bahrain and Egypt in 2025.
Continued engagement in Alang, India
Responsible ship recycling
Environmental impacts during decommissioning of vessels
Targets and progress
Increasing global capacity for responsible ship recycling
Increase the global capacity for the responsible and financially viable recycling of post-Panamax vessels.
In 2025, we continued our advocacy work and efforts to increasing global capacity for responsible ship recycling. We welcome the Hong Kong Convention as the global baseline for responsible ship recycling.
Key actions
Promoting global regulation for responsible ship recycling
In 2025, the Hong Kong International Convention for the Safe and Environmentally Sound Recycling of Ships (the Hong Kong Convention) entered into force to provide the shipping industry a base legal document for responsible ship recycling. Nevertheless, complexity remains
During 2025, we have not had any ship recycling projects in Alang, India. However, in 2025, we were still active at the yards and continued to support facility workers with complementary health care access and health training. As part of our engagement, the Mobile Health Unit provided 13,000+ outpatient consultations, supported by diagnostics and specialty camps addressing prevalent skin and musculoskeletal disorders. In parallel, NGO-led preventive health initiatives trained 10,000+ workers on personal hygiene and ergonomics and supported oral cancer screening and diagnostics, enabling early detection and timely intervention.
Policies and approach
Maersk’s Responsible Ship Recycling Standard
Maersk’s Responsible Ship Recycling Standard (Maersk’s RSRS) establishes comprehensive requirements to ensure that all ship recycling activities are carried out in a safe, ethical and environmentally sound manner. This standard aims to prevent, reduce and eliminate accidents, injuries, and any other adverse impacts on human health or the environment associated with ship recycling operations. Maersk’s RSRS meets the different global regulatory sets of requirements, including those in and outside of EU. Our responsible ship standard is available here.
We also advocate for creating global opportunities for responsible post-Panamax ship recycling, where recycling capacity shortfalls can only be addressed through global consensus on the approval of more yards with appropriate safety and environmental standards. This includes opportunities for EU-flagged vessels to be responsibly recycled at approved facilities outside of the EU.
Sourcing of critical resources
We work to use critical resources efficiently across our business, exploring impact reduction in the upstream supply chain, especially for critical materials like steel and fuels, which we depend on to serve our customers. While Maersk directly sources and uses steel in our own operations for container manufacturing, much of the equipment we use across our operations and broader value chain, including vessels, terminal cranes, warehouses and trucks, also contains significant amounts of steel.
IROs
Sourcing of critical resource
Environmental impacts resulting from the steel value chain
Environmental impacts resulting from the fossil fuel and biofuel value chain
Targets and progress
We do not currently have targets to address the wider environmental impacts from the steel and fuel value chains aside from our GHG emissions targets. As members of Climate Group’s SteelZero coalition, we have made a commitment to use 50% lower-emission steel by 2030 on a pathway to using 100% net-zero emission steel by 2040.
Key actions
Collaborating through the SteelZero coalition
We are active members in the Climate Group’s SteelZero coalition – a global initiative bringing together leading value-chain stakeholders to speed up the transition to a net-zero steel industry. Again in 2025, we reported our yearly steel consumption to the SteelZero Coalition.
Policies and approach
Maersk’s approach to sourcing steel and lower-GHG-emissions fuels is governed by our Environment & Ecosystems Policy Architecture, which outlines our sustainability requirements for lower-GHG-emissions fuels and our efforts to understand and mitigate negative impacts across fuel and steel value chains. Steel is essential for shipbuilding, containers and generally a major infrastructure across our operations, yet it carries significant environmental impacts. To address this, Maersk is working to increase the use of lower-GHG-emissions steel through collaboration with key industry stakeholders. The lack of globally consistent standards across the steel value chain, as well as the unavailability of lower-GHG-emissions steel in specific locations, are major barriers. To increase alignment, we partner with industry actors such as the Climate Group’s SteelZero coalition, and others to develop criteria for responsible steel sourcing and to promote common standards and certifications for lower-GHG-emissions steel.
Performance data
Environmental incidents
1 Not covered by the Independent Auditor’s limited assurance report.
For the fourth consecutive year, we had no significant oil spills from our operations during 2025. We also did not have any container loss at sea, indicating that our continued efforts including the roll-out of a parametric roll risk management solution along with the development and installation of advanced lashing systems are yielding positive results.
ACCOUNTING POLICIES
Hydrocarbon spills > 10 m3
Spills are reported as the number of uncontained hydrocarbon liquids spills greater than 10 m3, resulting from any unintended, irreversible release associated with current operations.
Containers lost at sea
Containers lost at sea is based on the number of containers (independent of size) lost at sea during the year. This includes containers lost at sea from owned and time-chartered vessels, but does not include containers falling overboard in ports and other cases where containers will be picked up.
Air pollutants
1 Not covered by the Independent Auditor’s limited assurance report.
For 2025, Maersk’s air pollutant emissions followed the trend in the energy mix and consumption.
and NOx emissions decreased as a result of lower bunker consumption. The significant increase in
is a result of increased air freight activity and related kerosene consumption.
ACCOUNTING POLICIES
Air pollution
Air pollution is the amount of air pollutants emitted in relation to Maersk’s operations, besides GHG emissions.
The air pollutants included are SOx NOx, Non-Methane Volatile Organic Compounds (NMVOCs), carbon monoxide (CO), Particulate Matter (PM10 and PM2.5, and Black Carbon (BC)). By default, PM10 also includes smaller particles (hereunder PM2.5 and BC), which are also reported separately because these fractions of particulate matters have differing impacts on environment and health than the coarser fractions.
Air pollutants have been prepared and stated based on the first version of the Stockholm Environment Institute’s (SEI) reporting guide, except for BC and PM10 reporting from the fleet of Maersk, which is based on the methods outlined by IMO in MEPC 75/7/15 as our data availability allows for IMO’s more accurate assessment. In case of scrubber use, SOx pollutants are reported based on Clean Cargo guidelines, where SOx output is assumed to be maximum for the operating area in which the vessel spends 80% of time.
1 Not covered by the Independent Auditor’s limited assurance report.
In 2025, Maersk recorded a 5% decrease in waste generated compared to last year. This is primarily driven by the improved data quality from vessels (actual waste data from 320+ vessels extrapolated to our total fleet), which has had a significant impact on the overall waste. The increase in hazardous waste primarily derives from the sludge reported from vessels, and the subsequent reduction in non-hazardous waste a direct outcome of better reporting and estimation practices for our Ocean segment and Logistics & Services sites. Due to the improved methodology applied this year, the waste reported is not directly comparable to 2024.
ACCOUNTING POLICIES
Waste Waste is reported as the sum of all waste types generated, with further bifurcation in hazardous and non-hazardous waste types. Non-hazardous waste primarily consists of municipal and industrial waste, such as food waste, pallets, cardboard, general trash and metal and wood scrap.
Uncertainties and estimates
Waste data is reported by entities and is based on a combination of actual numbers and estimates. For land-based operations, waste data is sourced from billing and accounting systems or from the procurement/ supply management department. For some offices and minor sites, where it is challenging to obtain actual waste data, estimates based on FTE counts and Facility-wise sqm are used to ensure completeness in waste reporting. The waste reporting from vessels has been enhanced in 2025, by using actual amounts for all Maersk Line vessels. This provides a more accurate basis for extrapolating waste numbers for the entire fleet, including owned and time-chartered vessels. The conversion factors for MARPOL Annex V categories were updated from m³ to tonnes.
Resource inflows
EFRAG ID Indicator
E5-4_02
Steel consumption in Maersk is related to container production activities in Maersk. In 2025, we have updated the methodology for preparing the Total weight of steel consumed KPI. We now report the weight of steel procured during the year. In prior years, we prepared the KPI by combining bill of material data and number of containers produced. In 2025, we have increased the number of containers produced; consequently, the weight of steel sourced has increased from 73,118 tonnes in 2024 to 102,525 tonnes in 2025.
ACCOUNTING POLICIES
Total weight of steel consumed
Total weight of steel consumed is the weight of steel used for producing containers. The weight is based on the procured amounts of steel during the year and is collected directly from Maersk’s procurement systems. The scope is limited to steel we directly source and does not include steel from our value chain. Considering the change in the calculation methodology compared to 2024, we have restated the prior year numbers from 73,394 to 73,118 tonnes for 2024.
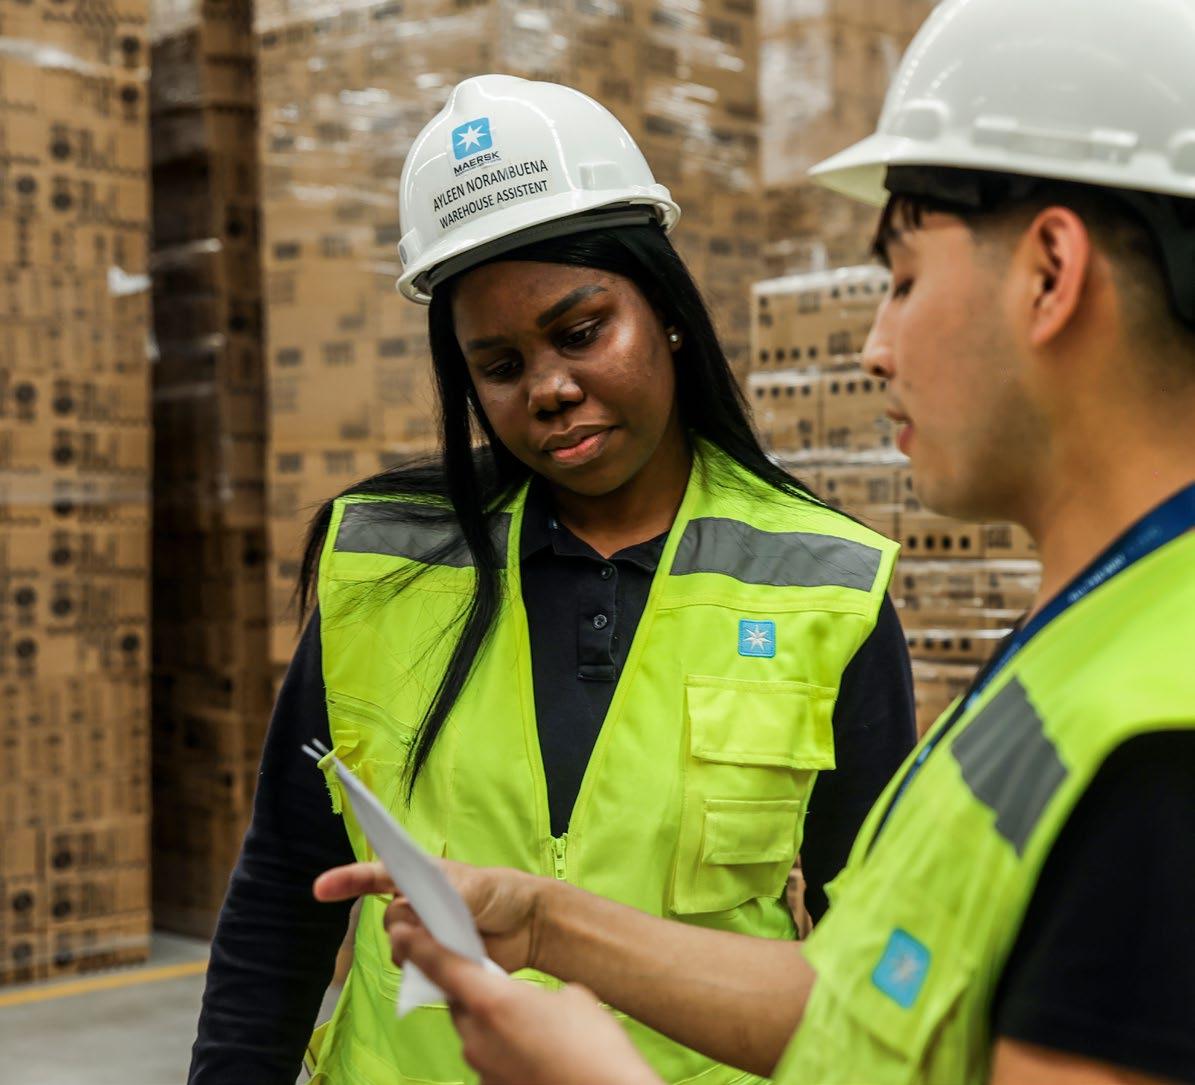
People and culture
Attracting and retaining critical talent
NO CHANGE Inability to retain and attract the right workforce for key critical capabilities
Inability to retain and attract key critical capabilities could impact the ambition to deliver on the integrator strategy.
Social information
Overview of our material impacts, risks and opportunities related to Social.
Discrimination and harassment in the workforce
NO CHANGE Negative impacts of harassment creating an unsafe working environment for vulnerable groups in our workforce
Vulnerable groups at risk of harassment and violence as defined in internationally recognised human rights standards. Harassment and violence can take place in office environments, on ships, in warehouses, but in particular for frontline workers and in environments with disparate workforce composition. An unsafe working environment can result in an inability to attract talent and in remediation costs related to harassment cases.
AMENDED1 Lack of equal treatment
Potential discrimination across the organisation’s operations, employment practices or oversight – particularly the right to work in conditions of equal opportunity and equal treatment – is a high risk, given a large global workforce across our various operations, including seafarers. Potential negative impact related to equality, pay equity and inclusion, given fast-paced environment for frontline and office-based workers. Third-party labour can also be subject to different managerial and behavioural standards being applied. Cases of discrimination can result in an inability to attract talent and in remediation costs related to harassment cases.
Safety and security
Safety of our workforce
NO CHANGE Risks of work-related lost time and life-altering incidents and fatalities
Risks of work-related lost time and lifealtering incidents and fatalities for workers given the nature of the transport and logistics sectors. This can pose a financial risk to A.P. Moller - Maersk in terms of costs of remediation and reputational damage. Where
Employee relations and labour rights
Forced
NO
Exposure to global/local security risks
NO CHANGE Exposure to global/ local security risks
Global and local geopolitical instability and conflicts result in security risks, where criminals, terrorists and/or others with ill intent expose our employees to health and safety risks, e.g., piracy, contraband goods, theft and terrorism. Financially, this can cause disruptions to our operations, which may also impact our ability to decarbonise and costs related to safety incidents.
Impacts related to working hours and overtime for contracted frontline workers, such as truck drivers, seafarers and migrant workers.
In some supplier categories, there is a potential risk of inadequate wages being paid for contracted
housing and sanitation facilities for own and contracted workforce
For contracted workers and in the broader value chain, on-site housing is provided to workers at, e.g., terminal constructions, warehousing, shipyards and shipbreaking yards. These spaces can potentially be substandard, crowded and not adequately hygienic – aggravated in some contexts by the lack of gender segregation.
Our people
The people of A.P. Moller - Maersk (Maersk) are the foundation for our success and responsible for every day delivering on our customer promises, including our sustainability commitments.
Our workforce is a crucial factor in maintaining and strengthening global supply chains. The efficiency and productivity of ports, warehouse activities, rail/road/air cargo systems, etc. depend on our own employees and our third-party employees. We invest in the motivation and engagement of our workforce and aim to create a stable working environment, to safeguard the availability and reliability of cargo flows within the supply chains of our customers.
Our People approach is to support that every team member – regardless of business, position or geography – can grow, develop and thrive at work in a safe and inspiring environment. At Maersk, we focus on the following people topics: People and culture, safety and security, employee relations and labour rights, which are all underpinned by our commitment to respecting human rights.
At Maersk, we employ 100,000+ people across almost 130 countries in the world. Across our operations, we have a mix of office-based and frontline workers in landside logistics and terminal locations as well as 11,500+ seafarers that man our fleet of more than 700 container vessels. In addition to our own employees, we also rely on a large extended workforce of third-party contracted labour (non-employee workers) who are not directly employed by Maersk but work on our premises, especially in Logistics & Services and Terminals. These non-employees are working under Maersk’s responsibility and supervision and are primarily workers hired through agencies to support our frontline operations. Beyond our own and non-employee workers, Maersk also relies on a diverse range of workers in our extended value chain.
Our global operations span diverse labour markets, cultural norms and regulatory environments, requiring proactive risk management across our footprint. This includes ensuring fair and safe working conditions and creating opportunities for meaningful contributions through growth and learning.
Employees and non-employee workers under Maersk’s duty of care face health and safety risks inherent to the transport and logistics sector, including work-related injuries, life-altering incidents and fatalities. Our global presence also exposes assets, employees and customer cargo to security risks, driven by geopolitical shifts, conflicts, climate-related extreme weather and theft.
We remain vigilant in managing risks of harassment, discrimination or violence that could create physically or psychologically unsafe environments. Labour rights require active oversight, including preventing excessive working hours or overtime for employees and contracted workers. Contracted workers may also face restrictions on freedom of movement, such as passport retention. Other labour rights risks include ensuring fair wages, adequate housing and proper sanitation facilities. Our policies, actions, and targets for addressing these risks are detailed in the following sections.
Maersk’s People Strategy
Our People Strategy outlines the people principles which are our north star for all people practices and policies. It includes employee attraction, development and engagement activities to ensure workforce continuity and stability, while unleashing employees’ energy, focus and commitment to executing our strategy.
Our People Strategy focused on three priorities for 2025:
• Leadership Excellence
• Organisational Agility; and
• Consistent High Performance
These priorities were operationalised through initiatives that enhance leadership development, simplify managerial tools, strengthen talent and succession planning and improve workforce planning – creating transparent career pathways and robust pipelines that help attract and retain critical talent.
Our People Strategy is available to all employees on Maersk’s intranet and other internal channels. Every year, the People priorities, with specific focus areas, are set and communicated to the entire organisation.
We actively listen to employee voices through regular engagement surveys, using insights to strengthen inclusion, leadership and overall employee experience.
People and culture
Maersk is committed to continuing to build an inclusive, highperforming culture by empowering colleagues, simplifying work, strengthening leadership and driving continuous improvement. A culture that can support delivery of our business strategy while ensuring a safe, respectful, inclusive and engaging workplace that complies with local laws.
IROs
Attracting and retaining critical talent
Inability to retain and attract the right workforce for key critical capabilities
Discrimination and harassment in the workforce
Negative impacts of harassment creating an unsafe working environment for vulnerable groups in our workforce
Lack of equal treatment
Inclusion
As the DE&I targets set towards 2025 have concluded and we made meaningful progress regarding our diversity and inclusion activities, the next steps will be informed by the ongoing work on our broader, long-term Culture & Inclusion efforts.
Key actions
Performance-driven growth
We are accelerating efforts to strengthen our global talent pipeline through MPACT - our Performance Management System designed to maximise performance, alignment and career growth. To secure future leadership and operational excellence, we have identified critical positions across the business. These positions are closely assessed on key measures to ensure we retain the best talent in those positions, and we build a strong and global bench of succession candidates. Turnover remains within expected levels despite market challenges. Our focus is on retaining critical capabilities, and trends are positive. In 2025, turnover for this category is 4.9%, reflecting a fair, performancedriven culture. We continue to take proactive steps to sustain this position.
Targets and progress
Employee engagement
For 2025, we had a target of achieving an engagement score in the top quartile of our survey provider’s global norm. In 2025, we introduced a new survey approach, the PeoplePulse, designed to better reflect and measure the lived experience of our diverse workforce. The new survey does not allow for direct comparisons to prior year results due to changes in survey methodology. However, it is possible to estimate an indicative, approximate trend compared to 2024, which shows that engagement has improved compared to 2024. Maersk’s score for 2025 will be the baseline for measuring engagement going forward. In 2025, we had a high participation rate of 89% and achieved a score of 83, placing us in the top 10 percentile of the global norm.
Engagement score in 2025
Implementation of a new PeoplePulse survey
With PeoplePulse, Maersk takes the next step in its engagement journey. The new survey addresses key learnings from the previous approach: while engagement levels remain high, only 4 in 10 employees felt sufficient progress after past surveys. Leaders have received survey results and are accountable for acting with their teams, while we track progress through the twice-yearly survey cadence, complemented by internal campaigns on performance tools and training.
Evolving our commitment to excellence and inclusion
A Culture of Excellence is at the heart of our People Strategy and essential to achieving our business ambitions by fostering proactive ownership, driving continuous improvement, and embedding excellence as a shared mindset across the organisation. As we conclude our 2020–2025 journey, inclusion continues to be an important topic for Maersk going forward, fully supported and led by the Executive Leadership Team. Our goal remains consistent and clear – to create an
inclusive workplace supported by robust policies and practices that attract, develop and retain talent at every level. In 2025, we established a Culture and Inclusion team to drive our continued efforts.
Empowering through AI upskilling
In 2025, we advanced enterprise-wide AI fluency by investing in upskilling and reskilling initiatives. Through foundational and advanced GenAI courses, we equipped colleagues to thrive amid rapid technological change, reinforcing our commitment to agility, faster problemsolving and stronger innovation.
Policies and approach
We are committed to fostering a flexible and inclusive work environment with employee-related policies and practices in place to promote well-being in support of talent attraction and retention. Our approach is anchored in our Anti-Discrimination, Harassment, Bullying and Violence Policy, designed to proactively foster a culture of respect, as well as mitigating potential harm. The policy is available on Maersk.com and accessible via our intranet, alongside comprehensive training resources.
This policy is further reinforced by our Commit governance rules, Code of Conduct and aligned with international frameworks and standards such as the UN Global Compact and the UN Guiding Principles on Business and Human Rights.
The key principle of equal opportunity is implemented in practice through development of internal guidelines like our Internal Hiring Policy, which lays the grounds for fairly giving opportunity to internal talent and our efforts on narrowing the gender pay gap. We report on the gender pay gap on page 97 in the social performance data of this report.
Safety and security
Maersk has a duty of care to ensure the basic human rights of health, safety and security for everyone who works with us.
Our Health & Safety approach is based on the core pillars: implementing and assuring global standards across our organisation, while ensuring we have a leadership-led culture that puts safety at the heart of operational decision making. These pillars are further supported by ongoing, individualised efforts to identify and manage the specific HSSE (Health, Safety, Security, and Environment) risks within our business segments, including those in our standard operations and non-standard work, which occurs daily. These elements work in unison to provide a strong and scalable HSSE foundation that provides a safe, secure and adaptable work environment for future growth and customer needs.
IROs
Safety of our workforce
Risks of work-related lost time and life-altering incidents and fatalities
Exposure to global/local security risks
Exposure to global/local security risks
Targets and progress
100% Learning teams following a high potential incident
In 2025, we successfully completed 100% Learning Teams to understand and learn from the high potential incidents that were recorded across Maersk’s operations. Completion of Learning Teams and acting on the learnings helps us applying a contextual and systemic understanding of what caused the incident to happen and bring the risks under control before someone gets injured. In Logistics & Services, multiple Learning Teams identified insufficient traffic management as a key risk, prompting this critical control to be the global safety
flagship programme delivering targeted safety risk reduction in 2026. Similarly, in APM Terminals and fleet, the focus will be on lashing incidents and cargo fires respectively with subsequent mitigations.
100% of learning teams completed following a high potential incident in 2025 (2024: 99%)
Key actions
Global standardisation
We continued our multi-year ‘Protected By Maersk’ standardisation programme in 2025 to strengthen global implementation of our HSSE Management Framework, while also conducting 146 warehouse and depots HSSE audits and closing over 1,850 improvement actions towards our standards. Maersk also launched a new digitally enabled HSSE platform for audits and inspections in 2025. In 2026, it will expand to digitise incident management and HSSE actions, enabling consistent global performance, accountability and stronger cultural integration across Logistics & Services and Terminals once fully implemented.
Safety culture
In 2025, we continued initiatives to strengthen and expand our leaderled culture of care, curiosity and continuous improvement. More than 15,000 safety and security Gemba walks were conducted by leaders across our business segments, and our ‘Leading With Care’ programme trained frontline operational leaders in a people and safety-first approach that embeds safety and a continuous focus on learning into everyday decisions. This programme will further expand across global operations in 2026.
In Ocean, we launched a series of initiatives including training modules, Safety Observation Cards, briefing/debriefing, vessel audits, strengthening the Vessel Scorecard and targeted campaigns shaped by problem-solving insights. This process will continue into 2026 along with a new digital platform implementation for Asset Management and HSSE.
Fatalities in 2025
(1)
Safety outcomes improved in 2025, with Maersk recording zero fatalities involving our own employees and contractors (nonemployees) working under our responsibility and supervision, representing a clear improvement compared to prior years.
Tragically, four fatal incident involving value chain workers that were not working under Maersk’s supervision or responsibility were recorded within Maersk’s operations.
On 18 March, at a Maersk warehouse in Santa Fe Springs, California, a forklift mechanic with an external supplier suffered a fatal incident, while repairing a forklift.
On 7 November, an explosion occurred on the Kyparissia, a time-chartered vessel which is owned and operated by an external company, at the Port of Tanjung Pelepas (PTP), Malaysia, resulting in 3 fatalities.
Though each of these incidents was not preventable by Maersk management, each loss of life is deeply regrettable and reinforces our commitment to improving safety across the wider value chain. Number
Lost time incident frequency rate 1.67 (1.53 LTIf)
The Lost Time Incident Frequency (LTIF) increased to 1.67, compared to 1.53 in 2024, due to a higher number of reported incidents in Logistics & Services and APM Terminals.
Security and business continuity
Given the increased global risks of disruption, from severe weather to geopolitical shifts and cybercrimes, continuity planning and crisis management is essential to Maersk and its stakeholders. We deployed global resilience and intelligence tools to standardise and better enable threat identification. This includes site-level business continuity planning for business-critical sites, with 100 sites inducted in the system during 2025, and continued implementation for 2026.
Policies and approach
Our dedication to health, safety, security and the environment (HSSE) is deeply rooted in our company values and formalised through Maersk’s HSSE Policy. Available publicly on Maersk.com, the policy outlines our commitment to operate our business in a healthy, safe, secure, and environmentally responsible manner. It applies globally across all Maersk's entities, employees and anyone working under Maersk’s supervision, including non-employee workers (contracted workers). This ensures that all supervised individuals on our sites are covered by Maersk’s safety management systems. The HSSE Policy is further expounded in our HSSE Commit Rule and the Maersk HSSE Management Framework. Additionally, our Supplier Code of Conduct sets clear expectations for suppliers to uphold responsible practices, including safety and security.
The HSSE commitments and culture are mature in our Ocean and Terminals businesses, where there is a strong understanding of standardised operational risks. Maersk’s landside Logistics & Services business, however, does not have this legacy and has been the focus of rapid expansion in support of our integrated logistics strategy. This fast growth, along with entry into new locations with varying safety practices and cultures, has broadened our HSSE risk landscape. Addressing this gap is a priority, in terms of compliance with global standards and policies, and driving the right safety culture to ensure their successful implementation. Hence, we are accelerating efforts globally to align our landside assets with the Maersk HSSE management framework and continue to integrate them into the long-established Maersk values of constant care for our people, assets and cargo.
Our safety culture is guided by four core principles:
We lead with care:
Leaders engage with frontline colleagues, listen and respond to their needs to ensure safe and healthy work conditions.
We learn and adapt:
We build capacity by learning from everyday work and adapting our solutions to the reality of work. This helps us manage serious risks through effective ways of working and safeguards, that protect people while enhancing efficiency, using innovation and safety-by-design.
Our people are the experts:
We foster a learning and psychologically safe culture to uncover risks in daily work, by amplifying employee voices, encouraging engagement and sharing insights across the organisation.
We are resilient:
We plan for supply chain disruptions and maintain backup capabilities to keep cargo moving for our customers. Further, we continuously assess and manage our evolving safety and security risk exposure.
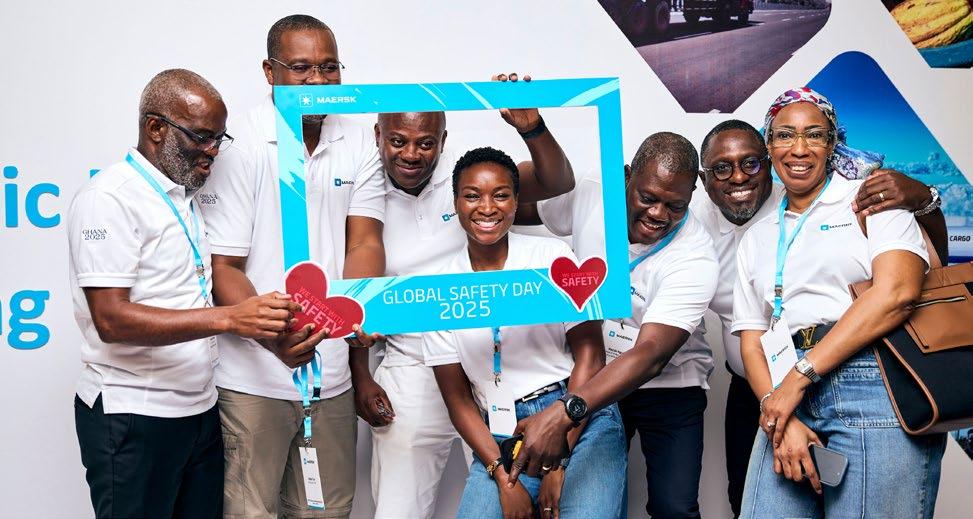
Employee relations and labour rights
The way we treat employees and their representatives is fundamental to responsible business practices and grounded in respect for internationally recognised labour rights in all of our workplaces. Respect for fundamental labour rights is an essential part of Maersk’s responsible business practices, which include offering decent, fair and equitable working conditions for all employees.
IROs
Forced labour
Forced labour such as debt bondage and withholding of passports
Working hours and adequate wages
Excessive hours worked for contracted frontline workers
Ensuring that workers are paid an adequate wage
Adequate housing and sanitation
Adequate housing and sanitation facilities for own and contracted workforce
Targets and progress
While we do not have separate targets for employee relations and labour rights, these topics are part of Maersk’s Code of Conduct, which all Maersk’s office-based employees are trained in annually. Please refer to the Business ethics section of this report for more information on the completion rate of the Code of Conduct training.
Key actions
During 2025, Maersk undertook various activities to manage our engagement and impacts on our workforce, including:
Implementation of Third-Party Labour standards
We further integrated the Global Standards on Third-Party Labour into APM Terminals’ Project Execution department, developing a tailored approach for greenfield and brownfield projects with multiple shortterm third-party contributors. We launched a standardised monitoring process for Logistics & Services and joint business reviews at Terminals to strengthen compliance, and rolled out a compliance tracking app across APM Terminals and Logistics & Services as a single source of truth for documenting due diligence compliance.
Engaging with unions on labour topics
We met with the International Transport Workers Federation (ITF) regularly to discuss a variety of topics, including migrant labour considerations within our Malaysia Logistics and Services operations, labour topics in multiple countries in Latin America, facilitation of a successful new collective bargaining agreement in Liberia. Following a meeting with ITF’s global leadership team, we are planning a joint workshop on the future of work (automation/AI) and supply chain due diligence. Moreover, Maersk was actively involved in negotiating the new six-year Master Contract for ports on the US East and Caribbean Coasts, and many other CBA negotiations.
Fair wages
We have advanced our pay transparency and pay equity readiness, with a multidisciplinary project team to prepare for upcoming EU requirements. While initially focusing on Europe, this work is expected to drive broader improvements in pay transparency and equity across the company.
Policies and approach
Maersk has two main employee relations and labour rights policies: The Commit Rule applies to our own employees and describes the fundamental rights of employees as foundation of a positive working environment.
Maersk Global Standards on Third-Party Labour applies to contract/ third-party labour and further clarifies the labour expectations outlined in our Supplier Code of Conduct.
These policies are aligned with international standards, such as the UN International Labour Organisation core conventions and the UN Global Compact and cover all fundamental labour rights, including guidelines on forced and child labour, adequate housing and sanitation, wages and working hours. They are further supported by internal guidelines for flexible working, a global employee benefits and rewards policy and other topic-specific policies on, e.g., safety, culture and inclusion, which all apply to the working conditions for Maersk employees.
The employee relations and labour rights programme focuses on: Supply chain due diligence: Managing risks to employee rights in our supply chain is critical to growth in Logistics & Services and projects in Terminals, which depends on third-party partners and operates in regions with higher risks. For this reason, we focus on robust systems to identify, manage and mitigate these risks in the expansion projects.
Freedom of association and right to collective bargaining: At Maersk, we support freedom of association and collective bargaining. While union representation in our company is generally considered to be strong and collective bargaining widespread, work is ongoing to establish complete visibility on union representation and collective bargaining agreements (CBAs) in local business entities.
Fair wages: Maersk is adopting a risk-based approach to fair wages, identifying high-risk areas and tailoring solutions in context to local labour markets. Our goal is to ensure all employees earn enough to meet basic needs for themselves and their immediate families. Our 2025 assessment, based on CSRD guidance and benchmarks, confirmed no employees are below adequate wage levels. However, some high-risk locations exist, and we are developing customised solutions for these.
Performance data
Number of employees
EFRAG ID
S1-06_01 Number of employees in 2025 (headcount) Number of employees in 2024 (headcount)
SBM-1_03
SBM-1_04
S1-6_09
S1-6_10
S1-6_03 Total number of employees 107,638 108,160
S1-6_03 Average number of employees
1 106,626
1 Refer also to the most representative average number of employees (FTEs) number in note 2.2 Operating costs of the consolidated financial statements. Average number of employees (headcount) is the average number of individual employees during the year while FTEs (as stated in note 2.2 operating costs of the consolidated financial statements) is calculated based on working hours and reported as an average for the full-year.
At year-end 2025, Maersk employed 107,638 employees, and the average number of employees during the year was 106,890.
ACCOUNTING POLICIES
Total number of employees
Total number of employees is the headcount of employees with an employment contract with Maersk, who are on payroll regardless of the type of contract at year end. Excluded are employees on garden leave and unpaid leave, contractors and third-party workers.
Number of employees
The number of employees is based on registrations in Maersk’s HR systems.
Average number of employees
The average number of employees is calculated as average number of employees (headcount) per month during the year.
ACCOUNTING POLICIES
Number of employees by gender
The number of employees by gender is the number of males, females, other and not disclosed in the total
number of employees at 31 December in the reporting year. The gender categorisation
on
in Maersk’s HR systems.
Number of employees by contract type by gender
of non-guaranteed hours employees (headcount)
At year-end 2025, of the 107,638 employees employed by Maersk, 69,662 were recorded as male, 37,261 were recorded as female, 1 was recorded as other and 714 were recorded as not disclosed.
Maersk does not employ any employees on non-guaranteed hours contracts, and the majority of Maersk’s workforce is on permanent contracts.
ACCOUNTING POLICIES
Number of employees (headcount) by contract type
The number of employees (headcount) by contract type by gender is the number of permanent, temporary and non-guaranteed hours employees in the total number of employees at 31 December in the reporting year. The contract type and gender categorisation are based on registrations in Maersk’s HR systems.
Number of employees by country
EFRAG ID Country
S1-6_04
S1-6_05
S1-6_04
S1-6_05 Denmark
S1-6_04
S1-6_05
S1-6_04
S1-6_05
In 2025, both India and China each account for more than 10% of Maersk’s global workforce, while the USA accounts for just under 10%. Denmark has been included in the list as Maersk’s seafarer population is employed by a Danish legal entity and thus has been allocated to Denmark. The seafarer population totals more than 11,500 employees.
ACCOUNTING POLICIES
Number of employees by country
The number of employees by country is the number of employees in countries where Maersk has more than 50 employees, representing at least 10% of the total number of employees at 31 December in the reporting year. The employees by country specification is based on registrations in Maersk’s HR systems.
Number of employees by contract type by region
S1-6_08 Number of non-guaranteed hours employees (headcount)
S1-6_07
S1-6_08 Number of non-guaranteed hours employees (headcount)
At year-end 2025, the share of employees in Maersk’s regions of Asia Pacific, Europe and the Indian subcontinent – Middle East and Africa were 25%, 30% and 22%, respectively, with the Latin America and North America regions combined accounting for 23% of the employees in Maersk.
ACCOUNTING POLICIES
Number of employees (headcount) by contract type by region
The number of employees (headcount) by contract type by region is the number of employees by contract type by region at 31 December in the reporting year. The employee contract type and region specifications are based on registrations in Maersk’s HR systems
Employee attraction and retention
Entity specific Employee engagement survey score
S1-6_11
of employees who left the company
S1-6_12 Total employee turnover rate % 14 11
In 2025, we changed our engagement survey provider from Gallup to Glint. This means that while the KPI and target of being in the top quartile of the global benchmark remained the same, and the 2025 result of 83 put us in the top 10% of the global benchmark, it is not directly comparable with the numbers reported in the previous year. Maersk’s employee turnover remains within expected levels despite market challenges.
ACCOUNTING POLICIES
Employee engagement survey score
The employee engagement survey score is the average score on the eSAT question "How happy are you working at Maersk?" in Maersk’s PeoplePulse survey. We use the Glint platform to prepare the employee engagement survey score, including the conversion of responses received to a standardised average score on a 100-point scale, which allows for simpler, more meaningful tracking of progress over time.
Number
of employees who left the company
The number of employees who left the company is the number of employees who left the organisation voluntarily or due to dismissal, retirement or death while employed by Maersk during the year. The number of employees who left during the year is based on registrations in Maersk’s HR systems.
Total employee turnover rate
The total employee turnover is calculated based on the average number of employees and the number of employees who left the company during the year.
Diversity of our workforce
S1-9_01
S1-9_02
distribution at top management level
under 30 years old
between 30-50 years old
S1-9_05
Employee over 50 years old
In 2025, the share of women at top management level increased to 36%, up from 31% in 2024.
At year-end 2025, 20% of employees were under 30 years, 68% between 30 and 50 years old, and 12% older than 50 years old.
ACCOUNTING POLICIES
Gender distribution at top management level
Gender distribution at top management is the number and share of women at Board of Directors (BoD) minus 2 level, compared to the total headcount at the same levels. At Maersk, BoD minus 2 level is CEO and the direct reports to the CEO that are people leaders, excluding executive assistants and other administrative staff. 2024 numbers have been restated accordingly. Had we continued to report using prior-year definitions (JL6+) - the % of Women in leadership in 2025 would have been 29% (27% in 2024).
Employee age diversity
The employee age diversity is the number and share of employees that are under 30 years old, between 30 and 50 years old (30 and 50 included), and over 50 years old. Age is defined as the chronological age, i.e. the total period in years a person/employee has existed. Age distribution of employees is based on registrations in Maersk’s HR systems.
Compensation metrics
For 2025, the gender pay gap for Maersk is 4. This unadjusted gender pay gap does not measure a difference in compensation between men and women at the same job level or in the same countries, but it is a broad average across our business. We work constantly to ensure fairness for all our colleagues. The annual total remuneration ratio result for 2025 landed at 215. In the coming years, we will continue to refine our approach, which may also impact the outcome of the KPIs.
ACCOUNTING POLICIES
Gender pay gap
The gender pay gap is calculated as the difference of average annual total remuneration between female and male employees, expressed as a percentage of the average annual total remuneration of male employees. The annual total remuneration for all own employees is calculated using the fully loaded cost index. Fully loaded cost is calculated per job level and country, and is an estimation of the benefits, guaranteed allowances, employer liabilities, on-target short-term incentives, on-target long-term incentives and recognition costs for 2025. The calculation is based on number of employees and their estimated annual total remuneration during the reporting year. Excluded from the calculation are learners, interns, graduates, students, cadets, long-term assignees and inactive employees on unpaid or garden leave.
Annual total remuneration ratio
The annual total remuneration ratio is calculated by comparing the annual total remuneration of the highest paid employee in Maersk with the annual median total remuneration of the rest of the own employees in Maersk. The annual total remuneration for all own employees is calculated using the fully loaded cost index. Fully loaded cost is calculated per job level and country, and is an estimation of the benefits, guaranteed allowances, employer liabilities, on-target short-term incentives, on-target long-term incentives and recognition costs for 2025.
The calculation is based on number of employees and their estimated annual total remuneration during the reporting year. Excluded from the calculation are learners, interns, graduates, students, cadets, long-term assignees and inactive employees on unpaid or garden leave.
Uncertainties and estimates
When preparing the gender pay gap, employees with annual salaries and part-time salaries are converted to full-time equivalents as part of the calculation methodology. In order to ensure cross-country comparability, we apply a standard formula to calculate the hourly rate for all employees. The calculation is based on 2,103 hours per year for all employees. This is the current weighted average contractual working hours across Maersk.
When preparing the annual total remuneration ratio and the gender pay gap, the fully loaded cost index is used as the basis of calculation. The fully loaded cost includes benefits, guaranteed allowances, employer liabilities, ontarget short-term incentives, on-target long-term incentives and recognition costs for Maersk’s own employees for 2025. The on-target costs for short and long-term incentives/bonus are estimates as the actual costs are dependent on various factors not fully known at the time of reporting.
Both metrics are prepared in USD, with local currency values converted accordingly. These currency conversions may affect the annual results and comparability over time.
Employees paid below the applicable adequate wage benchmark
EFRAG ID Country Unit 2025 2024
S1-10_03
For 2025, our assessment shows that we have no employees in any country that are paid below the applicable adequate wage benchmark.
ACCOUNTING POLICIES
Percentage of employees paid below the applicable adequate wage benchmark
The percentage of employees paid below the applicable adequate wage benchmark is prepared and reported as the percentage of employees in any country where not all Maersk employees are paid an adequate wage, and is based on the total number of employees during the reporting year. Where a country has a single national minimum wage, that rate is applied for all employees. In countries with multiple minimum wage benchmarks, varying by region or industry, the highest minimum wage is initially used to identify employees earning below this threshold. This is subsequently followed by a detailed assessment based on the minimum wages applicable to each employee’s specific location or industry. Adequate wages is determined as:
In the European Economic Area (EEA):
The minimum wage set in accordance with Directive (EU) 2022/2041 of the European Parliament and of the Council on adequate minimum wages in the European Union. In the period until Directive (EU) 2022/2041 enters into force, where there is no applicable minimum wage determined by legislation or collective bargaining in an EEA country, Maersk uses an adequate wage benchmark from a neighbouring country with a similar socio-economic status or not lower than a commonly referenced international norm such as 60% of the country’s median wage and 50% of the gross average wage.
Outside of the EEA:
i. The wage level established in any existing international, national or sub-national legislation, official norms or collective agreements, based on an assessment of a wage level needed for a decent standard of living;
ii. If none of the instruments identified in (i) exist, any national or sub-national minimum wage established by legislation or collective bargaining; or iii. Living Wage benchmark (typical family law) as provided by Wage Indicator.
Excluded from the calculation are learners, interns, graduates, students, cadets, long-term assignees and inactive employees on unpaid or garden leave.
Safety and security
S1-14_04
S1-14_04
S1-14_04
specific Learning teams completed following a high potential incident
1 Not covered by the Independent Auditor’s limited assurance report.
In 2025, we recorded zero work-related fatal incidents, reflecting our continued focus on preventing serious harm and strengthening safety performance across operations.
For 2025, the Lost Time Incident Frequency (LTIF) increased to 1.67, compared with 1.53 in 2024, due to a higher number of reported Lost Time Incidents in certain business areas. In Logistics & Services, the increase primarily reflects improvements in safety reporting practices, supporting greater transparency and proactive risk management. At APM Terminals, the standardisation of reporting processes enabled a single, consistent approach and leading to more comprehensive and transparent reporting in 2025. In Fleet operations, incidents were mainly associated with slips, trips, falls and pinch-point injuries, which was addressed through targeted training and campaigns, leading to positive trend by end year.
In line with our commitment to learning and continuous improvement, 100% of learning teams were completed following high-potential incidents.
ACCOUNTING POLICIES
Fatalities
Fatalities is the headcount of work-related accidents leading to the death of the employee regardless of time between injury and death. Fatalities include own employees and contractors (non-employees) working under Maersk’s responsibility and supervision.
Lost time incidents
A lost time incident is a work-related injury, which results in an individual being unable to return to work and carry out any of his/her duties within 24 hours following the injury, unless caused by delays in getting medical treatment. Excluded from LTIs are suicide or attempted suicide, ‘natural causes’, incidents during the commute to and from the regular place of work and incidents which occur off the ship, but where the consequences appear onboard at a later point in time. LTIs are recorded separately for Maersk’s own employees and contractors (non-employees) working under Maersk’s responsibility and supervision. Beyond our own and non-employee workers, Maersk also relies on a diverse range of workers in our extended value chain, which are not included in our safety numbers.
Lost time incident frequency (LTIf)
Lost time incident frequency is the number of lost time incidents per million exposure hours. LTIs used to calculate the LTIf follows the definition for LTIs. Exposure hours are the total number of work hours in which an employee is exposed to work-related hazards and risks. Leave and non-work-related sickness are excluded from exposure hours.
Uncertainties and estimates
When preparing the lost time incident frequency, the exposure hours performed by Maersk’s own and nonemployees (contractors) are used as the basis for calculating the frequency. Since actual exposure hours are not registered for all employees across Maersk’s operations, Maersk applies estimates where actual exposure hours are not available. The estimates are based on the type of work and employee contracts, e.g. certain number of exposure hours for seafarers aboard a vessel and certain number of exposure hours for office-based employees.
Learning teams completed following a high potential incident
Learning teams completed following a high potential incident is calculated as the share of learning teams completed following a high potential incident has been recorded. The number of high potential incidents and learning teams completed is based on reporting by brands and maintained and quality-assured by the Group Safety & Resilience team of Maersk. To give the organisation sufficient time to complete a learning team and maintain completeness in our reporting, the reporting period runs from 31 October in the previous year to 31 October in the reporting year, i.e. for 2025 the reporting period is 1 November 2024 to 31 October 2025.
A high potential incident is defined as an incident or near miss with the potential to cause a life-altering injury or a fatality, and assessed using Maersk’s incident severity matrices.
A high potential incident may be exempted from conducting a learning team in cases where a full-scale investigation has been carried out by internal or external parties, or the involved parties are outside of Maersk’s operational control, or legal circumstances does not allow us to engage due to a legal investigation, or due to a recurrence of an incident for which a learning team has been previously completed.
Governance information
Overview of our material impacts, risks and opportunities related to Governance.
Business ethics
Legal and regulatory compliance
NO CHANGE Impact and risk of cases of noncompliance on anti-corruption laws, international sanctions or transport of illegal goods
The legal and regulatory landscape in which Maersk operates is complex, and Maersk could be subject to compliance cases in connection with violations of anti-corruption laws, international sanctions, transportation of illegal goods, competition law and/or data privacy. Corruption can negatively impact company culture and society, eroding trust and exacerbating inequality in societies.
Grievance and remedy
NO CHANGE Access to grievance and remedy for affected stakeholders
Potential barriers to access grievance mechanisms for our stakeholders (e.g., language, fear of retaliation, psychological or physical barriers) could result in violations of rights and lack of access to remedy. The risk is heightened in the value chain.
Sustainable procurement
Supplier relationship management
NO CHANGE Risks of noncompliance with Maersk’s standards by our suppliers Risks of suppliers not complying with Maersk’s standards, including the Supplier Code of Conduct, could lead to Maersk being subject to cases and incidents that negatively impact Maersk’s reputation and trust with customers and/or direct financial costs.
Payment practices
NO CHANGE Ensuring timely and fair payment practices to suppliers
Potential impact on suppliers’ working capital and cash flow affecting their financial and operational stability. Especially with regard to late payments for small and medium-sized undertakings. Where Value chain Time Short term Data and AI ethics
Ethical use of data and AI
NO CHANGE Ethical use of our stakeholders’ data and protection of individuals’ right to privacy
Potential risk of undue influence, mishandling and abuse of data and artificial intelligence can have negative implications to the customers and business partners whose data has been handled unethically. This erodes trust in Maersk as a business partner. Potential violation of employees’ and consumers’ right to privacy if their personal data is not handled responsibly.
Responsible tax
Tax governance
NO CHANGE Risk of different interpretations and tax controversy
Tax regulations are complex and differences in interpretation is considered a key risk, with impacts depending on the specific situation.
Responsible business conduct
A.P. Moller - Maersk (Maersk) is a purpose-driven company operating in a complex environment that relies on integrated global supply chains. Our commitment to operate based on responsible business practices underpins our efforts to ensure compliance with relevant laws, regulations and responsible business conduct, while adequately mitigating risks.
IROs
Grievance and remedy
Access to grievance and remedy for affected stakeholders
As a global leader in logistics services, Maersk serves 100,000+ customers and operates in almost 130 countries with a complex footprint across our business segments and value chain. We work to ensure that we have the right corporate culture to live up to Our Purpose and Core Values. Our approach is driven by our Commit governance framework and ESG categories on business ethics, sustainable procurement, data ethics and AI, and responsible tax.
Corruption undermines social and economic development, destabilises the business environment and adds to the cost of doing business and participating in global trade. Sanctions and export controls have grown exponentially over the last couple of years, and with growing geopolitical tensions, they are impacting global trade more than ever. Anti-competitive behaviour distorts fair market conditions, impacting global supply chains.
In this dynamic business environment and complex legal and regulatory landscape, it is imperative for Maersk to continuously enhance our compliance programme to adapt to evolving regulatory requirements, market conditions and geopolitical events. Increasing regulation on value chain due diligence, including the EU Corporate Sustainability
Due Diligence Directive, is also raising the importance of ensuring that Maersk’s suppliers meet our global standards and local laws around business ethics, human and labour rights, working conditions and employment practices and environmental responsibility.
Across the industry, Maersk also sees a sharp rise in contraband, from narcotics to illegal wildlife and timber trafficking, and stolen and counterfeit goods. These criminal activities continue to affect our supply chain and require ongoing, proactive management to mitigate the risks of threats to people, bribery attempts and operational disruptions that are often associated with contraband trafficking. Finally, as the digitalisation of supply chains continues to accelerate, including the rapid adoption of generative AI, responsibly managing data from business partners and customers has never been more relevant to maintaining their trust in Maersk.
Grievance and remedy
Maersk promotes a ‘speak-up’ culture where everyone is encouraged to voice and share concerns and feels safe doing so. This is core to our Code of Conduct and supported by a strict zero-tolerance and nonretaliation policy. Employees and stakeholders have access to multiple channels to raise issues confidently.
Our whistleblower programme, anchored in the Maersk Commit framework, is a key process and reporting channel. The programme is independently managed on a third-party platform and complete confidentiality is maintained, including the option of anonymous reporting. Whistleblower reports are supported by effective investigations led by independent and impartial investigators, with follow-up actions taken to address violations and implement controls that prevent recurrence. The investigators follow standardised investigation procedures, outlined in our misconduct reports and investigation process documents,
The three core elements of Commit
Maersk’s internal governance framework
Our Commit governance framework sets the foundation for how we work in Maersk to ensure compliance with relevant laws, regulations and responsible business conduct, as well as having adequate risk mitigation. The framework is structured around three core elements:
Our guiding Core Values have been shaped and strengthened since our foundation in 1904. These were updated in 2022 to ensure that they are consistently interpreted, easy to apply and have a strong connection to Our Purpose. Read more on Maersk.com.
Our Code of Conduct sets global standards for how we engage with colleagues, customers, suppliers, communities, authorities and other stakeholders. The Code of Conduct is routinely maintained to ensure alignment with internal and external requirements.
21 rules of business ethics, governance and authority are included in the governance framework, providing detailed internal instructions for all employees covering high-risk areas. These are subject to internal controls and an annual internal assurance process.
while also complying with local laws when doing investigations, including the protection of data privacy.
To make the whistleblower programme accessible to everyone, including employees and external stakeholders, and to reflect the global nature of our business, the mechanism is available in 73 languages via phone hotlines and in 20 languages through the online reporting portal. The whistleblower channel is publicly available on Maersk.com and by telephone, and integral to both our Code of Conduct and Supplier Code of Conduct. We actively monitor the number of cases raised across our stakeholder groups as an indicator of the level of awareness and trust in our whistleblower programme and to strengthen our speak-up culture. In 2025, 1,174 whistleblower reports in scope of the programme were received, up 24% compared to 2024, indicating strong trust in the programme and successful awareness campaigns. During 2025, we had 3 cases on discrimination in the workforce. We had no severe human rights incidents during the 2025 reporting year.
In addition to the whistleblower programme, other internal channels are available for our employees to ask questions or raise concerns such as direct management or leaders, our Compliance, People or Ombuds functions, and our employee assistance programme. Maersk’s internal Ombuds function acts as a neutral, independent, informal and confidential function providing an alternative for employees who feel uncomfortable raising concerns in other channels. The function offers a voluntary safe place for employees to seek guidance, voice concerns or discuss options for any work-related matter.
Launching a new Whistleblower system
In 2025, we implemented a new whistleblower system with enhanced case management capabilities, simplified intake, built-in artificial intelligence, machine translation, embedded tools and templates, and improved dashboard and reporting features. To support the rollout, we launched the Speak Up campaign across all our locations, targeting both direct and indirect workers. We also rolled out training programmes for investigators.
Conclusion of NCP case
1,174
In August 2025, NCP Denmark (the Danish Mediation and Complaints Handling Institution for Responsible Business Conduct) made their final statement on the case against Maersk regarding the joint venture of Douala International Terminal in Cameroon. NCP Denmark concluded that Maersk has satisfactorily implemented the recommendations provided by the NCP. Maersk actively engaged with NCP Denmark throughout the investigation, and we continue to value opportunities to review and strengthen our processes to respect international standards. No other NCP cases have been filed or closed during 2025.
Political engagement and advocacy
Maersk is actively involved in shaping policy and regulatory discussions at global and regional levels on relevant topics ranging from safety and security to international trade. The Executive Leadership Team is overseeing Maersk’s political engagement and advocacy efforts. A key focus for our political engagement efforts continues to be the decarbonisation of the maritime and logistics industries. Maersk’s position is that shipping is global and therefore global regulations, such as the International Maritime Organization (IMO)’s Net-Zero Framework, are needed for shipping to reach its climate goals.
In Europe, it is essential to maintain a steady focus on implementing the Fit for 55 framework, while making adjustments to bridge the uncertainties that companies can face as part of the transition. At the EU level, Maersk welcomes the progress made in recent years on ambitious green legislation and we continue our engagement for reaching these targets while addressing the competitiveness concerns of sustainable solutions.
Maersk adheres to policies and procedures to ensure responsible lobbying. The company is part of the EU Transparency Register (registration number 680443918500-51).
Maersk does not provide financial or in-kind donations to politicians, regulators or political parties. In Denmark, we are members of trade associations such as Danish Shipping and Danish Industry, which may allocate political contributions on behalf of their sectors; these decisions are made solely by the associations. In the US, Maersk operates a Political Action Committee (PAC) where voluntary contributions from individuals support candidates or issues, subject to strict legal limits and reporting requirements. In 2025, PAC donations totalled USD 16,500, and no other political contributions were made by Maersk.
Maersk actively participated in key global meetings during the year, including IMO MEPC (in April and October), New York Climate Week and COP30, emphasising the need for stronger global commitments to decarbonisation. At New York Climate Week, Maersk's and APM Terminals' leaders and sustainability experts participated discussions from decarbonising ocean and smart freight to climate investment strategies and the UN Global Africa Business Initiative.
Business ethics
Corruption, sanctions and export controls, competition law violations and data privacy are Maersk’s most material business ethics risks. Our policies, approach and governance around business ethics ensure a high standard for responsible business practices everywhere we operate, aligned with international requirements, and with heightened focus in jurisdictions with greater exposure to these risks and human rights abuses.
Digitalisation
Digitalisation of our key compliance approvals and processes remains an important provider of insights into operational and compliance risk trends and patterns within our business. In 2025, we continued rolling out and refining our ‘Minerva’ automated sanctions screening platform to adapt to evolving trade regulations. We also continued integrating working with sustainable procurement and vendor data management to integrate third-party management screening and assessment at the process level during vendor onboarding. We use data to monitor activities of interest throughout the organisation – we monitor our ERP system using compliance algorithms to flag transactions of interests to ensure adherence to our policies
Compliance spot checks
Legal and regulatory compliance
Impact and risk of cases of noncompliance on anti-corruption laws, international sanctions or transport of illegal goods
Targets and progress
Maersk has the strategic target of 100% of in-scope employees completing annual training on our Code of Conduct. In 2025, we achieved a rate of 92%. Risk assessments are an integral tool used to inform and target our compliance activities, and we have set the qualitative target of anchoring compliance risks ownership in our respective business functions.
100% of employees (in scope) trained in the Maersk Code of Conduct (2024: 94%)
Key actions
As we advanced our ambition to have a best-in-class compliance programme, we embarked on a suite of projects over a period of two years. Highlights in 2025 include:
Based on our Commit Rule framework, over 67 compliance spot checks were conducted in selected entities and processes, determined by location risk, annual risk assessment, legislative climate etc. These spot checks covered critical risks in anti-corruption, sanctions compliance, competition law and data privacy.
Risk assessments
After a successful pilot with a joint venture entity, we conducted kickoff meetings with the first functional entity at the end of 2025, and will start the full risk assessment roll-out in January 2026 with this entity as well as subsequent entities throughout the year.
Refinement of key processes
We further refined key processes, including the deployment of a new whistleblower system and an improved Conflict of Interest declaration/ revalidation process.
Policies and approach
The Maersk Code of Conduct sets global standards for how we engage with colleagues, customers, suppliers, communities, authorities and other stakeholders. Maersk takes active responsibility for the society and environment where we operate around the world, and is guided by international standards such as the Universal Declaration of
Human Rights, the principles of the UN Global Compact and the OECD Guidelines for Multinational Enterprises on Responsible Business Conduct. The Code of Conduct is publicly available on Maersk.com, in 17 languages.
Employees are required to take Code of Conduct trainings (onboarding and yearly refreshers). We also conduct ongoing campaigns and activities linked to international awareness events such as Business Ethics Day, Anti-Corruption Day, and Illegal Wildlife Day. We have launched our campaign #IOWNMYROLE to encourage each employee to take personal ownership of compliance and ethical behaviour in their daily activities. Other ongoing communication activities include our Speak Up and No Retaliation campaigns, Sanctions and Export Controls awareness, Dawn Raid Preparedness and Data Privacy Due Diligence Check campaign.
At Maersk, we are committed to investigating allegations of business misconduct promptly, independently and objectively. Protocols are in place for internal investigations and disciplinary actions to ensure a swift and effective response to compliance violations. Cases of non-compliance are reported to the Board and to the Executive Leadership Team through the Risk and Compliance Committee.
The respective Commit Rules covering anti-corruption, sanctions and export controls, competition law violations and data privacy set out the measures to identify, mitigate and manage compliance risks in jurisdictions where we operate. These efforts are carried out through dedicated teams of 70+ Compliance professionals and a comprehensive Business Compliance Ambassadors’ network of 70+ employees embedded throughout the organisation. These experts, represented in all our regional offices and many high-risk locations, partner with colleagues in the business to detect, assess and mitigate risks. Maersk is also a founding and active member of the Maritime Anti-Corruption Network, a network working to eliminate corruption in the maritime and port industries. Maersk is joining other world leading companies in OECD’s Anti-Corruption Leadership Hub, Galvanizing Private Sector initiative and Business at OECD to ensure that our activities are aligned with the latest developments in the fight against corruption. In 2025, Maersk joined Business at OECD’s committee on Responsible Business Conduct as vice-chair to drive a balanced and effective implementation of the OECD Guidelines for Multinational Enterprises.
Sustainable procurement
Maersk relies on a global network of approximately 40,000 suppliers to support our business and create value for our customers. Sustainable procurement is essential to managing supplier base risk, maintaining customer trust and ensuring that ESG is embedded in the entire supplier lifecycle.
IROs
Supplier relationship management
Risks of noncompliance with Maersk’s standards by our suppliers
Payment practices
Ensuring timely and fair payment practices to suppliers
Targets and progress
In 2025, we achieved our target of securing full commitment from all in-scope suppliers to Maersk Supplier Code of Conduct (SCoC), reinforced by a mandatory Sustainable Procurement clause. This was enabled by our strengthened source-to-contract process and supplier engagement, ensuring sustainability requirements are adhered to throughout the supplier lifecycle.
While we do not have specific targets for payment practices, we strive to treat all suppliers responsibly, also when it comes to payments.
Key actions
This year’s actions reflect our efforts to integrate sustainability into core procurement processes, reinforce stakeholder trust and position Maersk to meet evolving regulatory expectations under the Corporate Sustainability Reporting Directive (CSRD) and Corporate Sustainability Due Diligence Directive (CSDDD).
ESG integration in supplier lifecycle and ESG platform roll-out
In 2025, Maersk deployed a supplier risk assessments ESG Platform, expanding coverage across our supplier base. The platform assigns risk scores based on country and industry risks, business criticality and suppliers’ performance across ESG topics, enabling prioritisation of high-risk suppliers for further engagement and continuous improvement. A centralised ESG dashboard provides real-time visibility into supplier performance, enabling continuous monitoring, improved data quality and enhanced governance, allowing us to work on hotspots while strengthening due diligence and compliance practices in line with our SCoC expectations.
Supplier engagement and capacity building
We continuously focus on creating awareness and building capacity both internally and with our suppliers. To address supply chain risks and impacts, Maersk undertook audits, assessments and on-site ‘Gemba’ visits in 2025, with a focus on labour rights, occupational health and safety, and fair working conditions. Improvement plans and follow-ups are in place to ensure continuous supplier practice improvement for identified gaps. This year, we also strengthened the maturity of our approach with an internal self-assessment that shaped targeted ESG playbooks to drive integrated, measurable and actionable performance.
Building visibility of supplier related payments
We ensured fair and timely supplier compensation through active monitoring of payment timeliness. In 2025, our procure-to-pay compliance rate remained consistently high, minimising the impact of delayed payments on suppliers.
Policies and approach
Maersk’s Sustainable Procurement Programme is designed to advance responsible sourcing that minimises environmental footprint, upholds ethical standards, and creates long-term value. Sustainability is therefore embedded throughout the supplier lifecycle and supported with data-driven insights. This includes contractual supplier selection and management through pre-qualification screening (based on environmental performance, labour practices and safety standards); inclusion
of ESG clauses in supplier contracts, aligned with Maersk’s Supplier Code of Conduct and sustainability policies; and maintaining continuous oversight and improvement once partnerships are in place. Our approach is anchored by three policies:
Our Supplier Code of Conduct (SCoC) outlines the minimum standards expected from suppliers to ensure ethical, socially responsible and environmentally sustainable business practices. It is grounded in internationally recognised frameworks, including the UN Global Compact, ILO Conventions, UN Guiding Principles on Business and Human Rights and ISO standards on Health, Safety & Environment. Policy scope includes Health, Safety & Security; Labour Rights; Working with Integrity; Environmental Responsibility; Implementation & Accountability; Grievance and Remedy Mechanism; and tracking of supplier SCoC commitment. Maersk’s Supplier Code of Conduct is publicly available on Maersk.com, it is translated into 12 languages and communicated across multiple channels. In 2025, we created guidelines that are now an integral part of the SCoC, to help suppliers apply its principles and standards.
The sustainable procurement commit rule is aligned with Maersk’s sustainability strategy and embeds ESG principles into our source-tocontract process and supplier engagement. This internal governance document is applicable to all employees involved in supplier interactions. Anchored within Maersk’s governance framework, it provides employee guidance on how to select, engage and manage suppliers responsibly across the value chain. The rule was updated in 2025 and is available through internal channels and mandatory training courses.
Our global vendor payment policy safeguards our efforts to ensure fair and timely payment practices, particularly for small and medium-sized enterprises, as part of responsible supplier engagement. The policy is applicable across Maersk and its subsidiaries. Unless otherwise agreed and subject to local and national legal requirements, Maersk’s standard payment terms are in line with EU law. Internal tools provide visibility on payment practices, minimise late payments and improve supplier experience through prompt, equitable payments.
Data and AI ethics
Responsibly managing data from customers, business partners and employees is a critical issue in today’s society. AI has a transformational impact on logistics and requires effective governance in place to responsibly unlock future innovation. Through strong governance and ethical use of data and AI, we mitigate risks and position Maersk as a digital frontrunner in our industry, in alignment with Our Purpose and Core Values. This is essential to our customers, partners and our strategy.
IRO
Ethical use of data and AI
Ethical use of our stakeholders’ data and protection of individuals’ right to privacy
Targets and progress
While we do not have specific targets for Data and AI ethics, these are part of Maersk’s Code of Conduct. All Maersk’s office-based employees must complete Maersk’s Code of Conduct training annually. Refer to the Business ethics section of this report for more information on the completion rate of the Code of Conduct training.
Key actions
Maersk continued to strengthen the foundations needed to manage data and AI responsibly across the organisation. The key actions taken during the year reflect our commitment to trust, regulatory readiness and responsible innovation:
Preparing for emerging data and AI regulation
Risk-based classification of AI systems, documentation practices and clearer oversight routines were introduced to align with global regulatory expectations, including the EU AI Act.
Building long-term resilience through a risk-based approach
A unified framework for data and AI risks (compliance, ethics and quality) was established, enabling leadership to prioritise the most material exposures and guide focus where risks need to be mitigated.
For 2026, Maersk will focus on stabilising these foundations, further maturing AI governance and embedding a risk-based approach that ensures responsible and compliant use of data and AI across the enterprise.
Policies and approach
Maersk’s Data Ethics Policy sits at the core of how we design, develop and deploy data-powered and AI-enabled solutions. It expresses our leadership ambition to use data and technology responsibly and in ways that uphold trust with customers, partners and employees.
The Data Ethics Policy is anchored in four principles – Transparency, Respect, Security and Innovation – and guides how we collect, handle and use data across our global operations. As our logistics products rely increasingly on intelligent and data-driven capabilities, these principles ensure that innovation is matched with accountability and that data is used to create value without compromising stakeholder confidence.
All Maersk data and AI policies and standards further details and complements this by embedding responsible AI expectations into the lifecycle of AI systems and aligning them to Maersk’s Commit governance framework. Our internal guidelines direct teams through responsible development and deployment of AI, including risk classification
of AI systems, transparency for limited-risk use cases, documentation obligations and the oversight and record-keeping required for compliance with the EU AI Act.
The policies are reinforced through awareness programmes, operating procedures, technology standards and embedded controls that help ensure consistent, safe and responsible use of data and AI across Maersk’s products and platforms. Oversight is provided by the executive Risk & Compliance Committee, with operational governance driven through the enterprise Data & AI Ethics Committee and supporting working groups.
These policies apply to all Maersk entities, employees, contractors and controlled joint ventures. They are publicly referenced through our Code of Conduct, with internal AI and Data Ethics standards providing practical guidance for day-to-day decision-making as we scale data and AI in our operations.
Responsible tax
Maersk strives to act responsibly and with integrity in all tax matters. We work closely with tax authorities to ensure that we fully disclose relevant information and pay the correct amount of taxes while balancing obligations towards our shareholders.
IROs
Tax governance
Risk of different interpretations and tax controversy
Targets and progress
We have not set measurable targets in regard to responsible tax. We aspire to act responsibly and with integrity in all tax matters and strive to be compliant in every jurisdiction across the world, considering both the letter and the spirit of the law.
Key actions
Accelerating automation
This year, we focused on building resilience and accelerating automation to ensure agility and sustained compliance as legislation and reporting requirements continue to evolve rapidly.
Policies and approach
The Maersk Responsible Tax approach is incorporated in the Maersk Code of Conduct and applies to the entire Group (entities and employees). The Maersk Tax Principles and Strategy are approved by the Audit Committee on behalf of the Board of Directors. We conduct and manage tax affairs in accordance with our Tax Principles, outlined in our 2025 Tax Report, which is publicly available here. These principles are reviewed annually and closely aligned with our Core Values and business strategy. We strive to be a compliant and accountable taxpayer in all countries where we operate. This includes:
• Managing tax risk and reputation with a responsible and transparent tax practice, e.g., instructions on the timely involvement of the global tax team.
• We do not engage in artificial structures or other tax-driven engagements.
• Accurate data provision required per law or upon request from authorities.
• Reporting of violations of group tax principles in line with internal procedures.
Our approach to tax risk management aligns with Maersk’s enterprise risk management and internal control framework, which includes tax controls. We constantly identify and manage tax risks to ensure adherence to our tax principles, including compliance with the letter and the spirit of the law. A clear procedure is in place for the assessment, management and reporting of identified tax risks, including quarterly updates to the Executive Leadership Team on both tax risks and tax strategy.
Our tax conduct is an ongoing effort with an ever-moving target as business and legal requirements continue to evolve. We allocate significant resources to secure our adaptation to continuously emerging compliance requirements and governance, including the digitalisation of work where feasible, thus ensuring a continued, robust and efficient in-house tax function.
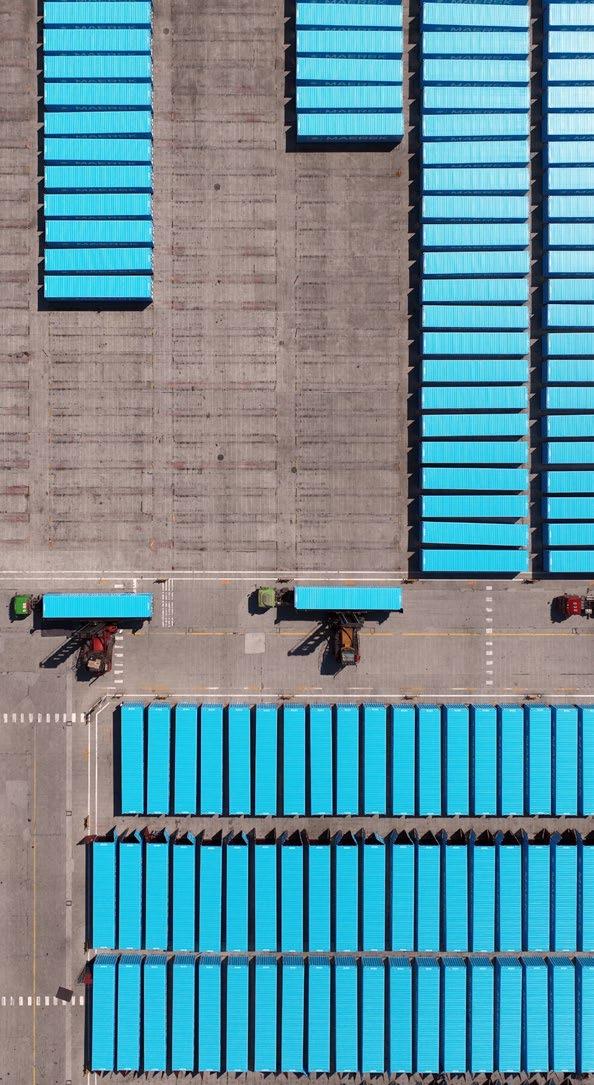
Performance data
Code of Conduct training
1 Not covered by the Independent Auditor’s limited assurance report.
Completion rate remains strong, with a minor variation from the previous year. We continue to reinforce awareness to maintain a strong compliance culture and strive towards a 100% completion rate for the employees in scope for the Code of Conduct training.
ACCOUNTING POLICIES
Code of Conduct training
ACCOUNTING POLICIES
Whistleblower cases
Whistleblower cases is the number of cases received by Maersk in the whistleblower system that are in scope during the reporting year. This definition has been updated compared to 2024, where we reported on all cases received in the Whistleblower system. Cases in scope relate to alleged violations of laws, Maersk’s Code of Conduct, or Maersk’s Business Ethics Rules.
Incidents of corruption and bribery
This includes cases of fraud, corruption and bribery, conflicts of interest, discrimination and harassment on protected grounds etc. Cases that are out of scope include routine employment issues, commercial issues and domestic matters unrelated to Maersk. We have therefore restated 2024 cases from 1,387 to 947. Whistleblower cases do not include cases reported via other channels such as Maersk’s Ombuds function.
Code of Conduct training is the completion rate of employees in scope for the Maersk Code of Conduct e-learning out of the total employee population in scope. The employees in scope for the e-learning are active office-based Maersk employees. This excludes office-based employees on long-term leave, consultants and employees that have joined Maersk after 31 October in the reporting year.
Whistleblower cases
The employees in scope of the Code of Conduct training cover 58% of the total employees in Maersk during 2025. The completion rate is based on registrations in Maersk’s learning management system.
EFRAG ID Indicator
G1-4_01 Number of convictions for violation of anti-corruption and anti-bribery laws # Nil Nil
G1-4_02 Amount of fines for violation of anti-corruption and anti-bribery laws USD Nil Nil
G1-6_04 Number of legal proceedings outstanding for late payments # Nil Nil
Maersk has not been convicted for violation of anti-corruption or anti-bribery laws during 2025 and thus no fines have been paid in relation to such cases. Likewise, no legal proceedings for late payments are outstanding per year-end 2025.
ACCOUNTING POLICIES
G1-1_02 S1-17_03 Cases
Cases which were unsubstantiated
Cases closed due to insufficient information
Cases open
In-scope whistleblower cases totalled 1,174 in 2025, up from 947 in 2024, reflecting continued engagement with speak-up channels. Substantiated cases primarily involved people conduct and workplace behaviour, along with ethical concerns, conflicts of interest, and misuse of company resources.
Three cases of discrimination on protected grounds were confirmed, resulting in dismissals and written warnings. No incidents related to human rights violations such as forced labour, human trafficking or child labour were reported during the year.
Number of convictions for violation of anti-corruption and anti-bribery laws
The number of convictions for violation of anti-corruption and anti-bribery laws includes all convictions as a result of legal proceedings against A.P. Møller - Mærsk A/S and/or any of its subsidiaries in the reporting year.
Amount of fines for violation of anti-corruption and anti-bribery laws
The amount of fines paid for violation of anticorruption and anti-bribery laws includes fines paid as a result of legal proceedings on these matters against A.P. Møller - Mærsk A/S and/or any of its subsidiaries in the reporting year.
Number of legal proceedings outstanding for late payments
The number of legal proceedings outstanding for late payments includes all legal proceedings against A.P. Møller - Mærsk A/S and/or any of its subsidiaries relating to late payments of business partners that are outstanding at year end.
Sustainable procurement
specific High-risk category/strategic suppliers assessed with improvement plans
1 Not covered by the Independent Auditor’s limited assurance report.
In 2025, we delivered on key milestones to advance responsible sourcing across our global supply chain.
We achieved 100% compliance with in-scope suppliers formally committing to Maersk’s Supplier Code of Conduct (SCoC) and accepting the mandatory Sustainable Procurement Clause. This was driven by intensified engagement with new and incumbent suppliers, supported by tailored communications and targeted follow-ups. ESG integration into our source-to-contract process was strengthened by introducing the SCoC at the pre-contract stage and systematically embedding the clause during contracting.
We made notable progress on ESG assessments for tier 1 high-risk and strategic suppliers, recording a 39 percentage point increase compared to 2024 and surpassing our 85% target. This improvement was enabled by an awareness programme designed to strengthen business understanding of the process.
To drive consistency and accountability, we introduced a suite of enabling tools, including digital dashboards for performance tracking, and embedded assessment results into supplier selection and business performance cycles.
We continue to work closely with suppliers to address gaps in SCoC adherence, through structured improvement plans, achieving an 83% closure rate and exceeding our 80% target. These plans remain a core mechanism for corrective actions identified via assessments, audits and continuous monitoring, supported by consistent follow-up to ensure timely completion and continuous improvement.
Building awareness and capability across the procurement community is critical to embedding ESG principles into everyday practices. In 2025, 99% of procurement employees had completed mandatory Sustainable Procurement training, underscoring our commitment to responsible sourcing and deeper ESG integration.
ACCOUNTING POLICIES
Suppliers committing to Maersk’s Supplier Code of Conduct
Suppliers committing to Maersk’s Supplier Code of Conduct (SCoC) is the percentage of existing valid contracts with active suppliers which include a sustainable procurement clause, a reference to SCoC in the contract or a CoC acknowledgment document out of the total number of valid active supplier contracts. The suppliers committing to Maersk’s SCoC is based on registrations in Maersk’s sustainable procurement database, DocuSign Insights.
Tier 1 high-risk category/strategic suppliers undergoing ESG assessments
Tier 1 high-risk category/strategic suppliers undergoing ESG assessments is the share of Tier 1 high-risk and strategic suppliers that have undergone an ESG assessment out of the total number of tier 1 high-risk category and strategic suppliers with valid contracts. The suppliers undergoing ESG assessments is based on registrations in database maintained by the sustainable procurement team.
High-risk category/strategic suppliers assessed with Improvement Plan successfully closed
High-risk category/strategic suppliers assessed with improvement plans successfully closed is the percentage of active high-risk category/ strategic suppliers with valid contracts that have successfully closed gaps observed within the agreed timelines through an improvement plan implementation out of the total high-risk category/ strategic suppliers with improvement plans. The suppliers assessed with improvement plan successfully closed is based on registrations made in the database maintained by the sustainable procurement team.
Procurement staff trained in sustainable procurement
Procurement staff trained in sustainable procurement (SP) is the completion rate of procurement employees in scope for the SP e-learning out of the total employee population in scope. The employees in scope for the e-learning in 2025 are procurement employees in Maersk. This excludes procurement employees on long-term leave and procurement employees that have joined Maersk after 31 October in the reporting year. The completion rate is based on registrations in Maersk’s learning management system.
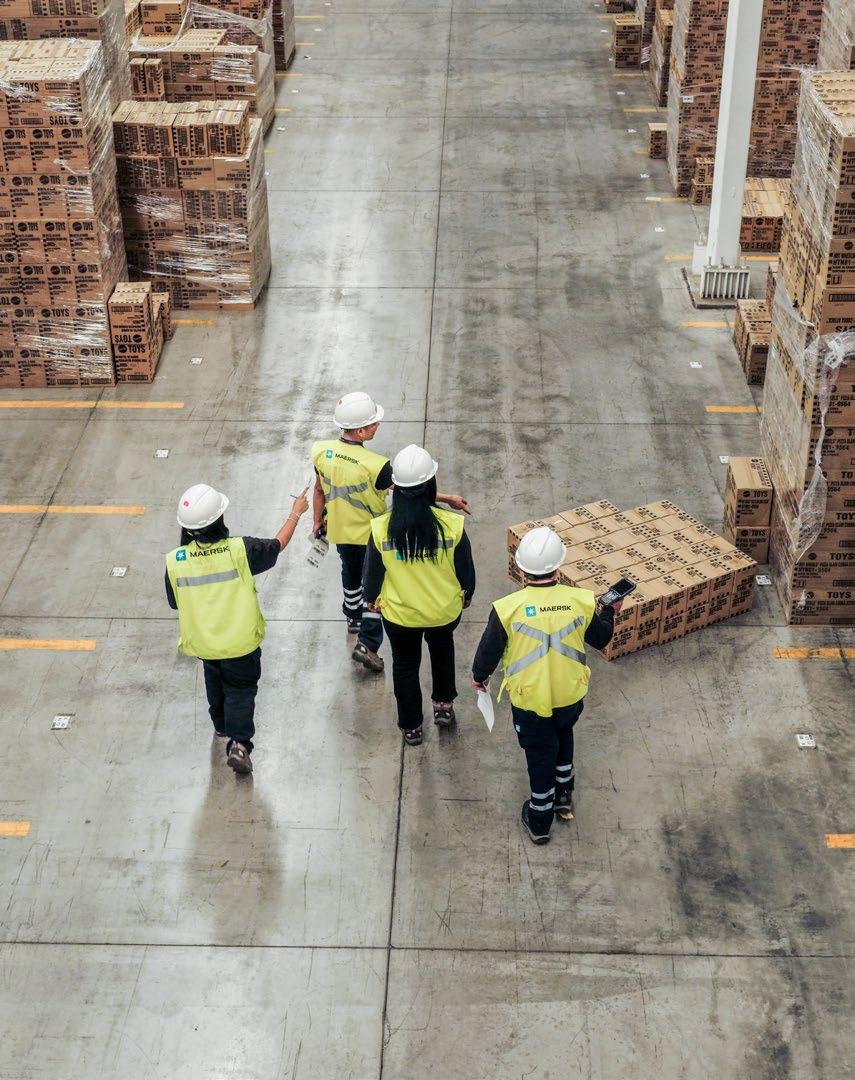
Disclosure requirements in ESRS covered by Maersk’s Annual Report 2025
The
General disclosures
Environment
General disclosures
BP-1
GOV-1
GOV-2
GOV-3
GOV-4
Pollution
Biodiversity and ecosystems
E4.IRO-1
Description of processes to identify and assess material biodiversity and ecosystem-related impacts, risks and opportunities Double materiality assessment 53 Stakeholder engagement 56
E4.SBM-3 Material impacts, risks and opportunities and their interaction with strategy and business model Environment and ecosystems 61
E4-1 Transition plan and consideration of biodiversity and ecosystems in strategy and business model Environment and ecosystems 79-80
E4-2
E4-3 Actions and resources related to biodiversity and ecosystems
E4-4 Targets related to biodiversity and ecosystems Environment and ecosystems 79-80
E4-5 Impact metrics related to biodiversity and ecosystems change Environment and ecosystems 79-80
Resource use and circular economy
E5.IRO-1 Description of the processes to identify and assess material resource use and circular economy-related impacts, risks and Double materiality assessment methodology 53 Stakeholder engagement 56
E5-1
E5-2
E5-3
E5-4
Affected communities
S3.SBM-2 Interests and views of stakeholders
S3.SBM-3 Material impacts, risks and opportunities and their interaction with strategy and business model
engagement 56
materiality assessment
Incorporation by reference
The table below provides an overview of where information can be found relating to ESRS disclosures that have been incorporated by reference and stated outside of the sustainability statement as part of other sections of this Annual Report or in the Remuneration Report.
S3-1 Policies related to affected communities
S3-2 Processes for engaging with affected communities about impacts
S3-3 Processes to remediate negative impacts and channels for affected communities to raise concerns
S3-4
engagement 56-57
and remedy 102-103
Taking action on material impacts on affected communities, and approaches to managing material risks and pursuing material opportunities related to affected communities, and effectiveness of those actions Grievance and remedy 102-103
Governance
G1.GOV-1
G1.IRO-1
diligence 55
Disclosure requirements that derive from other EU legislation
The table below provides an overview of ESRS data points that derive from other EU legislation, cf. ESRS 2 Appendix B and where this information can be found if deemed material.
General disclosures
GOV-1
GOV-1
GOV-4
SBM-1
SBM-1
Environment
E1-5
E1-5
E1-5
E1-6
E1-6
acquired electricity, heat, steam or cooling from fossil sources SFDR
Scope 1, scope 2 and scope 3 emissions
SFDR, Pillar 3, Benchmark 73
SFDR, Pillar 3, Benchmark regulation 76
S1.SBM-3
S1-1 20 (a)
S1-1
S1-1, S1-3
S1-1
(c), 32 (c)
S1-16
S1-17
S1-17
(a) - 97 (b) Gender pay gap, annual total remuneration SFDR, Benchmark regulation 97
ESRS data point Information Regulation Page
Affected communities
S3-1 16, 17
Human rights policy commitment to affected communities, whether policies are aligned with internationally recognised instruments, and general approach to human rights of communities SFDR, Benchmark regulation 55-57
S2.SBM-3
S2-1 17 (a), 19 Human rights policy commitments and approach related to value chain workers, aligned with internationally recognised standards SFDR 102-105
S2-1 17 (b) General approach to engagement with value chain workers SFDR 102-105
S2-1 17 (c) Approach to remedy for human rights impacts SFDR 102-105
S2-1 18, 19 Policies explicitly addressing forced labour and child labour, aligned with internationally recognised standards SFDR 102-105
S2-1 18 Undertaking has a supplier code of conduct SFDR 102-105
S2-4 19, 36
Severe human rights issues and incidents connected to value chain workers
SFDR, Benchmark regulation 102-103
S3-4 36 Severe human rights issues and incidents connected to affected communities SFDR 55, 63-71, 79-83, 102-104 Consumers and end-users
Governance
ESRS data point Information Regulation
G1-1 10 (b) (d) Statement if no policies exist in regard to anti-corruption and bribery and to protection of whistleblowers SFDR N/A G1-4 24 (a) Number of convictions and amount of fines for violations of anti-corruption and bribery laws SFDR 108
Summary Maersk’s EU Taxonomy KPIs
Proportion of revenue from products or services associated with taxonomy-aligned activities 2025
Environmental objective of taxonomy-aligned activities
Proportion of CAPEX from products or services associated with taxonomy-aligned activities 2025
Environmental objective of taxonomy-aligned activities
For more details on our green bonds allocation, please refer to the allocation reports for 2021–2025 which can be found here.
Proportion
of OPEX from products or services associated with taxonomy-aligned activities 2025
EU TAXONOMY ACCOUNTING POLICIES
In 2025, Maersk has continued to apply the climate change mitigation (CCM) technical screening criteria as our primary screening lens when assessing our economic activities. This is because our assessment shows that Maersk does not currently have eligible or aligned activities relating to the remaining five environmental objectives. As such, there are no risks of double counting eligibility or alignment numbers for activities across the environmental objectives.
For 2025, we have used the simplified EU Taxonomy reporting tables, aligned with the EU Omnibus simplification package.
In 2025, we updated our approach to screening vessels under 6.10 criteria to reflect the additional guidance issued by the European Commission in March 2025. The Commission’s clarification introduced stricter application rules for the reduction factors, which meant that 18 vessels that would previously have been classified as aligned no longer meet the alignment criteria under the updated methodology. The refinement of the methodology also resulted in a restatement of our 2024 EU Taxonomy-aligned figures to ensure full comparability between reporting years and to accurately reflect the Commission’s interpretation.
As the EU Taxonomy regulation matures and evolves, we will change and expand our reporting accordingly, which may also impact the taxonomy KPIs previously reported.
The taxonomy-eligible KPIs have been calculated as:
• Taxonomy-eligible revenue KPI = eligible revenue/ total revenue
• Taxonomy-eligible CAPEX KPI (additions) = eligible CAPEX/total CAPEX
• Taxonomy-eligible OPEX KPI (repair and maintenance) = eligible OPEX/total OPEX
Maersk’s process for determining taxonomy-eligible activities (the numerator of the taxonomy-eligibility KPIs) has followed a three-step approach:
1. Defining the economic activities that Maersk is engaged in within each of the segments across the Group
2. Assessing whether said activities are covered by the economic activity descriptions included in the EU Taxonomy Climate Delegated Act
3. Allocating revenue, CAPEX (additions) and OPEX (repair and maintenance) according to the company’s overall assessment of whether an economic activity is eligible or not.
First, determination of the share of economic activities in Maersk that are taxonomy eligible is based on activity codes in the financial consolidation system, which also forms the basis for Maersk’s external financial reporting. As such, activity codes have been defined as an economic activity.
Second, based on the descriptions of what is registered on Maersk’s activity codes, an assessment has been made of whether these activities are covered by the activity descriptions that are included in the EU Taxonomy Climate Delegated Act.
Third, depending on whether the registrations are related to assets or processes associated with taxonomy-eligible economic activities, the revenue, CAPEX and OPEX registered on these activity codes are assessed to be eligible or noneligible and allocated accordingly.
The denominator for the eligibility KPIs has been defined as:
• Total revenue as stated in note 2.1 segment information of the consolidated financial statements.
• Total CAPEX (additions) as stated in note 3.1 intangible assets, note 3.2 property, plant and equipment and note 3.3 right-of-use assets of the consolidated financial statements. Additions related to goodwill, customer relationship, concessions rights and concession leases are excluded from total CAPEX.
• Total OPEX related to repair and maintenance of eligible and non-eligible assets.
The taxonomy-aligned KPIs have been calculated as:
• Taxonomy-aligned revenue KPI = aligned revenue/ total revenue
• Taxonomy-aligned CAPEX KPI (additions) = aligned CAPEX/total CAPEX
• Taxonomy-aligned OPEX KPI (repair and maintenance) = aligned OPEX/total OPEX
Maersk’s process for determining taxonomy-aligned activities (the numerator of the taxonomy KPIs) has been based on screening the identified eligible activities within each of the segments against the technical screening criteria for climate change mitigation.
For Ocean, revenue from aligned vessels has been prepared by applying an allocation key to total Ocean revenue. The allocation key is based on transport work from aligned vessels out of the total transport work during the year. 1) CAPEX additions in relation to existing aligned vessels; 2) expenditures for existing vessels undergone retrofitting that meet the
technical screening criteria and 3) milestone payments for ordered dual-fuel vessels incurred during the year. Aligned OPEX is the repair and maintenance expenditures in relation to aligned vessels incurred during the year.
For Terminals, revenue from aligned electrified equipment has been prepared by applying an allocation key to total terminal revenue. The allocation key is based on the carrying amount of aligned electrified equipment out of the total carrying amount of terminal assets (excluding assets under construction). Aligned CAPEX (additions) is the CAPEX additions in relation to electrified equipment, solar panels and charging stations incurred during the year. Aligned OPEX is the repair and maintenance expenditures in relation to aligned electrified terminal equipment incurred during the year.
For Logistics & Services, revenue from aligned activities, which includes electrical trucking and rail freight, has been prepared based on the following approaches:
• Trains: Maersk does not currently own or lease trains, which means that there is no related CAPEX or OPEX. The allocation of revenue is based on the revenue generated on electrified corridors and operated by vendors that have documented alignment with the EU Taxonomy criteria.
• Trucks: The preparation of the revenue, CAPEX and OPEX KPIs are based on the separate accounting that is kept for the electric trucks.
• Solar panels and charging stations: CAPEX is identified based on regional accounting registrations. This activity is not relevant for revenue or OPEX.
Do no significant harm (DNSH)
We have assessed and documented compliance with the DNSH criteria relating to the eligible activities in scope for Maersk’s Taxonomy reporting. Since we only screen for substantial contribution for ‘Climate change mitigation’, we have screened our eligible activities for DNSH compliance with ‘Climate change adaptation’, ‘Sustainable use and protection of water and marine resources’, ‘Transition to a circular economy’, ‘Pollution prevention and control’ and ‘Protection and restoration of biodiversity and ecosystems’. Only when we have been able to document compliance with all applicable DNSH criteria, we have assessed an activity to be aligned. Consequently, if an activity fails to meet one or more of the DNSH criteria, we have assessed that activity to be eligible but not aligned.
Minimum safeguards
Maersk and its subsidiaries are committed to conducting business in a responsible and upright manner and to respect human rights across our activities, in line with the Maersk Values. We endorse the principles of the UN Guiding Principles on Business and Human Rights (UNGPs) and the OECD Guidelines for Multinational Enterprises. Maersk’s compliance with the Minimum Safeguards as outlined in the EU Taxonomy regulation has been performed at a Group level and is based on the following assessment: Human rights: The company is committed to conducting human rights due diligence (HRDD) as outlined in the UN Guiding Principles (UNGPs) and OECD Guidelines for Multinational Enterprises (MNEs). Please refer to Maersk’s Human Rights Policy. Maersk continuously identifies and assesses human rights risks via relevant due diligence processes. In 2021, the company conducted a corporate-wide human rights assessment, please refer to the 2021 Sustainability Report and the human rights information in this report for more. Further, there is no indication that Maersk does not adequately implement HRDD resulting in human rights abuses, as the company has not been finally convicted in court cases on labour law or on human rights. Moreover, Maersk is committed to engaging with stakeholders through the mechanisms stated in the EU Taxonomy regulation, including OECD National Contact Points or the Business and Human Rights Resource Centre (BHRRC) and there are no signals that Maersk does not engage. Corruption: Maersk has in place an anti-corruption policy and adequate internal controls, ethics and compliance programmes and measures for preventing and detecting bribery. Please refer to the governance and business ethics sections of this report. In addition, none of Maersk’s senior management, including the senior management of its subsidiaries, have been convicted in a court of corruption.
Taxation: Tax is treated as an important topic of oversight, anchored with the highest governing bodies in Maersk, and the company has put in place adequate tax risk management strategies and processes as outlined in OECD MNE Guidelines covering tax. Furthermore, the company has not been found guilty of tax evasion.
Fair competition: The company promotes employee awareness of the importance of compliance with all applicable competition laws and regulations and trains senior management in relation to competition issues. Compliance with competition laws and regulations is a core part of Maersk’s Code of Conduct, which Maersk employees are training in every year. Moreover, none of Maersk’s senior management, including the senior management of its subsidiaries, have been found in breach of competition laws.
UNILABS
The CSR statement from Unilabs’ Annual Report for 2025 is enclosed on the next pages.
STATEMENT OF CORPORATE SOCIAL RESPONSIBILITY ACCORDING TO THE DANISH FINANCIAL STATEMENTS ACT, SECTIONS 99B AND 99D
Statutory statement on CSR in accordance with section 99b of the Danish Financial Statements Act
Business Model
For the Unilabs business model, refer to the description of key activities as mentioned above.
Corporate Social Responsibility
Unilabs’ mission for a healthier tomorrow underpins our aspiration to help millions of people to maximise their lives by empowering them to manage their health, delivered through socially and environmentally responsible laboratory, imaging and pathology diagnostic services. Unilabs is future-proofing for the changing environment with growing sustainability concerns and shifting market and patient preferences.
In preparation for the evolving regulatory landscape, Unilabs has initiated a series of strategic ESG activities, inspired by the Corporate Sustainability Reporting Directive (CSRD). Although the CSRD compliance deadline has been extended to 2028 following the Omnibus Directive, Unilabs is proactively using this additional time to strengthen its internal ESG governance and enhance its external positioning. Key activities include the mapping and assessment of current ESG governance structures, identification of improvement areas, and the development of a future-ready governance model aligned with ESRS (European Sustainability Reporting Standards).
Additionally, Unilabs is conducting a comprehensive analysis of ESG-related requirements in public and private tenders, benchmarking its current ESG performance, and defining a tailored ESG strategy and implementation roadmap. These efforts aim to ensure that Unilabs not only meets future regulatory obligations but also leverages ESG as a strategic differentiator in the marketplace.
Risk Assessment and Policies
Environment and Climate Change: During 2025, Unilabs intensified its efforts to embed sustainability across its operations and strategy. The Group advanced its ESG framework by refining ambition levels, conducting benchmarking and peer comparisons, and strengthening governance structures to ensure alignment with emerging regulatory requirements.
External Carbon Footprint Assessments continue to guide Unilabs’ environmental strategy. The latest outcomes reaffirm the importance of maintaining a comprehensive Greenhouse Gas Emissions inventory (GHG Inventory) to strengthen the baseline and deepen understanding of emissions across all scopes. Management estimates that approximately 7 % of emissions fall under Unilabs’ operational control (Scope 1 and 2), while 93 % originate from indirect sources (Scope 3), including purchased goods and services, waste disposal, employee commuting, and business travel. Unilabs remains committed to progressively reducing its environmental footprint, with the long-term ambition of achieving net-zero impact. This focus is integral to ensuring sustainable growth and delivering low-carbon products and services to customers.
By the end of 2025, the share of electric vehicles in our fleet reached 7.8 % (2024: 5.3%), marking progress in our transition strategy. In alignment with our Fleet Strategy, our goal is to replace vehicles with electric or hybrid models as lease agreements expire, prioritizing countries with the most developed charging infrastructure. This approach, combined with the planned implementation of renewable electricity starting in 2026, will drive substantial reductions in Scope 1 and 2 emissions under Unilabs’ control.
Social and Employee Conditions: Unilabs strives to foster an inclusive corporate culture with equal opportunities, sponsoring respect and appreciation for diversity in a setting where every viewpoint counts. E.g. Unilabs is proud to have gender parity with 60% women and 40% men in management positions.
Unilabs takes responsibility for employees’ health by adopting controls to reduce occupational risks at its facilities, thereby mitigating the risk of injuries and cases of illness by:
• Assessing workplace risks and developing action plans to address non-conformities found.
• Providing visibility of injuries and illnesses to the leadership teams, raising awareness of health and safety performance, and systematically addressing learning from events.
It is important to stress that local laws play a key role in health and safety matters, and one of Unilabs’ primary objectives and priorities is to ensure local compliance with each respective country’s applicable legislation.
Unilabs continually strives to enhance employee engagement. Key initiatives include:
• Acting upon insights gained from the yearly Global People Survey to enhance overall engagement across the business.
• Enhancing Unilabs’ culture through activities such as organization of local team events and team-building activities.
• Upskilling Unilabs employees and job satisfaction with improved processes, organization, and tools enabled by the multi-year system implementation initiatives in HR, Procurement and Finance. This has been further complimented by offering a curriculum for skills needed to excel and realize their potential
• Supporting senior managers with targeted training and development initiatives that enhance their effectiveness in navigating the challenges of a fast-paced organization and managing their teams with an approach that focuses on foster close engagement and growth.
• Continuously improving communication through leadership forums, townhalls and publications.
Unilabs continued to advance employee development in 2025 through a combination of local on the job training covering new equipment, procedural updates, quality requirements and accreditation standards and Group wide initiatives designed to build capabilities across all markets. While the decentralised nature of our operations does not allow for consolidated global reporting of all locally delivered training, capability building remains embedded in daily practice. At Group level, the GoodHabitz learning platform remained fully accessible to all employees, complemented by leadership and Change Management sessions offered to people managers to support ongoing transformation efforts. Employee engagement and development perceptions were monitored through the Global People Survey to guide continuous improvement.
Human Rights: Although Unilabs has not implemented a bespoke Human Rights policy, respect of Human Rights is embedded in our culture and operations, integrated in our Code of Business Principles. Management considers the risk in relation to Human Rights low, and therefore to date no Human Rights policy has been implemented.
Anti-corruption: Unilabs maintains a strict zero-tolerance policy towards bribery and corruption. The company enforces an antibribery and anti-corruption policy, supplemented by guidelines that delineate expected standards of conduct. Unilabs has refined its specific practices to address conflicts of interest, as well as the management of gifts, hospitality, entertainment, sponsorships, and donations. Further, the company is enhancing its guidance on mitigating risks associated with third parties, which includes implementing due diligence checks with business partners and improving record-keeping. As standard process, in 2025 key employees and functions underwent anti-corruption training to ensure the comprehensive integration of Unilabs’ policy into daily business operations and strategic initiatives. The whistleblowing hotline, operational throughout 2025, has not revealed any breaches of legislation or Unilabs policies on anti-corruption that materially affect the company. Unilabs follows the principles set out in the Code of Business Principles and strengthened management procedures for investigating serious concerns reported through the whistleblower system.
Moreover, all employees have completed online training focused on Whistleblowing, Data Protection, and Cybersecurity awareness. Unilabs is continuously enhancing its recruitment processes to effectively screen for potential conflicts of interest and is embedding training and awareness into the onboarding process. Our reporting, auditing, and investigation processes have not identified any significant risks.
STATUTORY STATEMENT ON DATA ETHICS IN ACCORDANCE WITH SECTION 99D OF THE DANISH FINANCIAL STATEMENTS ACT
In alignment with our core values defined in the Code of Business Principles, Unilabs is dedicated to the responsible use of information and data, which is fundamental to our commitment to upholding high ethical standards and promote integrity. To meet these requirements, Unilabs has established an ethical and data privacy governance model. This model guides the usage and processing of both personal and non-personal data, as well as general data and information, grounded in our daily operations and activities. Our policies underscore our dedication to transparency and responsible actions, ensuring respect and dignity in our interactions with our patients, customers, employees and third parties.
FAERCH
The sustainability statement from Faerch's Annual Report for 2025 is enclosed on the next pages.

Sustainability statement
Basis for preparation
Basis for preparation of sustainability statement
This statement represents Faerch’s statutory Sustainability Statement. It has been prepared voluntarily inspired by the European Sustainability Reporting Standards (ESRS) framework, introduced in late 2025. We will continue work on our sustainability information to be fully compliant by 2027.
While the sustainability statement as a whole is not yet subject to limited assurance, selected environmental disclosures –including the greenhouse gas (GHG) emissions has undergone limited assurance.
For more insights on the limited assurance on selected ESG data see page 103
Scope
Our sustainability statement has been prepared on a consolidated basis, covering Faerch Group and all subsidiaries included in our consolidated financial statement for the year ended December 31, 2025.
For more insights see note 4.10 "Group structure" on page 92
The Sustainability statements also include potential and actual severe negative impacts that we are aware of in our value chain, both upstream and downstream.
For more insights on our impact in the value chain see the "Double materiality assessment" on page 28
Disclosures in relation to specific circumstances
Time horizons
The short-term time horizon for data in the sustainability statements is 12 months from the balance sheet date. Medium (up to 5 years) and long-term (more than 5 years) horizons are aligned with the definitions under the double materiality assessment (DMA).
Sources of estimation and outcome uncertainty
Faerch aims to disclose data as accurately as possible. The preparation of sustainability performance data involves management estimates in certain areas. These estimates are based on historical experience, external data sources, internal analyses and other information considered reasonable. Further details on uncertainties and estimates are disclosed in the relevant accounting policies and in the table on the right.
Changes in reporting or reporting errors
Materiality thresholds have been defined for when to restate quantitative information together with procedures for how a restatement should be performed, including how to handle errors from previous periods. Any restated data will be clearly disclosed.
Phase-in options and omitted disclosures
Although we are not yet required to report under CSRD, we have voluntarily let our sustainability reporting be guided by the ESRS standards to ensure transparency and proactively prepare for future mandatory reporting. As this is our first year of doing so, our disclosures are not yet fully comprehensive. We are applying phasein provisions to progressively build our data collection capabilities and reporting infrastructure.
While no options to omit information of a sensitive character have been utilised, the option to apply the transitional provision has been used.
For more insights see note 5.0 "Basis of preparation" on page 98
Sources of estimation and outcome uncertainty
Sustainabilty framework
Our business model and strategy are inherently linked to the material impacts, risks and opportunities (IROs) identified through our materiality process. These are continuously integrated as factors into our core decision-making and long-term planning to ensure our business remains resilient against evolving regulatory, market and environmental shifts.
Circularity is a defining element of our business model. Through our integrated recycling facility, Cirrec, we secure stable access to recycled raw materials and reduce the dependency on virgin plastic and minimising social risks within the value chain. At the same time, we continuously increase the share of products designed for recyclability in accordance with existing local recycling infrastructure, aligning product development with evolving regulatory requirements and customer expectations. These initiatives directly influence our product portfolio, material sourcing strategy and long-term capital allocation.
Climate-related matters also shape our operational and financial planning. Our roadmap towards a 50% reduction in CO₂e emissions by 2030 compared to the
2022 baseline is supported by renewable energy sourcing, investments in energyefficient machinery and optimisation of production processes. Climate and energy considerations are integrated into CAPEX decisions and operational efficiency programmes, reflecting both transition risks and cost-management opportunities.
Our strategy is resilient, with ongoing monitoring and adaptation to manage risks and create long-term value. Through alignment with EU legislation such as the PPWR, we are able to strengthen our competitive position and support our customers with future-proofed solutions.
Our vision
Be the global leader in sustainable rigid food packaging and recycling solutions in a circular environment.
We have the Customer as our North Star
We deliver operational excellence
We positively contribute to the world
We work as one team with shared values
While we support and have a positive impact on several of the SDGs, our strategic focus is on Goal 12 and 13, where we are able to have the most impact through our core solutions and ambitions.
Policies
Faerch is committed to upholding ethical standards and fostering respectful behaviour in all business practices. We want to ensure that our activities are conducted fairly, professionally, and with integrity. Our policies serve as a guide for the expected standards and behaviours, promoting a culture of responsibility and excellence.
Process and target group
The policies apply to all employees. Each policy is reviewed annually to ensure they remain effective and up-to-date.
Value chain
Selected policies encompass various aspects of the value chain, ensuring that the Group's focus, requirements, and follow-up procedures extend to suppliers and communities impacted by the Group's activities. Faerch has its Code of Conduct for Suppliers and Business partners, as well as its Human Rights Policy outlining requirements and expectations in areas such as compliance, quality, sustainability and transparency. These policies establish the standards for preventing, mitigating, and addressing identified societal impacts.
Approval
The approval process for policies includes review by Group Legal and the EMT, which has the final approval authority and responsibility for the implementation of the policies.
Principles
Our policies are developed based on internationally recognised principles. Specifically, Faerch adheres to and respects the standards set by the UN Guiding Principles on Business and Human Rights (UNGP), the UN Global Compact, the OECD Guidelines for Multinational Enterprises, the ILO guidelines on international standards and fundamental labour standards, and use the United Nations' Sustainable Development Goals (SDG's) as our guiding star, aligning our company objectives to promote the long-term growth of society.
For more insights on the relevance of the Group policies, see the description under the topic-specific ESRS

Double materiality assessment
Our double materiality assessment (DMA) identified the sustainability impacts, risks and opportunities (IROs) that are most relevant to our business activities and stakeholders across the value chain.
Our DMA was inspired by the earlier ESRS methodology, completed prior to the introduction of the simplified CSRD requirements. IROs were classified in line with ESRS 1 and EFRAG (IG 1; IG 2). Impacts were evaluated as gross impacts not taking into account any mitigation actions following the earlier guidance.
Internal cross-functional representation ensured comprehensive coverage of sustainability impacts, risks, and opportunities across our value chain.
Faerch also examined its organisational structure and value chain to determine where material IROs may be concentrated. This included analysing upstream supplier practices, our own operations and manufacturing activities, and downstream product use and end of life impacts.
Process overview
The five phases of the DMA process are described as 1) Initialisation, 2) Hypothesis, 3) IRO analysis, 4) Workshop, and 5) Finalisation and documentation.
DMA Results
Following the initial assessment completed in late 2024, Faerch revisited all sustainability topics in early 2025, applying a more critical and refined review.
The final number of material subtopics was determined to be 12, consisting of, four Environmental (E), five Social (S) and three Governance (G) visualised in the matrix output. The following pages will outline the IROs in detail.
The DMA will be revisited in 2026 to ensure continued alignment with Faerch’s strategic priorities and with the simplified ESRS requirements introduced in late 2025.
Define the scope of the DMA
Reviewing all ESRS sustainability matters and setting the value chain boundary
Assessing sector and company specific considerations
E1 Climate change
E2 Pollution
E3 Water
E4 Biodiversity and ecosystems
E5 Resource use and circular economy
S1
S2 Workers in the value chain
S3 Affected communities
S4 Consumers and end-users
(Internal interviews)
Building the initial understanding of material topics
Semi structured interviews with internal stakeholders
Collection of documents, prior assessments and topical experts
Formation of preliminary impact, risk and opportunity hypotheses
Detailed assessment of impacts, risks and opportunities
Creation of the IRO register covering stakeholder groups, value chain position and time horizons
Impact materiality scoring and likelihood
Financial materiality scoring
Validation and alignment of the assessment
Workshop with internal stakeholders and EMT
Discussion of IRO scores and topic prioritisation
Alignment with CEO and Audit Committee on final material topics
Completion of management summary and documentation
Finalisation of the locked IRO register with full traceability
Identification of ESRS datapoints required for reporting
Scoring methodology
Impact on people and planet Sustainabilty matters
Impact materiality
Impacts with a severity score above 4 were automatically considered material, while lower severity impacts could become material if likelihood was high. For human rights impacts, a lower threshold (–1 point) was applied based on ESRS 1 §45.
The financial threshold, developed with Finance, captures all highest tier financial effects and highly likely risks.
Output matrix
Consumers and end-users
Impacts, risks and opportunities
Overview
GHG emissions
Our business model involves activities such as raw material processing, manufacturing, and energy consumption, all of which contribute to GHG emissions. Rising costs from emission regulations pose financial challenges to our operations.
Scale recycling to replace virgin plastics
Scaling recycling reduces reliance on virgin plastics and reduces the environmental footprint.
Energy consumption
High energy consumption in our operations drives risk exposure but also mitigation needs through power purchasing agreements (PPAs) and energy efficiency initiatives.
Increasing recycled materials
Increasing the proportion of recycled materials used in products to reduce reliance on virgin resources and support circular material use.
Recycled material availability and circular raw materials
High demand for post-consumer household waste combined with stagnating collection rates, increasing pressure on the availability and price of recycled raw materials and driving the need for investments in own recycling capacity.
Recycling and waste management
Challenges and opportunities related to the collection, processing, and reuse of materials to reduce waste generation, improve recycling rates, and minimise environmental pollution.
Regulatory and market challenges for plastics
External factors including regulations, taxes, and public perception that impact the production, use, and reputation of plastic products in the market.
Gender equality and equal pay
Employees may not have access to
and development opportunities.
Health and safety
Risks linked to health and safety, including accidents, emergency preparedness, noise, and air quality issues. These affect workers and may also cause financial and reputational impacts.
Diversity
Risks of unequal access to opportunities and lack of workforce diversity.
Work-life balance
There is a risk that employees experience stress on their health and insufficient work-life balance.
Anti-violence and harassment measures
Risk of harassment creating an unsafe working environment for underrepresented or vulnerable groups in our workforce.
Talent and skills development
Insufficient training and skills development for both white and blue-collar employees, leading to reduced workforce capability and performance risks.
Working conditions in supply chain
Risks related to inadequate knowledge of working conditions across the supply chain, including ensuring fair wages and addressing labour rights, which may lead to unaddressed social and health issues.
Other labour-related human rights
Our global supply chain are exposed to potential cases of forced and child labour posing ethical and compliance risks.
Actual negative
Corporate Culture
Risk of not integrating shared corporate values affecting global collaboration.
Protection of whistleblowers
Failure to protect the anonymity of whistle-blowers and confidentiality.
Corruption and bribery
Own workforce
Workers in the value chain
Health & Safety
Potential negative S1
Own workforce
Equal treatment and opps.
Actual negative
negative
Own workforce
Workers in the value chain
Working conditions - own workers
Potential negative S1
Own workforce
Equal treatment and opps.
Potential negative S1
Own workforce
Equal treatment and opps.
Potential negative S2
Workers in the value chain
Working conditions - value chain
Potential negative S2
Workers in the value chain
Other work-related rights - value chain
Potential negative G1
Business conduct
Potential negative G1
Business conduct
Potential case(s) of corruption and/or anti-competition. Risk G1
Business conduct
Environment
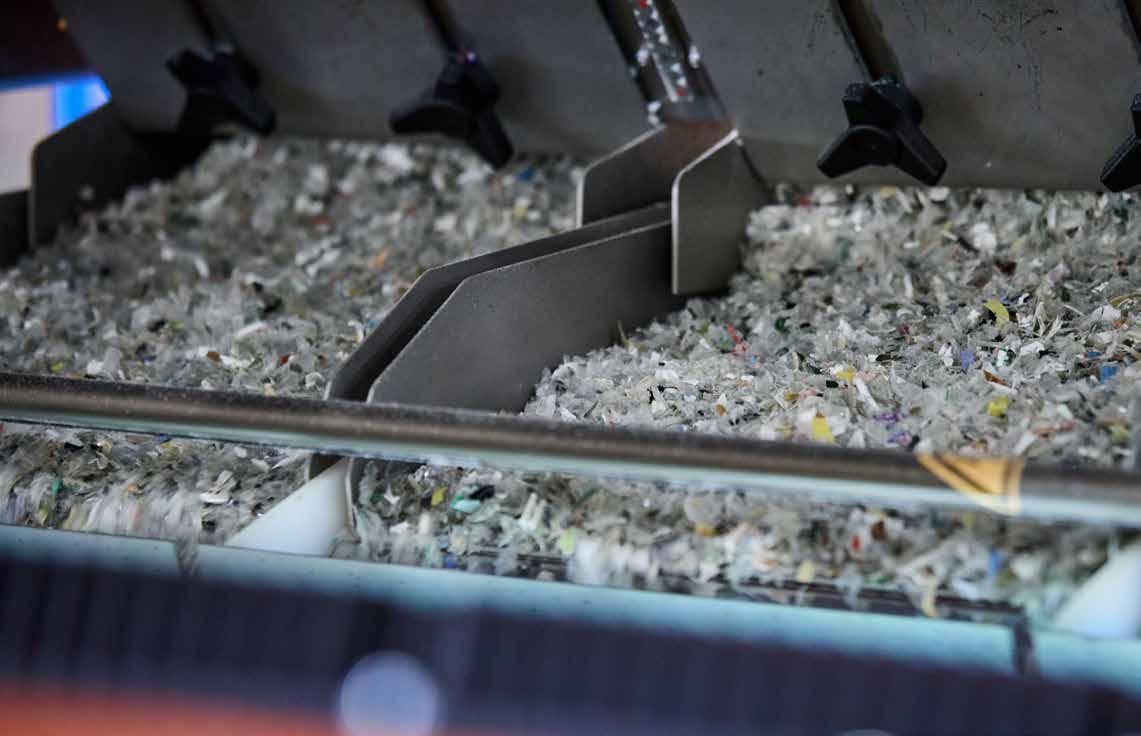
Faerch is taking a leading role in driving circularity in the food packaging industry, enabling climate action and thereby also providing solutions to assist our customers in reaching their circularity and climate goals, through our integrated recycling capabilities.
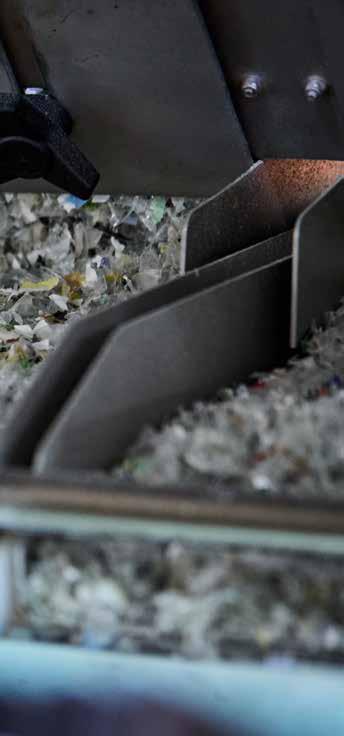
Climate change Resource use and circular economy
Targets by 2030
50% absolute reduction in scope 1, 2, and 3 GHG emissions
Targets by 2040
absolute reduction in scope 1, 2 and 3 GHG emissions
Targets by 2030
The Climate, Circularity & Environmental Policy describes the our objective to mitigate climate change through efforts to reduce GHG in our own operations and in the value chain. The policy also concerns efforts to reduce energy usage through efficiency.
The Travel & Expense Policy addresses unnecessary travel and lower carbon options, while the Company Car Policy urges the consideration of environmental impact in the choice of company cars and prohibits hybrid and diesel vehicles.
Our roadmap to net zero
We aim to lead the transition to a lowcarbon, circular food packaging industry. We have set ambitious emission reduction targets validated by the Science Based Target initiative (SBTi) and thereby aligned with limiting global warming to 1.5°C following the Paris Agreement.
Our climate ambitions are central to our strategy and business model, driving planning, operations, and capital allocation. Our Board of Directors and Executive Management have formally approved our roadmap, ensuring proper oversight and ownership for continuous progress.
For more insights see the "Oversight, internal control and risk management" section on page 18
Faerch developed its GHG base year covering scope 1, 2 and 3, and its near-term and long-term targets together with an overall action plan 2022
While Faerch has the capabilities to achieve significant emission reductions, achieving our ambitious targets requires a supportive regulatory framework and strengthened collection and sorting infrastructure, to expand post-consumer recycled (PCR) material availability and advance circular practices. Progress will also rely on suppliers increasing low-carbon recycled, food-grade feedstock and improving their ability to decarbonise their operations. Finally, ongoing customer and retailer demand for more sustainable solutions exceeding legislative requirements, like the Packaging and Packaging Waste Regulation, will be essential to deliver on our climate targets and drive the transition to circularity.
2023 Faerch got its nearterm and long-term targets officially validated by the SBTi 2024
Faerch completed the application process for validation of its targets to the Science Based Target initiative (SBTi)

Faerch updated and reinforced its decarbonisation plan to be aligned with the revised strategy building a more detailed, integrated and actionable roadmap
target
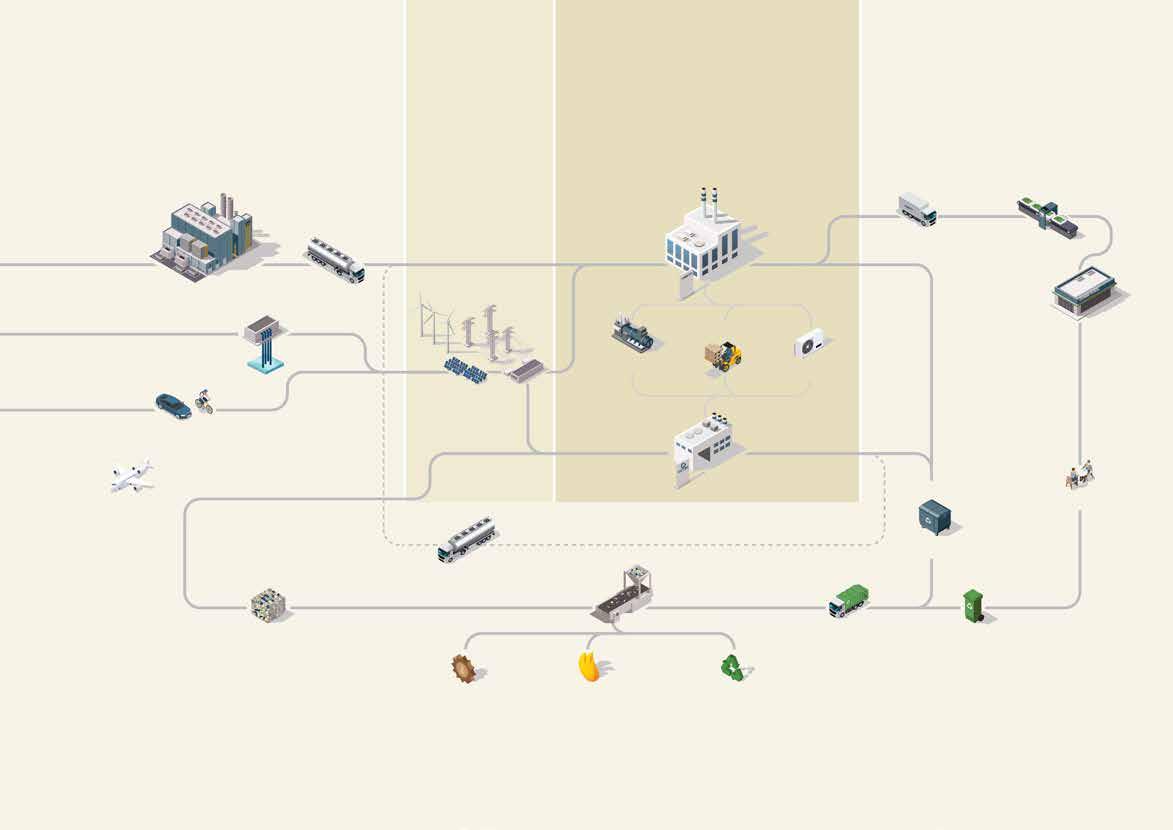
GHG emissions across our value chain
Scope 1, 2 and 3 emissions
In 2025, our total market based CO2e emissions was reduced by 20% compared to our base year 2022. The key drivers have been higher usage of CIRPET+ material from our own recycling site and increased share of renewable energy sourcing.
We aim to be powered by 100% renewable energy by 2030, which is essential to achieve our SBTi near-term target. This year we came a step closer by increasing the share to 22.9% from 6.7% in 2024. This increase in renewable energy led to a significant reduction in scope 2 emissions of 29.4% compared to last year. Based on existing commitments, we have already secured renewable coverage for at least 41% of our electricity by 2027, and we continue to explore cost-effective ways to expand our renewable sourcing.
For more insights see note 6.1 "Energy consumption and mix" on page 97
In 2025, we also had the emission factor for our CIRPET+ material validated by a third party, providing transparency and trust that our mechanically recycled material not only drives circularity, but also enables climate action. The new emission factor confirms that CIRPET+ is significantly lower in carbon emissions compared to average virgin PET ~82-86% and ~32-50% lower compared to average recyclate from PET bottles1.
While we are proud of the result, we recognise the need for continuous focus on reducing emissions further. This is primarily through energy efficiency and increasing the use of renewable energy at
Cirrec, to make our material the preferred choice for food packaging and utilise the full potential of the material to support our journey to net zero emissions.
Throughout the year, we also strengthened our supplier engagement activities as raw materials are the largest driver of emissions and essential to decarbonise to reach our targets. This work will continue in 2026 with a stronger focus on collaboration, data transparency, and joint innovation projects around finding low-carbon circular solutions for our PP portfolio.
For more insights see note 6.4 "Scope 1, 2 and 3 emissions" on page 98
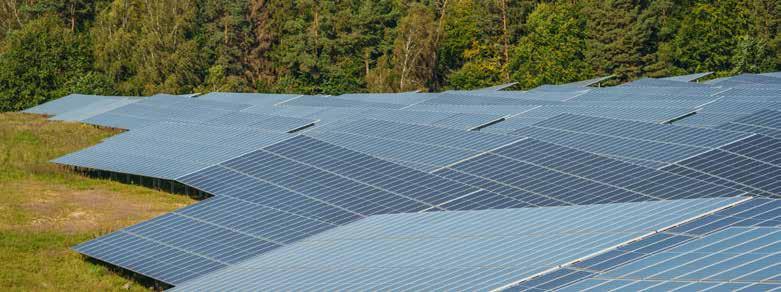
With our current commitments, we have already secured that at least 41% of our electricity2 will be covered by renewable energy in 2027
Roadmap to net zero
703,096
· Decarbonise supply chain through engagement and partnerships to innovate low-carbon feedstock
· Scale our mechanical PET recycling
· Material conversion with customers to circular, lowcarbon alternatives
· Increase post-consumer recycled content in products across whole portfolio focusing on unlocking potential for lowcarbon rPP
· Lightweight, ecodesign and optimise materials in products through innovation and customer partnerships
· Transport packaging optimisation and maximising truck capacity
· Transport optimisation through better route planning, load efficiency and modal shifts
· Support and advocate for improvement of recycling infrastructure to lower end-of-life emissions
Together with our partners and customers, Faerch will continue to support and further develop a net-zero food packaging sector with low-carbon and circular products. Partnerships that advance circularity, lower product carbon footprints, and improve value-chain sustainability performance will remain central to our approach. Remaining emissions will be addressed through trusted, high-quality carbon removal solutions aligned with recognised net-zero standards.
Climate, Circularity & Environmental Policy
The Climate, Circularity & Environmental Policy sets out our goals for reducing environmental impacts and risks, while advancing a resource-efficient, circular economy across all operations and the value chain. It details our strategies for circular product design, recycling, greater use of recycled materials, and ongoing improvements in resource efficiency.
Resource use and circular economy
Efficient resource use and circular economy practices are central to reducing reliance on virgin materials, minimising waste, and improving operational efficiency across our operations. We believe no material should ever end up in nature or the oceans, and we are committed to keeping packaging in a closed loop by transforming used packaging into new packaging - turning waste into a valuable resource.
Achieving this requires more than our own efforts. Harmonising the ecodesign of packaging, refining waste infrastructure, and fostering responsible waste handling globally are essential steps to ensure circularity. We recognise that systemic change demands collaboration across the entire value chain – from suppliers and customers to recyclers and policymakers.
To implement our circular ambitions, we focus on increasing the use of recycled post-consumer raw materials in food packaging, improving recycling efficiency at Cirrec, alongside lightweighting of our products, improving their recyclability by design, minimising transport packaging and implementing smart loops to reduce waste.
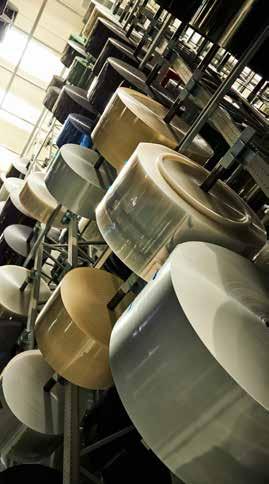
Driving circularity across our material flows
Faerch is in a unique position to push circularity with our integrated recycling capabilities. Cirrec recycles post-consumer PET pots, tubs and trays into food-grade recycled PET. This secures access to pricestable secondary raw materials, reduces reliance on virgin PET and enables circular packaging at industrial scale. The integrated model supports closed material loops and our ambition to increase recycled content across our product portfolio.
Our focus on circularity goes beyond the use of recycled content in our own products and remains a continuous priority across all resource streams in our operations. Circularity is addressed both downstream and upstream, including in product and packaging design, where solutions are developed to be compatible with established recycling systems and suitable for recycling back into food-grade applications. Within our operations, we expand recycling programmes, improve material segregation
How we implement circularity across our material flows
and implement "smart loops" for complex waste streams to ensure that materials are directed to the most appropriate recovery route in line with the waste hierarchy.
Resource inflows
Primary and secondary raw materials Resource efficiency in operations Integrated recycling capabilities in PET
The key materials in our production of plastic food packaging are plastic resins, especially the secondary resources from post-consumer recycled resins including our own recycled material CIRPET+.
In 2025, we began transitioning all relevant sites to third-party certification in accordance with EN 15343, the European standard for plastics recycling traceability and recycled content. This helps ensure trust and unlock financial benefits for customers in selected European countries.
We are working to continuously increase the use of recycled plastics across our product portfolio with a strong focus on finding solutions in partnership with industry stakeholders on physically recycled PP.
Resource outflow - products
Our food packaging is designed to protect food, ensure safety and maintain product quality throughout the supply chain. Depending on the application and logistics, the functional lifetime of our packaging ranges from a few days to several months, with an average functional lifetime of approximately eight days.
As our products are mainly single-use or reuse food packaging, repairability is not applicable. Recycling is therefore addressed through product and material design, with a focus on lightweighting, efficient material use and compatibility with established recycling systems. By reducing material weight and increasing the share of recycled content, we aim to reduce the use of virgin materials while maintaining food safety and performance requirements.
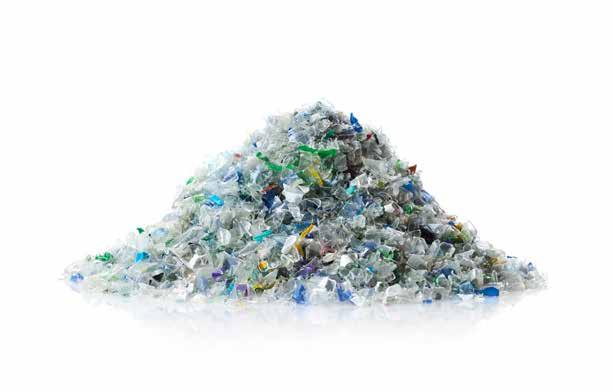
94.3%
Designed Recyclability Rate
Resource outflow - waste
The waste our operations generate consists predominately of plastic waste from production and recycling processes.
We have maintained a strong focus on regrinding materials in production to ensure material efficiency and minimise waste. For our recycling site the PET bales we receive still consist of other materials than PET. There we have a continuous focus on establishing by-products rather than waste, ensuring the output brings value elsewhere. We will continue our efforts around using less and recycling more, to ensure circular loops.
In 2025, we conducted a structured waste analysis to map waste streams and their disposal type to identify potential improvement areas. The findings are being translated into concrete action plans to further strengthen waste prevention and circular resource management.
For more insights see note 6.2 "Resource Outflow" on page 97
Looking ahead
We welcome the EU regulatory shift towards circularity, particularly the PPWR, EPR schemes and economic incentives promoting circular materials.
These developments, combined with our current actions, support the transition towards a circular economy. Our strategic focus includes scaling our integrated recycling capabilities in PET and to accelerate a recycled PP innovation in order to find suitable low-carbon and circular solutions in collaboration with key partners.
Increasing recyclability by design
Built-in absorber
Eliminating glued material components and improving compatibility with established recycling systems.

Phasing out multimaterial APET
Reduce multimaterial APET structures to protect post-consumer waste quality and improve mechanical recycling efficiency.
RecycleDuo platform
Several PP and PET pot sizes with mechanically self-separating paper sleeves have been launched. Further sizes are defined to support PPWR-compliant, mechanically separable sleeve solutions.
Social
Our employees and the workers in our value chain are important for sustained success and resilience. We are committed to ensuring their safety, promoting fairness, and supporting their well-being.

Own workforce Workers in the value chain
Targets by 2030
Zero Lost Time Injuries (LTIs)
Targets by 2026
100% evaluation of direct suppliers according to their ESG performance in new tool
S1-4
S2-4
Equal treatment and opportunities for all Human Rights Policy
Preventing Harassment & Discrimination Policy
Fairness & Inclusion Policy
The Human Rights Policy states our commitment to promoting human rights in all our business activities, including zero tolerance for trafficking, forced labour, and child labour. The Preventing Harassment & Discrimination Policy and the Fairness & Inclusion Policy state that we treat every employee with dignity and respect, promoting fairness and inclusion for all.
Working conditions for own workers
Health & Wellbeing Policy
Flexible Working Policy
Global Mobility Policy
The Health & Wellbeing Policy and the Flexible Working Policy promote the health and well-being of all employees through health awareness, stress management and flexible working principles.
The Global Mobility Policy, Travel & Expense Policy and Company Car Policy establish structured rules for specific employee-related activities, such as managing global mobility assignments, streamline employee travel expense reimbursements and company car entitlements and usage. The Remuneration Policy sets the standard for aligning management and employee interests, and attracting and keeping top-performing employees with strategic compensation.
Own workforce
Equal treatment and opportunities, working conditions together with health and safety are all material topics for Faerch, because they are fundamental to responsible employment practices. By embedding these commitments into our operations, we work to ensure a fair, inclusive, and safe workplace, where every employee can thrive and have opportunities to grow.
At the end of 2025, Faerch had a diverse workforce of approximately 5,274 employees worldwide. This workforce includes full-time, part-time, temporary employees, interns, and students. Full-time employees form the majority, totalling 4,758 individuals, with an average seniority of 10.93 years. This globally dispersed workforce enables us to leverage talent, foster innovation, and drive sustainable growth.
For more insights see note 7.1 "Characteristics of the undertaking's employees" on page 101
The Health & Safety Policy constitutes all commitments Faerch has made towards improving employees’ health and safety. The Prohibited Substances Policy and Smoking Policy prohibits the use, possession, sale, and distribution of illegal substances and cigarettes/vaping devices.

S1-5, S1-8
S1-12
Equal treatment and opportunities
We stay committed to creating a unified, supportive and engaging working environment.
In 2025, we began unifying our sites under one identity, updating logos and signage, and celebrating locally. Various training sessions for managers and employees were conducted to enhance competencies in performance, development, skills, and personal information. Dedicated training on prevention of harassment and discrimination was held, including guidance on our whistleblower scheme to support a safe workspace.
We also piloted a new approach to organisational reviews identifying high-potential talent and successors for critical roles, emphasising performance management, talent development, and uniform leadership language. Continuous improvement in people development and training remains a priority.
Faerch's commitment to diversity and inclusion is also evident in our practices around talent management, ensuring our leadership reflects the diversity of our workforce and communities. Achieving gender balance in management is a focus. In 2025, we significantly increased female representation in Group Senior Management to 28% (18% in 2024), with a continuous ambition of equal distribution among the genders.
In 2026, our commitments to diversity and inclusion will be continued with targeted trainings on employee topics such as Preventing Harassment & Discrimination, Fairness & Inclusion, Health & Well-being and Flexible Working.
Health and safety
The health and safety of our workers are nonnegotiable reflected in our 2030 target of zero Lost-Time Injuries (LTIs).
We are continuously improving, and in the first half of 2025, we ran a "Stop-ThinkAct" campaign to ensure employees felt empowered to halt work for safety concerns. In the second half, we implemented our "Life Saving Rules", which encompass 10 rules to safe guard our employees from some of our most credible hazards.
From a technical safety standpoint we have started to control our significant injury aspects, by eliminating certain high risk areas within our extrusion process.
In 2026, we will strengthen Health & Safety management across all sites by fully implementing our core requirements and further build leadership capability. We will improve prevention through higher levels of proactive safety activity (walks, observations, inspections, and drills), consistent learning, and stronger follow-through by closing corrective actions on time.
Working conditions
We prioritise a supportive and productive work environment with fair employment practices, emphasising work-life balance crucial for well-being and productivity. Our working hours meet industry norms and legal requirements, with flexible arrangements where possible.
In 2025, we introduced compensation benchmarks for competitive remuneration and transparency in order to implement a global job architecture and the EU directive on pay transparency in 2026. We also engaged with employees through formal channels, including our annual Global Engagement Survey for anonymous feedback and targeted actions with an impressive response rate of 84%.
For more insights on our whistleblower scheme, see the "Business conduct" section on page 50
S1-13
For more insights see note 7.3 "Health and safety metrics" on page 102
For 2026, the focus will be to re-activate and embed our values across the organisation to strengthen a transparent leadership culture that supports trust, accountability, and talent attraction and first-year retention. We will also drive user adoption of People Loop as key processes go live, including performance closeout for 2025, setting 2026 objectives and bonuses, and managing the 2026 salary process. People Loop will further underpin job architecture and pay transparency.
S1-16
Code of Conduct for Suppliers and Business Partners
Responsible Sourcing Policy
The Code of Conduct for Suppliers and Business Partners obliges our suppliers to adhere to our principles including legal compliance, environmental responsibility, and human rights. The Responsible Sourcing Policy ensures that all employees who conduct procurement activities adhere to structured, transparent procurement practices.
Workers in the value chain
Our value chain activities involve raw material sourcing and recycling of PET household waste to use in our food packaging production. Our key suppliers provide plastic resins, both virgin and recycled material. Our suppliers are critical to our operations, with around 6,000 suppliers across various products and services.
Effective supply chain management and engagement are central to delivering our net-zero target by 2040, as purchased goods and services accounted for 68.7% of our total emissions in 2025. Furthermore, we recognise there are potential social risks in our value chain, and we strive to support the well-being of these workers.
To mitigate both environmental and social risks and build resilience, we focus on strong, trustworthy partnerships essential for sustainable and ethical business. Our ambitions to scale our integrated recycling capabilities will provide us with more control of our value chain and thereby minimise these risks overall.

Engagement and actions
In 2025, Faerch focused on important actions to address material impacts on workers in the value chain. These actions aim to prevent, mitigate, and remediate negative effects.
Faerch has strengthened its setup on responsible sourcing by establishing a project group consisting of internal experts from ESG, Procurement and Compliance to ensure the necessary alignment and accelerate efforts to improve our human rights framework.
We have a whistleblower scheme in place to enable reporting, investigation and remediation ensuring that all parties involved have a clear and safe avenue to voice their concerns and seek resolution.
For more insights on our whistleblower scheme see the "Business conduct" section on page 50
This is in line with our revised strategy, and prepares Faerch for the anticipated due diligence legislation from EU (CSDDD), while meeting the increased requirements from customers.
In 2026, we aim to start the implementation of a tool to support with assessing and monitoring our direct suppliers’ and sub-suppliers’ compliance with our Code of Conduct for Suppliers and Business Partners. This enables a more structured approach to identifying, mitigating and remediating incidents and impacts. Our new tool will aid with value chain mapping, identifying risks, mitigation actions and supplier management.
We will also implement an updated supplier evaluation process to enable early identification of potential risks and promoting continuous improvement in ethical, social, and environmental practices.
Towards strengthening labour standards
In 2026, in order to better understand and manage our value chain risks, we are implementing a new risk assessment and mapping tool. This will monitor our direct suppliers’ and sub-suppliers’ compliance with our Code of Conduct for Suppliers and Business Partners. This tool will help us identify and prioritise risks more effectively and will aid in risk mitigation.
By the end of 2026, we aim to have a comprehensive risk matrix of our direct suppliers, providing us with a clearer understanding of potential impacts. Specifically, we aim to focus on work related rights such as child labour and forced labour; and working conditions such as health and safety, work-life balance and adequate wages.
We aim to engage with all of our key suppliers on relevant ESG topics, including risks, in a manner that promotes mitigation, education, and awareness-raising starting in 2026 and beyond, compared to 66% engagement coverage in 2025 on selected ESG topics. This engagement will also include verification of certificates, assessments, and ongoing dialogues. To support this, we will continue strengthening
the training and capabilities of all Procurement professionals on responsible sourcing in 2026, building on the 92% completion rate achieved for the training in 2025.
Additionally in 2026, we will implement an updated supplier evaluation process to enable early identification of potential risks and promoting continuous improvement in ethical, social, and environmental practices. Our approach involves conducting assessments and surveys as part of our informal monitoring practices, to ensure compliance and foster a collaborative relationship with our suppliers long term.
Governance

Strong business conduct is fundamental for stakeholder trust and long-term value creation. Our ambition is to promote ethical behaviour, prevent misconduct and ensure transparent, responsible decision-making across our organisation and the value chain.

Business conduct
Targets by 2026
100% of administrative staff completed compliance training
Fair Competition Policy
Anti-corruption Policy
Human Rights Policy
Whistleblower Policy
Privacy Policy
IPR Policy
Gifts Policy
Tax Policy
Trade Compliance Policy
Acceptable Use of IT Devices and Digital Resources
The Fair Competition Policy, Anti-corruption Policy and Gifts Policy promote ethical business conduct and ensure compliance on anti-competitive, anticorruption and anti-bribery practices.
The Privacy Policy, Acceptable Use of IT Devices and Digital Resources, and IPR Policy protect the privacy and personal data as well as intellectual rights of individuals and third parties.
The Human Rights Policy sets out our standards to comply with international human rights and the Whistleblower Policy enables secure, confidential, and independent reporting of actual or potential violations.
The Tax Policy ensures compliance with tax laws, while the Trade Compliance Policy ensures compliance with trade sanctions and export control laws.
Business conduct
Our approach to corporate governance forms the basis for responsible and sustainable business practices. We prioritise transparency in decision-making, accountability throughout the organisation, and ethical behaviour in daily operations. Key areas of focus include integrity, diverse and inclusive leadership, and continuously updating our policies and oversight mechanisms to meet regulatory standards, stakeholder expectations, and best practices.

Driving ethical behaviour through concrete actions
Faerch is dedicated to maintaining a zerotolerance policy towards corruption and bribery. Our procedures aim to prevent, detect, investigate, and address any incidents to ensure ethical business conduct across the company.
In 2025, we enhanced our trade compliance framework by improving our sanction screening processes. We also strengthened
our data governance by updating the Intercompany Agreement to allow the sharing of personal data within the organisation for legitimate purposes only, in line with our Least Privilege Access principle. This principle grants users and devices only the minimum access necessary to perform their tasks, reducing risks like insider threats and unauthorised access.
Additionally, we have fully implemented People Loop, an HR system designed to better manage employees' personal data. This system ensures GDPR compliance and efficient handling of personal data across the organisation.
Our approach to ethical business conduct
Prevent
Clear policies, guidelines, annual training for employees.
Risk-based due diligence on business partners. Mandatory anti-corruption training for high-risk roles and management.
Detect Monitoring, whistleblowing in local languages, transaction reviews.
Investigate
Thorough, confidential investigations by compliance and legal teams.
Respond
Prompt corrective actions: disciplinary measures, remediation, reporting to authorities.

Whistleblower Scheme
Faerch operates a company wide Whistleblower Scheme enabling employees and business partners to report suspected unethical or unlawful conduct, anonymously if preferred. Reports are investigated by the relevant Whistleblower Unit and the scheme is accessible via the Faerch Group website.
For more insights see note 8.1 "Whistleblower scheme" on page 102
In 2025, an awareness campaign was conducted to strengthen the speak up culture, with a continued “Safe to Speak Up” focus planned for 2026.
To enhance governance oversight, an Integrity Committee was established in 2025. The Committee governs and monitors misconduct cases reported through Faerch’s communication channels, including the Whistleblower Scheme, and ensures alignment with our policies, and applicable laws and regulations.
Fair competition and anti-corruption
Faerch is committed to conducting business with integrity and applies a zero-tolerance approach to corruption, bribery and anti-competitive behaviour. We have strong policies supported by clear procedures and controls to prevent, detect and address misconduct.
Ethical behaviour is promoted through guidelines, communication, and mandatory training, especially for high-risk roles. Concerns are handled confidentially and corrective actions are taken when needed.
Trade compliance and sanction screening
Faerch is committed to operate in full compliance with applicable trade laws and regulations, including international sanctions, export control rules and customs requirements. To manage these risks, all direct spend transactions and relevant business partners are screened against updated sanctions lists and restricted party databases.
In addition, we apply risk-based oversight to ensure increased scrutiny of higher-risk transactions and relationships, while maintaining efficient operations. These measures help reduce the likelihood of inadvertent violations and support responsible crossborder trade practices.
Data ethics*
Faerch responsibly uses data to support its business model. We manage personal data ethically and in line with GDPR and internal policies to protect employees, business relations, and Faerch from legal, business, and reputational risks. Personal data is processed in various areas of the organisation, with Group Legal providing compliance support through procedures and guidance, including handling data subject requests. We implement technical and organisational measures to safeguard personal data against loss, unauthorised access, and unlawful processing, and delete data when no longer needed for legitimate purposes.
Information and asset security
Faerch is committed to protecting information, digital assets, and intellectual property from misuse, theft, and unauthorised access. Our security strategy includes technical safeguards, organisational policies, and employee awareness activities to maintain the confidentiality, integrity, and availability of sensitive information. We are developing IT compliance in accordance to ISO 27001 and NIS2, to be fully implemented by 2027.
We do not tolerate infringements of intellectual property rights and emphasise compliance with laws regulating intellectual property and industrial espionage. This includes protecting Faerch’s intellectual property, such as patents, designs, and trademarks, and respecting the intellectual property rights of others.
Training and awareness
Embedding ethical conduct involves ongoing awareness and competence development. Employees in scope are required to complete mandatory compliance training, while managers undergo specialised compliance management training to strengthen oversight and accountability.
Training covers key topics such as anticorruption, competition law, trade compliance, information security, business ethics and data protection, and is supported by ongoing awareness activities throughout the year.

In 2025, an awareness campaign was conducted to strengthen the speak-up culture.
SVITZER
The sustainability statement from Svitzer’s Annual Report for 2025 is enclosed on the next pages.
Sustainability reporting
Svitzer's Sustainability Statement is prepared in accordance with the Danish Financial Statements Act. Following the company's acquisition by A.P. Moller Holding and Omnibus Regulation package Corporate Sustainability Reporting Directive (CSRD) for Svitzer has been postponed till 2027. The sustainability sections below are prepared in accordance with the Danish Financial Statements Act §99b and §99d, with additional voluntary disclosure of gender diversity data by Svitzer.
Svitzer has elected to base its due diligence on the Double Materiality Assessment carried out in 2024 which identified a set of material topics that remain relevant for 2025.
Business model
Our strategy and business model are founded on a resilient framework that guides decision-making and resource allocation across the organisation. These priorities position Svitzer to lead the towage industry through operational excellence, technological innovation, and responsible business practices that benefit our people, customers, and the communities we serve.
ESG considerations are embedded in Svitzer’s strategic and operational decisions. Our long-term ambition to achieve carbon neutrality by 2040 is a key driver of innovation across the business. To enhance resilience, we continue to deploy technologies that reduce greenhouse gas emissions, optimise fleet efficiency, and support the transition to low-carbon operations.
Svitzer’s strategy also places a strong emphasis on our people. We prioritise safety, diversity, and professional development to uphold the highest operational standards and ensure an inclusive, high-performing workforce. Ethical conduct underpins all our activities, supported by robust compliance behaviour.
Recognising the dynamic nature of our industry and the evolving expectations of customers, regulators, and society, we continuously assess material risks and opportunities that could influence our ESG performance and adjust our approach accordingly.
ESG governance
To deliver on our ambitions, Svitzer has established governance structures to
strengthen alignment between sustainability objectives and operational priorities. Svitzer’s ESG governance structure, established in 2024, ensures continued oversight and accountability for sustainability reporting.
The Finance Department, supported by the ESG Working Group, manages reporting. This structure anchors sustainability reporting within Finance, aligning ESG and financial disclosures and integrating sustainability into Svitzer’s broader governance framework.
ENVIRONMENT
Geopolitical tensions and market uncertainty dampened customer demand for decarbonised services in 2025 and weighed on the pace of transition investments amid broader inflation and energy market volatility.
Climate ambition
Svitzer aims to achieve a significant reduction in emissions across all scopes by 2040. Svitzer remains committed to supporting the objectives of the Paris Agreement; however, the interim emissions target set for 2025 does not follow the previously applied science-based linear trajectory, reflecting an updated internal pathway while the company continues to work toward long-term
alignment with Paris-aligned ambitions. Instead, the company has established an internally defined reduction pathway, including a 6% emissions-reduction target for 2025, which will guide progress toward the 2040 ambition. This shift ensures continued transparency and direction in Svitzer’s decarbonisation efforts, while reflecting the company’s evolving operational context and strategic priorities.
Targets: Svitzer’s decarbonization strategy aims to reduce the carbon intensity of the fleet by:
• A 50% reduction in vessel carbon intensity (per gCO2e/kWh) by 2030, with 2020 as the base year.
• A total GHG emissions reduction of 33% for scope 1, 2 and 3 (against a 2023 baseline).
Further, Svitzer aims to achieve climateneutral operations by 2040 through a 100% reduction of Scope 1 and 2 emissions and a 95% reduction of Scope 3 emissions and GHG emissions will be offset using carbon credits. Svitzer’s climate targets remain provisional and were initially developed based
on a linear reduction framework. During 2025, no further work was undertaken on the Climate Transition Plan. The Plan and ambition will be revisited and further developed in line with the newly finalised regulatory requirements and industry expectations.
We achieved a 4% reduction in carbon intensity in 2025, which fell short of our target of 6%, primarily due to limited market demand for decarbonised towage services.
Policies and actions taken: Svitzer’s Environmental Policy guides its decarbonisation strategy, focusing on improving operational efficiency, enhancing technical solutions, and transitioning to low-carbon fuels and electrification to reduce GHG emissions and energy use. The Sustainable Procurement Policy embeds environmental considerations into procurement, requiring suppliers to align with Svitzer’s Supplier Code of Conduct and encouraging joint progress on reducing emissions and protecting the environment. High-risk suppliers are subject to assessments, with improvement plans developed where areas for improvement are identified. We will work together on practical and timely improvement plans.
In 2025, key actions included the following:
• The continued deployment of lowcarbon fuels such as hydrotreated vegetable oil (HVO) and fatty acid methyl esters (FAME). Svitzer is advancing the commercialisation of its green products, EcoTow and EcoBAF, which offer customers tangible Scope 3 emission reductions. In partnership with DP World, a terminal operator company, Svitzer is also establishing the world’s first Carbon Inset Lanes at London Gateway and Southampton, further contributing to DP World’s Scope 3 reductions.
• In 2025, Svitzer deployed three TRAnsverse tugs, which are expected to reduce long-term fleet fuel consumption, supported by more compact designs that lower material requirements during construction. The company continues to expand products that deliver verifiable Scope 3 reductions for customers and is scaling the Aim for 8 programme to reduce mobilisation speeds and cut fuel consumption across operations.
• Additionally, Svitzer is investing in innovative vessel technologies, including the design and construction of the world’s first battery–methanol hybrid tug, which progressed to 60% completion in 2025 and will
substantially reduce operational emissions once in service.
• Svitzer Ingrid, the company’s first battery-electric tug equipped with an 1,808kWh battery pack, is now in operation and is expected to reduce CO₂ emissions by 600–900 metric tonnes annually.
Performance against these initiatives is tracked through key performance indicators, including total CO₂ emissions, carbon intensity per unit of energy (gCO₂e/kWh), the percentage of the fleet operating on alternative fuels, and progress toward interim 2030 targets. Collectively, these actions demonstrate Svitzer’s continued commitment to managing climate-related risks responsibly while delivering on its longterm climate ambition.
Risk assessment: Principal risks relate to regulatory compliance (including exposure to the EU ETS), uncertainty surrounding the development, pricing and regulatory framework for alternative fuels due to postponement of IMO net zero framework, as well as the availability and maturity of new technologies, all of which may materially affect future operations and turnover. Svitzer mitigates these risks through its decarbonisation roadmap, operational efficiency programmes such as Aim for 8 which optimises mobilisation
speeds to maximise efficiency and reduce fuel consumption, and strategic innovation partnerships to secure sustainable fuel and vessel solutions.
Pollution
Svitzer works to prevent and reduce pollution arising from its operations through established policies, regulatory compliance, and operational controls. The company recognises that activities may impact air quality and involve substances of concern and therefore manages this as a material environmental risk by aligning its operations with local laws and regulations.
Targets: Svitzer has not set specific targets related to air pollution or substances of concern. At this stage, the company focuses on regulatory compliance, responsible operational practices, and continuous improvement rather than formal target setting.
Policies and actions taken: Svitzer is mindful that our operations can have harmful effects on the environment. In response, Svitzer pursues its pollution reduction goals through safe, innovative, and continuous improvements to our operations. Svitzer has taken the following steps:
• Svitzer utilises IMO Tier III compliant engines for eligible vessels operating in ECA and Pollution SECA zones.
• Furthermore, Svitzer ensures Tier III ready vessels for retrofit optionality within the vessel’s lifetime, thereby reducing overall pollution.
• Collaborate with engine suppliers to develop next-generation fuel engines.
• Introduce battery-operated vessels into the fleet and identify battery and shore power opportunities to reduce fuel use.
Risk assessment: Svitzer acknowledges that its operations inherently involve pollution-related risks, primarily linked to fuel combustion and the potential release of substances of concern. The company recognises the presence of these risks as part of normal operational activity. At present, Svitzer monitors specific pollutants associated with vessel operations and fuel use and continues to evaluate opportunities to expand its monitoring framework as regulatory requirements and operational practices evolve.
OUR PEOPLE
Diversity, Equity & Inclusion
In the marine and transportation industry, underrepresented groups risk being disproportionately impacted if inclusion is not actively addressed. Svitzer is committed to fostering a diverse and inclusive workplace and recognises that Diversity, Equity, and
Inclusion (DEI) are essential to performance, innovation, and ensuring equal treatment within a traditionally male-dominated industry.
Targets: Svitzer has set ambitious gender diversity targets to ensure accountability in our diversity, equity and inclusion agenda. For 2025, Svitzer achieved 39% gender diversity in the global leadership team (the Executive Leadership and Senior Leadership levels), representing solid progress towards the 40% target. Svitzer has retained its 40% diversity ambition, revising the target year from an annual objective to a long-term goal to be achieved by 2030.
Additionally, Svitzer has achieved the target of 10% year-on-year increase in the share of underrepresented gender among crew employees in 2025.
Policies and actions taken
: Svitzer’s Diversity and Inclusion Policy is built on four pillars: organisational engagement, capability building, embedding diversity in the employee experience, and accountability through progress measurement. The company monitors gender representation across employee processes, particularly in senior leadership, to promote balance and prevent discrimination in line with local legislation. Svitzer has taken the following steps in 2025, which it plans to continue in the medium term:
• Promote diversity in recruitment by screening non-inclusive language in job ads and partnering with educational institutions in regions to attract diverse talent.
• Establish a Diversity Taskforce within one of Svitzer’s entities to test and evaluate initiatives, providing valuable insights to inform the company’s global DEI approach.
• Track the perception of equal opportunities in our People Pulse survey.
• Engage all regions to enforce global diversity policies and encourage local initiatives.
• Continue to promote the Female Leadership Development Program Pilot in collaboration with Women’s International Shipping and Trading Association (WISTA), Australia.
• Received a nomination for a Diversity, Equity, and Inclusion (DEI) recognition, further enhancing Svitzer’s visibility and commitment in this area.
Risk assessment: Svitzer faces several DEI-related risks due to the traditionally male-dominated maritime industry, including
limited diversity representation, genderbased inequalities, and elevated risks of harassment toward women, migrant workers, and LGBTQ+ individuals. These risks underscore the importance of maintaining strong DEI policies, grievance mechanisms, and continuous monitoring.
Health & Safety
Safety is central to Svitzer’s mission, with a clear focus on protecting our people and preventing fatalities and life-altering injuries. Our HSSE approach combines risk mitigation, compliance, and continuous improvement through a culture of safety, collaboration, and open dialogue. All crew receive required certifications, onboarding, and ongoing training to meet local and global standards.
Targets: By nature, Svitzer aims to avoid accidents, fatalities, or injuries in the operation. The focus is on proactively reducing risk by strengthening safeguards to prevent fatalities and life-altering injuries. The following global targets are set and reviewed annually with regional Marine Standards and safety teams with the following results achieved in 2025:
• Completion of learning teams within eight weeks of any High Potential Incident.
• All HMS-covered vessels are in scope, and progress is monitored monthly.
• 97% target completion of monthly Leadership Visits (one per vessel) against 90% target.
• 95% target completion of Emergency Drills as defined in the HMS drill plan, against a 100% target.
• 97% target adherence to the Internal Audit plan against 95% target.
• 95% target completion of monthly Vessel Safety Meetings, achieved a 97%.
Policies and actions taken: Svitzer’s Health and Safety Policy is built on three principles: learning and adapting to risks, leading with care, and empowering employees to identify improvements. This employee-centric model is supported by top-down standards, audits, and assurance, alongside workforce engagement and leadership accountability. Compliance with Global Offshore Vessel Management and Self-Assessment (OVMSA) standards and proactive HSE practices, including emergency drills, vessel visits, safety meetings, and incident learning, are core leading indicators. Key actions include:
• Activating frontline learning teams after high-potential incidents, conducting monthly drills and vessel safety
meetings, and carrying out both internal (SOVIQ) and OVMSA audits.
• Performance is monitored daily through the Marine Standards dashboard and reviewed monthly at global and regional levels, with results embedded into company scorecards.
• Regular incident reviews, KPI reporting, and lessons learned ensure accountability and continuous improvement across the organisation.
• Svitzer runs an annual, data driven safety programme and monitors key leading indicators to support continuous improvement.
Risk assessment: Svitzer’s operations take place in dynamic and high-risk marine environments, where employees face hazards such as collisions, man-overboard situations, fires and equipment failures. Svitzer recognises these as material health and safety risks and focuses on strengthening safeguards and operational practices to prevent severe incidents. These risks remain a core consideration in Svitzer’s HSE approach, given their potential to impact employees’ wellbeing, operational continuity, and regulatory compliance.
Human Rights
Svitzer is committed to respecting and upholding human rights across all operations, guided by its core values and Human Rights Statement approved by the Board of Directors.
Targets: Svitzer has not set specific human rights targets. The company’s focus is on maintaining compliance with its Human Rights Statement, Code of Conduct, and international standards rather than establishing quantitative goals. Humanrights performance is monitored through Svitzer’s whistleblower system that enables employees and external stakeholders to report concerns such as discrimination, harassment, retaliation, and other breaches of laws or company values. In 2025, two whistleblower incidents related to human rights were reported and assessed. While no systemic human rights issues were identified, the cases demonstrate the system’s effectiveness in supporting transparency, early detection of potential misconduct, and timely follow-up.
Policies and actions taken: Svitzer’s commitment to human rights is embedded in the Code of Conduct, supported by internal policies, and aligned with international standards such as the International Bill of Human Rights, the ILO Declaration on Fundamental Principles and Rights at Work, the UN Guiding Principles on Business and
Human Rights, and the OECD Guidelines for Multinational Enterprises. Svitzer enforces a Global Anti-bullying, Harassment, Violence and Discrimination Policy, which sets clear behavioural standards, prohibits discrimination or retaliation on any grounds, and ensures breaches are addressed promptly, fairly, and confidentially, with oversight by the Chief People Officer and support from HR and Compliance teams.
Risk assessment: Svitzer recognises that its towage operations face limited risk of forced or child labour due to the technical requirements of vessel operations and works to prevent adverse impacts on employees, supply chain partners, and communities, striving to uphold higher international standards where local rules are less stringent.
Business & Data Ethics
Anti-Corruption & Bribery
Svitzer is committed to conducting its business with integrity and upholds a zerotolerance approach to corruption, bribery, and facilitation of payments. This commitment is reflected in the company’s policies, training programmes, and oversight mechanisms, which collectively ensure that employees and third parties act in accordance with Svitzer’s ethical standards.
Targets: Svitzer has a 100% completion target for its annual Code of Conduct
refresher training. All onshore employees are required to complete the training each year. Achieving full compliance ensures that ethical conduct, anti-corruption principles, respect for human rights and responsible decision-making remain embedded across the organisation. The 2025 completion rate for onshore Code of Conduct refresher was 86% (2024: 92%), reflecting organisational changes and high operational activity, with improvement expected in the coming year due to increased focus on awareness and engagement.
Policies and actions taken: Svitzer’s Anti-Corruption Policy applies to all employees and third parties acting on Svitzer’s behalf. The policy sets out clear procedures to prevent, detect, and respond to unethical behaviour. Governance and policy oversight rest with the General Counsel, while implementation, monitoring, and investigation of potential breaches are undertaken by the Compliance function. As an active member of the Maritime AntiCorruption Network (MACN), Svitzer upholds the highest ethical standards and contributes to global efforts to eliminate corruption within the maritime sector and remains committed. In 2025, Svitzer continued to strengthen its anti-corruption framework through the following actions:
• Enhanced compliance management by expanding the use of the company’s
global risk management platform, RISMA, across the organisation to improve oversight, transparency, and process efficiency.
• Conducted spot checks on potential facilitation payments in high-risk ports, with no cases identified.
• Introduced a digital assistant (chatbot) to support employees in applying the Gifts and Entertainment Guideline.
• Delivered targeted training, including onboarding for new employees, Code of Conduct refresher modules, and riskbased ad-hoc sessions.
• Conducted knowledge assessments to identify training needs and capability gaps.
• Implemented a Speak Up awareness campaign, using QR codes to increase visibility of confidential reporting channels.
These initiatives support Svitzer’s longterm commitment to ethical conduct and responsible business practices across all operations.
Risk assessment: Due to its global operations, Svitzer is exposed to corruption and facilitation payment risks, particularly
in higher-risk jurisdictions. These risks are mitigated through the policies, controls, and actions described above.
Data Ethics (in accordance to §99d)
As digitalisation grows and data collection in the workplace increases, worker privacy is at risk, particularly in areas with low awareness of data protection. Svitzer ensures that any implementation of software or artificial intelligence is accompanied by strong data ethics principles, transparency, respect, innovation, and security to protect employees’ privacy. The Data Ethics Policy covers all Svitzer employees and is approved by the Board of Directors.
Targets: Svitzer has no quantitative data ethics or privacy targets. The company’s objective is to comply with relevant dataprotection regulation, including GDPR, and uphold responsible data-handling practices. Svitzer focuses on maintaining secure systems, preventing data misuse, and protecting personal information.
Policies and actions taken: Svitzer has taken the following steps in 2025, which it plans to continue in the long term:
• Regularly assessing human rights impacts, particularly concerning key issues such as health and safety, data ethics, and labour conditions. In addition, the Board of Directors reviews and approves the Data Ethics Policy annually to ensure continued alignment with legal requirements and ethical standards.
• All new employees are required to read the Acceptable Use Policy (AUP) during onboarding, which includes a dedicated section on data ethics.
Risk assessment: Svitzer collects increasing volumes of workforce, operational, and customer-related data, which introduces risks related to data privacy, misuse, and unauthorised access. Inadequate data protection could particularly impact vulnerable sensitive data, and breaches may result in regulatory penalties. Svitzer manages these risks through adherence to dataprotection regulations, internal IT security controls, including access management, encryption, and monitoring. Svitzer conducts monthly IT risk assessments to identify and address emerging threats, applies vendor risk management for third-party data processors, and maintains policies governing the responsible handling of personal data. With all these actions, Svitzer recorded zero data breaches in 2025.
Consolidated Sustainability Metrics
Employee headcount Male
§ Accounting Policies
Total energy consumption from fossil sources (MWh): All fossil-based energy consumption that is consumed/combusted for all assets and entities that are under Svitzer's operational control reported in MWh. Includes (but not limited to) the following: a. fuel oil, incl. marine diesel oil, and petrol; b. Electricity and heating from fossil sources, e.g. coal or natural gas (methane) using DEFRA factors.
Total from renewable sources (MWh): This encompasses all renewable energy consumption, including renewable electricity, heating and green fuels consumed on Svitzer-controlled vessels and/or shoreside installations and offices. Renewable energy consumption is split into: a. Renewable electricity including electricity from solar panels, wind turbines covering on-site self-generation and purchased electricity from the grid through RECs) b. Renewable heating which refers to heating energy sourced from renewable sources. c. Green fuels: Biofuel consumption.
Gross Scope 1 GHG emissions: Direct emissions reported based on the GHG protocol from Svitzer’s fuel consumption in liters of all vessels under its operational control, with direct GHG emissions converted to CO₂ equivalents using DEFRA emission factors.
Gross Scope 2 GHG emissions: Indirect emissions from purchased electricity and district heating are calculated by converting actual or estimated usage into emissions using national averages and location/ market-based IEA conversion factors. Location-based: Emissions calculated without considering renewable energy certificates (RECs) or power purchase agreements (PPAs), based on the national average emissions per location. Market-based: GHG emissions determined by the RECs or PPAs selected by Svitzer, or the residual mix for the remaining electricity emissions. For countries which do not disclose ‘residual-mixes’
Svitzer uses IEA location-based emissions factors to calculate emissions.
Scope 3: Value chain GHG emissions (Scope 3 GHG) are the CO₂ equivalents from Svitzer’s value chain activities. Of the 15 Scope 3 categories in the GHG Protocol, eight upstream categories and one downstream category are currently determined as applicable to Svitzer’s business model and activities. Value chain GHG emissions are in all reported categories based on financial spend data converted to CO2e emissions using CEDA emissions factors for all scope 3 categories except category 3, where DEFRA emission factors are being used.
Baseline year for all GHG emissions is 2023, while baseline year for carbon intensity is 2020.
Total number of employees (headcount) is determined as of 31 December. This includes those on garden leave or unpaid leave. This also includes employees who have been made redundant or whose employment has been terminated until the expiry of their notice of termination period (even if they have left the company). It also includes casual employees even if they are inactive.
Average employee headcount is calculated as the average number for each legal entity throughout the year. These averages are derived from measurements taken at the end of each month.
Employee headcount total at Executive Leadership Team: Total employee headcount as of 31 December. Svitzer Executive Leadership Team includes the Executive Management (currently the CEO and CFO), and other members of Svitzer’s Executive Leadership Team.
Consolidated Sustainability Metrics — continued
Leadership Team
1 n line with the Danish Business Authority's guidelines, a 40/60 gender distribution among Board members elected by the General Meeting is considered equitable. The shift in 2025 is due to the appointment of Ghim Siew Ho and Louise Løn, increasing female representation from one to three and reducing male representation from three to two due to Peter Wikström leaving, resulting in 2/3 male/female composition (40/60) in Board.
2 Target set by the Danish authorities for Executive Leadership Team and Senior Leadership Team.
3 The target is for both Global Executive Leadership Team and Svitzer Global Senior Leadership Team collectively.
Employee headcount total for Senior Leadership: Total employee headcount as of 31 December. Svitzer Senior Leadership means the direct reports of Executive Leadership who have direct reports themselves.
Percentage of gender distribution in Executive Leadership Team: Gender distribution based on the Total Employee headcount as of 31 December as a percentage. Executive Leadership Team includes the Executive Management (currently the CEO and CFO), and other members of Svitzer’s Executive Leadership Team. Underrepresented gender in Executive Leadership Team/employee headcount in Executive Leadership Team x100
Employee headcount total at Executive Leadership Team: Total employee headcount as of 31 December. Svitzer Executive Leadership Team includes the Executive Management (currently the CEO and CFO), and other members of Svitzer’s Executive Leadership Team.
Employee headcount total for Senior Leadership: Total employee headcount as of 31 December. Svitzer Senior Leadership means the direct reports of Executive Leadership Team who have direct reports themselves.
Percentage of gender distribution in Executive Leadership Team: Gender distribution based on the Total Employee headcount as of 31 December as a percentage. Executive Leadership Team includes the Executive Management (currently the CEO and CFO), and other members of Svitzer’s Executive Leadership Team. Underrepresented gender in Executive Leadership Team/employee headcount in Executive Leadership Team x100.
Percentage of gender distribution in Senior Leadership: Gender distribution based on the Total Employee headcount as of 31 December as a percentage. Underrepresented gender in Senior Leadership/employee headcount in Senior Leadership x100
Lost-time injuries: LTI is a work-related injury, which is classified as a fatality, life-altering injury (LAI) or lost workday case (LWC) that results in a worker (own employees and Non- Employee workers) covered by HMS being unfit for work on the day after or shift after the day of injury occurrence. This ‘day’ includes rest days, weekends, leave days, public holidays or days after ceasing employment.
Lost-time injury rate: The sum of lost-time injuries resulting from fatality, life-altering injury (LAI) or lost workdays (LWC) for own workforce (own employees and Non- Employee workers) covered by HMS divided by exposure hours and normalised by multiplying by 1 million hours.
MAERSK PRODUCT TANKERS
The sustainability chapter from Maersk Product Tanker’s Annual Report for 2025 is enclosed on the next pages.
MAERSK TANKERS
The sustainability chapter from Maersk Tanker’s Annual Report for 2025 is enclosed on the next pages.
Extract from Management review from the Annual Report of Maersk Tankers AS for year ended 31 December 2025
Management review
(deleted paragraphs)
Sustainability
The shipping industry plays a critical role in providing the world with a reliable supply of energy. As an efficient and dependable mode of transport, it enables people and economies to thrive.
The industry is inherently global, involving multiple stakeholders across its supply chain. Its impact on people and the planet carries a responsibility to integrate economic, social, and environmental considerations into core business practices.
Maersk Tankers’ business model is focused on the commercial management of tanker vessels and gas carriers on behalf of shipowners. As a values-led company, we are committed to the United Nations Global Compact (UNGC) principles on human rights, labour, anti-corruption and the environment. We expect our stakeholders to focus their efforts on important issues such as fighting corruption, climate change, the fair treatment of workers, and diversity, equity and inclusion. The health and safety of employees, as well as the safety of vessels and cargoes continue to be of the highest priority.
Climate
Shipping transports about 90% of world trade and accounts for nearly 3% of the world’s CO2 emissions.
As the manager of a sizeable fleet, we are committed to the United Nations Sustainable Development Goal 13 that seeks to combat climate change and its impact. In action, this means we are investing, developing and deploying solutions that help shipowners cut vessel emissions.
During 2025, we successfully implemented the Fuel EU Maritime regulation introduced that year. We worked proactively with our pool partners to ensure the smooth adoption of the Fuel EU compliance pool, covering all commercial, reporting, and regulatory requirements.
Our commitment to fuel optimisation remained strong throughout 2025, resulting in fuel savings of 7,525 MT compared with the 2024 baseline. This equates to a reduction of 0.60 MTCO₂ per vessel per day. These efforts have also contributed to a cumulative fuel saving of 109,503 MT against the 2017 baseline, reinforcing our dedication to decarbonisation through enhanced operational efficiency and continuous collaboration with our pool partners.
Looking ahead, we plan to implement the UK Emission Trading Scheme (UK ETS) in 2026, in addition to our ongoing fuel optimisation efforts. As part of our emissions reduction approach, we intend to take further steps to promote the use of biofuels across our vessel fleet.
In line with previous years, our initiatives in 2025 reflect a blend of operational efficiency, regulatory adherence, and environmental responsibility.
Responsible business
Conducting business in a responsible manner is imperative for Maersk Tankers.
We put emphasis on providing a safe, healthy, and supportive workplace where people can thrive. We believe that our people and relationships enable us to deliver for customers and partners, who are the reason we exist.
Guided by our One Team culture, we are dedicated to creating a vibrant workplace where people enjoy coming to work every day, supported by the policies and systems outlined in our employee handbooks.
We are committed to eliminating corruption, including facilitation payments, safeguarding human rights, and ensuring compliance with sanctions, and other relevant laws.
We monitor geopolitical developments, and we respond quickly when sanctions are introduced or changed. The industry has seen 19 new sanctions packages introduced by the EU (the latest in October 2025) since Russia’s invasion of Ukraine. We work to ensure compliance in our operations by following procedures and using screening tools. We continuously review and update
our processes to ensure that they reflect current regulations. As a result of our work, we continued trading our fleet in compliance with the constantly changing complex sanctions landscape in 2025.
As a company that operates globally, we have a large network of suppliers which implies a risk of human rights violations in the value chain which could harm individuals and have negative repercussions on Maersk Tankers. We work with our strategic partners to ensure suppliers conduct business responsibly in accordance with international and own company standards.
In our Third-Party Code of Conduct, we have set out minimum requirements connected to vessels managed by Maersk Tankers for our own business and direct counterparties, including but not limited to customers, partners, suppliers, and all parties acting on behalf of Maersk Tankers.
We require that counterparties operate in accordance with responsible business principles detailed in the Third-Party Code of Conduct and in full compliance with all applicable laws and regulations. The Third-Party Code of Conduct deals with business ethics, health and safety, environment, working conditions and employment practices, including human rights, and diversity equity and inclusion. Periodic reviews and follow-up audits as per our internal risk procedures are conducted to monitor the compliance levels. In addition, Maersk Tankers offers a Whistleblower hotline where internal and external parties can report misconduct.
The maritime industry poses an inherent risk of corruption due to the prevalence of administrative monopolies over services such as seaports. We have strict policies to ensure that we do not engage in corruption of any kind. We are a member of the Maritime Anti-Corruption Network (MACN), which works towards eliminating corruption and enabling fair trade, and we strictly adhere to our Zero Facilitation Payment Policy. Our stance and expectations on anti-corruption and bribery are also stressed in our Third-Party Code of Conduct.
There have been no bribery cases in 2025.
In 2026, we will continue our work to address corruption in accordance with our Zero Facilitation Payment Policy and through engagement as a member of MACN, contributing to positive change in the shipping industry.
People
We believe that stronger diversity drives a stronger business. True diversity means creating a safe, equal, and inclusive workplace for all.
In 2024, we developed a new reward philosophy and model to promote enhanced fairness and equity. In 2025 we continued our work on a structured, standardised, and aligned approach to rewards enabling a fair, consistent, sustainable, and scalable framework, reinforcing our commitment to right and fair pay, and our dedication to reducing biases. We incentivise what shapes our culture and drives our business.
In 2025, we launched a comprehensive Leadership and Culture Lab, including training and activities for leaders and employees through workshops and masterclasses, delivered both in person and virtually. The programme reinforces our One Team culture as an integral part of how we work and how we do business.
The Leadership and Culture Lab will continue in 2026.
In accordance with the guidelines from the Danish Business Authority, there is equal representation in the Board of Directors and other management levels of Maersk Tankers.
(deleted paragraphs)
KK GROUP
KK Group’s CRS report for 2025 is enclosed on the next pages.
Powering Change Towards a More Sustainable Tomorrow
Report 2025


Chair and CEO Letter
Highlights
Our Business
Risk Management
Governance
Sustainability
Management’s Review
Chair and CEO letter
2025 was a strong year for our company. Amid a wind market challenged by geopolitical and macroeconomic forces, we continued to grow our revenue while also significantly improving our overall profitability and free cash flow.
At the same time, we completed the integration of Vestas’ converter and controls business, and prepared to finalise the integration of Nissens Cooling Solutions. We launched our new strategy, Powering Change, and rebranded the company from KK Wind Solutions to KK Group, a forward-looking name that covers our core business in renewables, while encompassing the energy-intensive industries where we aim to grow our market share.
As part of our new strategy, we transformed our business into three business divisions supported by group functions. This new structure is aimed at creating a more diverse and resilient business going forward.
Delivering positive financial results during an ongoing period of economic uncertainty while transforming our business for the long-term is not to be underestimated. We humbly acknowledge the incredible contribution made by our almost 3,700 colleagues in delivering another year of strong commercial performance while maintaining high focus on quality, reliability and most importantly, safety.
Pernille Erenbjerg, Chair
Mauricio Quintana, CEO
Chair and CEO letter
(continued)
2025 highlights
During the year, we achieved several important milestones:
• In Power & Controls, we signed long-term framework agreements for the supply of converters and backup power solutions with key customers. We received a 100 MW order for Power Supply Units for the green hydrogen industry.
• In Cooling, we continued the ongoing integration of the recently acquired Nissens Cooling Solutions, generating positive top and bottom line growth numbers, paving the way for the ongoing process of full integration into the group.
• In Monitoring & Service, we generated record revenue which was driven by an increased focus on onsite service agreements with Original Equipment Manufacturers (OEMs) as well as asset operators, assisting with everything from installation to preventative maintenance.
• On a Group level, we opened a new factory in Bengaluru, India. Our largest manufacturing facility in Asia. In addition, we established a new US regional division to accelerate the company’s operations in the world’s second largest wind market.
In addition to the above, we made progress towards our sustainability ambitions and set new near-term greenhouse gas emission reduction targets, which were approved by the Science Based Targets Initiative.
Finally, but most importantly, we made our workplace safer. We made significant improvements across both the incident and lost time injury rates, a result we are particularly proud of.
Looking ahead to 2026
Going forward, we expect that the headwinds we faced in 2025 will continue to impact our business in 2026. We expect the wind industry to remain challenged by factors including the end of the tax credits in the US as well as speed of permitting in Europe. This only underlines the importance for KK Group to continue to diversify our business to increase resilience.
Despite market challenges, the fundamentals of our business remain strong. In Europe, the success of recent offshore auctions sends a positive signal to the industry. In the US, we will continue to increase our customer value proposition for the growing service and aftermarket business for onshore wind.
With our new strategy and the organisation in place, we are well positioned to deliver on our long-term strategic ambitions.
We express our sincere gratitude to our valued customers, suppliers and other partners for continuing to place your trust in working together with KK Group. We are looking forward to continuing our partnership in 2026 and beyond.
Pernille Erenbjerg Chair of the Board of KK Group
Mauricio Quintana CEO of KK Group
KK Group at a Glance
Sustainability Highlights
Sustainability Review
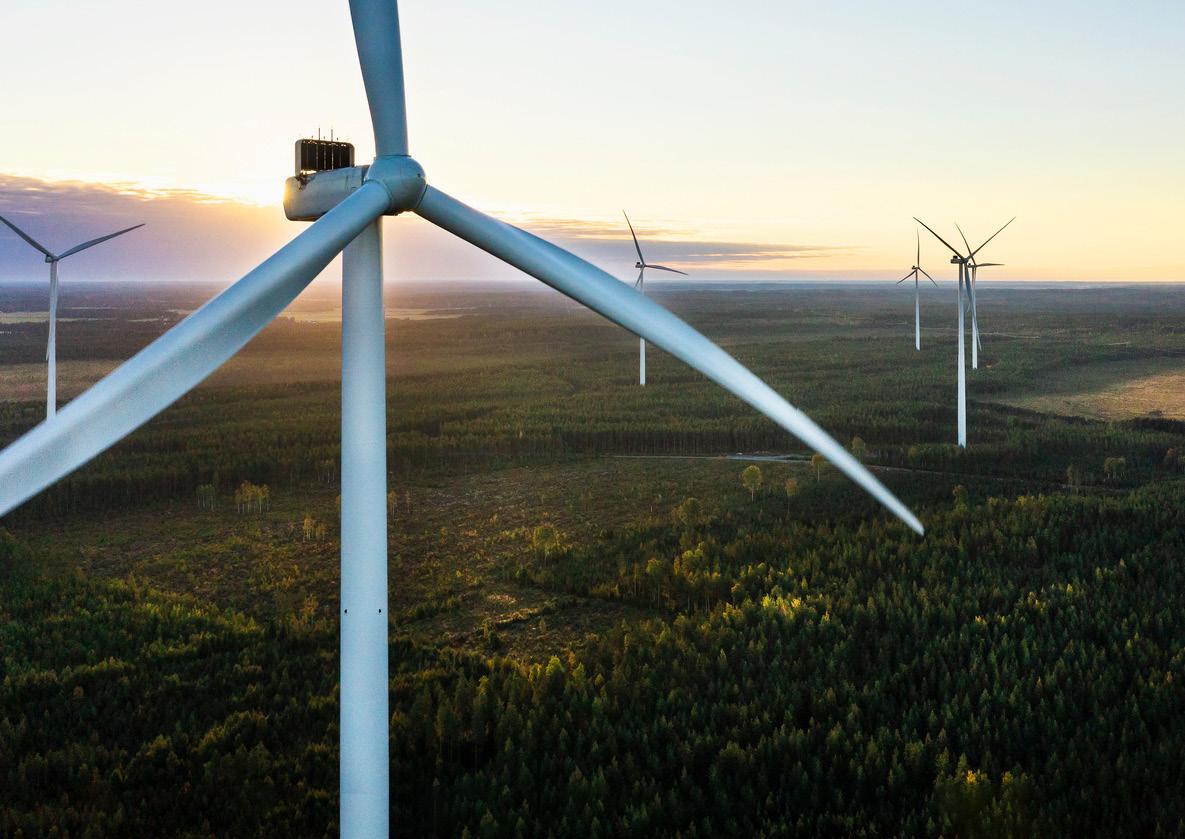
KK Group at a Glance
KK Group is a global leader in power, controls, cooling, monitoring and service solutions for renewable energy and energy-intensive industries. From humble beginnings in Denmark, we are today a diverse team of more than almost 3,700 people across 10+ countries around the world.
With decades of expertise in power, controls, cooling, and monitoring, we enable renewables to electrify societies and drive industrial energy efficiency.
Our expertise spans the full value chain — from development and manufacturing to service and digital solutions — supporting the entire lifecycle of our customers’ assets.
Backed by our long-term owner, A.P. Møller Holding, we are building on our strong foundation in the wind industry and expanding into energy-intensive industries such as hydrogen, mining, rail, and defence.
By engineering, manufacturing, and servicing technologies, we are Powering Change towards a more sustainable tomorrow.
GW of the global installed wind capacity is equipped with our solutions
70+
Patent families
45+ years of experience delivering solutions for renewables
120,000 wind turbines installed globally are equipped with our solutions
Ownership
Key customers across product offerings
50+ years of experience in cooling solutions for industrial applications
Global Footprint
Total manufacturing footprint of 241,000 m2 of which 97,000 m2 is for Cooling.
USA Office: Houston Warehouse: Lenexa
Germany
R&D: Kempen Office: Oldenburg
Denmark Headquarters: Ikast Offices: Horsens, Kolding, Copenhagen
R&D: Horsens Manufacturing: Hammel
> 300 people
100 – 300 people
< 100 people
Poland Manufacturing: Szczerin Offices: Szczecin city centre, Krakow
India Manfacturing: Bengaluru Offices: Benguluru city centre, Chennai
China Manufacturing: Tianjin, Taichung, Taiwan
Spain Office: Madrid Czechia Manufacturing: Olomouc Slovakia Manufacturing: Čachtice
Emissions avoided (Million tonnes CO2e)
540
(Total Recordable Incident Rate)
1.7
Number of employees (Headcount at year-end)
3,675
Sustainability Review
In 2025, we continued to make progress towards our sustainability ambitions. We launched a new sustainability strategy with key targets guiding our work towards 2035 and beyond. We improved our policy framework by launching new people and supplier code of conducts.
As the majority of our products supports the generation of renewable wind power, our business is proud to contribute to energy security and the necessary green transition, supporting the avoidance of 540 Mt GHG emissions during 2025, up from 490 Mt in 2024.
Smart for the PLANET
With the approval of our near-term greenhouse gas emission reduction targets by the Science Based Targets Initiative, we have now started the implementation of our climate transition plan.
The energy consumption at KK Group continue to shift towards renewable energy, with 59% of the energy consumption in 2025 coming from renewable sources, up from 58% in 2024. This is mainly driven by sourcing 100% of our electricity from renewable sources.
Care for PEOPLE
During 2025, we initiated a human rights impact assessment to map our current due diligence performance as well as performance when it comes to known salient human rights issues in the wind industry.
The employee turnover rate ended at 20% down from 27% in 2024 where the numbers were extraordinarily high due to the integration of the aquired Nissens Cooling Solutions.
The gender diversity in senior management has been flat at around 13% within the last three years and is now called out as a target effort to triple the number of females in senior management towards 2035.
KK Group’s focus on health and safety continued with no fatalities in 2025 and a lost time injury frequency rate of 0.77 down from 1.68 in 2024.
INTEGRITY in action
In the beginning of 2026, we launched new mandatory human rights and business ethics training to build awareness among our employees of our new, updated people code of conduct.
Smart for the PLANET
Care for PEOPLE
Number of employees by headcount at year-end
INTEGRITY in action
Share of underrepresented gender in the Board of Directors
Incidents of corruption or bribery
People Powering Change
Our 3,700 colleagues are our most important assets. Throughout this report, selected colleagues from across the company share how they are bringing our new strategy, Powering Change, to life in their daily work.
Himanshu Gupta joined KK Group in 2020, bringing a strong technical background and a deep interest in how complex systems integrate. He began as a Technical Project Manager and transitioned into a System Engineering role within the Power & Controls division.
Himanshu’s daily responsibilities center on turning complex systems into manageable, clearly defined sub-systems that can be developed and integrated into robust solutions. His focus on improving design quality by verification, validation, and disciplined technical reviews strengthens our long-standing expertise in both project management and manufacturing quality.
To Himanshu, system engineering is defined by its broad perspective. It goes beyond focusing on one product or function and requires seeing how every component influences the next—and how decisions in one part of the system ripple across the whole.
Himanshu’s journey mirrors our strategic transition from executing customer-defined solutions to taking greater ownership through build-to-spec projects. This shift enables us to deliver more value while raising expectations for engineering quality and system-level responsibility.
“Powering Change means solving complex technical challenges for our customers and witnessing the tangible impact of our work in the real world.”
Himanshu Gupta Senior Specialist Electrical Engineer, Power & Controls
Business Model
Strategy
Market Outlook
Power & Controls
Cooling
Monitoring & Service

Our Business

Business Model
KK Group is a global leader in delivering power, controls, cooling, monitoring and service solutions critical for enabling the widespread adoption of renewable energy and increasing the efficiency of energy-intensive industries.
Our flexible and global workforce has experience spanning the full value chain from development and manufacturing to service and digital solutions, supporting the entire lifecycle of our customers’ assets.
Our three business divisions, Power & Controls, Cooling, and Monitoring & Service target specific industrial segments and will drive our growth journey, with the support of our group functions.
A global technology partner
We simplify complexity for our customers by delivering innovative engineering solutions on time and with the highest quality standards.
Over the last decade, our customers entrusted us with a larger share of their design work, moving from mainly delivering Buildto-Print (BtP) to having a large share of Build-to-Spec (BtS) and design projects.
We constantly challenge ourselves to innovate and develop our own proprietary products, benefitting our customers and helping optimise costs and improve industrial competitiveness.
Our key customers are served directly through account management teams. Each business division takes responsibility for different industry segments. In addition, we sell to channel
partners allowing us to reach geographies and end segments that we do not serve directly.
As our customers seek cost-effective regional solutions, we offer a global, integrated value chain that meets these demands.
With cutting-edge manufacturing and testing facilities across Europe and Asia, we offer cost-effective solutions without compromising quality.
Industrialisation of the wind industry
Going forward, we are committed to supporting the necessary industrialisation of the wind industry. As wind turbines have increased in size and power output, OEMs have begun to focus on developing modular, standardised solutions that are easy to transport, install, operate and service. We work closely with customers to co-develop technologies in line with their requirements for quality and reliability, using standardised components. Together, we can achieve economies of scale by leveraging our manufacturing capabilities and global supply chain of more than 750 electrical and mechanical suppliers, enabling the sourcing of components at competitive prices and reducing the cost of energy.
Supported by a flexible and globally mobile workforce of highly skilled engineers and technicians, we take a proactive approach to turbine operations and maintenance. Our teams support the full lifecycle of a wind turbine, from prototype testing, precommissioning, and high-voltage services during installation, to predictive maintenance, spare-part supply and repair, retrofit solutions, and turbine upgrades.
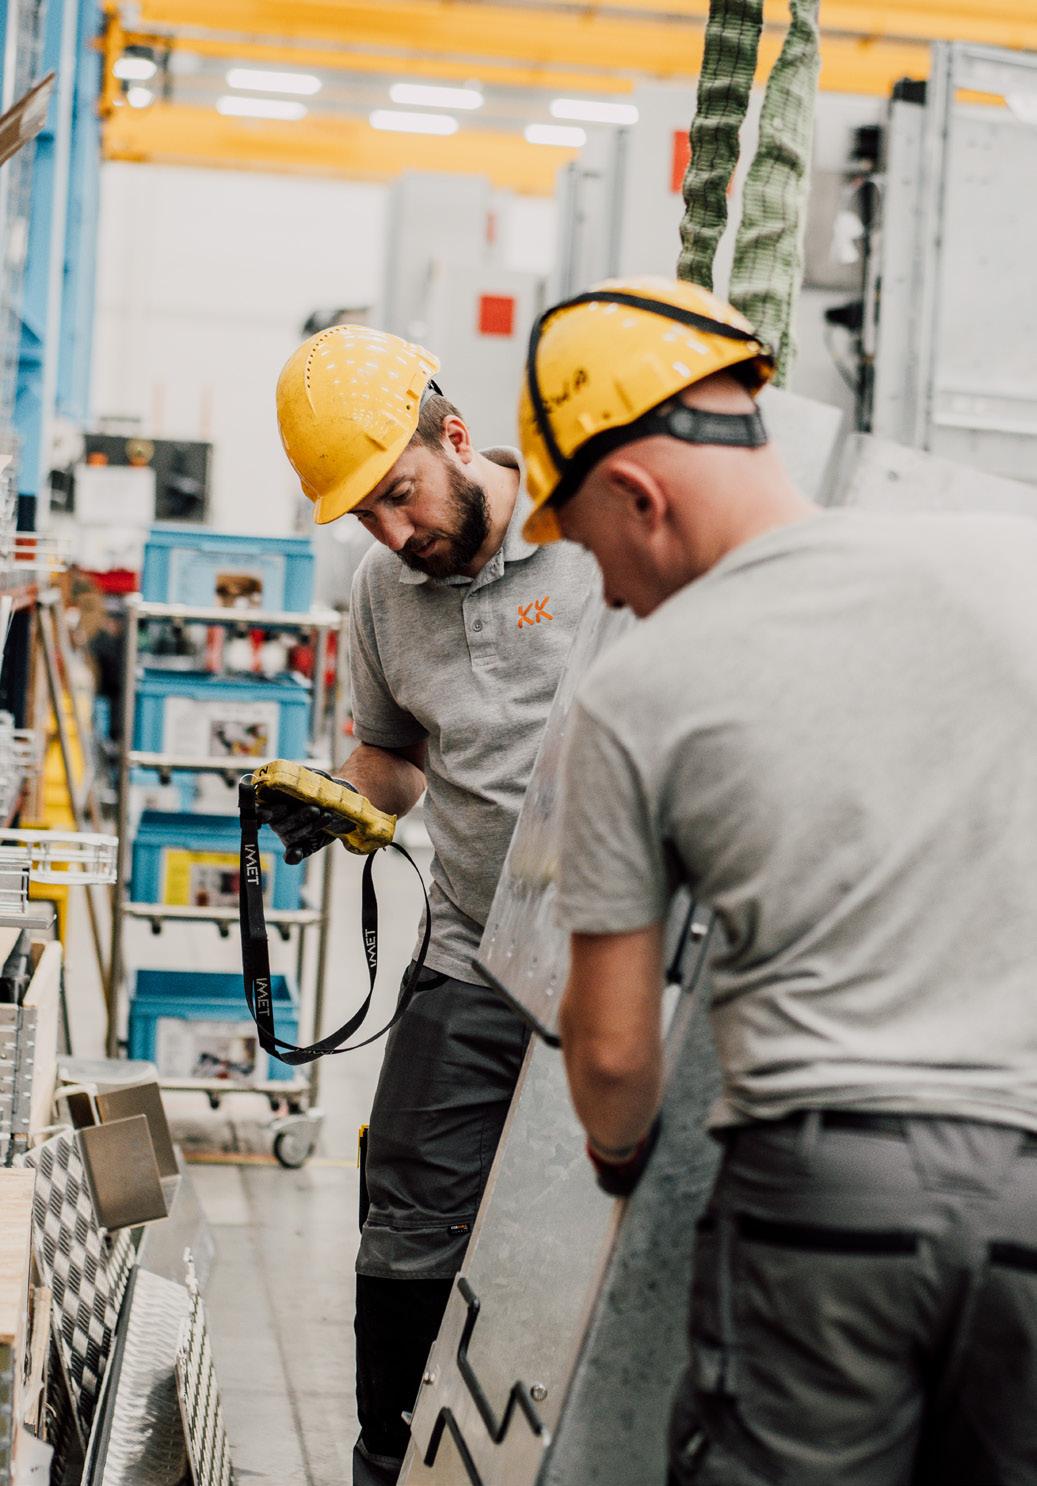
Strategy
Powering Change towards a more sustainable world.
In 2025, we launched a new strategy - Powering Change. This strategy guides us on a journey to become a more resilient, diversified, and global technology partner.
As part of the new strategy, we aim to accelerate investment to solidify our customer value proposition and to diversify within our core wind business, repurpose existing wind products in other industries to expand our role across the energy transition value chain.
To better serve our customers, we have adjusted our organisation to work more efficiently and drive scale across our business. Our three business divisions will enable our company to address critical needs across the global energy system, from energy generation and storage to grid connection, monitoring, and lifecycle services. We aim to align product offerings, operational footprint, and customer experience, driving scale, efficiency, and growth opportunities to better support our customers throughout the lifecycle of their operating assets.
Finally, by changing our company name to KK Group, we act as one company across all business units, including recently acquired companies.
Strengthen our position in wind and renewables
The wind industry is and will remain the largest segment for our business going forward. The recent addition of cooling and monitoring technologies has supplemented and strengthened
our core product offerings to wind OEMs. In addition, we are expanding our monitoring and service offerings to increase our value proposition to asset owners.
In 2025, we established a US region, where we aim to capture a larger share of the onshore business by supporting OEMs and asset owners alike.
Expand into other sectors and industries
Our new strategy emphasises diversification to enhance our long-term resilience. We are repurposing core technologies from Power & Controls to industries such as hydrogen and battery energy storage.
Diversification also includes unlocking growth opportunities with asset owners and industrial customers. The addition of cooling and monitoring technologies has strengthened our presence in new energy-intensive industries, where high-temperatures and rotating machinery calls for cooling and monitoring sensors. We aim to invest and innovate our product portfolio and expand our sales footprint to scale our presence in our industrial business.
At the same time, we will establish scalable hardware platforms across our wind, hydrogen, and battery energy storage technologies to deliver high reliability, extended lifecycles, and seamless connectivity with our digital services.
Accelerate focus on product development
We have a strong track record of manufacturing systems for customers based on their own design specifications. As the wind industry continues its vital journey of industrialisation,
the standardisation and modularisation of component manufacturing have become critical to reducing the cost of energy. Moving forward, we will place greater emphasis on codevelopment projects with our key customers and expand our portfolio of proprietary intellectual property products.
Looking ahead, we will broaden our portfolio through the development of advanced digital solutions, strengthening and driving our service business. Our digital solutions are designed to meet the highest standards for cybersecurity requirements, and we will continue to invest in this critical area going forward.
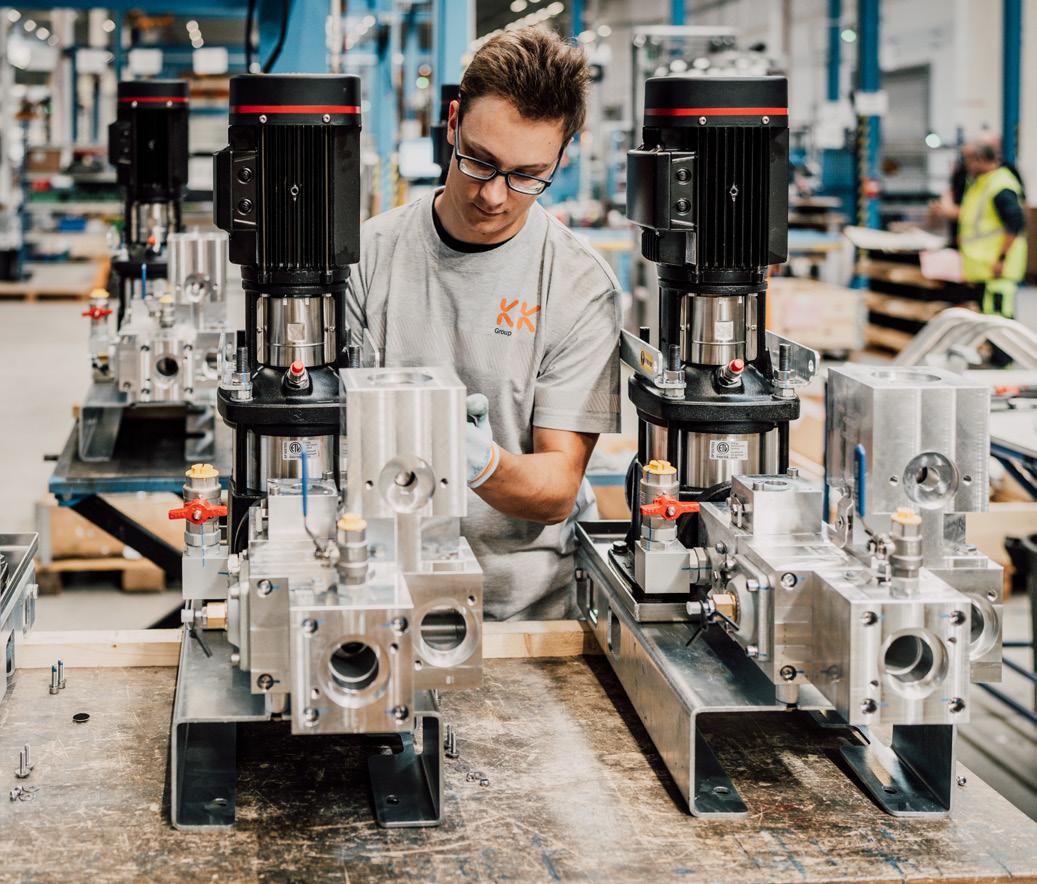
Market Outlook
Through our technologies, our company plays a critical role in enabling the electrification of society and addressing emerging challenges facing the global energy market related to energy security, energy efficiency, and the transition to more sustainable industrial systems.
Today’s geopolitical volatility and economic complexity create a landscape of both risk and opportunity for our company. The anticipated growth in the wind industry is driven by the imperative to strengthen energy security, enhance the competitiveness of strategic industries, and accelerate climate action. At the same time, market dynamics are shifting, with greater emphasis on domestic industrial capacity, local content requirements, and higher sustainability standards.
Regulatory initiatives such as the Net-Zero Industry Act, together with expanded public funding for innovation, are helping to unlock new avenues for growth and reinforce longterm industry development.
Solid fundamentals for wind
Despite the current macro-economic challenges facing the wind industry, the fundamentals are solid and will remain the largest segment for our business going forward. Global installations (excluding China) are expected to grow at approximately 9% CAGR through 20341, while global electricity demand is expected to grow by 3% CAGR during the same period. However, the near- to mid-term outlook has softened, and growth trajectories among wind OEMs are mixed and uneven.
Onshore wind has been revised down, primarily reflecting a weaker US outlook. Despite these adjustments, underlying onshore demand remains resilient, and total installed capacity is still expected to grow by 6% CAGR by 20331.
Offshore wind has experienced more significant cuts versus earlier forecasts, with the cumulative outlook reduced largely due to weaker projections in the EU and US. Permitting delays, cost inflation, and uncertain policy signals continue to constrain development. Nonetheless, the offshore market is still projected to grow 18% CAGR by 20331, offering significant opportunities for our company given our strong track record in offshore wind.
Overall, while the long-term growth case for wind remains intact, the sector is navigating mid-term volume cuts, policy headwinds, and ongoing margin pressure, resulting in a more cautious and uneven OEM recovery path.
Industrial opportunities
A significant untapped market exists beyond wind, offering diversification opportunities through stronger positions in adjacent industries such as rail, mining, defence, and construction. At the same time, expanding the aftermarket and service business may enhance customer retention and drive higher profitability.
The growing importance of cybersecurity
A resilient and independent energy system safeguards against disruptions that may cripple industries and critical infrastructure.
Modern energy infrastructure is increasingly digital, integrating advanced technologies such as AI and data optimisation. While these innovations enhance efficiency, they also introduce new vulnerabilities, including cybersecurity threats.
Going forward in 2026 and beyond, protecting critical energy assets from interference and shutdown will continue to be a key priority for OEMs and asset operators.
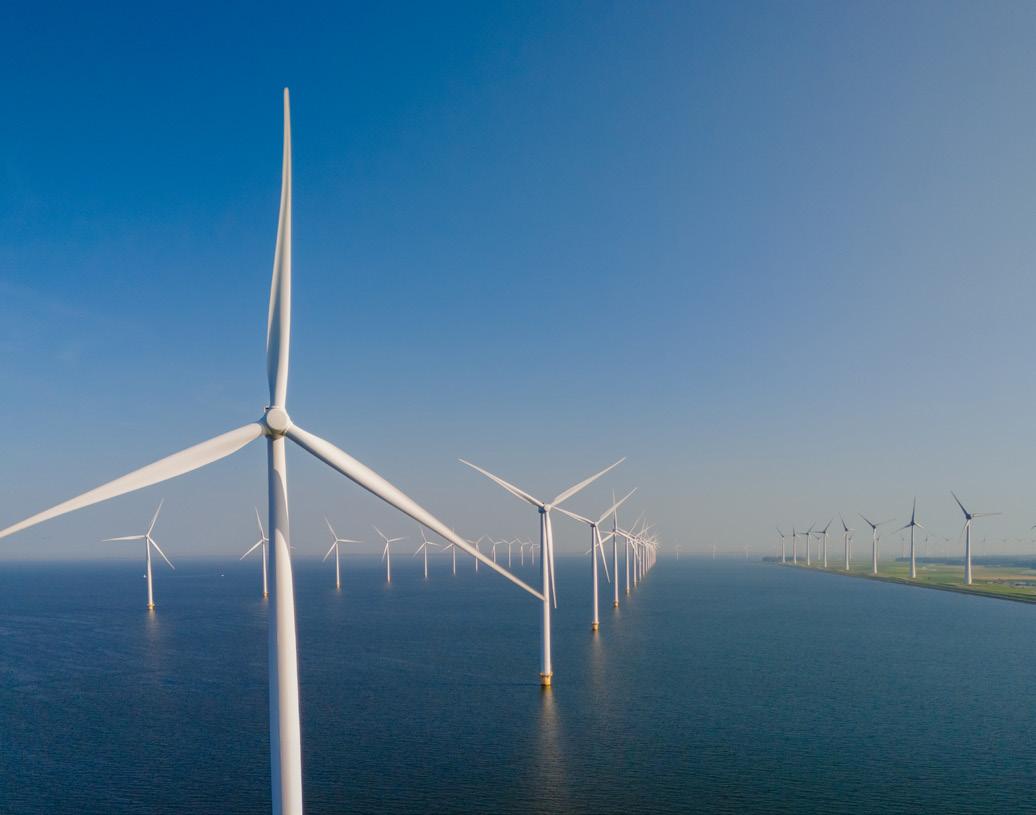
1Wood Mackenzie Global wind power market outlook update: Q3 2025
Power & Controls
Our Power & Controls division delivers integrated power conversion, control and backup systems tailored to meet customer requirements.
Our solutions are the preferred technology of manufacturers, asset owners, and operators in the wind and growing green hydrogen and battery energy storage industries.
Power & Controls’ solutions directly support the renewable energy transition through enabling the production of wind energy, green hydrogen generation and energy storage.
Since our foundation, the converters and controls systems we manufacture have been installed in more than 164 GW of installed wind turbine capacity, of which more than 25 GW were installed during 2025.
2025 progress
In 2025, we made progress towards our goals. We achieved revenue of 5,800 mDKK, slightly down from 5,900 mDKK in 2024.
We signed long-term supply contracts for new converters and power backup technologies with our key customers in the wind industry.
We strengthened our partnership with key customers on technology and product development to ensure that future power systems are more competitive, using strong, proven technology and innovative solutions in converters, control panels, power backup, and SCADA (Supervisory Control and Data Acquisition) systems.
We expanded our green hydrogen activities with additional framework contracts and we currently have a 10 percent market share in Europe, where we, amongst other, are delivering the power supply unit for a 100MW project, one of Europe’s biggest green hydrogen plants under construction in Germany.
2026 outlook
Going forward, we will continue to focus on delivering value to our key customers in wind, while accelerating the development of new solutions to capture new wind OEMs both within and beyond Europe.
We will continue to invest in the development of our own technology (KK IP), including MultiCon power backup systems, PtX rectifiers and light-weight bionic solutions to enable the replacement of copper with aluminium in power converters. These new technologies enable us to diversify our business towards a more diverse customer base and into multiple industries, creating a more resilient business.
We will leverage strategic partnerships to accelerate innovation enabling business diversification into adjacent power-electronics segments including battery energy storage systems (BESS), and other grid applications.
“The solid results we delivered in 2025 were driven by the close partnership we have with our strategic customers. Going forward, we aim to continue to deliver value for our customers while developing new technologies to broaden our customer base beyond wind to generate growth and secure long-term resilience of our company.”
René Balle, President, Power & Controls
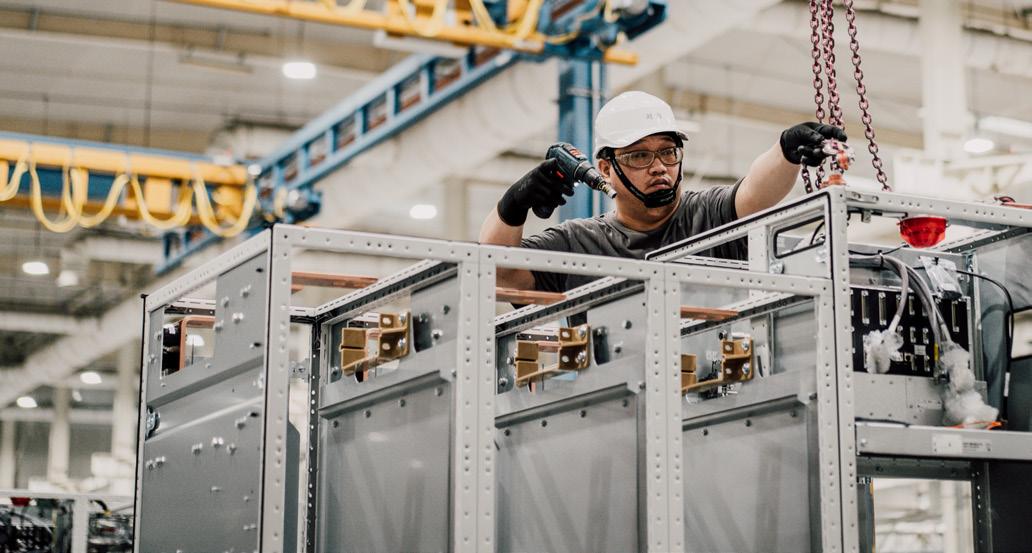
Cooling
The Cooling division, formerly Nissens Cooling Solutions, was acquired in 2024. The division designs and supplies advanced cooling and thermal management systems for the wind industry and other energy-intensive industrial applications globally.
The division delivers complete system solutions, including integrated cooling systems and individual coolers, tailored to customer-specific requirements. With a strong focus on systemlevel performance, the Cooling division enables higher efficiency, reliability, and uptime in demanding operating environments.
Cooling products are based on proprietary technologies that outperform traditional plate-and-bar solutions. These innovations reduce material usage, energy consumption, and production time, strengthening both cost competitiveness and sustainability performance.
All cooling solutions and heat exchangers are manufactured from aluminium. Through optimised design and reduced material intensity, the division reduces GHG emissions while improving resource efficiency and scalability.
2025 progress
In 2025, the Cooling division delivered solid progress against its strategic objectives. Revenue increased to 1,100 mDKK from 1,000 mDKK in 2024.
Growth was driven by increased market share in key industrial segments, including mining, construction, and defence, reinforcing the Cooling division’s role as a central pillar in the Group’s diversification strategy. At the same time, the product portfolio
was strengthened, and operational efficiency improved, laying the foundation for continued innovation and scalable growth.
Alongside top-line growth, profitability improved significantly. This was achieved while continuing the integration of the cooling business into the Group, marking an important step in building a stronger and more resilient Cooling division.
Technology development
During the year, the division launched the Multi Valve Block, a thermal management system designed for a new generation of powertrain applications, including batteries, motors, and inverters. This marks an important expansion of the Cooling divsion’s capabilities into electrified and high-energy systems.
2026 outlook
Looking ahead, the Cooling division will increase its market share in wind, expand its aftermarket and service offerings, and strengthen its position in selected industrial segments.
In a largely commoditised market, future growth will be driven by cost efficiency, quality, and a continued shift toward systemlevel solutions. Expanding aftermarket services and entering new industries, including Battery Electric Vehicles, will support both growth and diversification while increasing resilience across market cycles.
“In 2025, the Cooling division delivered solid growth while conducting its integration into the Group. This confirms the strength of our platform and our ability to scale. With significant opportunities beyond wind, our clear ambition is to become a preferred thermal management partner for high-energy industrial applications globally.”
Kenneth Svinth, President, Cooling
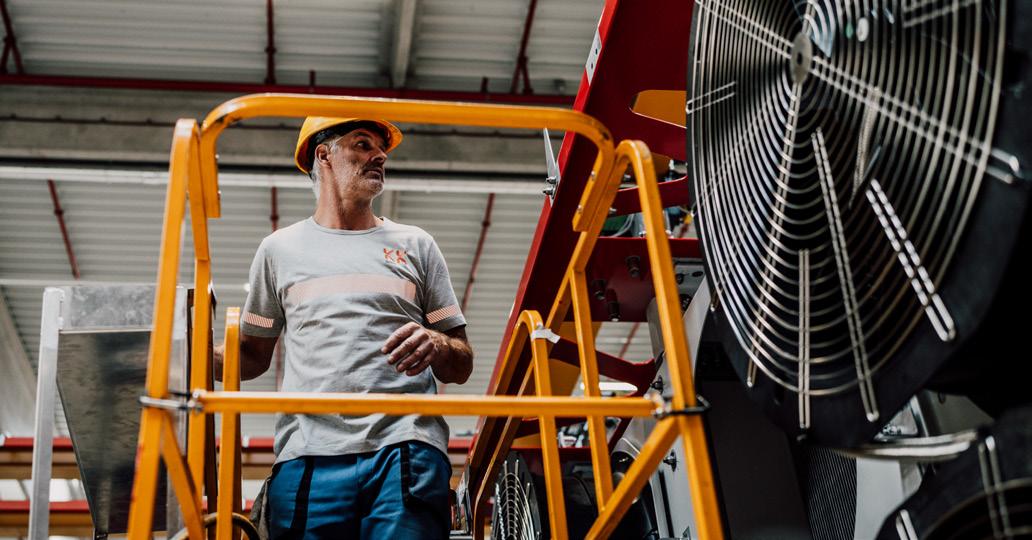
Monitoring & Service
The Monitoring & Service division offers an integrated portfolio of monitoring technologies and operational services that enhance the reliability, performance, and lifetime of wind turbines and eneregy-intensive industries.
Data-driven insights, spare parts, and the expertise to deploy them are crucial for ensuring predictable operations, reduce downtime and maximise production of energy and ensuring electrification of industries globally.
We support customers with offerings, including condition and vibration monitoring, predictive maintenance tools, spare parts, high-voltage services, field technicians, repairs, performanceboosting retrofits and upgrade projects and engineering support.
Our highly skilled technicians take a proactive approach to operations and maintenance. We prioritise safety and maintain the highest quality standards in all operations.
2025 progress
In 2025, the division made progress towards our strategic objectives. Revenue increased to 900 mDKK, from 645 mDKK in 2024. This result was achieved by an increased focus on onsite service agreements with OEMs as well as asset operators, assisting with everything from installation, retrofits and preventative maintenance.
In collaboration with colleagues from our US region, we signed a spare parts supply agreement with one of the largest utility providers and asset operators in the United States.
At our factory in Hammel, Denmark, we significantly increased the production capacity of the PCH 1026 Mk 3, a digital monitoring solution installed in more than 120,000 wind turbines around the world.
During 2025, we transformed the division to support sustainable growth and create a more cohesive and competitive product and service portfolio. We also enhanced our repair and warranty processes to deliver faster and more tailored customer support.
2026 outlook
Going forward, we aim to expand the product and service portfolio by developing new monitoring products and digital solutions to drive the future spare parts and service business. We will also grow new business opportunities with asset operators and industrial customers, both in the US region and in the rest of the world.
Industrial diversification remains limited to safety sensors for rotating machinery. Revamping our product portfolio and expanding our sales presence in the market are key to grow the industrial business.
We will enable scalable hardware platforms across own technologies in wind, hydrogen and battery energy storage. This will ensure high reliability, long lifecycle and seamless connection to our digital services.
“2025 was a record year for Monitoring & Service. Through the close collaboration with our customers, we continued to create significant value and underline the potential of the division. Going forward, we aim to provide even greater value-adding services and capture the market within downtime reduction and increase in energy production for asset operators.”
Mads Sckerl, President, Monitoring & Service
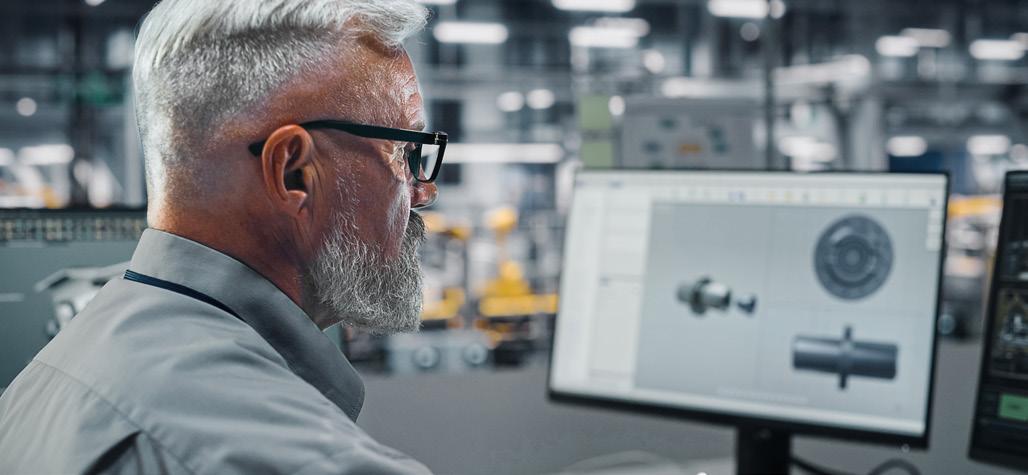
People Powering Change
Our 3,700 colleagues are our most important assets. Throughout this report, selected colleagues from across the company share how they are bringing our new strategy, Powering Change, to life in their daily work.
Emil Wieck Davidsen joined Nissens Cooling Solutions in 2018. He has an engineering background and works as a R&D Specialist in the Technology department within our Cooling Division.
Emil was among the first to take on the challenge of designing a thermal management system for a new generation of electrified vehicles. With a strong technical mindset and a drive to turn ideas into practical solutions, Emil began sketching the early concepts that would later become the recently released Multi Valve Block.
In his work, Emil focuses on shaping robust and compact solutions that enable industrial vehicles to transition into electrification. The Multi Valve Block – developed in close collaboration with colleagues – optimises battery performance and plays a central role in the cooling system, where electrification and thermal management meet. Though small in size, the component has a significant impact, supporting reduced fuel use, quieter operation, and lower emissions in heavy-duty applications.
For Emil, innovation begins with curiosity and persistence. From early concept sketches to refined design, his approach reflects the importance of teamwork and technical dedication in turning complex challenges into reliable, high-performing solutions.
Emil’s contribution also highlights the strength of our Cooling Division, and our ability to combine new capabilities with deep expertise.
“For me, Powering Change is to drive innovation, wherever it is found, all the way from the drawing board to its first implementation operating in the field.”
Emil Wieck Davidsen Senior Specialist - R&D Technology, Cooling
Double Materiality Assessment
Risk Management
Double Materiality Assessment
Understanding our stakeholders’ expectations is fundamental for guiding our sustainability direction. Based on this, we have taken essential steps to identify and prioritise sustainability matters affecting our stakeholders and KK Group.
This is the foundation for the initial Double Materiality Assessment (DMA) which we conducted in 2024 based on the process described below.
Stakeholder engagement
The process was based on a combination of internal documents and workshops with internal stakeholders across the organisation representing both the business as well as external stakeholders such as suppliers, investors, customers, partners, and employees.
Documentation and scoring
Each identified Impact, Risk, and Opportunity (IRO) was documented including their scoring. The scoring parameters are based on the July 2023, European Sustainability Reporting Standards (ESRS):
• Impact materiality: Scale, scope, irremediability, likelihood (whether an impact is positive/negative and actual/potential).
• Financial materiality: Financial magnitude of risk/ opportunity, likelihood, and the nature of the financial effect.
Impact and Financial effect were defined in two separate charts with respective scale and likelihood. A threshold was chosen for Impact and Financial charts. The applied thresholds prioritised severity over likelihood.
Sustainability matters and materiality decisions
IROs have been identified on the lowest possible level of the ESRS topology. A sustainability matter is deemed material if at least one of the IROs is above the threshold. In addition to assessing the ESRS sustainability matters assessed, Cybersecurity was deemed material.
DMA methodology
Step 1 – Mobilisation:
Identification of internal stakeholders deemed most knowledgeable on respective sustainability matters, while ensuring that all sustainability matters were addressed. Identification of sustainability matters that are irrelevant considering our business model.
Step 2 – Establish hypothesis:
Collection of stakeholder insights to identify IROs through interviews facilitated by an external company. All sustainability matters were reviewed with a focus to identify significant IROs.
Step 3 – IRO Analysis:
Scoring IROs identified based on the information collected from the interviews and the thresholds set.
Step 4 – Workshop:
Workshop held with KK Group Executive Management to review and assess preliminary scoring from Step 3, which was split into material, potentially material and non-material topics. Culminating in an overall assessment regarding the set thresholds and validity check of the outcome of material and non-material sustainability matters.
Step 5 – Documentation:
Any changes following the above procedures were incorporated into relevant documentation.
A process to embed and manage people and the environmental IROs as part of our overall risk management process is yet to be established. The DMA covered KK Group’s full value chain. The identification focused on upstream and downstream activities which are, based on industry perception.
People Powering Change
Our 3,700 colleagues are our most important assets. Throughout this report, selected colleagues share how they bring our new strategy, Powering Change, to life in their daily work.
Jakub Grega joined KK Wind Solutions in 2016 and has built his career through hands-on technical expertise, strong product knowledge, and collaboration. He started in the test department at our factory in Poland, working with visual and electrical testing of power converters and gradually taking on greater responsibilities.
Over seven years in testing, Jakub developed deep expertise in converter testing, low-voltage platforms, and related panels. He also supported quality assurance and helped train new colleagues in both testing and production. This experience gave him a strong end-to-end understanding of how our products are built, tested, and perform in the field.
Jakub later moved into the Service department to bring factory expertise closer to on-site work. Today, as a Field Service Technician in the Monitoring & Service division, he supports troubleshooting, repairs, retrofits, and testing at customer sites. His background helps him connect product construction, design models, and practical solutions in real-world conditions.
His work has taken him across Denmark and internationally, including assignments in France, Germany, Taiwan, and South Korea. In 2020, Jakub also completed an engineering degree, strengthening his ability to combine theory with practical problem-solving.
“In the field, Powering Change means adapting quickly, sharing knowledge, and helping build something bigger together. Every person contributes a small part, and together that becomes real power.”
Jakub Grega Specialist Technician - Field Service, Monitoring & Service

Governance Framework
Board of Directors
Executive Leadership Team
Governance Framework
KK Group and its operating companies have been owned by A.P. Møller Holding A/S since 2019. Our governance structure is based on close coordination between the Board of Directors and Executive Leadership Team.
Shareholders and general meetings
The shareholders of KK Group exercise their right to vote at the Annual General Meeting which includes the appointment of the Board of Directors, who, together with the Executive Board appointed by the Board of Directors, are responsible for the management of KK Group.
Board of Directors
The Board of Directors is responsible for the overall strategic management of KK Group, setting our strategy and making decisions concerning major investments and divestments, the capital base, key policies, control and audit matters, risk management, and significant operational issues.
The Board of Directors also ensures that sustainability is integrated into the business strategy and monitors progress against defined objectives.
Executive Leadership Team
The Board of Directors appoints the Executive Board to conduct the day-to-day management of KK Group. The Executive Board forms part of the broader Executive Leadership Team (ELT) and carries out its responsibilities in close cooperation with the other members of the ELT.
ELT holds regular formal meetings and focuses on strong ownership, execution of strategy and performance, and managing the day-to-day operations.
People Committee
The People Committee is elected by the Board of Directors and consists of two board members, Pernille Lyngvold Erenbjerg as the Chair of the committee and Simon Krogsgaard Ibsen as a member. The committee meets at least four times a year, and when circumstances dictate.
The main responsibilities of the committee are to support the Board of Directors with oversight of the compensation strategy and structure, remuneration and salaries, organisational review and talent acquisition.
Audit Committee
The Audit Committee is a committee of the Board of Directors and consists of two board members with Jesper Ridder Olsen as the Chair of the committee and Simon Krogsgaard Ibsen as a member.
The committee’s main responsibilities are to oversee KK Group’s financial and non-financial reporting processes, as well as risk management, tax governance and audit related matters.
Further, the Audit Committee is to provide input and support to our Financial, Legal and IT organisation to ensure continuous improvements and alignments.
Governance Framework
Group Sustainability
Group Sustainability reports directly to the Executive Leadership Team and is focused on three major tasks:
• Setting, agreeing and updating the sustainability strategy.
• Deploying the strategy based on the agreed road-map and linked sustainability program.
• Reporting and communicating on progress.
To create a more competitive, motivated and resilient KK Group, we constantly assess our approach to maximise our ability to turn sustainability risks and impacts into opportunities.
Corporate governance committees
KK Group has four ELT delegated committees, all including the CEO and CFO, providing structured governance, and conducting gate reviews according to the corporate stage/gate model across key areas.
The Commercial Committee meets weekly, if needed, to approve major commercial agreements, customer projects, and other commercial initiatives.
The Product Development Committee meets every quarter to review and approve technology platforms and new product development, including related investments and know-how plans.
The Investment Committee meets quarterly to oversee significant investment projects, footprint changes, and the investment portfolio.
The Acquisition Committee meets minimum twice a year to evaluate and approve potential acquisitions and associated investments.
Data ethics
KK Group has policies on how to handle data to customers and employees in accordance with the GDPR legislation, EU Data Boundary, our privacy policy and procedures for classification and management of documents and data.
Data privacy is ensured through secure storage. Data ethics are embedded within our existing policies, aligning with the Group IT and People policies. Our policies on data ethics comply with the Danish Financial Statements Act, section 99d.
In KK Group, we are using tools for Artificial Intelligence (AI) data processing and have developed a policy for processing data using AI complying with our internal policies and relevant legislation. Using other AI tools requires explicit approval from the Global IT department and must follow our AI Policy which has been implemented during 2025.
Board of Directors
Pernille Lyngvold Erenbjerg, Chair
Pernille Lyngvold Erenbjerg joined our Board of Directors in 2024, having previously served as Chair of KK Group Cooling, previously Nissens Cooling Solutions. She brings extensive experience from her roles at Genmab, Millicom, and RTL Group. She is well-versed in governance and ESG initiatives. Her leadership focuses on advancing sustainable energy and corporate responsibility.
Jesper Ridder Olsen, Board Member
Jesper Ridder Olsen became part of our Board of Directors in 2019. He brings extensive experience within finance, M&A, strategy, sustainability, and governance from his current role as CFO in KIRKBI A/S and previous roles in Maersk Drilling and A.P. Moller – Maersk as well as audit/advisory partnerships at EY and KPMG. His experience and expertise supports KK Groups’ strategy with focus on continued growth and value creation.
Simon Krogsgaard Ibsen, Vice Chair
Simon Krogsgaard Ibsen joined our Board of Directors in 2019 and was elected to vice Chair in 2024. He brings experience within financial governance and corporate strategy, contributing to KK Group’s fiscal stability and growth strategies. His expertise supports the board’s long-term vision, particularly in integrating sustainability in financial operations and ensuring compliance with evolving regulatory frameworks.
Anita Vrou, Board Member, Employee Elected Representative*
Anita Vrou became part of KK Group with the acquisition from Vestas in 2023. She was elected to the Board of Directors in KK Group in 2024. Anita Vrou has worked in the electronics industry since 2007, at Flextronics, Vestas and now KK Group.
Elke Elfriede Eckstein, Board Member
Joining our Board of Directors in 2020, with a background in manufacturing, engineering and general management, Elke Elfriede Eckstein supports KK Group’s operational efficiency and supply chain. Her efforts contribute to ensuring sustainable sourcing practices aligned with KK Group’s sustainability targets.
Edin Dizdarevic, Board Member, Employee Elected Representative*
Edin Dizdarevic joined KK Group through the acquisition of Nissens Cooling Solutions in 2024 and was elected to the Board of Directors in 2024. Currently, as Director Specialist in the Cooling Division, he leads key account strategies and drives business growth in the cooling division.
Fabrice Roger Daniel Bregier, Board Member
Fabrice Roger Daniel Bregier joined our Board of Directors in 2020, bringing a wealth of corporate development experience from aerospace and software companies and a deep understanding of sustainable energy solutions. As a Board Member, he supports KK Group international expansion.
Troels Møller, Board Member, Employee Elected Representative*
Troels Møller became part of KK Group in connection with the acquisition from Vestas in 2023. He was elected to the Board of Directors in KK Group in 2024. He has functioned as a union representative for the past 11 years, focusing on areas including favorable salary and working conditions for our employees.
Executive Leadership Team
Mauricio Quintana, Chief Executive Officer
Mauricio Quintana became the CEO of KK Group in January 2022. With a career spanning three decades in the energy and engineering sectors, Mauricio brings significant experience in energy transition. Before joining KK Group, he held key positions at organisations such as ABB, Clipper Windpower, and United Technologies in roles of increasing responsibility, driving growth and operational excellence.

Birgitte Ladefoged, Chief Human Ressource Officer
Birgitte Ladefoged joined KK Group as CHRO in 2023. With 12 years of experience as Divisional CHRO at Danfoss, she excels in HR leadership and organisational development. She is dedicated to building sustainable, people-centered HR practices, focusing on talent acquisition, leadership development, and fostering an inclusive work environment aligned with KK Group’s sustainability goals.
Bjørn Reinhardt Mogensen, Chief Financial Officer
Bjørn Reinhardt Mogensen joined KK Group as CFO in 2023. He has extensive financial management experience, having previously served as VP/CVP at Novo Nordisk and SVP at Lundbeck. His background provides a robust foundation in financial strategy, business partnering, cost management, LEAN and corporate governance.
Michael Dallala, Chief Corporate Development Officer
Michael Dallala joined KK Group in 2022 to lead Strategy and M&A and was appointed CCO and Head of Corporate Development in 2023. He has extensive experience in strategy, sales, business development and M&A from his previous roles at Schneider Electric and United Technologies. In his current role, he is responsible for the Corporate Strategy, public affairs, sales excellence, M&A and post-merger integration.
René Balle, President, Power & Controls
René Balle joined KK Group in 2013 as CTO and was appointed CCO in 2015. With extensive experience in the wind industry, including leadership roles at vestas and AREvA Wind, he focuses on driving sales and customer engagement strategies, contributing to KK Group’s commercial success and strategic alignment with sustainable energy solutions. René has led the integration of the vestas converters & controls business acquisition.
Thomas R. Olsen, Chief Operations Officer
Thomas R. Olsen joined KK Group in 2016 and has served as COO since 2017. He brings significant experience in global supply chain management, operations management, global procurement and operational excellence, having previously held various positions within organisations such as MAN B&W, Flextronics, and Johnson Controls.
Kenneth Svinth, President, Cooling
Kenneth Svinth joined KK Group as CCO in 2019, bringing extensive experience from the energy sector, including roles at Siemens Wind Power. In his role, he aligns commercial strategies with sustainable practices, reinforcing our commitment to long-term value creation in green energy solutions. Kenneth is also responsible for the recently acquired cooling solutions business.
Mads Wackes Sckerl, President, Monitoring & Service
Mads Sckerl joined KK Group in September 2024 to lead the Monitoring business and brings a strong commercial and strategic focus from companies such as Kamstrup, Grundfos, and Senmatic. Since joining the company, Mads has led the successful integration of Gram & Juhl and PCH Engineering and is now focused on driving commercial growth within Monitoring & Service, positioning the company as a global market leader in aftermarket solutions.
Johnny Nymann Stephansen, Chief Technology Officer
Johnny Nymann Stephansen joined KK Group in 2021 and was appointed CTO in 2023. With over 25 years of experience in the wind industry, including various senior leadership roles at vestas within Service and R&D, he oversees KK Group’s Global R&D and product offerings, ensuring that our technology portfolio delivers competitive and sustainable energy solutions to our customers.
Executive Board
Group Functions
Division Heads
People Powering Change
Our 3,700 colleagues are our most important assets. Throughout this report, selected colleagues from across the company share how they are bringing our new strategy, Powering Change, to life in their daily work.
Irina Stroe joined KK Group in 2019 following the completion of a master’s degree in wind power systems and a PhD focused on battery performance and lifetime degradation of lithium based batteries.
Today, Irina works as a Senior Lead within the Energy Storage Systems area of Global Technology, where she is involved in all projects that include battery systems. Backup batteries systems in the wind industry are for essential for ensuring the ongoing safety and control of critical functions during grid outages or scheduled maintenance.
Irina’s role spans supporting new projects, maintaining existing battery and backup systems, and collaborating closely with customers, suppliers, and internal teams on technical, quality, and performance related topics.
A central part of Irina’s work is across disciplines to ensure high flexibility, modularity, and reliability, while also keeping a close eye on technology roadmaps and developments in battery chemistry. Her work helps ensure that we continue to deliver safe, robust, and future ready energy storage solutions.
For Irina, Powering Change is about making informed technical choices that create real impact. It means understanding the market, selecting the right technologies, and continuously improving products so they offer clear advantages for customers, both today and in the years ahead.
“In my work, Powering Change means leveraging the best research and technology to develop better solutions that continue to add value for our customers.”
Irina Stroe
Senior Lead - Energy Storage Systems, Global Technology

Sustainability

Sustainability Programme
KK Group’s Sustainability Programme, which strengthens the integration of sustainability within our broader business strategy is built upon our risk and opportunity mapping.
The Sustainability Programme takes its starting point in our business strategy –Powering Change towards a more sustainable tomorrow – and provides strategic direction for internal as well as external stakeholders. The programme is split into three transformational areas where individual Executive Leadership Team (ELT) members are accountable for actions essential to the sustainable business transformation of KK Group.
During 2025, we made significant progress in converting risks and opportunities into longterm sustainability targets for 2035.
Our new targets were designed not only to benefit the environment but also people and our integrity to reinforce our reputation as a responsible employer and trusted company and business partner.
Smart for the planet
Towards a more sustainable tomorrow Care for people Integrity in action
Innovating to reduce our climate impact
Empowering lives through safety, wellbeing, and respect
Being transparent and consistent on what is ethically right
By 2035
• 63% reduction of Scope 1 & 2 emissions
• 38% reduction of Scope 3 emissions
• 80% of sales is smart products*
By 2035
• 50% of senior management based outside of Denmark
• 40% females in senior management
• 100% of key suppliers providing decent work conditions to their employees
By 2035
• 80 in Image Score
• 100% dual sourcing on critical suppliers
• Build stronger systems and capabilities
• Improve product portfolio, operations and supply chain
• Drive pilot projects with customers
• Build partnerships to simplify
• Understand adverse impacts in our operation, supply chains and business relations
• Act on necessary change
• Build partnerships to scale
• Understand what builds trust and how it supports business
• Setup for the national security focus to be top and center
• Improve training of staff to build winning capabilities
• Build partnerships to win
Smart for the Planet
We strive to align our customer value proposition with product benefits that speak directly to customers’ sustainability painpoints, aiming to facilitate low-carbon and circular design through innovation.
This is driven by customer “lighthouse” projects and supplier integration. The new targets within this area are linked to sales of smarter products and our near-term 2035 Science Based Targets, which were validated and approved by the Science Based Targets Initiative in October 2025. Actions are governed by our Environmental Policy.
In 2025, we introduced a new Group Environmental Policy and an updated People Code of Conduct to guide our journey towards better understanding and improving our environmental and social impact. The policies state that compliance with ISO 14001 around environmental management is a key starting point for minimising our environmental impact when delivering high quality products that support the green transition.
Climate
Our technologies are critical components that enable the widespread adoption of wind power to decarbonise energy grids worldwide, thereby avoiding CO2e emissions compared to conventional energy generation.
In 2025 alone, our power converters and control systems, which are at the heart of each wind turbine, have enabled 18 GW of
new wind power capacity. During our 45-year history, these systems have contributed to more than 183 GW of installed wind power. Assuming a capacity factor of 35%, they helped generate 560 TWh of renewable energy during 2025.
In this way, we helped avoid 540 million tonnes of CO2e emissions in 20251, assuming most of our installations replace coal-powered electricity. This equals the yearly emissions of around 160 million EU households².
To achieve our commitments, we are taking concrete steps to decarbonise our own activities, including transitioning our vehicle fleet to hybrid and electric models and in-progress initiatives for on-site renewable energy generation, such as onsite solar power at our factory in India.
At the same time, we drive reductions across our value chain by optimising product design for lower carbon intensity, strengthening collaboration with suppliers, and advancing more sustainable logistics solutions.
In 2025, we have calculated our full climate impact to 399,410 tonnes of CO2e which is an overall reduction in our GHG emissions of 4% compared to the previous year.
The reduction is manly linked to a lower weight of products purchased and our. Emission intensity reduced from 54 in 2024 to 50 tonnes of CO2e per million DKK of turnover in 2025.
Also, in 2025, the electricity consumed in our operations has been from renewable sources only.
Climate uncertainty
When it comes to climate adaptation, the uncertainty of climate change can expose us to physical risks – chronic as well as acute. As climate change intensifies, the likelihood of supply chain uncertainties or constraints is set to increase: from lack of raw materials to delayed product delivery.
Smart for the Planet
(continued)
Supply chain mapping and risk assessments will be key in developing a focused dialogue regarding consistency planning with suppliers, who are at risk of adverse nature phenomena, such as flooding, extreme lightning or tornados.
Validated near-term Science Based Targets
This year, we reached another big milestone on its sustainability journey by committing to absolute GHG emission reductions by 2035 from a 2024 baseline:
• 63 % reduction in direct emissions from operations.
• 38 % reduction in emissions across its global value chain, covering purchased goods and services, logistics and distribution, as well as business travel.
With the approval of our near-term greenhouse gas emission reduction targets by the Science Based Targets Initiative, we have committed to absolute targets ensuring that emissions must decrease in real terms, regardless of business growth. This approach requires significant decoupling of operational and value chain expansion from climate impact.
Our emissions reduction approach extends beyond our own operations to include employees, customers and suppliers, ensuring that meaningful reductions are achieved across the value chain.
Circular Economy
The circular economy is about transforming how resources are used, moving away from the wasteful “take-make-waste” model, and seeing waste as not just trash but as a valuable resource.
Refurbishment and reuse are big business in wind
While we continuously work towards better predicting wind turbine service needs, unplanned maintenance still drives urgent replacement demand. Refurbishing expensive components after quick replacements can reduce capital tied up in inventory while contributing towards a more circular economy. Among others, our refurbish capacity have been expanded at our site in Hammel, Denmark. We welcome discussions with customers and suppliers to enable more sustainable service and maintenance practices in the wind industry.
Our material use
For many years, we have focused on securing production waste to be re-purposed. As a result of this, 90% of our waste has been recycled in 2025. Having achieved a high recycling percentage of own production waste, the next step is to investigate the design of our products and learn how we become better at designing for the service market and circularity.
Recognition of our sustainability progress
This year we were proud to be awarded the EcoVadis Gold Medal, in reconnection of our progress on sustainability. The medal was awarded as part of EcoVadis assessment of our environment, labour and human rights, ethics, and sustainable procurement practices.
EcoVadis is a leading global provider of standardised, evidencebased methodology for sustainability ratings. The Gold Medal is awarded to the top 5% best performing companies evaluated the last 12 months.

Greenhouse gas emissions across our value chain
Care for People
People are the centre of our success and providing decent work throughout our supply chain is key to keeping motivation high for continued delivery of innovative and high-quality products.
An increase of female representation as well as globalisation in our senior leadership* have been identified as 2035-targets for this area. Furthermore, all key suppliers must document that they provide decent work and care for people, securing that they are highly motivated to deliver their best.
Our Human Rights and Health, Safety, and Wellbeing Policies guide our actions and overall expectations of employee behaviour in our organisation. In 2025, we introduced a new Human Rights policy to further enhance our commitment in this area. Company-wide Human Rights training began in early 2026 to help employees learn how to address potential misconduct or policy violations.
Human Rights
As a signatory of the UN Global Compact’s 10 principles since 2010, we continue to promote and support human and labour rights in our own organisation, as well as among our customers and our business partners.
Improving our due diligence is about constantly creating a better overview of salient human rights issues and deep diving into the high-risk areas for learning more on how to take a shared responsibility for driving actions of improvement.
As a starting point for our improved focus on human rights, we have conducted a human rights impact assessment by utilising the best guides and benchmarks available in the wind industry.
Some of our mapped salient human rights are:
• Responsible mineral sourcing
• Labor rights (including protection against forced labour)
• Right to a Healthy and Clean Environment
• Transparency and Anti-Corruption
• Diversity, Equality and Inclusion
Safety first
The safety of our employees is our number one priority. We are certified according to the standards of ISO 45001:2018 Occupational health and safety management systems. This demonstrates our dedication to constantly applying and enhancing how we handle health and safety.
Our commitment to safety first has seen positive developments across several areas in 2025. We ensure that every employee has the knowledge, skills, and confidence needed to work safely and to recognise potential risks to themselves and to others. Given the potentially serious health and safety risks associated with machinery and electrical systems, it remains essential that we maintain a high level of vigilance in all our activities.

Care for People
(continued)
Employees participate in regular safety trainings and refresher programmes, both online and onsite. In 2025, 74% of all employees received Safety Awareness training, that supports our safety culture, 87% completed CPR and AED training ensuring lifesaving skills. 64% of managers participated in Safety Walk training to lead by example.
Our Safety Walk concept continues to create and sustain a strong safety culture by providing a proactive open forum for one or more employees to discuss Health, Safety and Wellbeing. In 2025, we completed 2,920 walks up from 2,390 walks in 2024.
In 2025, we made significant progress on the Total Recordable Incidents Rate (TRIR) and Lost Time Injury Frequency Rate (LTIFR). Over the past three years, they have improved from 7.94 and 2.89 in 2021 to 1.70 and 0.77 in 2025, respectively.
In 2025, TRIR continued to improve compared to the previous year 1.70 (2024: 3.68), as our already low LTIFR further improved to 0.77 (2024: 1.68). Thereby, the targets for TRIR and LTIFR of 3.7 and 1.4 for 2025, respectively, have been met. Health and safety will remain a top priority in 2026. The absence ratio linked to sickness among our blue-collar and white collar employees remained within acceptable levels of 4.4% and 1.5% (2024: 4.5% and 1.5%), respectively.
Employee Engagement Survey
Every year, we conduct an Employee Engagement Survey. Employees with a tenure of three months or more participate in the survey, which is anonymous and conducted by an independent third party.
In 2025, an impressive 97% of eligible employees completed the survey, providing a solid foundation for identifying focus areas that sustain our strengths and highlight opportunities for improvement within our culture.
The employee engagement score reached 74, a small decline compared to last year. Given the changes seen in our organisation, this is a strong indication of our employees’ engagement in the ongoing development of our company culture.
Each manager conducts follow-up meetings with their teams to share results, discuss insights, and gather additional feedback. Together, managers and their teams create a targeted action plan, which is reviewed on a quarterly basis to track progress.
Learning and development
To reinforce our strategic workforce planning, we proactively develop future competencies through a comprehensive talent identification and development process.
To support personal development, our ‘60% Ready’ rule means that people who are considered 60% ready for the next step in their KK Group career are included in overall evaluations for upcoming opportunities.
Our review process
During 2025, 92% of our employees took part in the yearly development review and dialogue process between managers and employees.
Our People Review process includes evaluating critical positions and succession planning to ensure continuity in our leadership. We are reactivating our Leadership Programme to develop future leaders and enhance our current managers’ competencies.
Care for People
(continued)
BLUME support
KK Group now offers all Danish employees access to BLUME Support – a professional and anonymous well-being programme that provides early support for personal or work-related challenges. The goal is to boost energy and improve well-being for everyone and, by extension, for the full organisation.
All Danish employees may contact BLUME Support completely anonymously if they need help. In addition, managers, the People organisation, or union representatives can suggest a support process if they notice signs of low well-being in an employee – but only after speaking with the individual first. The support programs are tailored to the individual’s needs and can be started as soon as the first signs of challenges appear. The aim is to act early, before problems grow bigger.
Gender diversity
In 2025, the Board of Directors continues to be meeting our criteria for diverse gender composition by having a 40% female representation in a Board of Directors of five excluding the employee representation that is not counted in for this evaluation. As the ambition for gender representation for the Board of Directors is achieved, no further targets were set. A target of 40% female representation for Senior Management by 2035 has been added in the new line of targets.
Workers in the Value Chain
A high priority in our Sustainability Programme is to understand our value chain better in terms of environmental and social impacts.
While we will continue securing supplier agreements on our updated Supplier Code of Conduct, we focus more of our effort to secure detailed knowledge on the full supply chain of the products that we source to gain more insights on environmental and social risks.
Climate risk and salient human rights set the foundation for finding ways to act on securing improvements where opportunities are best.
Our long-standing supplier audit program will continue and we encourage the wind industry to create a platform for sharing audits and audit criteria, as this is seen as a part of the industrialisation of delivering components into the wind industry.
Conflict minerals
Minerals such as tin, tantalum, tungsten, and gold (3TGs) have been linked to human rights abuses, corruption, the financing of armed groups or similar negative effects in the Democratic Republic of Congo and its neighbouring countries (DRC region) and other high-risk areas. We engage with suppliers in sourcing categories likely to contain conflict minerals to avoid in its products the use of raw materials which originate from conflictaffected and high-risk areas. This engagement happens yearly though a third-party supply chain data management platform that is encouraging non-conformant smelters to engage with the Responsible Minerals Assurance Process (RMAP) the flagship program of the Responsible Minerals Initiative (RMI).
Integrity in Action
Building trust with our stakeholders is key in the drive for growth set out in our business strategy. Integrity, which is the foundation for building trust, is being challenged by a constantly changing geopolitical environment. This is why we have prioritised the roll-out of our new policy framework, which facilitates employees’ understanding of expected conduct informed by our winning behaviors.
Corporate culture is a fundamental pillar in ensuring good business conduct and fostering sustainable growth. It fosters our position as a trusted partner in the green transition and is supported by various policies and principles designed to prevent anti-competitive behavior.
Code of Conduct
All new employees are required to sign the People Code of Conduct to confirm that they are aware of and will adhere to its contents before starting their employment.
All direct suppliers are required to sign the Supplier Code of Conduct, which is included as an appendix to their contract and/ or have their own equivalent Code of Conduct implemented in their management system. Overall, more than 90% of KK Group’s direct spend is with suppliers who have signed our Supplier Code of Conduct. In 2025, the rollout of the updated People and Supplier Code of Conduct started. Both documents may be found at our website.
Suppliers are subject to combined quality and sustainability audits to verify compliance. In 2025, we conducted 17 supplier audits, covering 90% of our direct spend. The audits resulted
in planned corrective actions with some of these suppliers, and one supplier being rejected.
Potential non-compliance with our People Code of Conduct can be reported through our whistleblowing system described below.
Whistleblowing Policy
Our Whistleblowing Policy allows employees and external partners to report violations. Reported incidents are anonymous by default unless local legislation prohibits anonymous reports. Access to the whistleblowing system is publicly available on KK Group’s website.
We have a standard operating procedure to ensure that reported incidents are promptly, independently, and objectively processed. Each reported case is investigated by an independent panel of three individuals, consisting of the GVP of Legal, the VP of People Operations & Business Partnering, and the GVP of Finance Reporting and Compliance. If a reported incident involves one of these three individuals, the remaining two individuals will exclusively investigate it. If an incident involves the Executive Board, the Board of Directors will investigate it.
The Whistleblowing Policy does not tolerate retaliation or vengeful action taken against an employee who reported an incident. A summary of reported cases and investigation results is presented to the audit committee, which oversees and assesses the effectiveness of the implementation of the Whistleblower Policy. In 2025, 6 cases were reported in the group Whistleblower platform.
In the beginning of 2026, internal training sessions in business ethics and human rights were rolled out.
Cybersecurity
At KK Group, safeguarding proprietary intellectual property, customer data, and other sensitive information is paramount, reflected in our strong emphasis on robust cybersecurity practices.
Cyber Security Progress and Initiatives in 2025
Over the past year, we have made significant strides in enhancing our cyber security posture. Our primary focus has been initiating the journey toward NIS2 compliance, a critical undertaking that underscores our dedication to safeguarding company data, information, and infrastructure.
This work is not only vital for protecting our assets but also for maintaining our competitive edge in the marketplace, especially when compared to other organisations offering similar services.
We monitor our NIS2 compliance on an ongoing basis and when identifying opportunities for improvement, we are implementing systems and processes to support continuous compliance.
A global increase in cyber crime
With increasing global attention on the security of critical infrastructure, KK Group recognises that we are a potential target for cyber attacks. In response, we have continued to prioritise security measures, as well as performed thorough evaluation of our Operational Technology (OT) environments.
This proactive approach ensures that our most critical systems are protected, minimises risk, and demonstrates our commitment to resilience and reliability for our clients and partners.
As we continue this important work, KK Group has a clear goal of conducting regular assessments on key systems and services, to ensure ongoing improvement, vigilance, and collaboration across our teams.
By investing in robust cybersecurity we are not only protecting our organisation, but also strengthening our position as a trustworthy and forward-thinking leader in our industry.
Consolidated Sustainability Statement
Sustainability Statement
Consolidated Sustainability Statement
General Information
Energy Consumption
GHG Emissions
Waste
Employees
Health and Safety
Governance

Consolidated Sustainability Statement

Consolidated Sustainability Statement
Note 1 – General Information
Basis of preparation
The consolidated sustainability statement for the period from 1 January to 31 December, 2025 comprise consolidated data from the parent company (KK Group Holdings A/S) and entities controlled by KK Group. The same principles as in the financial statements are applied in the consolidation except for where specified in the accounting policy. The consolidated sustainability statement and the accompanying notes are prepared based on the accounting principles described in the notes.
Newly established and acquired companies are included at the date of acquisition, and companies are excluded from the reporting at the date of disposal.
Changes in accounting policies and disclosures
The sustainability accounting principles set out in the notes have been applied consistently in the preparation of the consolidated sustainability statement for all the years presented, unless stated otherwise.
Key accounting estimates and judgements
We use assessments and estimates for the reporting of certain data points (e.g. scope 3 emissions). We regularly reassess our use of estimates and judgements based on experience, the data available and other factors.
Changes in estimates are recognised in the period. Details on the relevant key estimates, judgements, and assumptions applied are mentioned in the accounting principles of the specific topics.
External review
We have obtained our second limited assurance report for a selection of the data reported in 2025.
Sustainability governance
Further details regarding the role of the administrative, management, and supervisory bodies, including information provided to and sustainability matters addressed by them are presented in the Governance section of this report.
DMA
We conducted our initial DMA and included further details regarding the materiality assessment process as part of the Double Materiality Assessment subsection of this report.
Note 2 – Energy Consumption
Accounting principles
Energy consumption
We report the total fossil and renewable energy consumption disaggregated by energy type for the reporting period in megawatt hours (MWh). The consumption is based on monthly reported consumption data with links to invoices. All locations have been included in the reporting. The energy intensity is based on net turnover reconciled with the financial statements. For the remaining locations where no consumption data are available, average consumption values per m2 have been applied to estimate energy consumption.
Energy intensity ratio
Energy intensity ratio represents total energy consumption in MWh divided by total revenue in kDKK.
Notes
KK Group’s revenue is included in the statistical Nomenclature of economic Activities in the European Community (NACE) section C and therefore, in relation to this reporting, seen as a high climate impact sector.
KK group did not consume energy from nuclear sources in 2025 or 2024.
Note 3 – GHG emissions
Accounting principles
GHG emissions
We report the total GHG emissions in metric tonnes and with reference to the Greenhouse Gas Protocol, calculated based on both the location-based and the market-based approach. The consolidation of GHG emissions follows the operational control approach.
Gross scope 1 and 2 emissions are reported based on the monthly energy reporting converted into tonnes CO2e according to the Greenhouse Gas Protocol. Calculations of GHG emissions are based on emission factors from invoices from energy suppliers. Otherwise, the most recent available emission factors from IEA are applied. All GHG emissions are converted to CO2e equivalents (CO2e).
Primary data on scope 1 and 2 GHG emissions constitutes the largest proportion of the data collected. This includes data from digital and manual meter readings and consumption data from invoices. For the remaining locations where no consumption and emissions data are available, average consumption values per m2 have been applied to estimate energy consumption and GHG emissions.
Scope 1 GHG emissions
Scope 1 GHG emissions include direct emissions from combustion of gas and oil, refrigerants, and mileage in the Group owned or controlled vehicles. Emissions factors used are the most recent available DEFRA or IEA factors
Scope 1 GHG emissions from regulated emission trading schemes
Represent emission allowances under European Union Emission Trading Scheme (EU ETS).
Scope 2 GHG emissions (market-based and location-based)
Scope 2 GHG emissions include indirect emissions from purchased heating and electricity. For market based emissions, market-based emissions factors were applied, which implies that power purchase agreements (PPAs) of green energy and other renewable sourcing of energy influences the calculation. For location based emissions, location-based emissions factors from IEA for 2023 have been applied.
Scope 3 GHG emissions
A comprehensive Scope 3 GHG inventory has been completed in accordance with the Greenhouse Gas Protocol Corporate Value Chain (Scope 3) Standard. We have selected the following priority Scope 3 categories (C) – C1, C4, C6, and C9 – which collectively represent over 90% of our total Scope 3 emissions. This approach aligns with the emissions coverage requirements set forth by the SBTi.
Priority categories
C1 Purchased goods and services: Accounts for GHG emissions from direct and indirect purchases. Direct purchases calculation is based on the weight of our different purchase categories. Indirect purchases calculation is based on monetary spend value.
C4 Upstream transportation and distribution: Accounts for GHG emissions from intercompany, supplier, and customer flows paid for by KK Group. The calculation is based on weight, distances and transport modes from supplier and transport system reports, where available, and direct spend reports for the remainder.
C6 Business travel: The calculation is based on the business travel booking system, corporate credit card reports and indirect spend reports combined with extrapolation, where necessary. Emissions are based on UK BEIS with RF and with WTT kg CO2e.
C9 Downstream transportation and distribution: Accounts for GHG emissions from transportation of our products after the point of sale that are not paid for by KK Group. The calculation is based on weight, distances and transport modes from supplier and transport system reports.
Note 3 – GHG emissions
(continued)
Change of accounting principles for priority categories
(as
The accounting principles for the four priority categories have all been updated due to improved methodology eliminating the need for less precise extrapolation. The overall change results in a 10% reduction. GHG emissions intensity ratio GHG emissions intensity ratio represents total Scope 1+2+3 market or location-based emissions in CO2e tonnes divided by total revenue in kDKK.
*In 2024, and 2025 we reported the top 90% of our GHG inventory according to SBTi.
Notes
The Gross GHG Scope 3 emissions were updated from the previously reported number in our 2024 Annual Report of 456,486 Tonnes to 410,269 Tonnes due to data availability, quality and calculation methodology improvements.
Note 4 – Waste
Accounting principles
Waste
We report the total amount of solid waste in tonnes, split by hazardous waste and non-hazardous waste, as reported internally on a monthly basis based on invoices from the external waste handlers for all locations except for offices with less than 50 employees.
Hazardous waste includes batteries, chemicals, combustion waste, electronic waste, mixed hazardous packaging, as well as solvents and detergents. Non-hazardous waste includes bio waste, metals mix, non-hazardous packaging, paper, plastic, and wood.
The waste is reported on recovery operation types. Waste treatment types according to the standard and the total amount and percentage of non-recycled waste are reported as well.
Recovered in other ways is Anaerobic digestion and Biowaste treatment by composting.
Waste
Total
Notes
The decrease in our total waste generated is due to lower volumes in production. This resulted in a stable, low total percentage of not recovered waste, that is now at a level of 10%.
Note 5 – Employees
Number of employees - Headcount at year-end
Accounting principles
Number of employees
We report employee characteristics, including total number of employees by head count at the end of the reporting period broken down by gender, countries of operations with more than 50 employees, employment type and age.
Employee turnover
We report the total number of employees who have left KK Group during the reporting period. This number includes all employees and is calculated based on the total number of retirements, voluntary or involuntary resginations, etc.
Employee turnover rate
We report the total rate of employee turnover rate based on the total employee turnover divided by the average number of employees on the payroll during the year.
Share of underrepresented gender in Senior Management
We report the share of underrepresented gender in senior management based on headcount at the end of the reporting period. Senior management is defined as the Executive Management Team and their direct reports, where these reports manage reports in the same legal entity.
Number of employees by employment type
Number and % of employees by age
Notes
The number of employees at the year-end of 2025 was at level with 2024. This reflects the integration of the acquisition, offset by selective hiring aligned with business expansion needs.
Note 6 – Health and safety
Accounting principles
Employees covered by Health and Safety management systems
Calculated as % of all employees covered by Health and Safety management systems in the company.
Fatalities linked to work related injuries or ill health
According to ESRS S1-14, we report the number of work related fatalities in our own workforce and workers working on the Group sites. The numbers reported are based on fatalities reported via the health and safety management system during the reporting period.
Total Recordable Injuries “TRI”
We report the total recordable work-related injuries, which include fatalities, lost time injuries, medical treatment injuries, and restricted workday injuries, with one or more days of absence in our own workforce. The numbers reported are based on number of incidents reported via the health and safety management system during the reporting period.
Total Recordable Incident Rate “TRIR”
We report the rate of TRI per million working hours. The working hours are calculated based on own workforce hours registered in the system or standard working hours excluding holidays, sick leave, maternity leave, etc. The calculation method differs based on the information available in the system used for each country.
Lost Time Injury Frequency Rate “LTIFR”
LTIFR is the sum of fatalities and lost time cases that have caused at least one day of absence per million working hours.
Total number of recordable work-related ill health
We report the number of recordable work-related illnesses according to the International Labour Organization (ILO) list of Occupational Diseases. The numbers reported are based on illnesses reported via the health and safety management system during the reporting period.
Notes
The total recordable injuries (TRI) previously reported in our Annual Report for 2024 was updated from 23 to 24, as the number previously reported were missing one TRI case which was not registered in the 2024 statistics. Consequently, the 2024 reported total recordable incident rate (TRIR) was updated from 3.51 to 3.68.
Note 7 – Governance
Accounting principles
Share of underrepresented gender in Board of Directors
We report the share of underrepresented gender on our Board of Directors defined as the Board of Directors for KK-Group A/S (CVR: 66 82 11 10) at the end of the reporting period. Information has been sourced from the Central Business Register (CVR) and employee-elected members have been excluded from the calculation.
Incidents of corruption or bribery
We report the number of incidents of corruption or bribery discovered by our legal department in the reporting period. Incidents are counted when they lead to dismissal or discipline of own workers or when they relate to terminating/ not renewing contracts with business partners due to violations related to corruption or bribery.
Number of convictions related to anti-corruption and anti-bribery laws
We report the number of convictions related to anticorruption and anti-bribery laws in the reporting period.
Amount of fines related to anti-corruption and anti-bribery laws
We report the amount of fines in kDKK from convictions related to anti-corruption and anti-bribery laws in the reporting period.

CONCENTRIC
Concentric’s sustainability report for 2025 is enclosed on the next pages.
Combining technology and innovation to create a sustainable future
Sustainability Report 2025


Message from the CEO
Concentric is a business built on close support of our trusted partners. By fostering long term relationships grounded in integrity and mutual respect, we continue to create value not only for our business, but for the communities and environments we engage with. Together, we are working toward a future where resilience and responsibility go hand in hand.
In late 2025, I had the privilege of joining Concentric, and in just a short time, I’ve seen firsthand the strength of our people and the depth of our expertise. What impressed me most is the pride and passion that runs throughout this business. It’s clear that sustainability isn’t just a program here, it’s a shared commitment that shapes how we operate and how we serve our customers.
My aspiration as CEO is simple yet ambitious, to build on this strong foundation and drive Concentric forward with purpose. That means continuing to innovate, deepening collaboration across our teams and partners, and ensuring that every improvement, big or small, moves us closer to a more sustainable future.
This year, we’ve already made meaningful progress through energy efficiency programs, installation of solar panels, listening to our employees through culture surveys, and supporting our customers in their energy transitions.
These achievements don’t happen overnight, they are the result of continuous improvements and the dedication of people across every site and function. Sustainability is a journey, and every step matters.
Looking ahead, we know the challenges are significant, driving energy reductions in our operations, engaging with our supply chain in more depth, and cutting emissions. These aren’t tasks for one team or one leader, they require all of us. Every idea, every action, every improvement counts. When everyone gets involved, we create momentum that transforms not just our business, but the industry we serve.
Understanding market dynamics
As we move into 2026, we look forward to maintaining strong support for the hydraulic and mechanical pump markets, both of which continue to trend toward greater efficiency, reliability, and digital integration across applications. Meanwhile, the sustained growth of electric and hybrid powertrain markets offers us expanding opportunities to strengthen our influence and demonstrate our expertise across the mobility and commercial vehicle segments.
Implications for our business
For Concentric, these market developments present both opportunities and challenges. While we continue to see steady demand in our core segments, competitive pressures and evolving customer expectations mean we must remain focused on innovation, driving us to deliver smarter, more sustainable products while maintaining cost-effectiveness.
Our ability to leverage these trends through the year and beyond will directly impact sales performance. Through engagement with our customers and understanding their requirements we can strengthen our market position and help our customers navigate their own energy transitions.
On a personal note, joining Concentric has reinforced my belief that collaboration and innovation are the keys to progress. I see a company with deep expertise, strong values, and a willingness to tackle tough problems head on. My commitment is to empower our teams and partners to achieve even more together.
Thank you for your hard work, creativity, and dedication. Let’s keep moving forward, step by step, together.
Joshua Meyer CEO
On a personal note, joining Concentric has reinforced my belief that collaboration and innovation are the keys to progress. I see a company with deep expertise, strong values, and a willingness to tackle tough problems head-on.
Business highlights
Our key business highlights provide a snapshot of our yearly performance, offering a clear picture of how the business has evolved over the reporting period and demonstrate our overall resilience, efficiency, and long-term value creation.
Products manufactured >10,000,000
$408m Revenue >1,500 MWh Renewable energy usage
1,432 Number of employees
Number of countries operating in >75% Employee engagement in culture survey >100 Years experience in our strategic markets
8

Our history
The history of the Concentric Group began in 1920, with a three-man partnership who founded Concentric Manufacturing Company Limited in Aston, Birmingham (England).

Over the next century, Concentric has made great strides in developing state-of-the-art products for major OEMs. During this time the business acquired a range of companies across Germany, the US and more recently Italy, cementing it’s position as a leader in the market and offer an improved range of services to our global customer base.
2025 marked a significant year for our business as we fully integrated into the structure of A.P. Møller Group and acquired O.M.P., a leading manufacturer of advanced oil pumps and fluid management components, headquartered in Funo, Italy.


Concentric Group acquires
O.M.P.
Officine Mazzocco
Pagnoni Srl
Our business
Concentric is one of the world’s leading pump, fan and thermal management solution manufacturers. Our product offering includes oil pumps, water pumps, fuel pumps, fans, thermal management solutions and hydraulic systems. We develop innovative technologies which are tailored to the needs of our customers.
Our range includes advanced electric pump and fan products which are helping to drive electrification across our markets. Through our technical solutions and precision engineering we increase fuel economy, reduce emissions and improve engine control.
About us
Over the past 100 years, Concentric has engineered highquality, robust products for major OEMs and Tier 1 engine manufacturers. By focusing on our core ethos of Technology, Innovation and Sustainability we have become a global leader across all our primary end-markets, providing solutions in which Concentric can add value to our customer’s products.
Across the group we have state of the art manufacturing for electric pumps and fans, positioning us strongly in the transition to electrification. Our machining and assembly operations leverage advanced manufacturing techniques and modern technologies to deliver value to our customers. And our engineers around the world work closely with our customers to develop solutions which meet their exact requirements.
Our growing electric products, include Concentric and EMP branded coolant and oil pumps, and EMP branded minihybrid cooling systems, fans and thermal management solutions. Our state-of-the-art hydraulic products, include gear pumps, power packs, Allied branded transmission pumps, internal gear pumps and an ever-growing range of Electrohydraulic Steering pumps.
Over the past two years we have made key acquisitions to add to our capabilities, in 2024 G.O. Engineering joined us, bringing competency in hardware and software design combined with PCBA manufacturing. Our most recent acquisition in 2025 of O.M.P. has brought with it their diverse portfolio of water pumps, oil pumps, vacuum pumps, and tandem pumps, all essential for optimizing engine and transmission system thermal management and lubrication.
Our strengths
Concentric’s strengths include our global presence, from where our 1,432 employees support our customers locally. Our well-established brands, boast over 100 years’ experience in our strategic markets.
Our services
We work in partnership with our customers to design, develop, manufacture and sell, high quality, customerfocused solutions. Our business model is to supply technology and innovation throughout our customers’ product life cycle.

Concentric’s vision is to deliver sustainable growth for every application in the markets they serve.
Mission
Concentric’s mission is to design, develop, manufacture and sell high quality, customer-focused solutions for engine and hydraulic applications within its global end-markets.
Where we operate
Global footprint
Concentric’s global manufacturing presence includes factories in Sweden, Germany, UK, North America, India, Italy and China, backed by central support and development functions from its headquarters in Redditch, UK. Our far-reaching global footprint enables the group to sell locally to our global customers.
Global perspective, local presence
We maintain a global perspective with a local presence. In partnership with our stakeholders, this enables shorter lead times, local adaptations, economies of scale, faster innovation and a reduced impact on the planet.
North America
• Escanaba, Michigan, USA
Manufacturing, R&D, Sales
• Greenfield, Indiana, USA
Manufacturing, Sales
• Muncie, Indiana, USA
Manufacturing, Sales
• Rockford, Illinois, USA
Manufacturing, R&D, Sales
Europe
• Birmingham, UK Manufacturing, R&D, Sales, Group functions
• Bühl, Germany Manufacturing, R&D, Sales
• Hof, Germany Manufacturing, R&D, Sales
• Landskrona, Sweden Alfdex, JV with Alfa Laval
• Markdorf, Germany Manufacturing, R&D, Sales
• Monza, Italy Administration office
• Funo, Italy, Manufacturing; R&D, Sales
• Redditch, UK Headquarters
• Stockholm, Sweden Registered office
• Strasbourg, France Sales office
Asia
• Kunshan, China
Alfdex, JV with Alfa Laval
• Pune, India
Manufacturing, R&D, Sales
• Suzhou, China
Manufacturing, Sales
Stakeholders
Our stakeholder approach
Our sustainability stakeholder approach is a shared effort that depends on active engagement with all stakeholders customers, employees, suppliers, communities, and investors. Each plays a vital role in shaping and advancing our strategy. Customers drive innovation by seeking efficient, responsible solutions; employees bring expertise and commitment to implementing best practices; suppliers help us extend responsible resource use throughout the value chain; and communities and investors hold us accountable for creating long-term value.
How we generate engagement
By fostering open dialogue and collaboration, we ensure that our actions reflect stakeholder expectations and deliver meaningful impact. Working together we aim to build a more resilient, efficient, and responsible future.
Customers • Customer surveys
• Customer accreditation programs
• Technology roadshows
Suppliers
• Supplier days and workshops
• Factory inspections and on-site supplier audits
• Code of conduct for suppliers
• Overall customer satisfaction
• Product quality
• On time fulfillment of orders and continuity of supply
• Technology and innovation
• Product quality and warranty claims record
• On time fulfillment of orders and continuity of supply
• Technology and innovation
• Environmental program
• Health and Safety
Employees
• Employee surveys
• Personal development reviews
• Training and education
• Code of conduct for employees
Shareholder, analysts and financial institutions
The state and local community
• Regular perceptions studies
• Investor roadshows and seminars
• One-to-one meetings in person/by telephone
• Analysts presentation and capital markets days
• Recruitment and employer branding
• Ethics and values
• Skills development
• Succession planning
• Health and safety
• Remuneration
• Corporate update
• Ongoing dialogue with emissions legislators
• Participation in government initiatives
• Ongoing dialogues with local community representation
• Product development
• Energy efficiency and climate impact
• Involvement in the local community
• Environmental program
• Customer service and relationship
• PPM and warranty claims record
• Delivery (OTIF%)
• Product development to support changes in emissions legislation
• PPM and warranty claims record
• Delivery (OTIF%)
• Product Development
• Waste Management
• Human Rights
• Anti-corruption
• Risk Management
• Co-operation
• Company culture
• Environmental compliance
• Skills development
• Equal opportunity
• Health and Safety
• Reward and benefits
• Value drivers
• Product development
• Debt servicing capabilities
• Sustainability
• Human rights
• Anti-corruption
• Risk management
• Operating leverage
• Long-term financial strength of employer
• Social sustainability
• Climate and energy
• Environmental compliance
• Domestic supply chain
• Waste Management
• Human Rights
• Low carbon transition
• Sustainable product design
• Resource efficiency
• Supplier management
• Responsible sourcing
• Supplier management
• Responsible sourcing
• Ethics and value creation
• Resource efficiency
• Sustainable product design
• Employee Health and Safety
• Employee Value Proposition
• Ethics and value creation
• Equality and diversity
• Responsible sourcing
• Low carbon transition
• Employee Health and safety
• Ethics and value creation
• Supplier Management
• Resource efficiency
• Responsible sourcing
• Low carbon transition
• Supplier management
• Equality and diversity
• Resource efficiency
• Ethics and value creation
• Human Rights
Sustainability governance
Governance model
Concentric’s sustainability governance model has strengthened over many years, with the support of the sustainability committee and the oversight of the senior leadership team driving transparency and accountability throughout the business.The Board of Directors continues to have ultimate responsibility of sustainability within the business, setting the direction which is underpinned by the policies in place.
Sustainability committee
Our sustainability committee evolves with business and regulatory need, and to support the upcoming initiatives of our strategy focus areas we have opted to form a new tier of governance in the form of action groups. These action groups will dial in to our core strategy topics, and in managing these areas, becoming the first layer of governance within the business.
Multi-dimensional approach
As a group we recognize the need to embed sustainable practices across our operations. Whilst the action groups will work on global issues and produce high level guidance for the business, the business units will continue to embed sustainable practices in their daily work and engagement with suppliers and customers.
CEO Senior Leadership Team
Units
Concentric’s sustainability governance structure
BOARD
Group Management Sustainability Committee
Unit Leaders Action Groups
Materiality
Materiality and strategic alignment
Concentric has continuously monitored material topics since we began reporting on sustainability, ensuring that our strategy reflects the issues most relevant to our business and stakeholders. In response to the evolving regulatory landscape in the EU, particularly since 2023, we have adopted a double materiality approach. This means we assess not only how sustainability issues impact our financial performance (outside-in perspective) but also how our operations and products affect society and the environment (inside-out perspective).
The essence of double materiality
Double materiality recognizes that companies have a dual responsibility, to manage risks and opportunities that influence financial performance, and to understand the broader impacts their operations create for people and the planet. By conducting these assessments, we ensure our reporting and actions are focused where we have the greatest influence and accountability. This approach strengthens transparency, aligns with EU sustainability reporting standards, and helps us prioritize initiatives that deliver meaningful environmental and social outcomes alongside long-term business resilience.
Our approach
We will continue to update our materiality assessment in line with regulatory changes and whenever our business undergoes material changes, ensuring it remains relevant and robust. As part of this process, we actively engage with all our stakeholders and apply a risk and opportunity based approach to internal stakeholder engagement, ensuring that diverse perspectives inform our priorities and decision-making. The outcomes of this materiality process directly feed into our sustainability strategy and target setting, which will be announced in due course.
Horizon scanning
As a business, we understand how quickly requirements can change, and so to ensure our materiality assessment remains forward looking and resilient, we incorporate structured horizon scans into our process. By systematically monitoring emerging regulatory requirements, technological developments, market expectations and societal trends we can anticipate shifts that could influence our business model or stakeholder priorities. By incorporating horizon scanning into our methodology, we maintain a responsive approach to materiality.
Strategy
Our belief is that delivering exceptional performance starts with designing products that help our customers achieve more with less. As a trusted manufacturer our role is to provide solutions that maximize efficiency, reduce operational costs, and support the long-term reliability of critical systems.
Our approach centers on three priorities: engineering for efficiency, partnering with customers to meet their goals, and using resources responsibly. Every pump we produce is designed to optimize energy and water use, helping businesses lower their environmental impact while improving productivity. We work with customers to understand their challenges and deliver tailored solutions that drive measurable results. As markets shift and customer needs change we move with them.
We also recognize the importance of responsible operations. From sourcing materials to manufacturing processes, we strive to minimize waste and make smart use of resources, because efficiency isn’t just about performance, it’s about doing what’s right for the future. Through innovation and collaboration, we aim to provide pumps that not only meet today’s demands but also help our customers prepare for tomorrow. This strategy reflects commitment to practical, results-driven solutions that create value for our customers and our communities.
Electrification
As industries advance toward cleaner, more efficient operations, electrification is a key enabler of
decarbonization across on-highway and off-highway applications. Within our strategy, we continue to see electrification as an important pathway to help customers meet their performance and sustainability goals.
Our role is to design pump solutions that integrate seamlessly with electric and hybrid systems, ensuring reliability and efficiency in demanding environments. By engineering products that support these technologies, we help customers reduce emissions, comply with evolving regulations, and maintain operational excellence.
This commitment is not limited to product development, it’s about collaboration. We work closely with OEMs and industry partners to anticipate future needs and deliver solutions that make electrification practical and costeffective. We aim to empower customers to achieve their decarbonization objectives while continuing to benefit from the durability and performance they expect from Concentric and our group brands.
We are investing in advanced engineering to develop pumps optimized for electric and hybrid platforms, ensuring high efficiency, durability, and compatibility with emerging technologies. These solutions will help our customers meet stringent regulatory requirements, achieve their decarbonization targets, and maintain operational excellence in demanding environments.
By focusing on electrification, we are not only responding to market trends, we are shaping the future of fluid
management for sustainable mobility. Our commitment extends beyond product development to collaborative partnerships, where we work closely with OEMs and industry leaders to accelerate the adoption of clean technologies across transportation and industrial applications.
Innovating for a sustainable digital future
As global demand for digital infrastructure accelerates, data centers have emerged as critical hubs for connectivity and cloud services. These facilities require highly efficient cooling systems to maintain optimal performance and prevent overheating. For pump manufacturers, this represents a significant opportunity to deliver innovative solutions that balance reliability with sustainability. By leveraging advanced pump technologies designed for precision cooling, we can help data centers reduce energy consumption and water usage, two of the most pressing environmental challenges in this sector.
Expanding into cooling markets aligns with our business vision and modern data centers are increasingly adopting liquid cooling and closed-loop systems, which rely on pumps to circulate fluids effectively. By focusing on energy-efficient designs, variable speed drives, and materials that minimize lifecycle impacts, we can support customers in achieving their carbon reduction goals. This strategic move not only diversifies our portfolio but also positions us as a partner in enabling greener digital infrastructure, contributing to a low-carbon future.
Resource efficiency and circularity
Responsible resource management is central to our strategy. We understand that every material, component, and process contributes to the overall impact of our products. That’s why we focus on using resources efficiently, reducing waste, optimizing energy and water consumption, and selecting materials that balance performance with sustainability.
Our commitment extends beyond our own operations. We actively engage with our supply chain partners to promote responsible practices and continuous improvement. This includes collaborating on initiatives to minimize material waste, optimize logistics, and adopt technologies that reduce environmental impact. By working together, we create shared value and ensure that resource efficiency is embedded throughout the lifecycle of our products.
Through these efforts, we aim to deliver pumps that not only meet the highest standards of quality and reliability but also reflect our dedication to smart, responsible resource use. This approach helps our customers achieve their goals while supporting a more efficient and resilient industrial ecosystem.
Integrity and responsible governance
Operating within a global supply chain brings both opportunities and responsibilities. At Concentric, we are committed to conducting business with integrity and ensuring that our operations and partnerships uphold the highest ethical standards. Preventing corruption and bribery is a critical part of this commitment, not only to protect our reputation but also to safeguard the communities where we operate.
We maintain strict compliance with international antibribery and anti-corruption laws and require the same from our suppliers and partners. Our approach includes:
• Policies and training for employees and suppliers to ensure understanding of ethical expectations.
• Due diligence processes for new and existing suppliers to identify and mitigate risks.
• Transparent reporting channels that allow stakeholders to raise concerns without fear of retaliation.
By embedding these principles into our global operations, we aim to create a supply chain that is fair, transparent,
and respectful of local communities. This commitment strengthens trust with our customers and partners and supports sustainable growth across all markets.
Enabling a safe and inclusive workplace
Our people are at the heart of our long-term success We aim to foster a workplace where individuals feel respected, supported, and able to contribute meaningfully to our shared goals. By promoting wellbeing, inclusion, and open dialogue, we create an environment where everyone can thrive and deliver their best work.
We are investing in the skills and capabilities needed for the future, from electrification to digital transformation. Through targeted training, upskilling, and knowledge-sharing we equip our peop e to grow alongside our business and contribute to our strategic ambitions. Developing talent at every level strengthens our resi ience and supports sustainable long-term performance.
Safety is a non-negotiable foundation of our culture In our assembly and ight-manufacturing operations we are committed to preventing injuries through strong processes, visible leadership, and continuous improvement. We focus on creating a safe, healthy working environment where proactive hazard identification and shared accountability ensure every employee returns home safely.
Our safety culture is a central focus for both our sustainability ambitions and our overall business performance. A strong commitment to safety strengthens operational reliability, protects our people, and supports the ong-term resi ience of the company By placing safety at the core of how we work, we reinforce the values that underpin every aspect of our business.
Key priorities
• As data centers power the world’s digital transformation, Concentric’s liquid cooling solutions deliver the thermal performance needed to keep them operating cool and efficiently.
• Compact, quiet, and easy to integrate, each cooling pump delivers energy-saving performance and industry-leading reliability, giving operators efficient heat dissipation that is built to handle the power densities of the data centers of tomorrow.
• Concentric is able to offer customizable and modular pump platforms with 50,000+ hour lifetimes, rapid lead times and co-engineering support – so that the pump fits seamlessly into your cooling architecture and can scale with your needs.

Reporting structure
Adapting to regulatory changes
To prepare for our upcoming obligations under the Corporate Sustainability Reporting Directive (CSRD) in financial year 2027, we have strengthened the structure and clarity of our sustainability disclosures. We have adopted a more streamlined and standardized layout inspired by the updated European frameworks for concise, comparable reporting.
Building a strong foundation
In particular, we have drawn on the structural logic of both the European Sustainability Reporting Standards (ESRS) and Voluntary Sustainability Reporting Standard for Small and Medium-Sized Enterprises (VSME) to organize our disclosures in a clear, coherent and scalable way, as we prepare for full CSRD reporting. This is to ensure a smoother transition toward full CSRD compliance while maintaining proportionality for our current reporting obligations.
Positioning for future compliance
This phased approach allows us to embed best practices early, strengthen internal processes, and engage stakeholders effectively. It also ensures that our sustainability strategy and reporting remain aligned with regulatory expectations while delivering meaningful insights to our stakeholders. By taking proactive steps today, we are positioning Concentric for a smooth and successful transition to CSRD compliance in 2028.


Environmental information
Energy and climate
Energy and greenhouse gas (GHG) emissions
ENERGY CONSUMPTION
Monitoring energy consumption across sites
Effective energy consumption monitoring is essential for identifying efficiency opportunities and reducing environmental impact. By tracking usage at each site, we can pinpoint areas for improvement, optimize operational performance, and ensure compliance with sustainability targets. This proactive approach not only helps manage costs but also supports our long-term desire to reduce GHG emissions. Transparent reporting on energy data enables us to demonstrate progress and maintain accountability to stakeholders.
Harnessing solar power for a cleaner future
Our investment in renewable energy is demonstrated through the installation of solar panels across multiple sites. These systems significantly reduce reliance on grid electricity, cutting carbon emissions and lowering operational costs. Solar energy provides a consistent, clean power source that complements our broader sustainability strategy, helping us move toward energy independence and resilience. By integrating on-site renewable generation with robust monitoring, we are creating a model for sustainable operations that delivers both environmental and economic benefits.
Establishing our baseline and first year of reporting
This year marks an important milestone as we publish our first GHG emissions report. We adopted 2023 as our baseline year, providing a foundation for measuring progress and setting future reduction targets. Alongside this, we are reporting emissions for 2024 and 2025 to demonstrate transparency and track trends over time.
Establishing this baseline is critical for understanding our impact and identifying opportunities to reduce emissions across our operations.
Alignment with the Greenhouse Gas Protocol
Our reporting approach follows the internationally recognized Greenhouse Gas Protocol, ensuring consistency, accuracy, and comparability with global standards. By adhering to this framework, we have categorized emissions into Scope 1 (direct emissions from owned or controlled sources), Scope 2 (indirect emissions from purchased electricity), and Scope 3 (other indirect emissions across our value chain). This structured methodology provides clarity for stakeholders and reinforces our commitment to credible and responsible reporting. Further detail can be found in our accounting methodology within the appendices of this report.
Strengthening Category 1 emissions management
Category 1 (Purchased Goods and Services) represents a significant portion of our Scope 3 emissions and is therefore a critical focus area for our sustainability strategy. These emissions are directly linked to the materials and components we source, making collaboration with suppliers essential for meaningful impact. In 2026, we plan to enhance both the accuracy of our reporting and the sustainability performance of our supply chain by working closely with our procurement teams.
Securing a renewable future
• Two of our sites now have solar panels installed across their roof space, generating our own renewable energy for use during production and operations.
• The surplus energy is provided back to the grid in times of low energy usage (overnight, evenings and weekends), contributing to the renewable energy capacity in the grids of the countries we operate in.
• At our Pune site, as well as solar panels we have invested in electric site vehicles, to further our transition toward low carbon energy sources.
• Over 2026 we will be embarking on a project to secure renewable energy contracts across as many of our sites as possible, as well as carrying out feasibility studies on our remaining sites for on-site solar.
This will include engaging suppliers on emissions data, promoting low-carbon alternatives, and integrating sustainability criteria into purchasing decisions. By improving transparency and fostering partnerships, we aim to drive reductions across our value chain and strengthen our commitment to responsible sourcing.
Scope 3 emissions and Category 11 considerations
While we have included several Scope 3 categories in our footprint, Category 11 (use of sold products) is currently excluded. Our pumps are often integrated into larger engines and systems that generate emissions during use, however, calculating these emissions would require broad assumptions that could compromise accuracy. If industry guidance, more reliable measurement methods and improved product traceability post sales become available in the future, we are committed to incorporating Category 11 into our reporting to provide a more comprehensive view of our value chain impact.
Looking ahead: continuous improvement
Reporting GHG emissions is not just a compliance exercise, it is a cornerstone of our sustainability strategy. By establishing a baseline and tracking progress year-onyear, we can set meaningful reduction targets and implement initiatives that drive real change. As we refine our data collection processes and expand our reporting scope, we aim to strengthen transparency and accountability, ensuring our business contributes to global climate goals.
The key part of this will be replacing any current spend based data with actual emission factors and activity data. This continued shift will enable more precise emission calculations, better reflects our operational performance and supports informed decisions on carbon reduction. It also enhances transparency across our value chain, complementing our wider journey to understand and reduce emissions beyond our own operations.
As a manufacturing business, it is expected that our Category 1 purchased goods and services make up the largest share of our Scope 3 emissions, as the materials and components we source typically carry significant embedded carbon. Reducing these emissions will require close collaboration with our suppliers to improve materia efficiency, increase low-carbon sourcing options and dr ve reductions throughout our value chain
Our GHG emissions
Water
WATER USE
Minimizing water use in manufacturing
We recognize water as a vital resource and are committed to reducing consumption across our manufacturing processes. By implementing efficient cooling systems, closed-loop water circuits, and process optimizations, we aim to minimize water usage without compromising product quality. These measures not only conserve resources but also support our broader sustainability objectives, ensuring responsible operations that protect local water supplies and reduce environmental impact.
We actively monitor our water usage to track usage and identify further opportunities for improvement. Additionally, none of our sites are located in areas of high-water stress, and therefore we have no water withdrawal from such regions, supporting our commitment of responsible water stewardship. In 2026 we will be improving our water monitoring processes and report group wide numbers.
Biodiversity
Environmental stewardship through the value chain
Our products and processes are designed for efficiency, ensuring optimal use of energy, natural resources, and raw materials while minimizing waste in line with our Environmental Policy. Many of our sites are ISO-certified and operate under ISO 14001 environmental management systems, with continuous improvement initiatives and employee engagement driving ongoing progress.
Environmental responsibility extends beyond our operations to our supply chain. Since 2016, we have applied specific environmental criteria as part of our supplier selection and validation process, ensuring adherence to human rights, environmental, and ethical standards. This screening helps us partner with suppliers who share our commitment to sustainability, reinforcing our goal of creating a responsible and resilient value chain.
BIODIVERSITY IMPACT
Protecting biodiversity and local environments
None of our sites are located in or near areas classified as biodiversity-sensitive; however, we remain committed to protecting the natural environment wherever we operate. We implement robust environmental management measures across all facilities, including pollution prevention, responsible waste handling, and water stewardship practices. These actions ensure that our operations minimize ecological impact and uphold our responsibility to
safeguard ecosystems, even in regions without designated biodiversity sensitivity.
Over the next two years we are committed to mapping our global biodiversity impact, firstly the impact of our own sites which we will report in our next report, and then the impact of our wider operations on global biodiversity which will be reported in the following year, alongside targets we will commit to in order to reduce our impact.
LAND USE
Land use and site characteristics
Our operations are primarily based on industrial estates, and none of our sites include nature-oriented or ecologically sensitive areas. While our locations are developed for manufacturing and logistics purposes, we remain committed to responsible land management practices. This includes maintaining clean and orderly premises, preventing contamination, and ensuring compliance with environmental regulations. By operating within established industrial zones, we minimize disruption to natural habitats while continuing to uphold high standards of environmental stewardship.
In our next report we will report our full land use footprint, the type of land use we are engaging with on our sites, and our forward strategy for minimizing land use and continue being good custodians of the sites we occupy.
Biodiversity initiatives
As we grow our global business, we remain focused on procuring in efficient ways and strengthening partnerships both locally and across our international supply chain. Our approach aims to ensure that the goods and services we source support our environmental, social and governance commitments while enabling us to operate with consistency and resilience.
This year, we will concentrate our efforts on improving visibility across our procurement activities, raising expectations for supplier performance, and prioritizing ower-impact alternatives. We will continue to challenge existing purchasing habits and explore more efficient solutions that reduce waste and resource use, helping us shape a supply chain that is both more sustainable and better aligned with our long-term growth ambitions.
In 2022 our newest member of the Concentric group, O.M.P., installed a large scale solar system, and with the cost savings from the project, have decided to reinvest the resources obtained into a project focused on the protection of biodiversity. This investment into a Biodiversity Oasis in Camugnano was created, in partnership with 3Bee, a regenerative space that now hosts nectarrich plants and shelters for wild pollinators.

Resource use
WASTE MANAGEMENT
Responsible waste management
We are committed to minimizing waste generation and ensuring responsible disposal across all our operations. Our approach focuses on reducing waste at source through process optimization, reusing materials wherever possible, and recycling to divert waste from landfill. Hazardous waste is managed in strict compliance with regulatory requirements to prevent environmental harm. Continuous improvement initiatives and employee engagement programs help identify new opportunities to reduce waste and improve resource efficiency, supporting our goal of a circular and sustainable manufacturing process.
CIRCULAR ECONOMY
Advancing circular economy principles
In 2024, Concentric took significant steps to embed circular economy principles into its operations, focusing on product design, sourcing, and supplier engagement. By shifting towards circularity, we aim to reduce resource dependency and extend product life cycles through smarter engineering and responsible material choices. This approach also includes elevating supplier management practices by setting clearer standards on environmental performance and human rights, ensuring that sustainability is integrated throughout our value chain.
Designing for sustainability and longevity
Product engineering at Concentric goes beyond innovation —it reflects our responsibility to minimize environmental impact across the entire product lifecycle. From material sourcing and component selection to assembly, delivery, energy consumption during use, and end-of-life considerations, every stage is evaluated through a sustainability lens. Our engineers are committed to designing products that align with the UN’s 2030 Sustainable Development Goals (SDGs), ensuring durability, efficiency, and recycling potential. By embedding these principles into design and manufacturing, we are creating solutions that support a circular economy and contribute to a more sustainable future.
Sustainable product design has become a core principle, ensuring that every stage of the product lifecycle is considered, from material sourcing and component selection to assembly, delivery, energy consumption during use, and end-of-life management.
Our engineers are committed to creating solutions that align with the UN’s 2030 SDGs, prioritizing durability, recycling potential, and efficient use of resources to reduce waste and conserve natural materials. Designing for efficiency and reliability is always central to their approach, ensuring we continue to deliver the best possib e products and long-term value for our customers.
Responsible sourcing and supplier accountability
Procuring with the future in mind
As we grow our global business, we remain focused on procuring in efficient ways and strengthening partnerships both locally and across our international supply chain. Our approach aims to ensure that the goods and services we source support our environmental, social and governance commitments while enabling us to operate with consistency and resilience.
RESOURCE USE
Designing products with resource efficiency in mind
At Concentric, product engineering is not only about delivering cutting-edge technology—it is about fulfilling our responsibility to minimize environmental impact.
Suppliers play a critical role in our sustainability journey, forming an integral part of our value chain. To strengthen this partnership, Concentric continuously updates its Supplier Code of Conduct, introducing enhanced sustainability expectations and accountability measures. This Code serves as the foundation for our interactions with suppliers, defining our Values in Action and setting clear standards that go beyond legal compliance. By embedding environmental and ethical requirements into our procurement processes, we ensure that our supply chain reflects our commitment to responsible resource use and sustainable business practices.
This year, we will concentrate our efforts on improving visibility across our procurement activities, raising expectations for supplier performance, and pr oritizing ower-impact alternatives. We will continue to challenge existing purchasing habits and explore more efficient solutions that reduce waste and resource use, helping us shape a supply chain that is both more sustainable and better aligned with our ong-term growth ambitions
Continuous improvement in supply chain management
Looking ahead, Concentric plans to further improve supplier management practices through targeted initiatives. These include localization and optimization strategies to source and manufacture products closer to key markets, reducing transportation emissions and costs. We will continue to strengthen supplier governance processes and share best practices across sites. By fostering collaboration and transparency, we aim to create a resilient, efficient supply chain that minimizes resource consumption and supports our long-term sustainability goals.
Social information
Our workforce
Listening and adapting
In 2025 Concentric started a journey of culture alignment across its sites, following acquisitions the company has added 350 new colleagues to the business in less than two years. The plan was to engage with our employees in a comprehensive culture survey, aimed at getting to the heart of what matters to our people and how we can better support them.
More than 1400 colleagues were invited to surveys, attended focus groups or participated in 1:1 interviews to give their voice on the company’s strengths, weaknesses and provide input into the company’s future culture. The process is ongoing into 2026 and will serve as a valuable tool to align the company’s culture with its future strategy while retaining the strengths and legacy of Concentric and its newly acquired businesses.
Engagement levels in excess of 75% ensures our findings are backed by data and has allowed us to deep dive into what it means to work at Concentric. We have identified core areas to work on, to make employees feel valued and challenged. With many of our employees working for the business long term, we want to make sure that work is a place they feel they belong.
Understanding what matters to our people
This year’s culture survey played an important role in strengthening our understanding of how colleagues are experiencing the organization during a period of strategic growth and market pressure. As we integrate newly acquired businesses, ensuring that all teams feel connected to a shared culture is essential to maintaining consistency in how we work, collaborate and support one another.
The survey provided valuable insight into the support our people need, the aspects of our culture that drive engagement, and the areas where we can improve. These findings are shaping our approach to building a resilient, nc usive and high-performing culture that enab es the organization to navigate change responsibly and sustainably.
"Listening to our colleagues is critical to building a culture that supports long-term, sustainable performance. The results of this year’s survey give us a clearer view of what matters most to our people as we grow and evolve, and they will guide our continued efforts to create an environment where all employees can succeed."
Jennifer Todd-Wilson Chief Human Resources Officer
Our HR performance
1,070
>75%
Staff response rate to culture survey
Survey responses received 100%
Staff paid at least the minimum wage
GENERAL CHARACTERISTICS
Empowering people and driving excellence
Concentric believes its people make a meaningful difference and encourages feedback and ideas through both formal and informal channels. Guided by our core values we foster collaboration across all areas of the business to achieve ambitious goals. Employees benefit from hybrid working options, health and wellness initiatives, and recognition programs such as referral rewards and long-service awards.
Commitment to diversity, development, and wellbeing
We are dedicated to improving diversity and inclusion by expanding apprenticeships and internships, partnering with schools and colleges, and strengthening talent management through succession planning and mentoring. Our structured development programs, cross-functional project teams, and training opportunities help employees grow while contributing to real business challenges. Equal pay, comprehensive insurance benefits, and wellness activities further reflect our commitment to creating a supportive and inclusive workplace.
Headcount numbers in this table include temporary workers.
HEALTH AND SAFETY
Improved lost time performance in 2025
In 2025, we achieved a slight reduction in lost time incidents across our global operations, reflecting our commitment to creating a safer workplace. This small improvement is the result of targeted initiatives, enhanced training, and proactive risk management measures implemented throughout the year. Whilst lower lost time numbers demonstrate progress in protecting our employees, we want to improve these numbers further to ensure continuous improvement with regards to our approach to health and safety.
Leadership engagement and accountability
Health and safety remains a top priority and is our most material risk, with monthly reviews of performance, identification of risks, and sharing best practices. These sessions ensure that safety is embedded at every level of the organization and that site management remain actively engaged in driving improvements. By maintaining this regular engagement, we foster accountability and create a culture where safety is integral to operational excellence.
Global knowledge sharing and site visits
To strengthen collaboration and learning, we have introduced global interactive health and safety shares and cross-site visits. These initiatives allow teams to exchange insights, observe best practices firsthand, and implement improvements tailored to local conditions. This global approach ensures consistency in standards while
encouraging innovation and continuous learning across our network of facilities.
Reducing hand injuries
through targeted action
Hand injuries have historically been one of the most common workplace incidents, and in 2025 we focused on reducing these through specific interventions. Enhanced training, improved use of personal protective equipment, and process redesigns we hope will contribute to a noticeable decline in hand-related injuries. These efforts highlight our commitment to addressing high-risk areas and ensuring the wellbeing of every employee.
Equitable training and development opportunities
We provide a range of training initiatives designed to support professional growth across all functions—not just manufacturing. Our goal is to ensure that training opportunities are equitable, accessible, and aligned with individual career aspirations. From technical skills to leadership development and broader business competencies, we want to create a culture of continuous learning where every employee has the chance to thrive.
Work-related injuries that caused at least one day of absence expressed as the number of incidents relative to the total days worked for all employees
Total number of absence days due to work-related
gap in pay between female and male employees
of fatalities as a result of workrelated injuries of own employees
Total number of all absence days as a percentage of total days worked for all employees
REMUNERATION
Fair pay for all employees
Concentric ensures that all employees are paid at or above the applicable minimum wage in every region where we operate. This commitment reflects our dedication to fair compensation and compliance with local labor standards, while supporting the wellbeing and financial security of our workforce.
Workers in the value chain
Global supply chain and shared responsibility
Concentric operates within a global supply chain, partnering with suppliers across multiple regions to deliver high-quality products to our customers. We recognize that the actions of our suppliers directly impact our sustainability performance and reputation, which is why we place strong emphasis on ethical and responsible practices throughout our value chain.
Supplier code of conduct as a foundation
Our Supplier Code of Conduct is central to ensuring that all partners adhere to our principles on human rights, environmental stewardship, and fair labor practices. This Code sets clear expectations that go beyond legal compliance, requiring suppliers to uphold standards that align with our values and sustainability commitments. It serves as a framework for collaboration and accountability, helping us maintain integrity across every tier of our supply chain.
Driving continuous improvement and engagement
Through 2025 we have actively engaged with suppliers to encourage continuous improvement in relation to human rights and the environment. Suppliers must adopt adequate internal policies covering their obligations to Concentric’s standards, and we monitor adherence, requesting relevant evidence where required. We aim to support a resilient and responsible value chain that protects workers’ rights and supports sustainable development globally, and have since hired into the role of Chief Procurement Officer to align our programs globally.

Governance information
Business conduct
CORRUPTION AND BRIBERY
Commitment to ethical business practices
Concentric maintains a zero-tolerance approach to corruption and bribery across its global value chain. We enforce strict compliance with international anti-corruption laws and our internal Code of Conduct, ensuring that all employees and suppliers uphold the highest standards of integrity and transparency in business dealings. To support this, we have a clearly advertised whistleblowing policy that enables employees and stakeholders to report any concerns confidentially and without fear of retaliation.
Strong track record of compliance
Over the past two years, Concentric has had no convictions or violations related to anti-corruption or antibribery laws. This reflects our ongoing commitment to ethical practices, supported by robust policies, training, and monitoring processes designed to prevent misconduct and protect the integrity of our operations worldwide.
SECTOR INVOLVEMENT
No involvement in controversial sectors
Concentric does not operate in or supply to any controversial sectors, such as those associated with arms manufacturing, tobacco, gambling, or other industries that conflict with our ethical standards and sustainability commitments. Our focus remains on delivering innovative, responsible solutions for our customers while maintaining the highest integrity across all areas of our business.
BOARD OF DIRECTORS
Board expertise and
diversity commitment
Our Board of Directors is composed of individuals appointed from relevant industries, each bringing exceptional experience and expertise to guide Concentric’s strategic direction. While we currently do not have female representation on the Board, this does not reflect a limitation in our approach. We remain committed to diversity and inclusion and will continue to consider highly qualified candidates from all backgrounds for future appointments.
Conducting business properly
As we grow our global business, we remain focused on procuring in efficient ways and strengthening partnerships both locally and across our international supply chain. Our approach aims to ensure that the goods and services we source support our environmental, social and governance commitments while enabling us to operate with consistency and resilience.
This year, we will concentrate our efforts on improving visibility across our procurement activities, raising expectations for supplier performance and prior t zing lower- mpact alternatives. We will continue to challenge existing purchasing habits and explore more efficient solutions that reduce waste and resource use, helping us shape a supply chain that is both more sustainable and better aligned with our long-term growth ambitions
We will continue to work in sectors that bring value to people and are working on reducing their environmental impact too. And we will continue to build on our strong governance framework to further strengthen the integrity of the work we do and maintain our reputation as a good business to work with.


Appendices
Accounting methodology
ESG ACCOUNTING METHODOLOGY
Organizational boundary
The organizational boundary is defined using the operational control approach, including all manufacturing sites and offices where the company controls operational processes. Joint ventures are included/excluded based on this control test.
ENVIRONMENTAL
GHG emissions reporting boundary
Scope 1 covers fuels used in production equipment, space heating process heat and company-control ed vehicles plus refrigerant losses. Scope 2 includes purchased electricity and heat disc osed using both location-based and market-based methods Relevant Scope 3 categories include purchased goods and materials, upstream logistics, waste, employee commuting, business travel, and product end-of- ife mpacts.
Data collection
Primary data is captured from energy meters, fuel delivery logs, production equipment readings, transport management systems and waste contractor reporting. Procurement and ERP systems provide material-related data, where gaps exist, engineering estimates or spendbased methods are used.
Emissions and resource use factors
GHG emissions use UK Government GHG Conversion Factors supp emented by supp ier-specific electricity factors and IPCC refrigerant GWP values. Waste, water, and material efficiency figures use DEFRA factors or industry averages where primary data is unavailable.
Calculation methods
Emissions = activity data × emissions factor. Fuel and electricity emissions use kWh or liter consumption; logistics use distance- and weight-based factors; materials use e ther mass-based or economic-input-output factors depending on data qual ty Water consumption and waste outputs use metered or weighbridge records.
SOCIAL
Social metrics boundary
Social KPIs cover employees directly employed by the company and, where relevant, contingent labor at controlled sites.
Social data collection
Data is drawn from HR systems, training systems, health and safety logs, diversity and inclusion reporting, and employee engagement surveys.
Social calculation methods
Workforce composition metrics (gender balance, age profile turnover) use headcount at year-end or FTE averages. Health and safety indicators (LTI rate, incident frequency) use standard industry formulas based on hours worked Tra ning hours reflect system-recorded attendance or validated est mates for on-the-job training
Supplier social performance uses qualitative scoring weighted by risk levels.
GOVERNANCE
Governance metrics boundary
Governance indicators apply across the entire organization and include board oversight, policy implementation, risk management processes, and compliance frameworks relevant to manufacturing operations.
Governance data collection
Data is sourced from corporate governance disclosures, risk registers, internal audit findings, compliance training systems, whistleblowing logs, and board/committee documentation.
Governance calculation methods
Comp iance-related KPIs (po icy adoption training comp etion audit actions closed) use system-generated percentages.Governance diversity metrics use board and senior leadership composition.Risk monitoring metrics are derived from internal controls testing and incident registers, aggregated at organizational level.
GENERAL
Materiality
Topics are prioritized through an annual materiality assessment based on stakeholder expectations, regulatory obligations, and the nature of impacts associated with manufacturing.
Base year and recalculation
ESG baselines are recalculated only for structural changes, or material improvements in methodology or data accuracy. In line with GHG Protocol any acquisitions carried out in the second half of the reporting year, these will be incorporated into reporting the following year.
Quality, assurance and limitations
Data is subject to internal review, system checks, and cross-va idation w th metering invo ces, or ogs. Where estimates are unavoidable, conservative assumptions are applied.
Concentric’s commitment
We are committed to continually strengthening our ESG reporting by improving data quality, expanding primary data capture, and enhancing integration across our systems. We will monitor and respond to emerging regu ations and best-practice standards ensuring our methodologies remain aligned with leading frameworks. We will ensure our approach remains robust, transparent, and reflective of evolving stakeholder expectations.

A.P. MOLLER CAPITAL
A.P. Moller Capital’s impact report for 2025 is enclosed on the next pages.
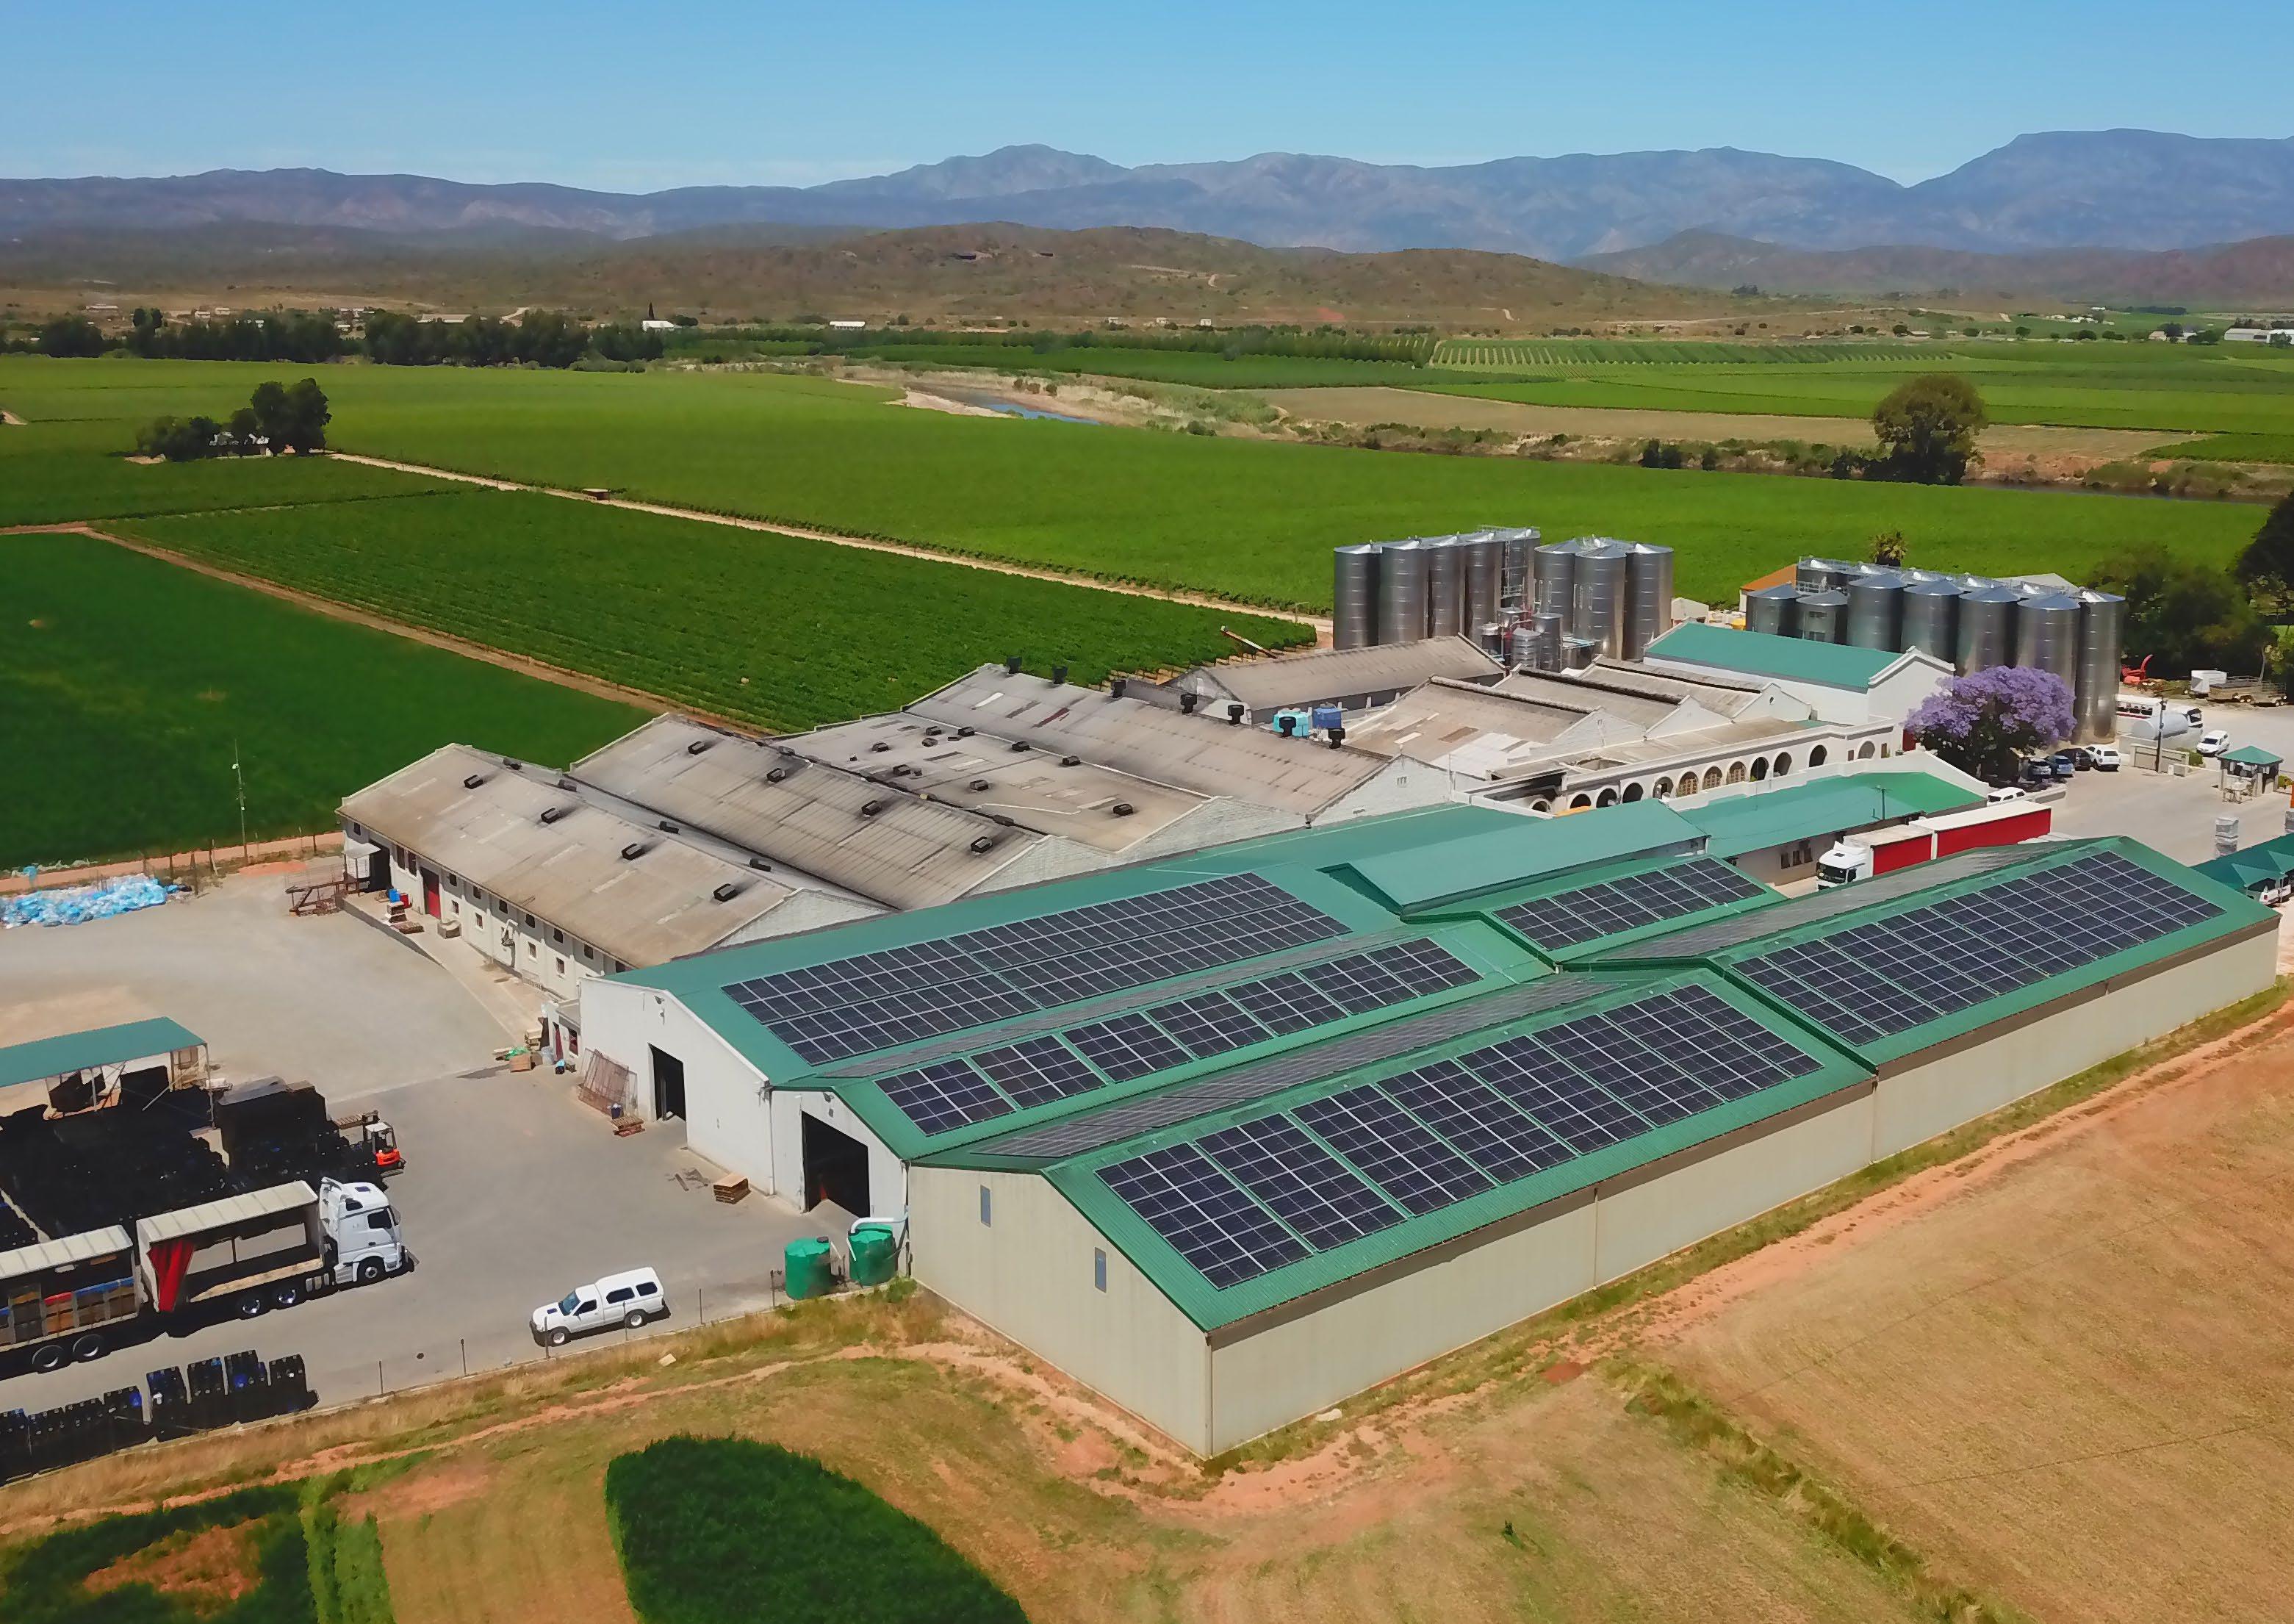
A.P. MOLLER CAPITAL IMPACT REPORT
WE ARE GUIDED BY OUR FIVE CORE VALUES


CONSTANT CARE
Take care of today, actively prepare for tomorrow
HUMBLENESS
Listen, learn, share, give space to others
UPRIGHTNESS
Our word is our bond
OUR EMPLOYEES
The right environment for the right people
OUR NAME
The sum of our values, passionately striving higher
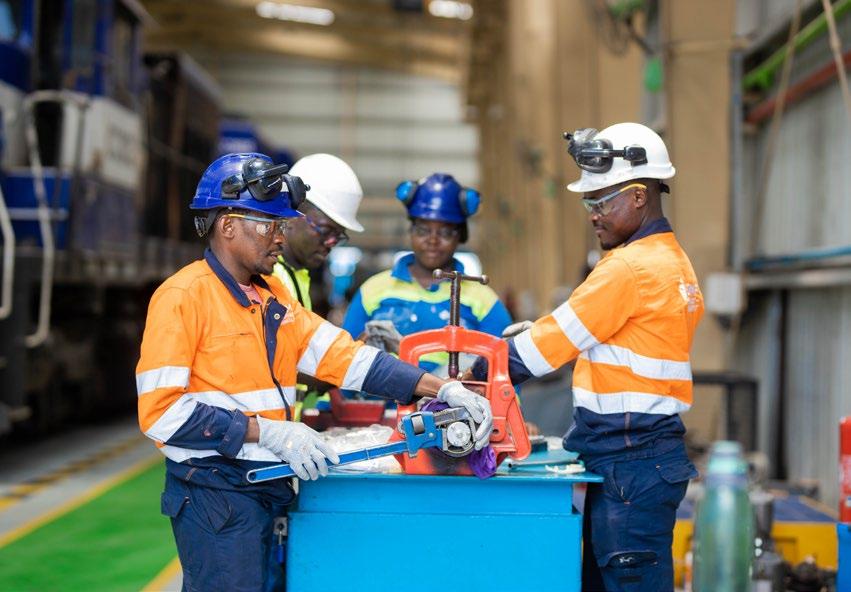
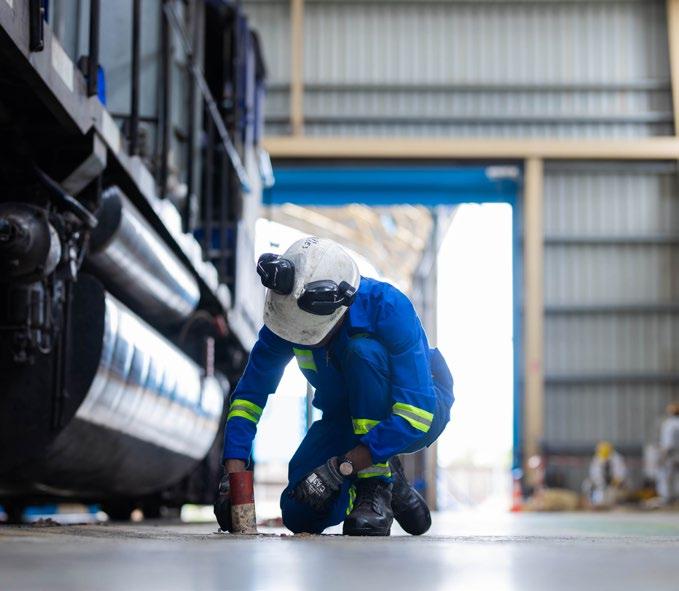
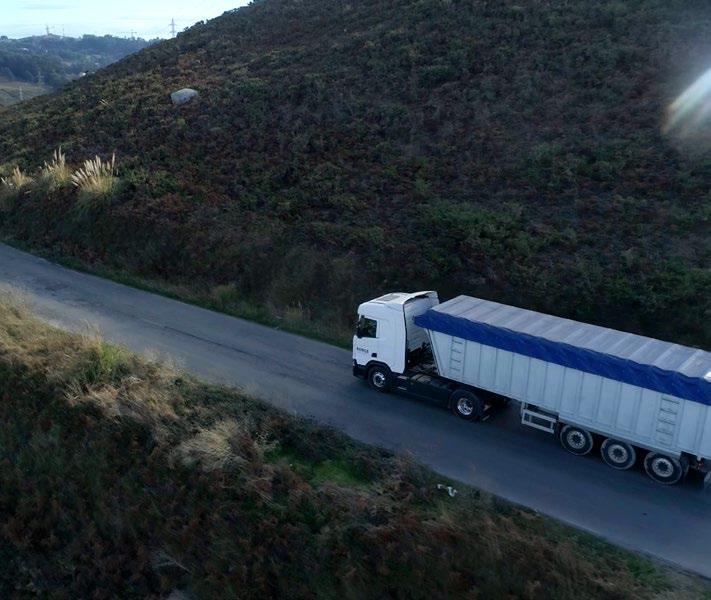
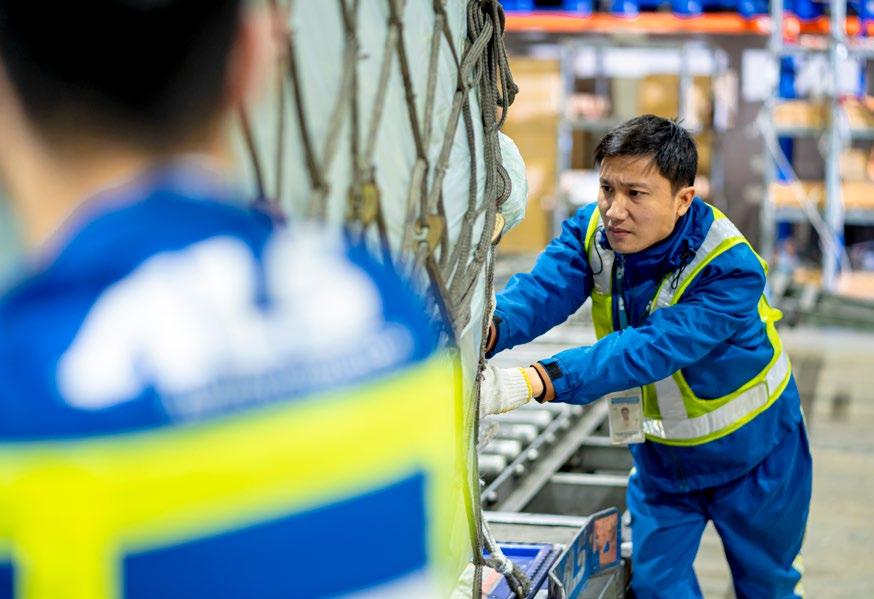
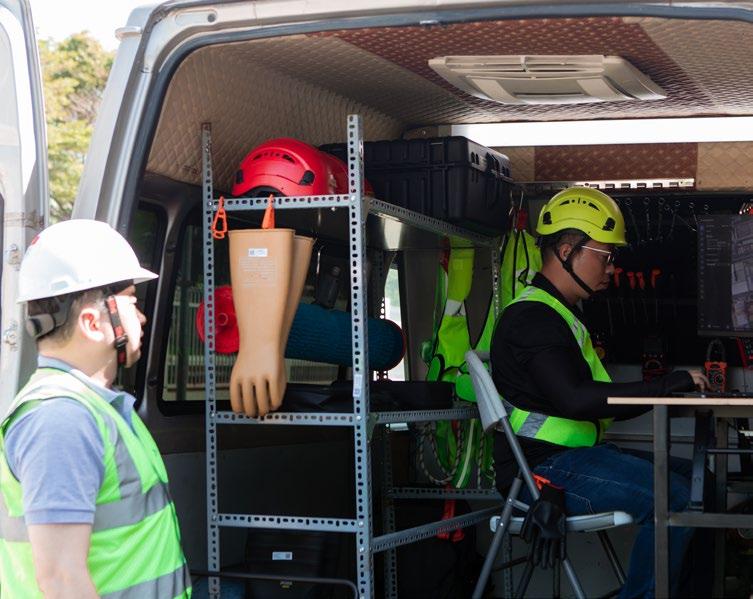
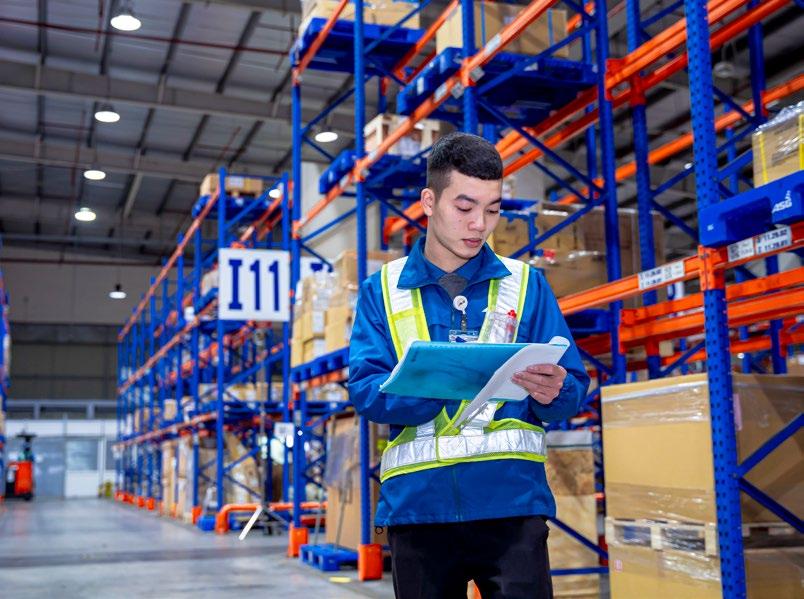
MESSAGE FROM THE CEO
I am pleased to introduce A.P. Moller Capital’s Annual Impact Report 2025. It sets out how our approach to responsible investment continues to strengthen asset resilience, protect long-term value and deliver attractive returns, while supporting the communities and economies in which we invest. In an increasingly volatile global environment, integrating responsible investment is not a trade-off. It is fundamental to delivering sustainable value. By investing in high-quality, critical infrastructure and managing it with long-term discipline, we enhance performance, reduce risk and create more valuable assets. At the same time, these investments can be transformational, improving access to energy, transport and essential services that underpin growth and development in the countries we serve.
This philosophy shaped our investment decisions throughout 2025 and continues to guide how we build resilient businesses that deliver enduring value for investors and society alike.
Our renewable energy investments generated 158.4 gigawatt hours of clean power across emerging markets, while our transport and logistics companies in Egypt and South Africa advanced their science-based decarbonisation plans. Between 2023 and 2025, these efforts resulted in a scope 1 and 2 greenhouse gas emissions reduction of 17% in our Emerging Markets Infrastructure Fund II, setting a strong foundation for similar work across the rest of our portfolio.
Our investments also supported 195,292 direct and indirect jobs. Across the year, we emphasised skills development, local hiring and inclusive employment practices, illustrating our belief that sustainable economic growth must be broadbased and accessible.
As our portfolio expands across new markets, so does our commitment to create positive environmental and social impact. At Vietnam’s Hanoi Airport, we extended our transport and logistics footprint with ALS Cargo
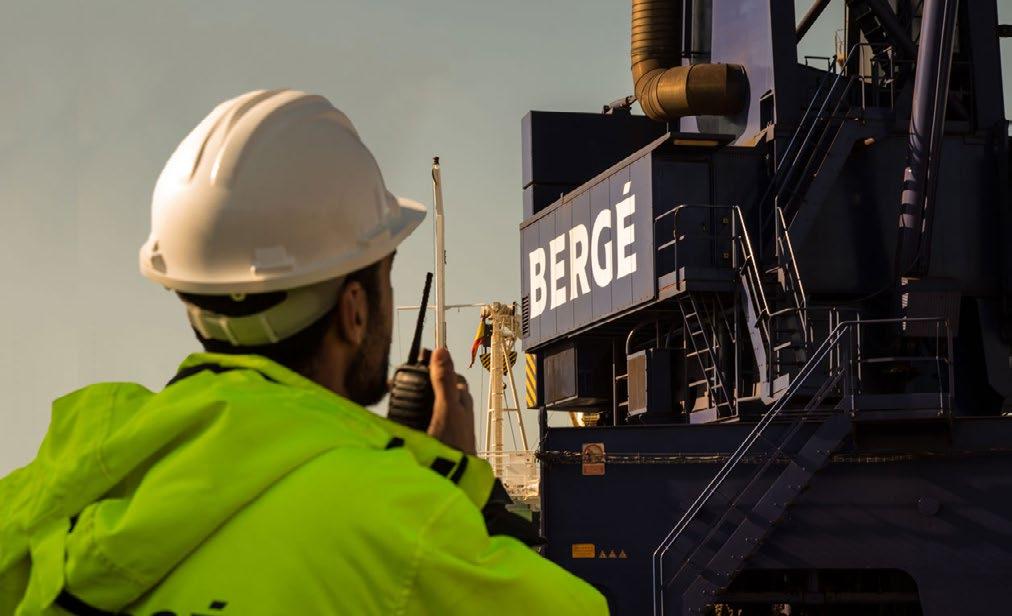
Terminal, supporting economic connectivity and job creation. We also made our first European investment by acquiring a majority stake in Bergé y Compañía (BERGÉ), a company with over 150 years of heritage in 27 ports mainly in Spain. The investment marks our entry into OECD markets and brings with it new environmental, social and governance responsibilities across Iberia and Latin America. In Asia, we strengthened our role in the renewable energy transition by signing a joint venture agreement, called Project Ranger, with Rays Power Infra in India. This investment will directly contribute to clean energy access and climate action. Furthermore, we entered into a binding agreement to acquire 40% of AC Logistics. The company, a fast-growing player in the Philippine logistics market, shares our vision of fostering economic growth and long-term prosperity through strategic investments.
Alongside this growth, we completed the first full exit in our Africa Infrastructure Fund I through the sale of our stake in Mass Céréales al Maghreb. The company has significantly improved its operational, environmental and social performance under our ownership, demonstrating our commitment towards responsible value creation.
Bergé y Compañía
Sustainable Growth: from carbon to community
Decarbonisation remained a central focus in 2025. Verdant Energy, our Southeast Asian renewable platform, expanded its contribution to regional clean-energy supply, complementing the output of Cabeólica and Lumika in Africa. We also continued to integrate climate risk assessments into early due diligence and ongoing asset management, safeguarding the resilience of our portfolio.
Beyond environmental impact, our investments delivered social and economic benefits for workers and communities. I am particularly proud of our role in helping workers transition from informal to formal employment,
an important step toward greater job security, rights protection and economic resilience.
Strengthening safety and wellbeing
Safety remains our highest priority and a core part of how we measure success. In 2025, we enhanced our Safety Framework, expanded training programmes and strengthened incident-response procedures across our portfolio. Despite these efforts, I am deeply saddened to report 18 fatalities during the year. Every life lost is a tragedy, and it reinforces the urgency of our safety work.
This difficult reality prompted a deeper assessment of the root causes behind serious incidents and led to the launch of a comprehensive road safety initiative.
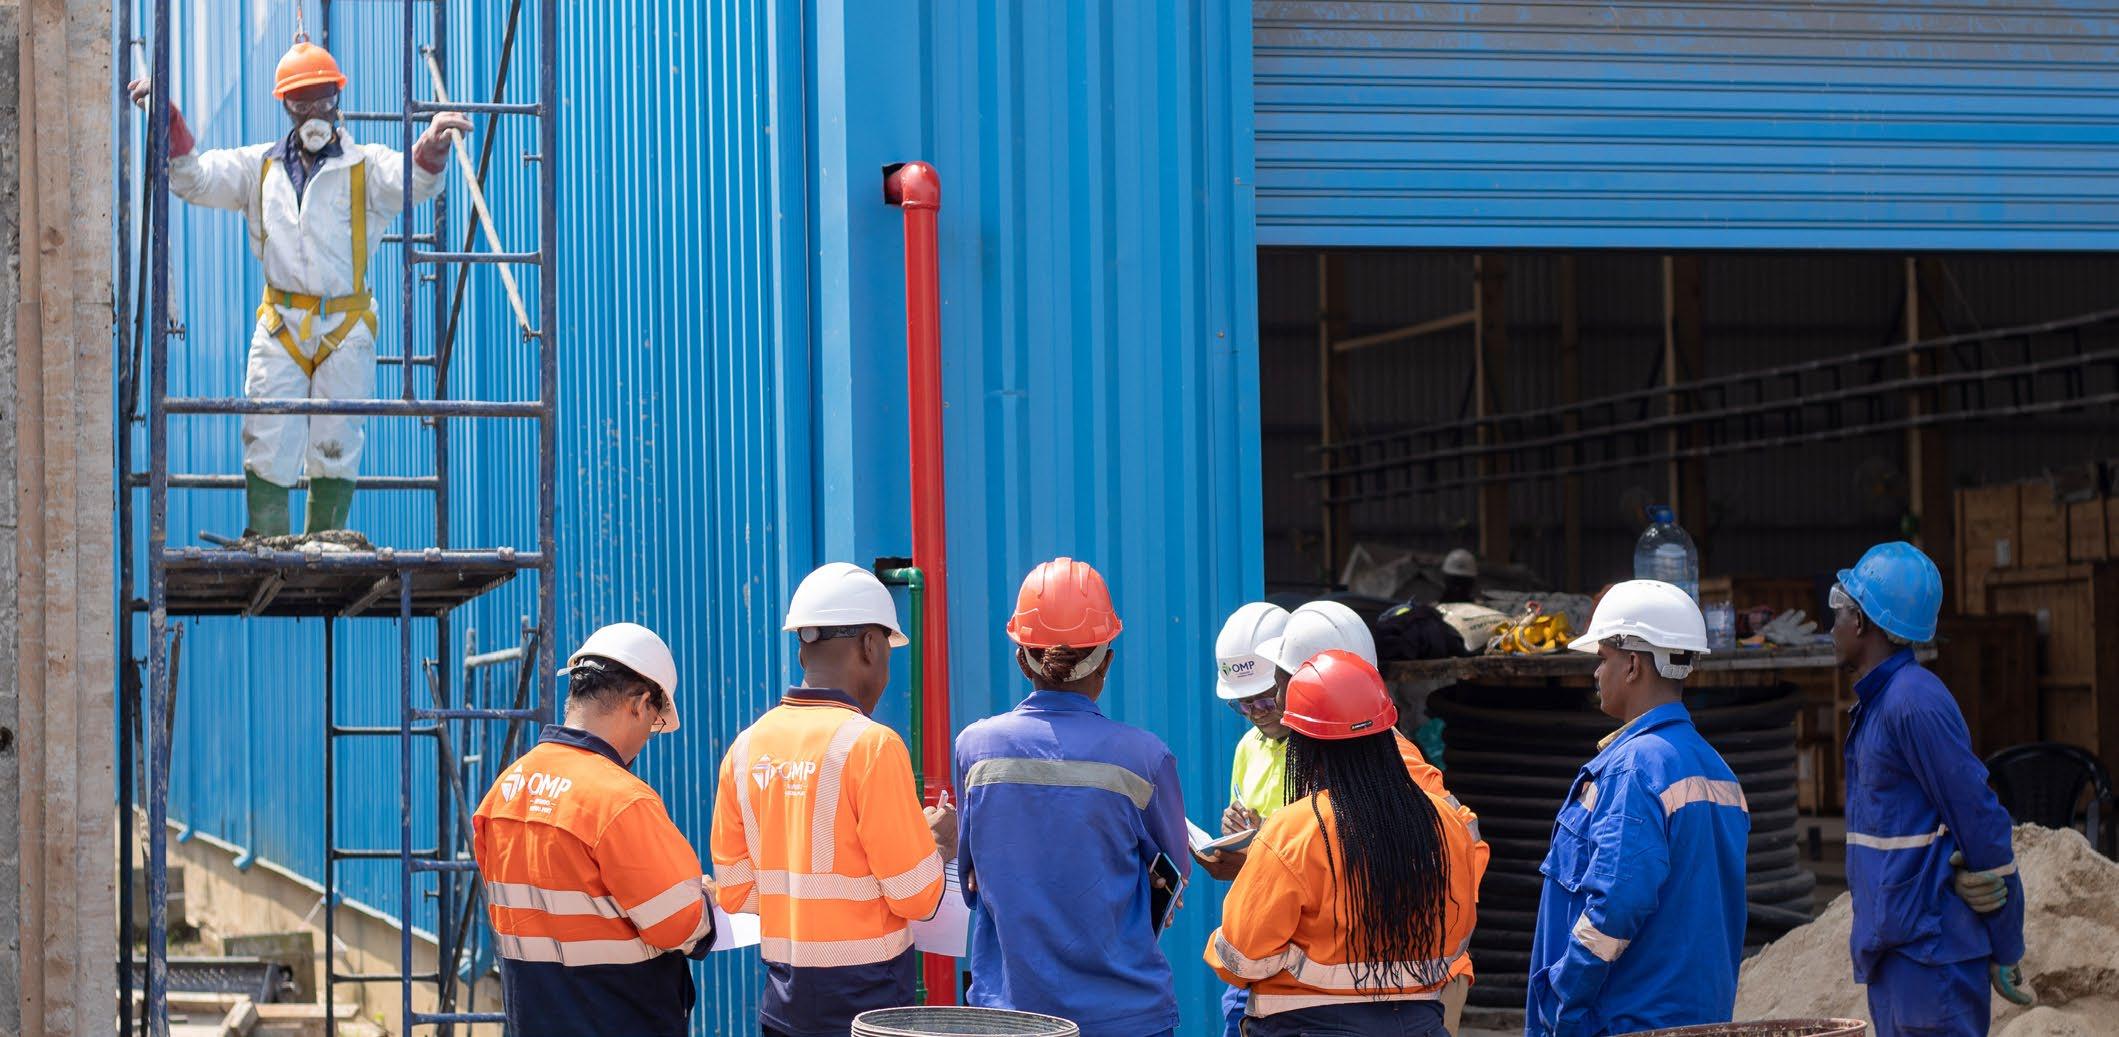
Because many of our incidents are related to road traffic, we are employing a range of approaches and technologies, including artificial intelligence, to help us improve driver safety, strengthen monitoring and build safer working environments across our portfolio.
In 2026, we will continue to invest in capacity building, root-cause analysis and the sharing of best practices. Our commitment to safety is unwavering. We believe it is crucial to publicly and transparently report the number of fatalities and hold ourselves accountable.
The year ahead: embracing change, driving impact
As we look ahead to 2026, I remain optimistic. Our responsible investment philosophy, rooted in our values, underpinned by our culture and shaped by deep local knowledge, continues to guide us as we navigate both uncertainty and opportunity. Safety, decarbonisation and inclusive growth will remain at the centre of our work, and we will continue to partner closely with our portfolio companies to advance these priorities. For us, ‘doing well while doing good’ is more than a phrase. It reflects our belief that commercial success and positive societal outcomes must move forward together.
Kim Fejfer Managing Partner and CEO
Arise Ports & Logistics
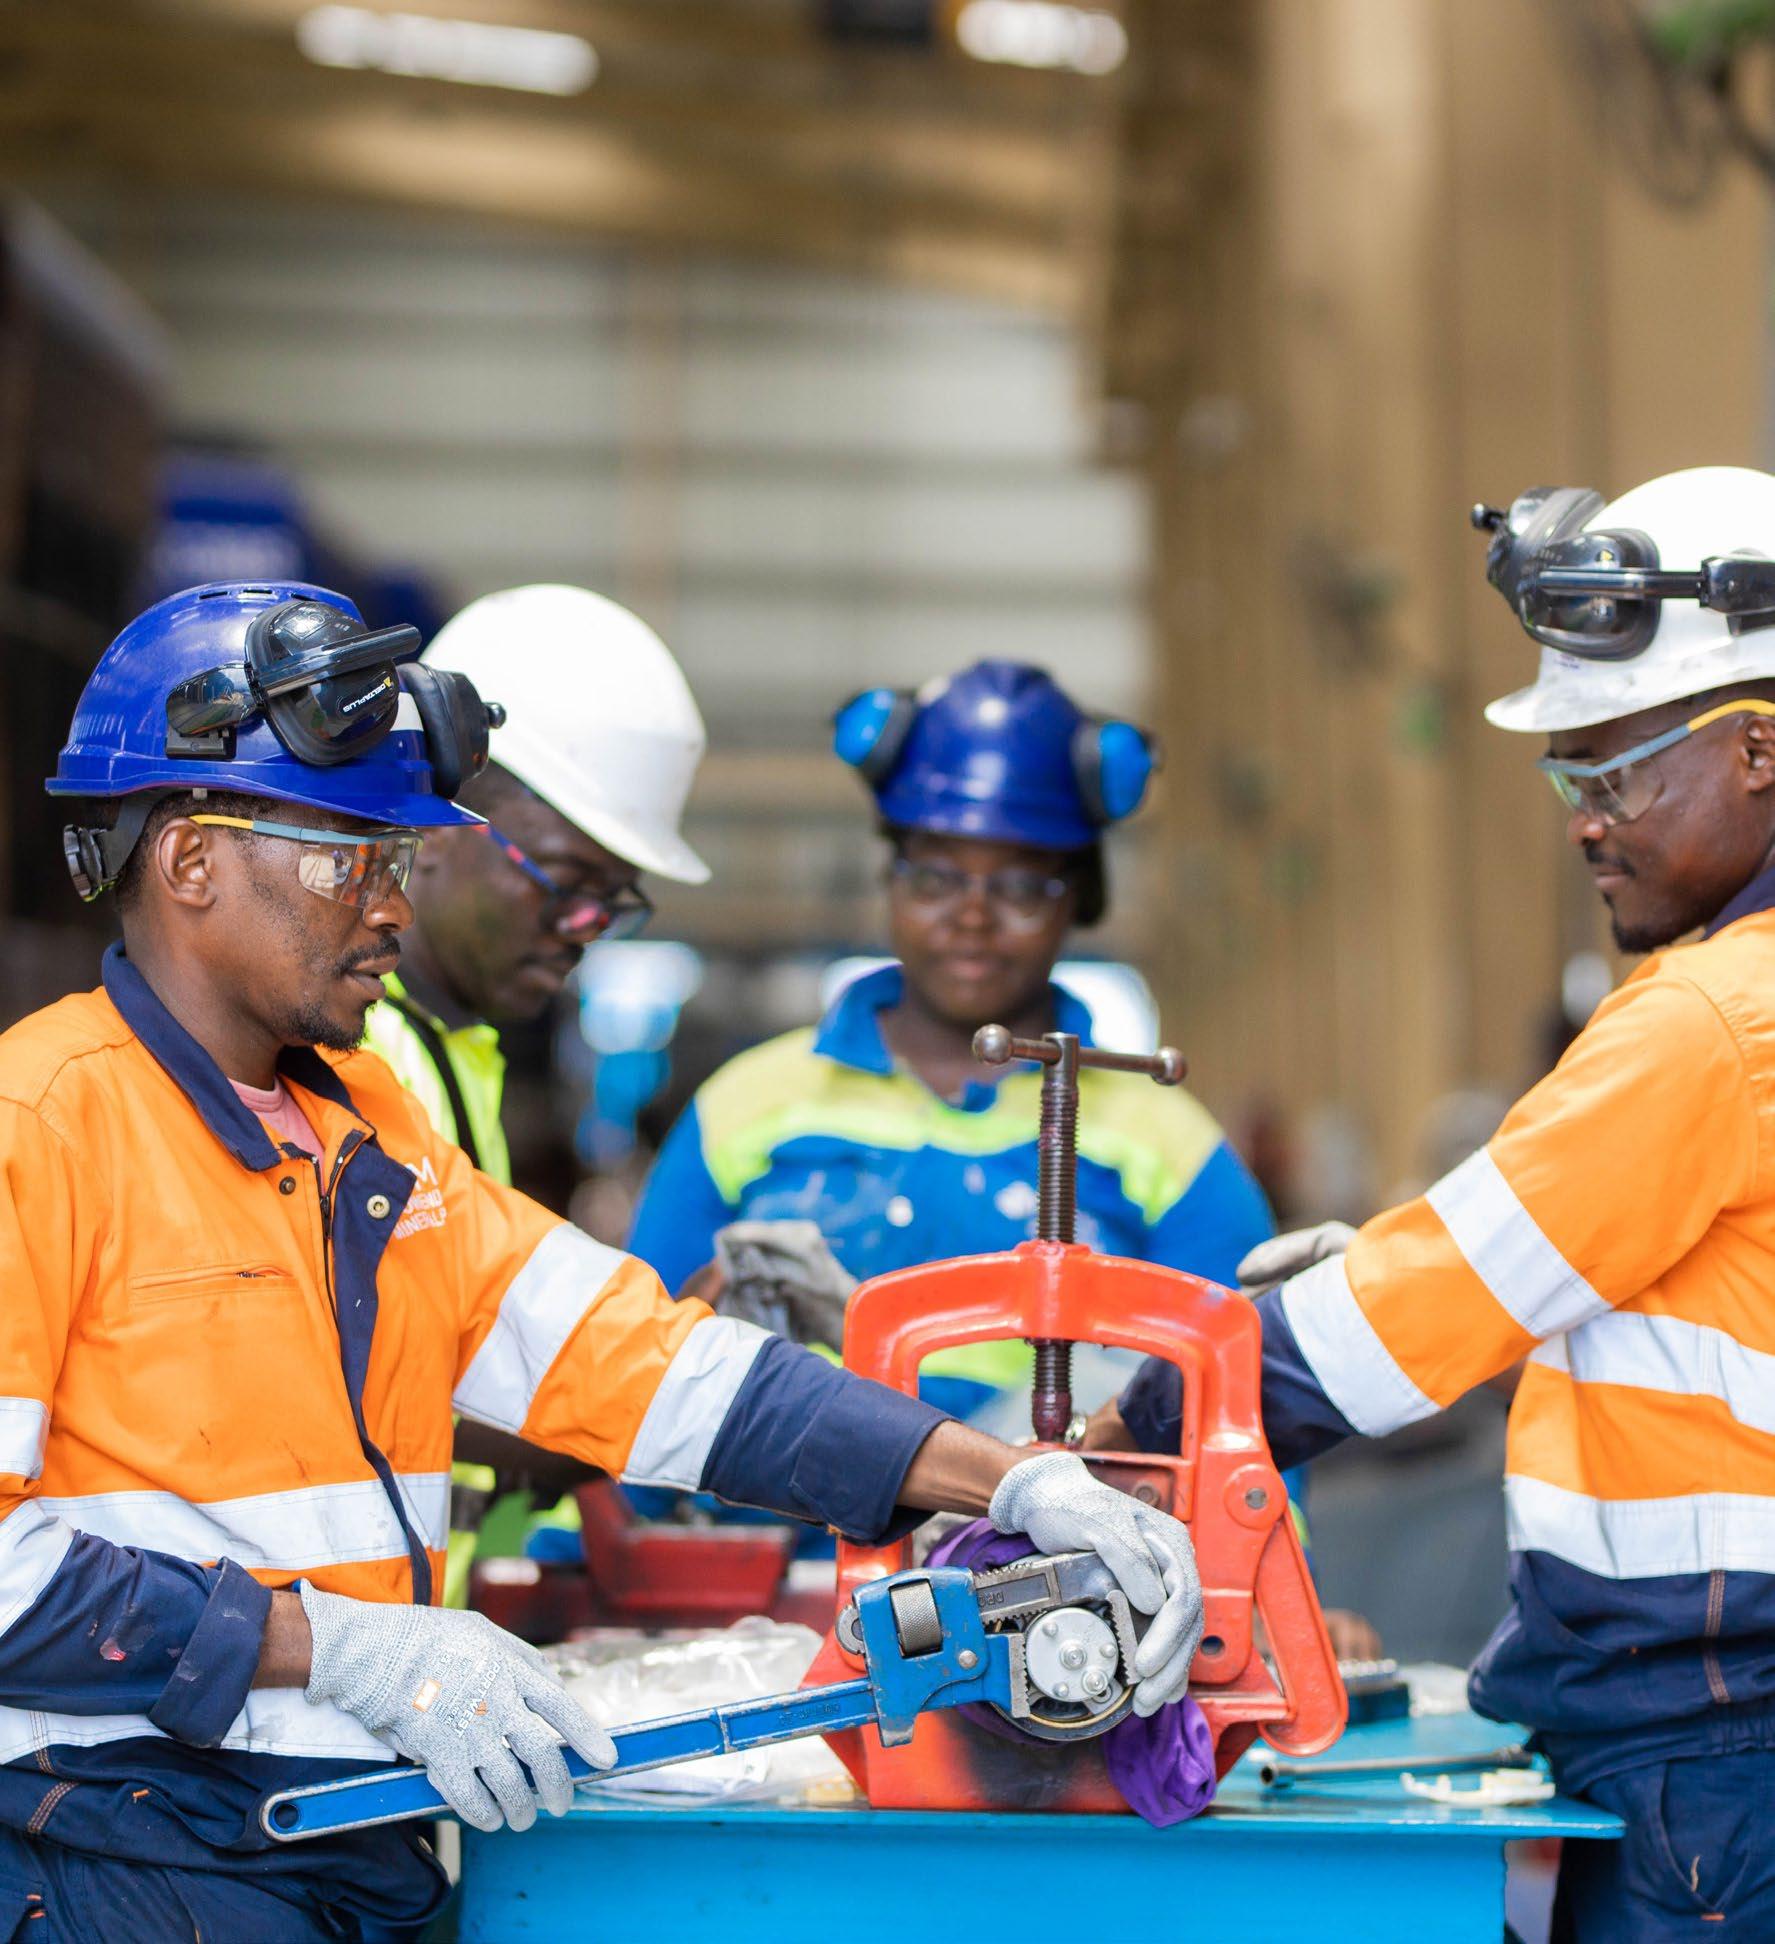
195,292
Total jobs supported
19,151 Direct jobs
41% Share of female workers in total jobs supported
Total GDP contribution supported $2.14bn
Arise Ports & Logistics
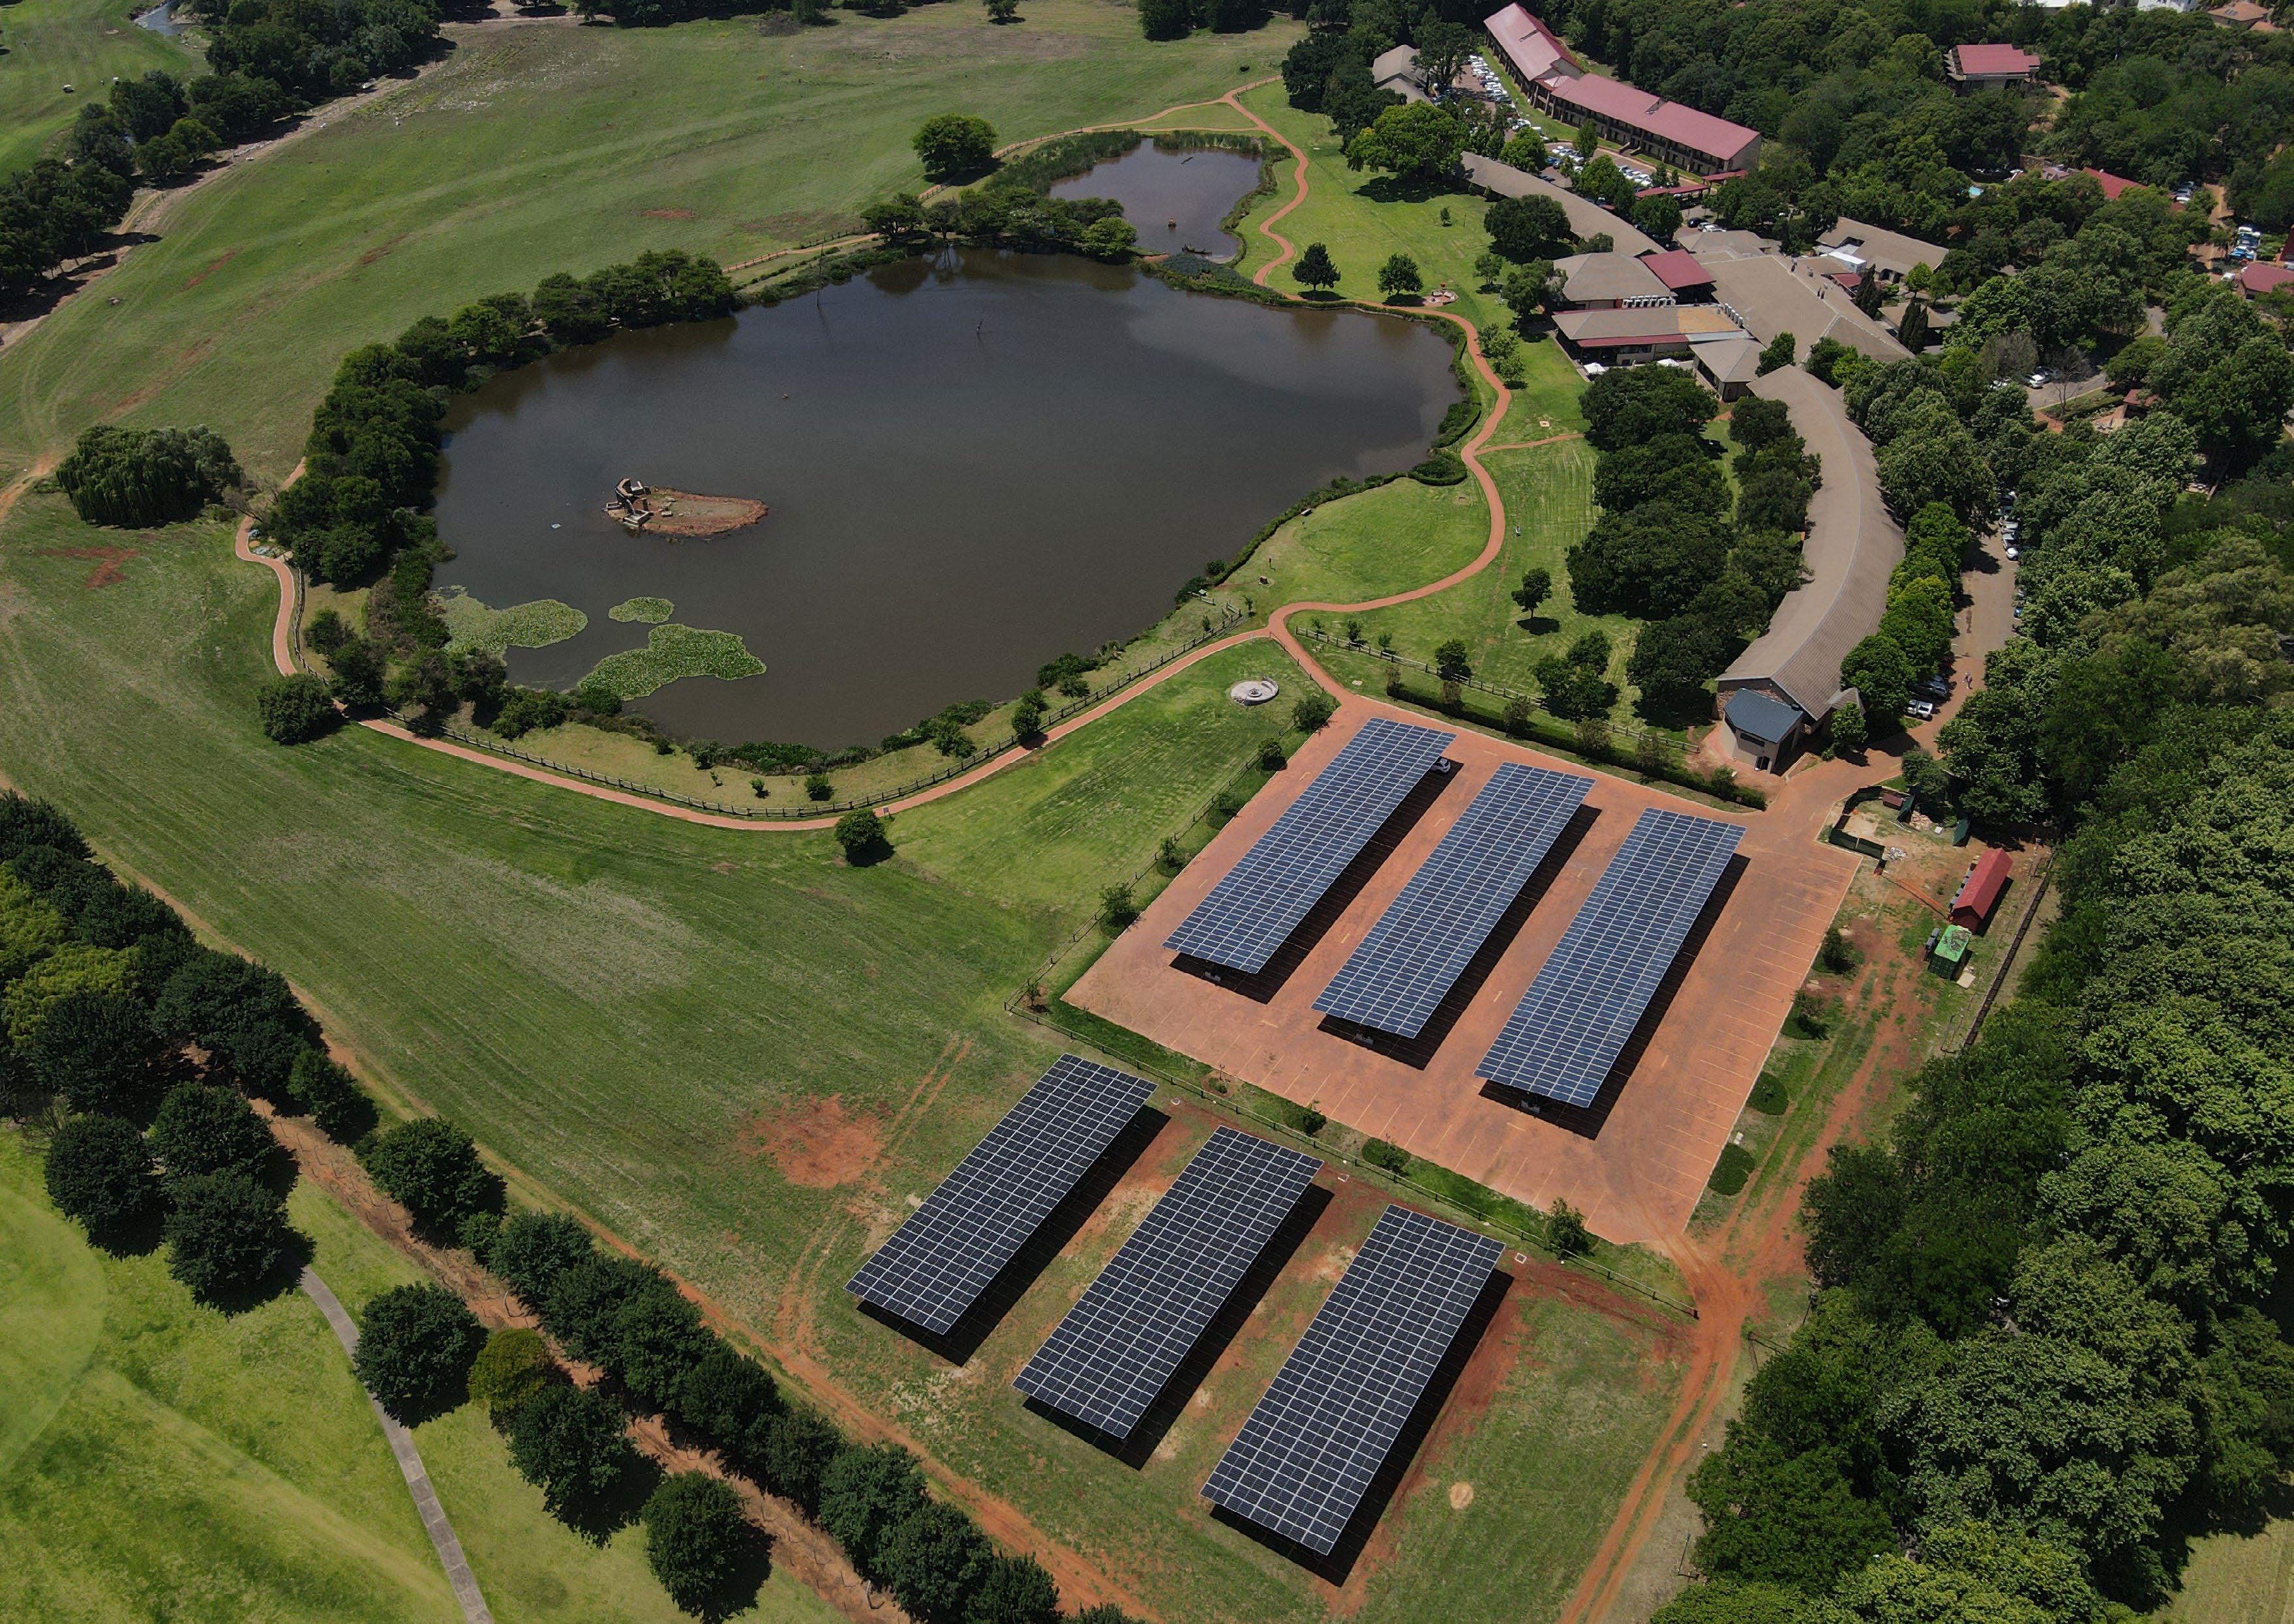
A.P. Moller Capital is an institutional fund manager investing in critical, mid-market, value-add infrastructure.
A.P. Moller Capital’s investment team combines decades of operational expertise and investment acumen with a values-based investment strategy to secure control positions in opportunities which aim to deliver attractive returns for investors.
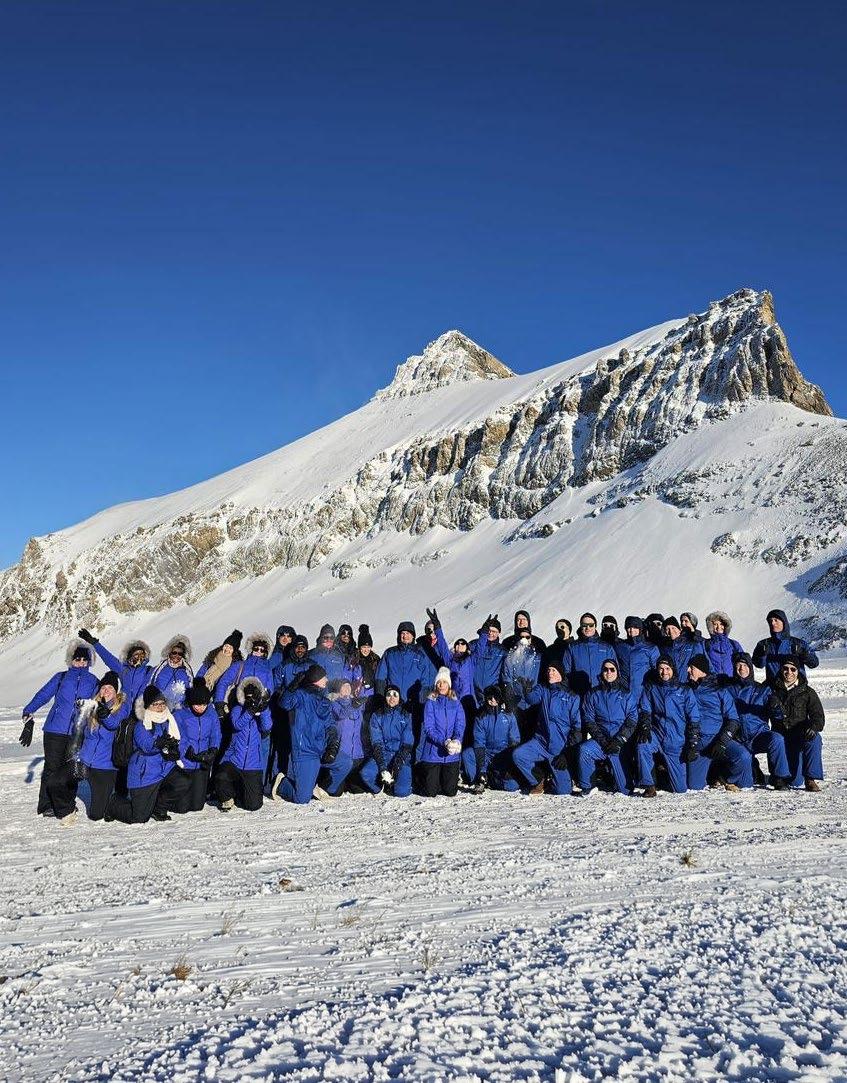
OUR CURRENT PORTFOLIO
Africa Infrastructure Fund I K/S (AIF I)
Transport and logistics Energy
Arise Ports & Logistics
Côte d’Ivoire I Gabon
Mineral and general cargo port terminals
KEG Holdings
Kenya
LPG import and distribution
Cabeolica
Cabo Verde Wind Power
Lumika Renewables
South Africa
Solar captive power
Eranove
Côte d’Ivoire I Togo I Benin
Thermal power, hydropower and water distribution
Impala Energy Holdings
Nigeria
Captive power (flared gas)
East Africa Infrastructure Platform
Kenya
Thermal power
A.P. Møller Capital – Emerging Markets
Infrastructure
Fund II K/S (EMIF II)
Transport and logistics Energy
HAU Logistics
Egypt
Warehousing & logistics
Vector Logistics
South Africa | Zambia
Botswana | Namibia
Warehousing & logistics
ALS Cargo Terminal
Vietnam
Air cargo logistics
AC Logistics*
Philippines
Integrated logistics provider
Verdant Energy
Singapore
Renewable energy platform
Chbika Project
Morocco
Green ammonia port infrastructure
Project Ranger
India
Renewable energy platform
Responsible investment supports the next phase of air cargo growth in Vietnam
In 2025, A.P. Moller Capital expanded its footprint in Asia with an investment in ALS Cargo Terminal (ALSC). The investment, made through EMIF II and alongside local partner VinaCapital, marks the fund’s first entry into Vietnam’s transport sector and its second investment in South and Southeast Asia.
Founded in 2013, ALSC is a leading cargo handling company. Operating on a total usable area of approximately 60,000 m2 at Noi Bai International Airport in Hanoi, ALSC currently handles up to 250,000 tonnes of cargo per year and employs around 500 people.
Vietnam’s aviation and logistics sectors have grown rapidly in recent years. Growth has been driven by strong manufacturing exports, rising trade volumes and accelerating e-commerce activity. At Noi Bai International Airport, cargo facilities are approaching capacity, underscoring the need for investment in expansion and greater operational efficiency.
Warehousing & logistics
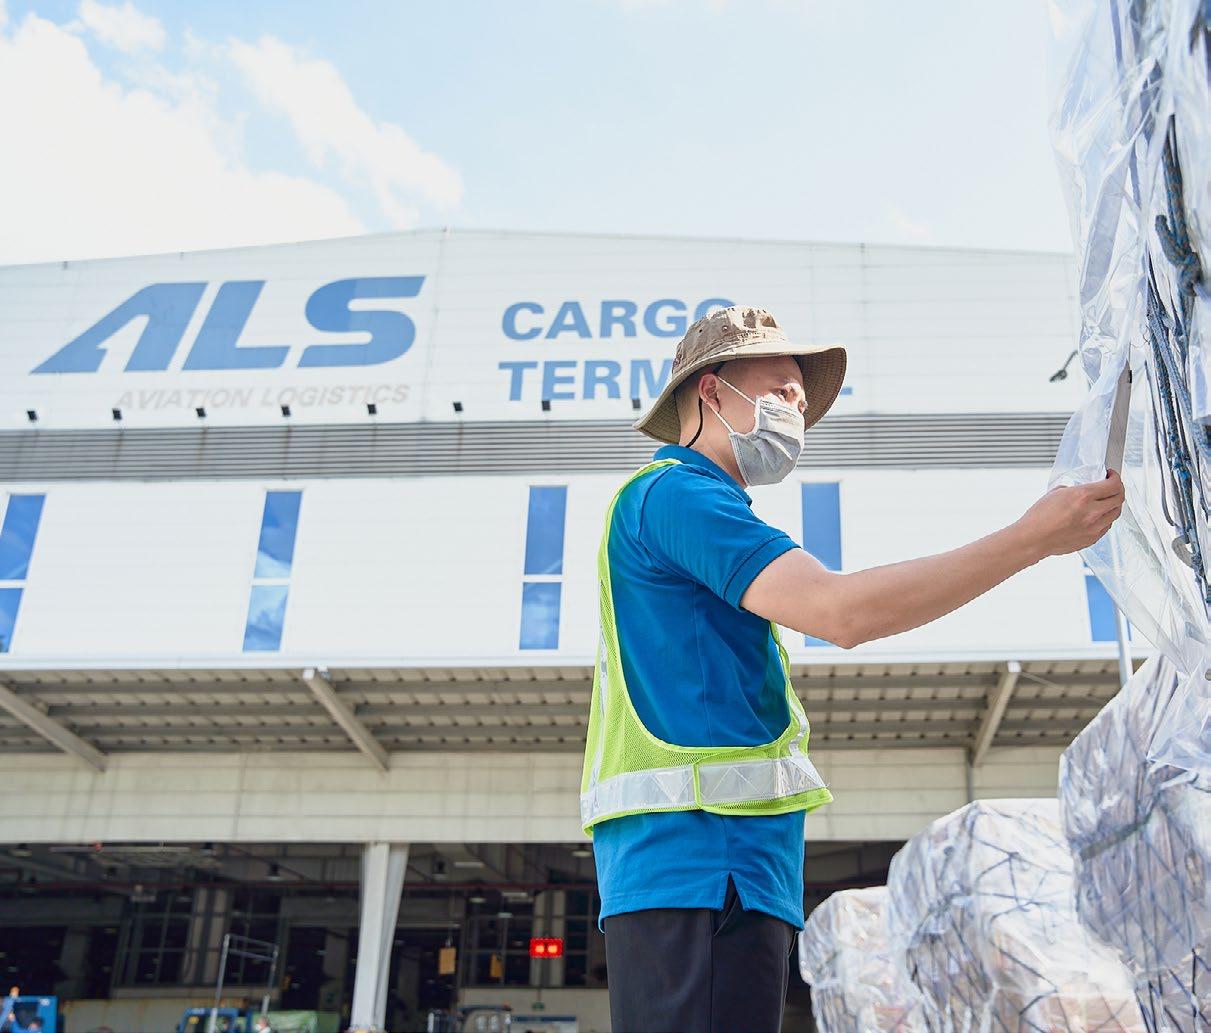
Growing demand
A.P. Moller Capital’s investment supports ALSC’s ongoing operations and its ability to pursue future growth opportunities. The investment focuses on further strengthening operational efficiency and enhancing service levels for airlines and logistics providers operating at the airport. As ALSC’s activities evolve over time, the investment is expected to support job creation within ALSC and across related logistics and value-added services.
Technology and automation are key elements of ALSC’s operational approach. The company is focused on modern handling systems and digital decision platforms designed to improve speed, accuracy and reliability, while reducing energy use and emissions intensity. This investment will help future-proof ALSC’s operations as Vietnam continues to scale its role as a regional manufacturing and trade hub.
Active ownership for long-term performance
A core belief at A.P. Moller Capital is that companies with strong ESG performance are better positioned to grow and deliver long-term profitability. As an active owner, A.P. Moller Capital works with portfolio companies to ensure compliance with its ESG requirements, which are aligned with international standards. For ALSC, this is supported through an Environmental and Social Action Plan (ESAP). This covers areas such as environmental and social risk management, occupational health and safety, and stakeholder engagement. A.P. Moller Capital’s ESG team will work closely with ALSC’s management to assist implementation through ongoing engagement and to keep these focus areas embedded in day-to-day operations.
A partnership approach
The ALSC investment was made alongside VinaCapital, one of Vietnam’s largest investment management firms, through its logistics platform LogiVest. VinaCapital brings deep local market knowledge and works with ALSC on financial reporting and access to financing opportunities. Meanwhile, A.P. Moller Capital contributes global transport infrastructure expertise and ESG knowledge. Together, the partners aim to support ALSC’s commercial resilience and enhance its position as a best-in-class cargo terminal operator in Vietnam.
The investment exemplifies EMIF II’s strategy of building resilient, sustainable infrastructure that enables international trade and supports economic growth in emerging markets. By expanding Vietnam’s logistics capacity and embedding ESG considerations in a critical logistics asset, the investment contributes to national sustainable development priorities while creating long-term value for investors, customers and local communities.
Majority stake in BERGÉ marks A.P. Moller Capital’s first OECD investment
In 2025, A.P. Moller Capital expanded its infrastructure footprint through an investment in Bergé y Compañía (BERGÉ), a leading Spanish ports and logistics operator. The investment is A.P. Moller Capital’s first in an OECD country. It represents an important milestone in the company’s strategy to globalise its investment platform while remaining committed to emerging markets.
The acquisition of a 51% stake in BERGÉ was concluded in September 2025. The investment was made through a vehicle backed by A.P. Moller Holding, in a proprietary sourced transaction. The near-term strategic focus will be on strengthening BERGÉ’s position in Spain, and over time Latin America, generating opportunities to share operational know-how and enhance operational performance and quality.
A platform for growth
Logistics operator
With a presence in 27 ports across Spain and southern France, BERGÉ provides port management and logistics services to a broad range of industries. Across its network, the company facilitates the movement and handling of agricultural and grain imports. This, in turn, contributes towards animal feed production and food supply. The company also handles steel imports, including scrap metal, which supports Spain’s industrial value chains. Moreover, it manages copper concentrate exports from Spain, a material with applications in electrical components and industrial manufacturing.
Automotive logistics are another important activity. BERGÉ facilitates vehicle production in Spain and Mexico and has developed specialised capabilities in handling electric vehicles (EVs).
With A.P. Moller Capital’s backing, BERGÉ aims to strengthen its position in its core Iberian markets initially. Expansion will focus on capacity upgrades in priority ports, alongside ongoing modernisation of existing warehouses, machinery and digital systems to optimise profitability and sustainability.
Advancing ESG integration
In parallel, BERGÉ is strengthening its commitment to decarbonisation and environmental management
across its footprint. A decarbonisation road map is being developed to identify and address the company’s principal sources of emissions. This complements a carbon-footprint assessment covering all business lines, including the truck fleet in Colombia. The road map will provide a consistent group-wide framework to prioritise emissions reductions while reflecting local operating conditions.
Market expectations are an additional driver. Many customers assess BERGÉ’s ESG performance through global platforms such as EcoVadis, which increasingly influence procurement decisions and long-term partnerships. Strengthening ESG performance therefore enhances customer acquisition and retention. It also positions the company to respond to regulatory developments, including the EU Carbon Border Adjustment Mechanism which affects several of the commodities handled in BERGÉ’s terminals.
Alongside its environmental agenda, BERGÉ has developed a health and safety road map structured around five main themes: strengthening procedures and instructions, upgrading equipment and facilities, enhancing risk assessments, monitoring corrective and preventative actions, and deepening safety awareness. At the operational level, the road map prioritises clearer rules and stronger controls in day-to-day port activities. From a technical perspective, BERGÉ is upgrading machinery with enhanced safety features. Finally, the road map places strong emphasis on awareness and engagement, such as sharing best practices and rewarding safety improvements.
Unlocking long-term value
Since completing the investment, A.P. Moller Capital has worked closely with BERGÉ to translate its ambitions into practical actions that improve ESG performance. Through active ownership and strategic engagement, the partnership seeks to build internal capacity, strengthen organisational buy-in and embed ESG considerations into daily decision-making. The shared objective is to develop efficient, lower-carbon port and logistics infrastructure in Spain and beyond, unlocking long-term value while promoting sustainable economic activity and international trade.
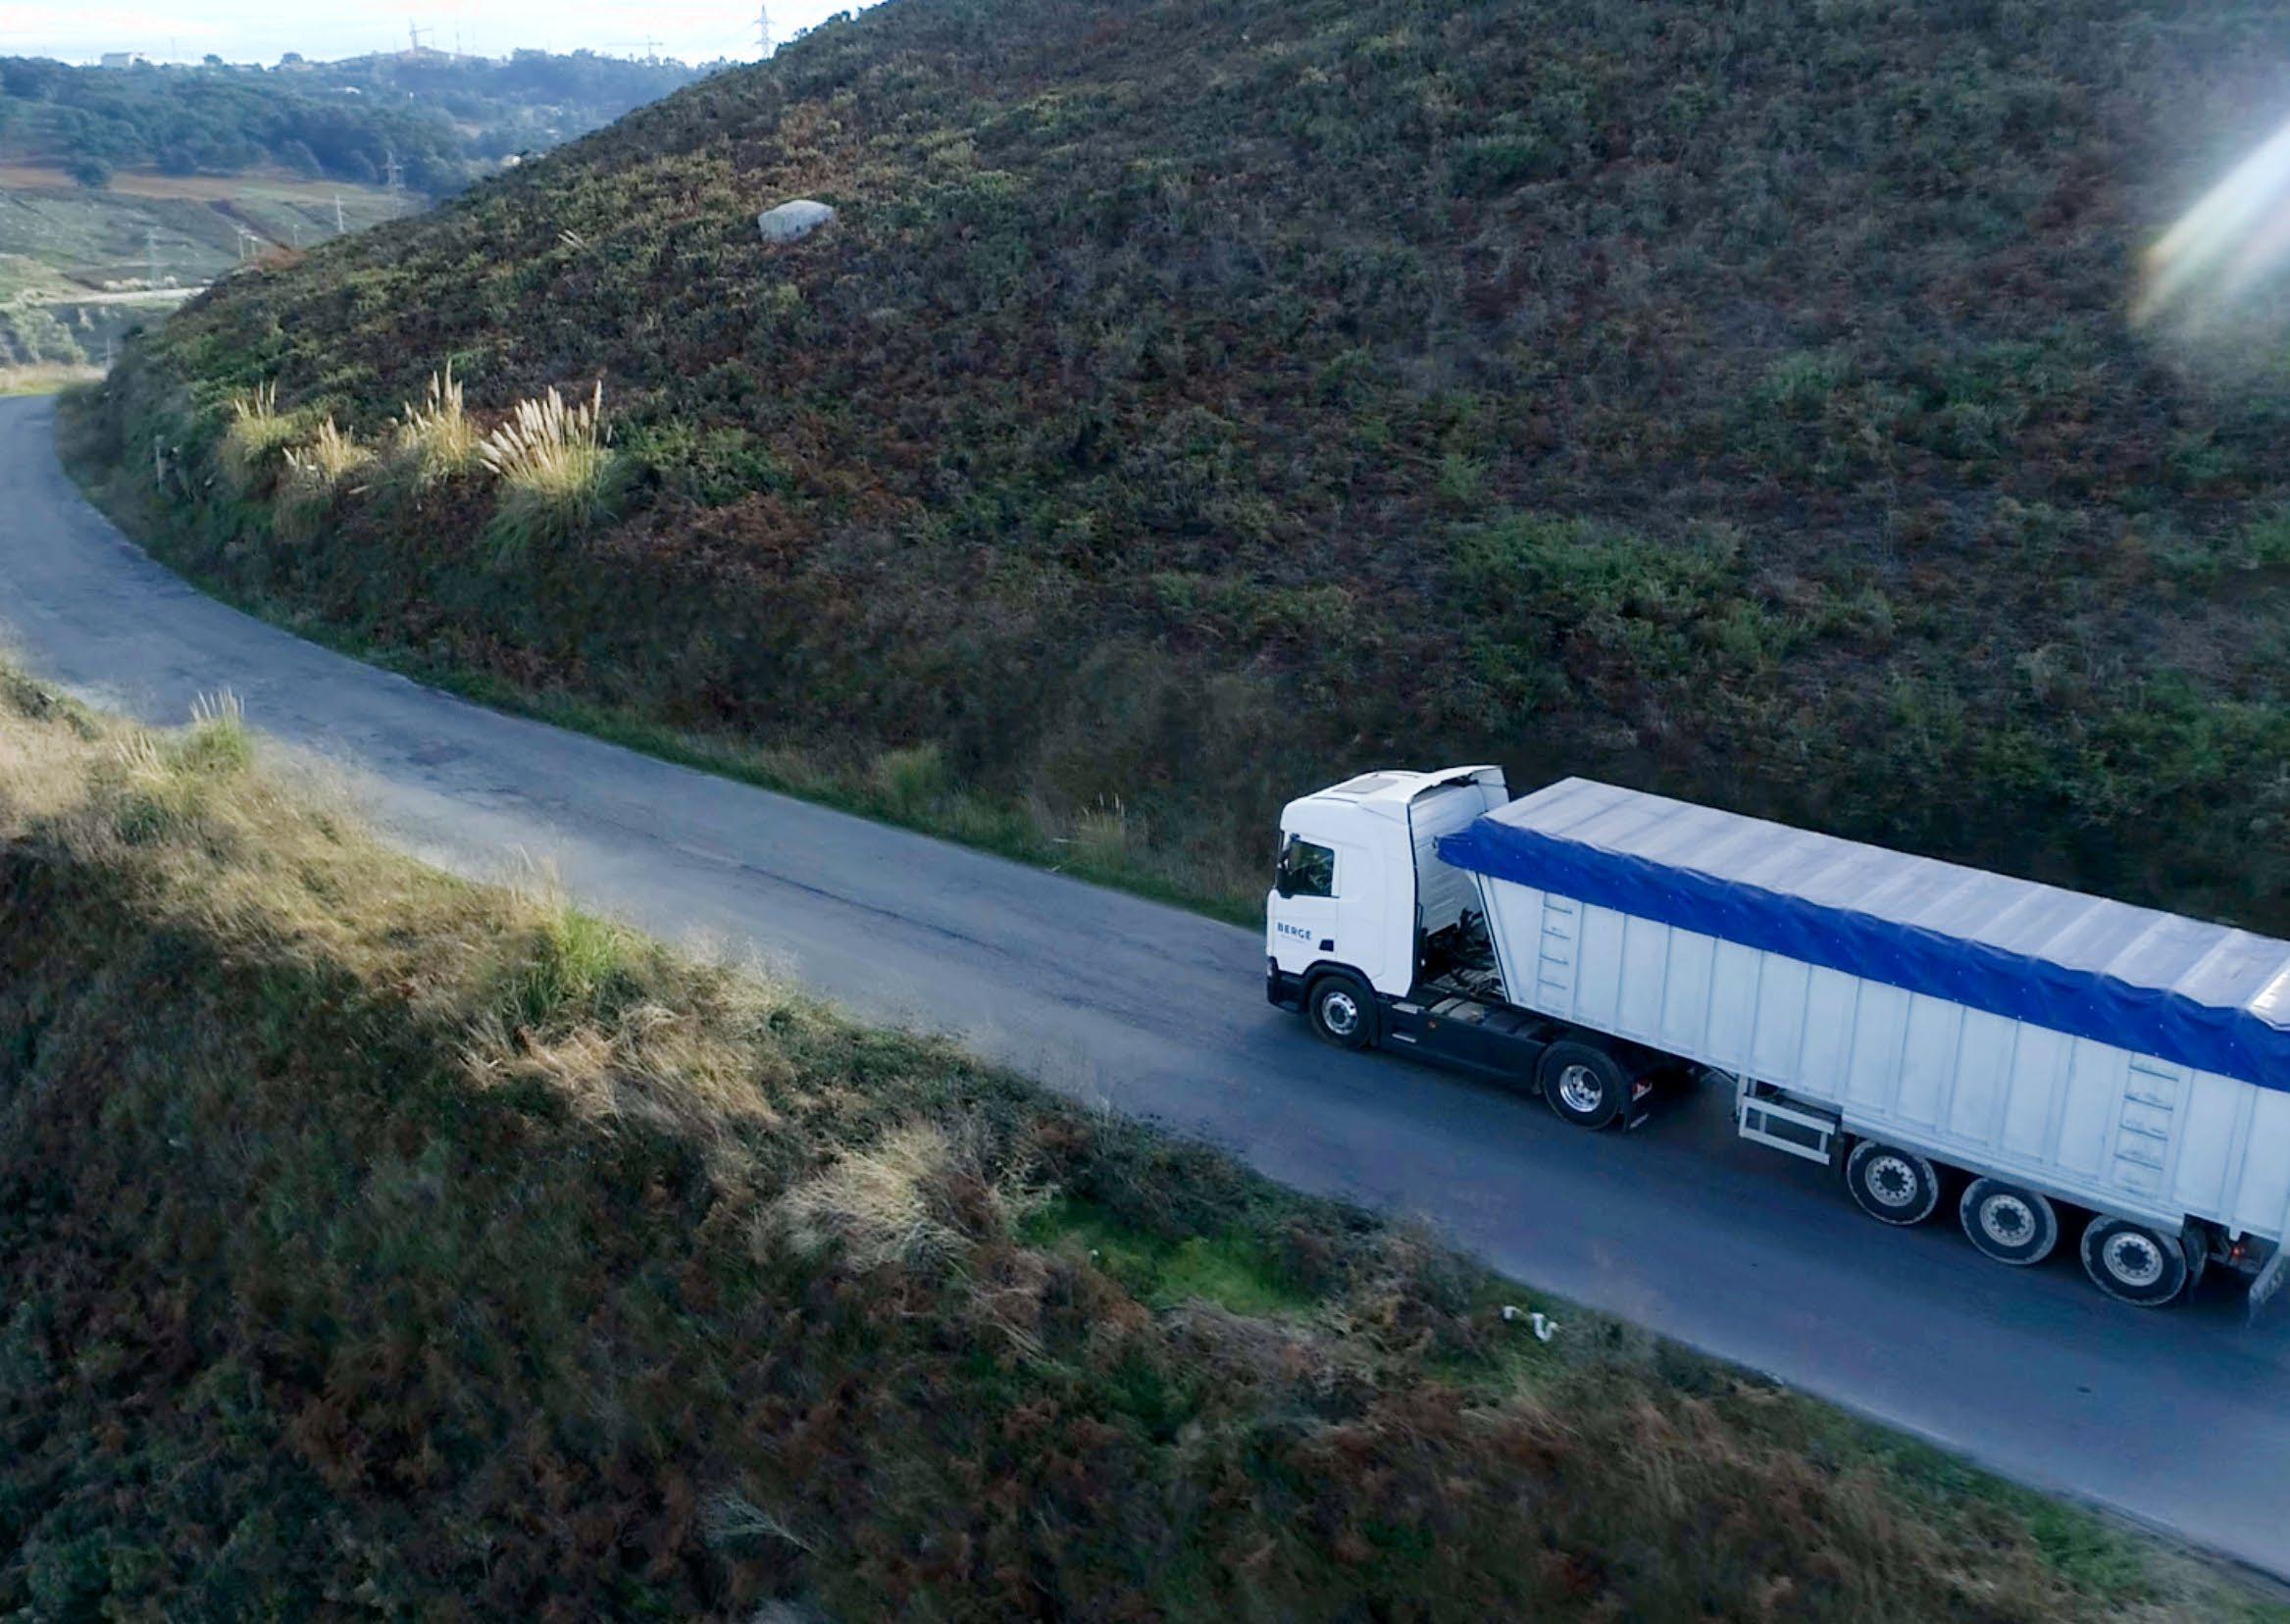
RESPONSIBLE INVESTMENT FRAMEWORK
A.P. Moller Capital’s Responsible Investment Framework (RIF) sets out the company’s overarching approach to responsible investment and defines how it integrates ESG considerations into investment decision-making. The framework reflects a commitment to ‘doing well while doing good’. This means that investments are expected to deliver strong financial returns alongside positive environmental and social outcomes while avoiding or minimising adverse impacts.
The RIF is applied to enhance ESG performance across portfolio companies, reduce and manage environmental and social risks, and strengthen long-term value creation. Consequently, ESG integration is a core part of how A.P. Moller Capital protects and strengthens performance across the portfolio.
The RIF is grounded in A.P. Moller Capital’s Ethical Policy, which is owned by the board and implemented under the board’s oversight. The framework is put into practice through the Environmental and Social Management System (ESMS), which defines how ESG is managed and integrated throughout the investment life cycle. The ESMS sets out the roles, governance and ways of working that guide the ESG team’s involvement. It encompasses screening and due diligence through to ownership and exit, supported by clear processes, requirements, practical tools and templates.
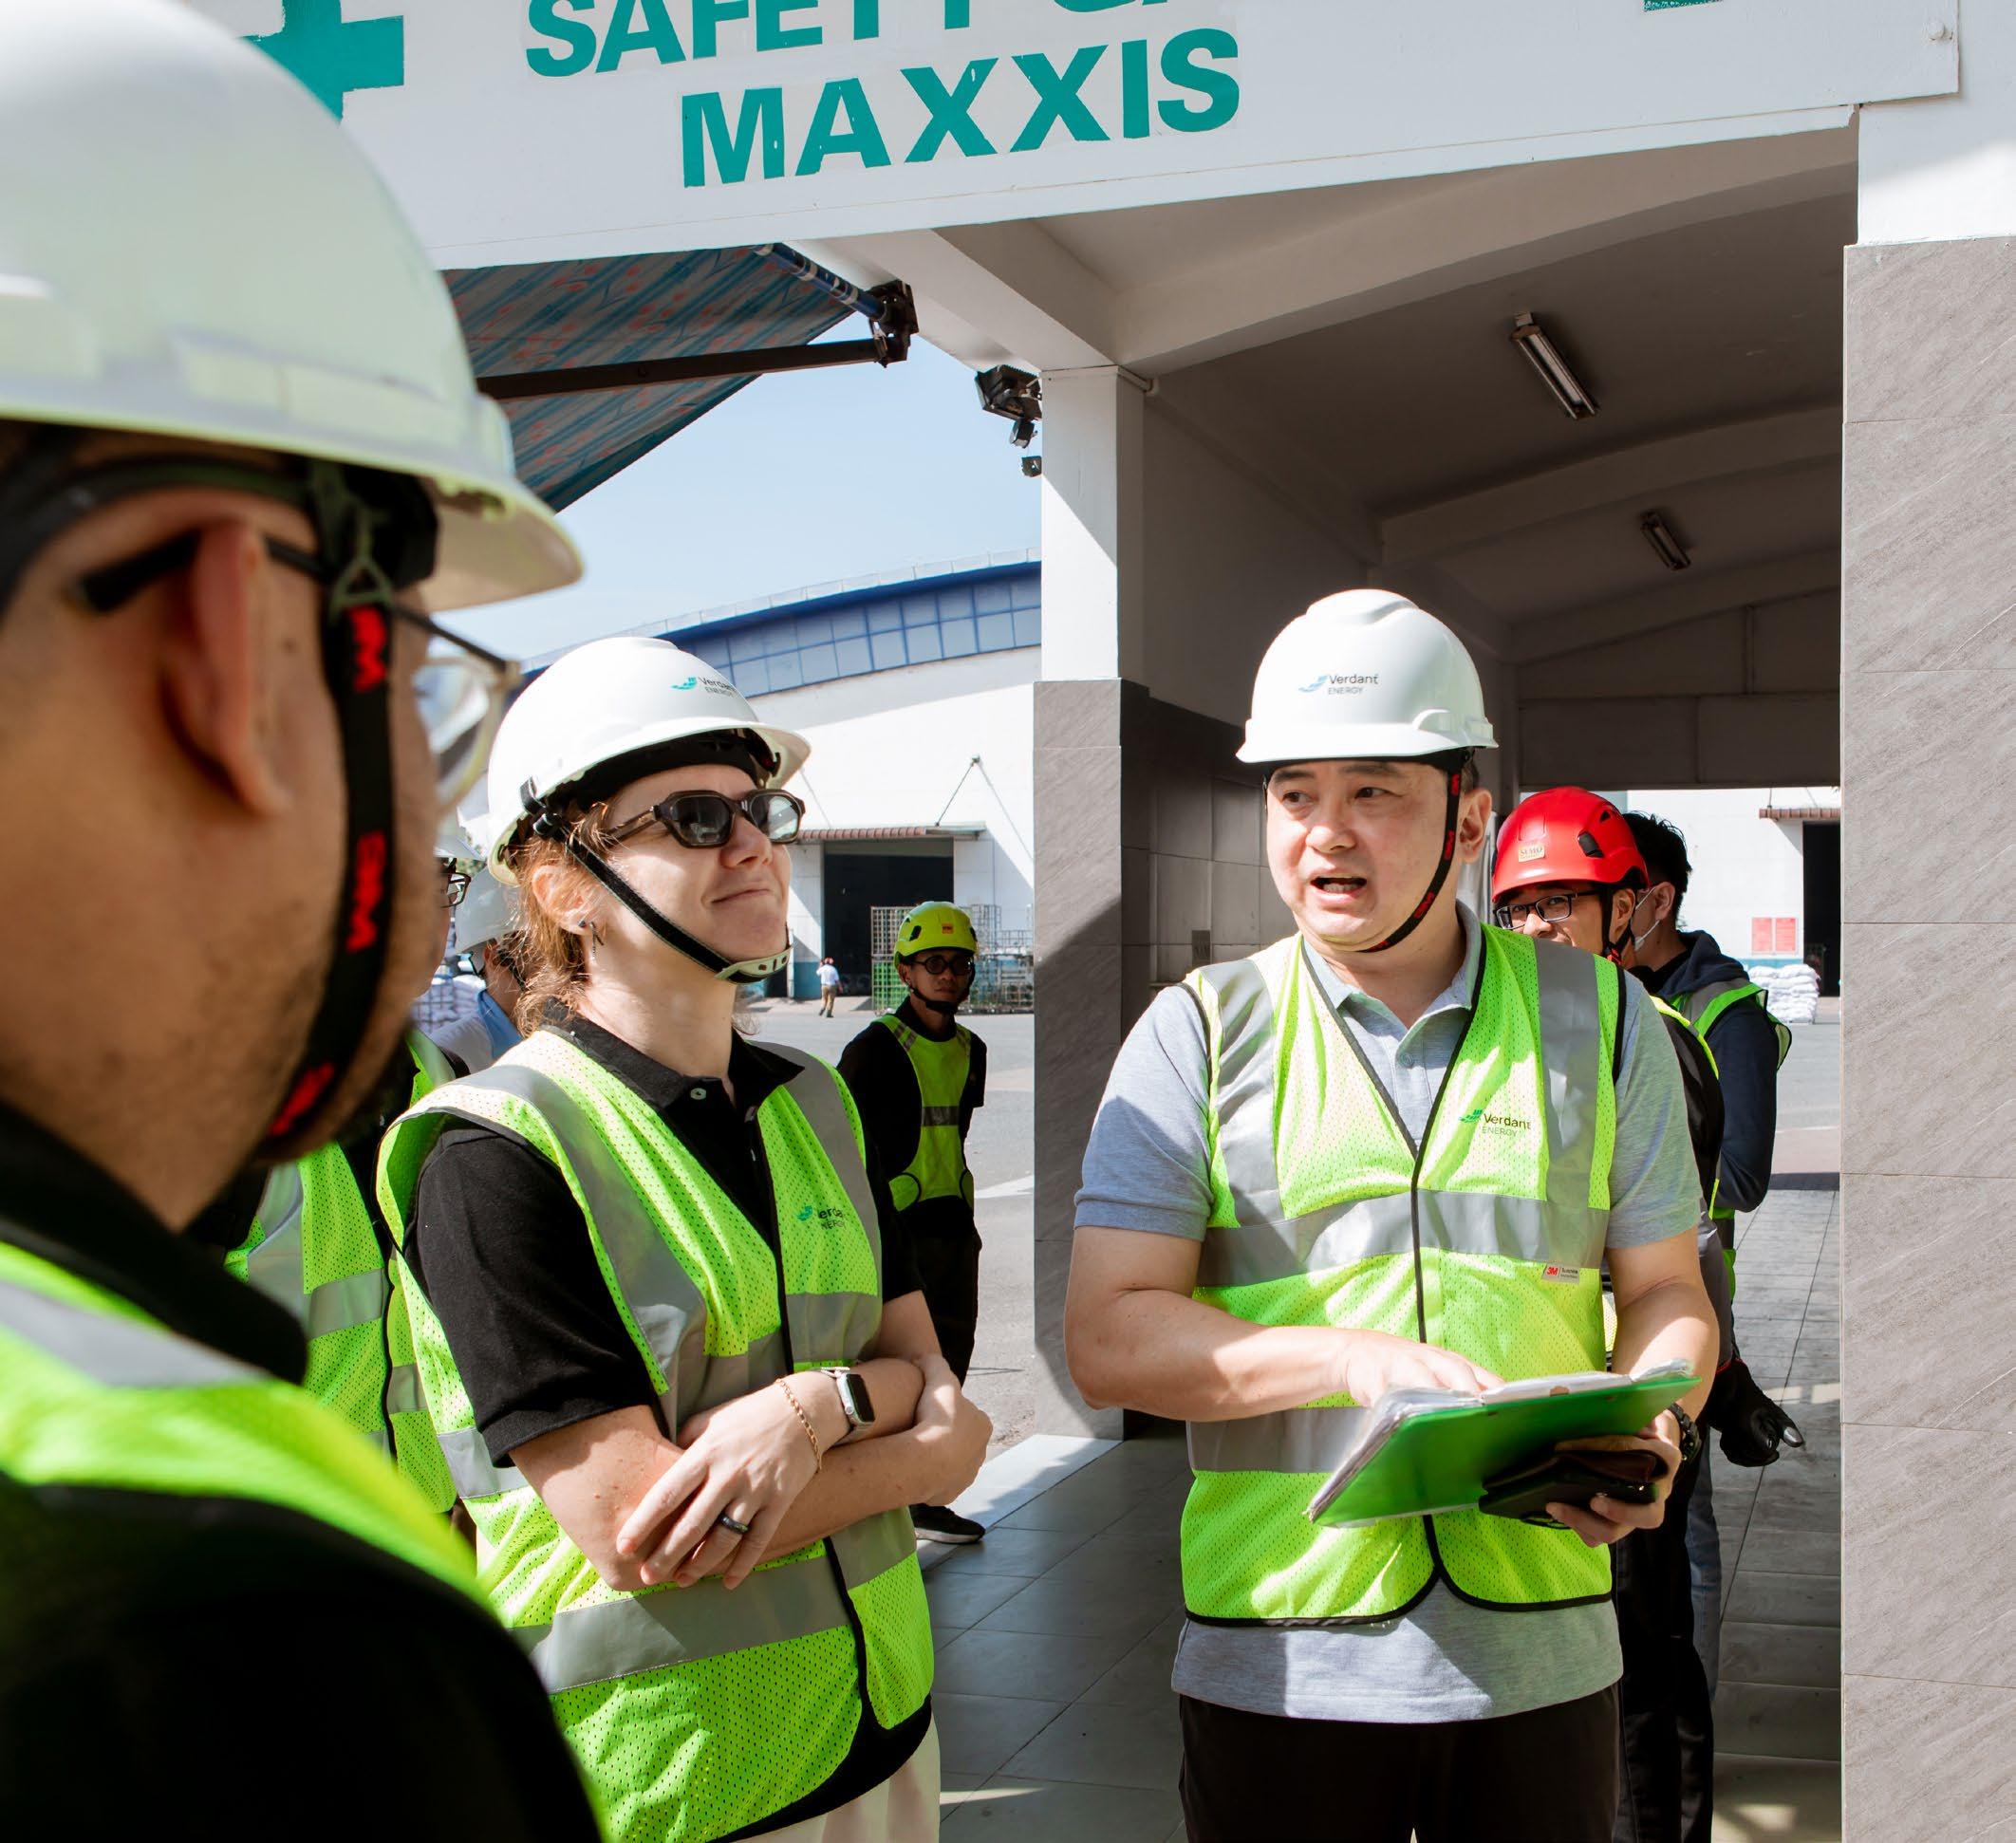
Verdant Energy
GOVERNANCE
To support the effective implementation of the RIF and the integration of ESG alongside commercial and other considerations throughout the investment process, A.P. Moller Capital has established a clear governance structure. As illustrated in the infographic to the right, key functions across the organisation, including the investment team, legal department and senior management, work together to embed ESG principles in decision-making.
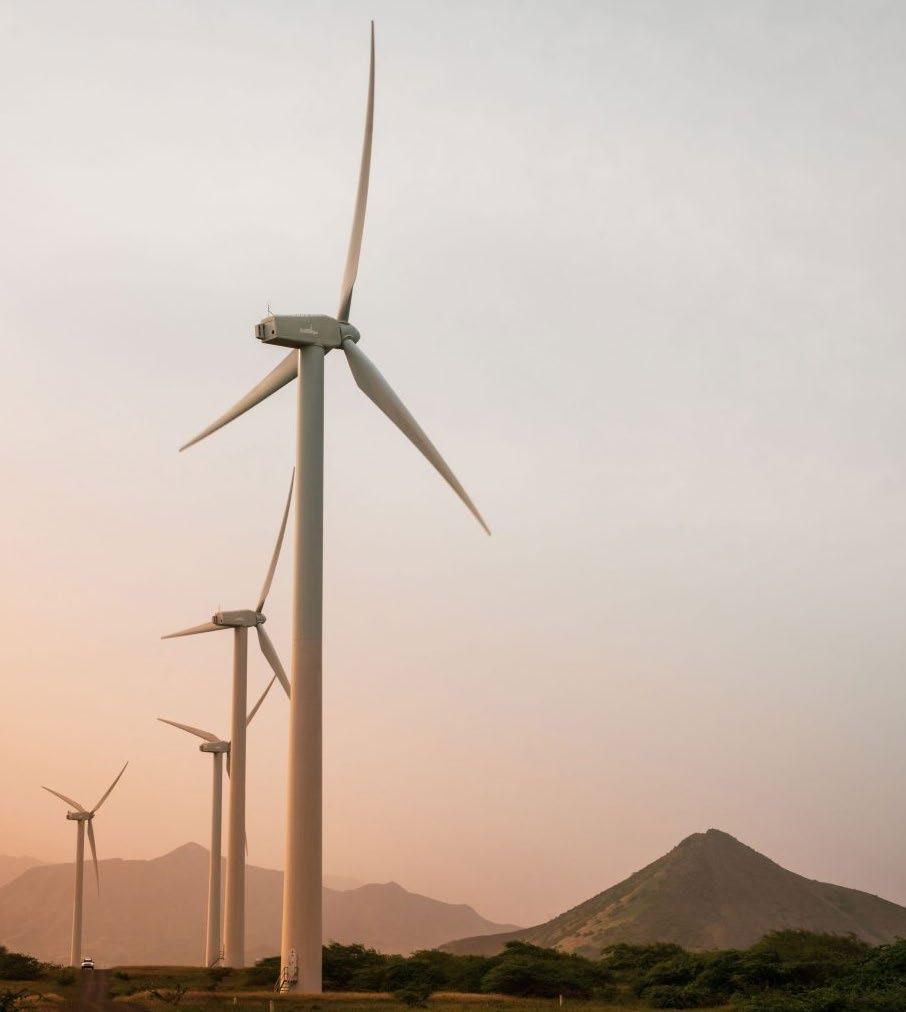
BOARD OF DIRECTORS
is responsible for ensuring compliance with our Ethical Policy.
THE INVESTMENT COMMITTEE evaluates environmental and social due diligence findings and ensures that ESG considerations are taken into account in each phase of the pre-investment process.
THE ESG TEAM is responsible for implementing the Environmental and Social Management System, providing capacity building, and supporting the Investment team during due diligence and portfolio management.
THE INVESTMENT TEAM supports the integration of ESG in accordance with internal policies and procedures, with the support of internal ESG specialists and third-party advisers.
THE RISK & COMPLIANCE FUNCTIONS
provide support to the ESG and Investment teams, ensuring compliance with risk procedures and internal policies.
THE RISK & ESG COMMITTEE oversees and monitors risk and ESG compliance across the organisation. It meets quarterly to discuss risk and ESG matters relating to both the fund manager and the portfolio, including an expanded focus on safety.
Cabeolica
ESG IN OUR INVESTMENT CYCLE
A.P. Moller Capital’s investment cycle follows a structured, multistage process. A formal Investment Committee review at each stage determines whether the opportunity should move forward. ESG considerations are assessed alongside commercial analysis, with defined ESG deliverables required at each stage, as outlined below.
1 6 2 3 4 5
Potential investments first undergo integrity, sanctions and exclusion list screenings to ensure alignment with ethical standards and the investment thesis.
Opportunities that pass the first stage are then screened against applicable ESG requirements and objectives and assigned a preliminary environmental and social risk category. This categorisation guides the depth of environmental and social due diligence, the scope of ongoing monitoring and the design of mitigation measures. It also helps the ESG team assess a company’s ESG maturity and the level of support needed to meet A.P. Moller Capital’s standards.
For transactions that pass initial screening, detailed environmental and social due diligence is conducted to identify ESG risks, including any legacy issues and potential reputational risks. Findings are translated into a binding ESAP. The plan, which is included in the investment agreement, sets out recommended actions to manage identified risks, address gaps and pursue ESG improvement opportunities.
Prior to signing, commitment to A.P. Moller Capital’s ESG requirements is formalised through the shareholders’ agreement (SHA) and the Responsible Investment Code of Conduct (RICC), embedding accountability and continuous improvement expectations.
Post-investment and throughout the holding period, the new portfolio company’s ESG performance is actively managed and improved through regular engagement, monitoring, site visits and quarterly data collection.
At exit, the ESG team works closely with the deal team and portfolio company to position ESG performance as a source of value by demonstrating achieved improvements to prospective buyers. The ESG team also supports buyer due diligence by proactively sharing relevant ESG materials, responding to ESGrelated questions and articulating how ESG initiatives have reduced risk, enhanced resilience and strengthened the long-term investment case.
SAFETY
OUR SAFETY APPROACH: FROM VISIBILITY TO PREVENTION
Across A.P. Moller Capital’s portfolio, worker wellbeing and safety are vital elements of operational resilience and responsible ownership. Over the last two years, A.P. Moller Capital has strengthened incident management, improved data collection and invested in safety technology. The company is now building on this foundation to shift decisively from incident visibility to prevention.
During 2025, the incident reporting and investigation procedure was streamlined, with clearer expectations on the timing and quality of root-cause analyses. Portfolio companies are required to submit investigations for review, enabling A.P. Moller Capital teams to assess not only what happened but also whether proposed corrective actions are likely to be effective. This has increased understanding of lost time injuries (LTIs), near misses and serious incidents.
As the data in the table shows, LTIs and fatalities in 2025 increased in AIF I. In EMIF II, LTIs decreased. However, the number of fatalities tragically increased, with five lives lost in one incident. Reducing this number to zero remains a top priority. Ongoing and additional measures to achieve this are discussed below.
Data and technology upgrades
Stronger incident management has gone hand in hand with better data. More nuanced and detailed reporting has improved risk visibility and assessment, enabling proactive discussions and early engagement with management teams.
Where fatalities or serious incidents occur, A.P. Moller Capital representatives engage directly with portfolio companies to understand conditions on the ground and reinforce the importance of follow-through. Safety is also a standing agenda item at portfolio company board meetings, helping to strengthen oversight and accountability at the highest level.
Analysis of portfolio data has consistently shown that road traffic accidents account for most fatal incidents, particularly in companies with large fleets or transport-intensive operations.
This reflects broader trends in emerging markets, where poor road conditions, limited lighting, weather exposure and mixed traffic significantly increase risk.
As an initial response, A.P. Moller Capital invested in upgrading technology in trucks. Telematics, in-cab cameras and fatigue-monitoring systems generate real-time alerts and have contributed to a reduction in incidents. These tools have also provided valuable insight into driving behaviours and exposure to risk. However, recent incidents have reinforced a critical lesson: technology alone does not save lives.
Turning insight into prevention
The central challenge, and the focus of A.P. Moller Capital’s work in 2026, is converting knowledge into more effective prevention. While the company cannot change external infrastructure, it can influence how portfolio companies manage road safety risks through governance, systems, culture and behaviour.
Building on lessons from technology deployment and incident investigations, the company is increasing its support to ensure these tools are used effectively and consistently. Support includes:
• Journey and route risk management, such as revising routes, limiting or eliminating night driving where risks cannot be adequately controlled, and adjusting delivery models to reduce exposure in high-risk environments.
• Fatigue and behaviour management, reinforced by clear protocols that define how alerts are reviewed, when drivers must stop or rest, and how repeated unsafe behaviours are addressed.
• Clarifying accountability, ensuring that boards, senior management and operational teams understand their respective roles in road safety governance.
• Aligning incentives, so that drivers and managers are rewarded for safe behaviours and compliance with safety standards, not solely for productivity or delivery speed.
These measures inevitably involve trade-offs. In some cases, safer operations may reduce short-term efficiency. As a long-term investor, A.P. Moller Capital assists portfolio companies in making decisions where they materially reduce the risk of serious injury or loss of life.
Road Safety Forum established
To help deliver these changes consistently, A.P. Moller Capital established a dedicated Road Safety Forum. The forum was formally launched following approval of its charter and operates as a governance and oversight body reporting to the A.P. Moller Capital Investment Committee.
The Road Safety Forum’s vision is to embed a culture of zero road traffic fatalities across all transport-exposed portfolio companies. Bringing together ESG, operational and road safety expertise, the forum reviews portfoliolevel trends, commissions targeted interventions where risks are elevated and ensures that lessons learned from incidents are captured and shared in a non-punitive manner. This approach is critical to maintaining trust and encouraging open reporting.
Arise Ports & Logistics
Using leading indicators to shape safety culture
While fatalities are the most severe outcome of safety incidents, they are often preceded by warning signs. Near misses, LTIs, unsafe driving events and fatigue alerts all provide valuable insight into the underlying safety culture.
A key priority for the Road Safety Forum is to make more systematic use of these leading indicators. By analysing trends and patterns, rather than isolated incidents, the forum aims to identify where tolerance for risk may be growing and where early intervention is required. Over time, this encourages a shift from reactive responses to proactive risk management.
Looking ahead
As A.P. Moller Capital’s portfolio grows, so does the responsibility to ensure that robust safety practices are introduced early, consistently applied and continuously improved. The establishment of the Road Safety Forum marks an important step in this journey, providing additional structure, focus and accountability around one of the most critical risks the company faces.
Arise Ports & Logistics
KEG Holdings’ health and safety efforts receive national recognition
KEG Holdings (KEG), a leading liquefied petroleum gas (LPG) group in East Africa, has undergone a significant shift in its approach to health and safety since appointing a dedicated Head of ESG in late 2023. The safety journey was accelerated by several serious incidents in 2024 and 2025. These reinforced the critical need for consistent standards, active oversight and stronger accountability.
KEG operates three core subsidiaries: AGOL and Proto in Kenya, and OneGas in Uganda and Rwanda. Proto is the most operationally complex business due to the use, movement and handling of filled and empty LPG cylinders, and it has accounted for most of the incidents. As a result, much of the health and safety effort has been concentrated there. Meanwhile, groupwide initiatives, particularly around road safety and contractor oversight, are beginning to take hold.
LPG import and distribution
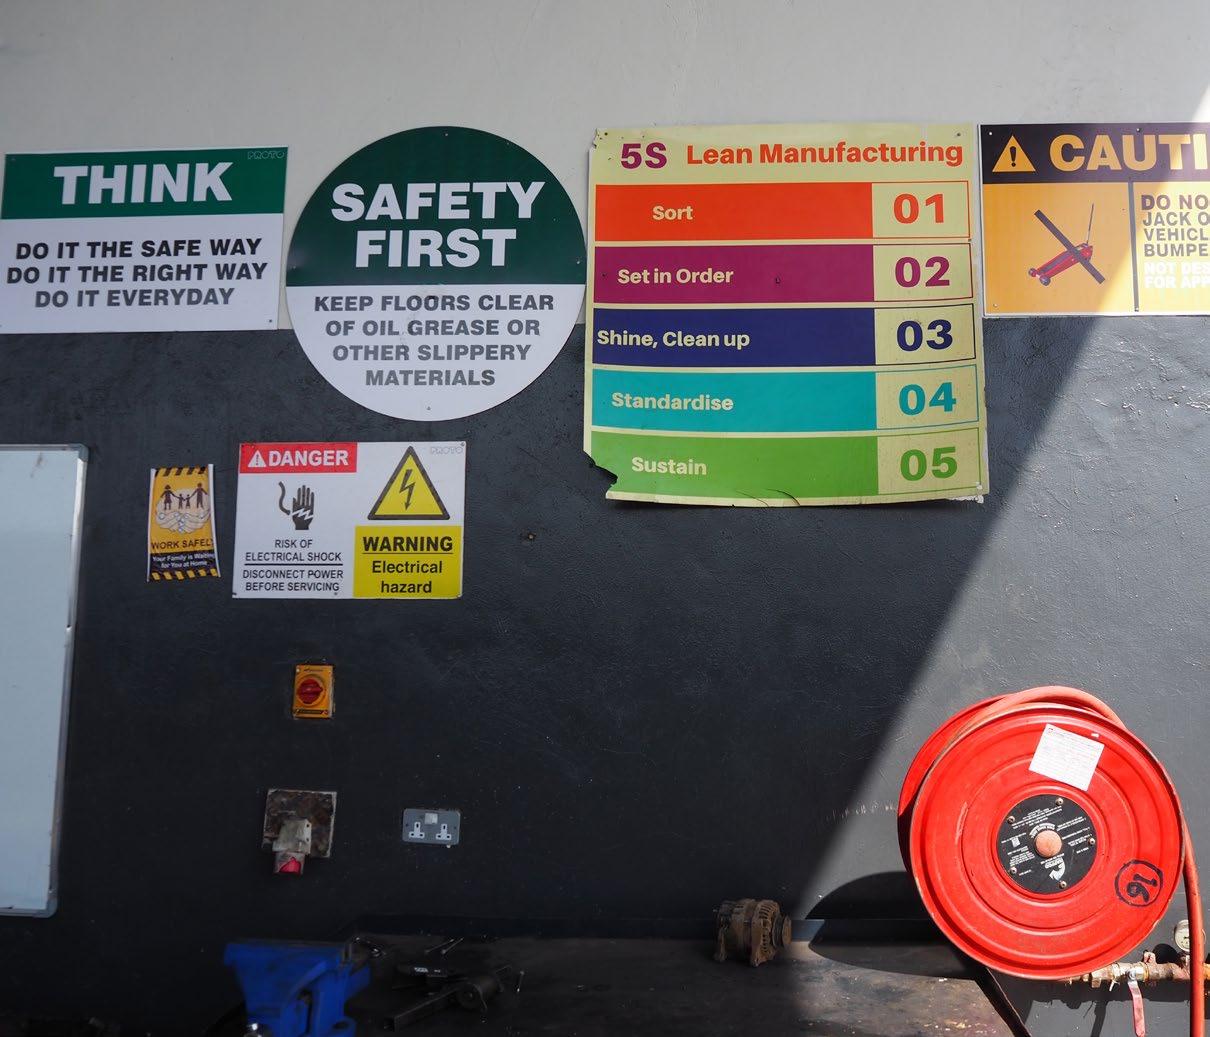
Laying the foundations at Proto
When Aggrey Ganira joined the group as Head of ESG, an appointment that A.P. Moller Capital pushed for as part of its ownership priorities, Proto’s safety department consisted of a small staff employing a largely reactive approach. Over 2024, Ganira introduced a clearer structure, strengthened safety leadership and embedded routine processes that had not previously existed.
A major focus has been on reinforcing safety culture by cultivating awareness and staff engagement. Initiatives such as weekly company-wide ‘safety moments’ and regular safety walk-arounds have helped normalise safety dialogue across all sites. A safety observation card system was also introduced to encourage staff to report unsafe acts and conditions without fear of repercussions. Employees now regularly raise concerns and suggestions, both anonymously and directly, and management actively recognises those who speak up.
These cultural shifts have been accompanied by practical operational changes. At Proto’s plants, improved cylinder-handling procedures have reduced what were once daily incidents to isolated cases. Some months have recorded zero cylinder-related injuries.
On the logistics side, improved journey management, pre- and post-trip vehicle inspections and a new ‘blackout’ policy, which requires retraining for drivers who breach safety rules, have contributed to a marked reduction in road incidents.
Additionally, KEG has upgraded its management systems. It has achieved three health-and-safety-related ISO certifications (45001, 14001 and 9001) and trained internal auditors to monitor compliance across all sites.
Road safety as a group-wide priority
Despite these improvements, road safety remains KEG’s most material operational risk. Following six tragic fatal incidents in 2024 and 2025, KEG engaged a specialist consultant to conduct a comprehensive road safety assessment and develop a group-wide action plan. The recommendations have been incorporated into a group action tracker. They include stronger driver recruitment criteria, higher vehicle maintenance standards and tighter journey management protocols. KEG has already hired a new fleet maintenance provider. It is currently onboarding a third-party driver testing service to conduct assessments during recruitment and periodically during operations.
Harmonising safety practices
Recognising that inconsistent standards had contributed to incidents, KEG has begun to harmonise safety expectations across AGOL, Proto and OneGas. The Head of ESG now convenes weekly meetings for site safety leads and monthly group-wide ESG forums. Training, road safety initiatives and technical safety assessments are delivered across all subsidiaries rather than in isolation. Minimum requirements for contractor induction, supervision, training and vehicle compliance have also been standardised to reduce variability in high-risk activities.
Early signs of progress have been recognised externally. AGOL won Kenya’s national award for safest workplace in the oil and gas sector in 2024. In 2025, Proto secured two national awards across its sites, while AGOL received both second- and thirdplace recognitions in different categories. AGOL also received an AfriSafe regional award in late 2025.
A.P. Moller Capital has played a central role throughout this transition. As chair of KEG’s Board ESG Committee, A.P. Moller Capital’s representatives have consistently pressed for higher standards, supported management and provided tools, such as the group ESG reporting system, that underpin KEG’s monitoring and accountability framework.
A continuous process
KEG acknowledges that its safety transformation is far from complete. Operating in a high-risk environment means that safety is a continuous process that requires sustained attention and leadership. The progress to date demonstrates what is possible when management commitment is matched by active ownership and a willingness to learn from incidents. With A.P. Moller Capital continuing to play an engaged role, including establishing a new Road Safety Forum to encourage knowledge sharing across its portfolio companies, KEG remains focused on building on these foundations, reinforcing safe behaviours and ensuring that safety performance continues to improve.
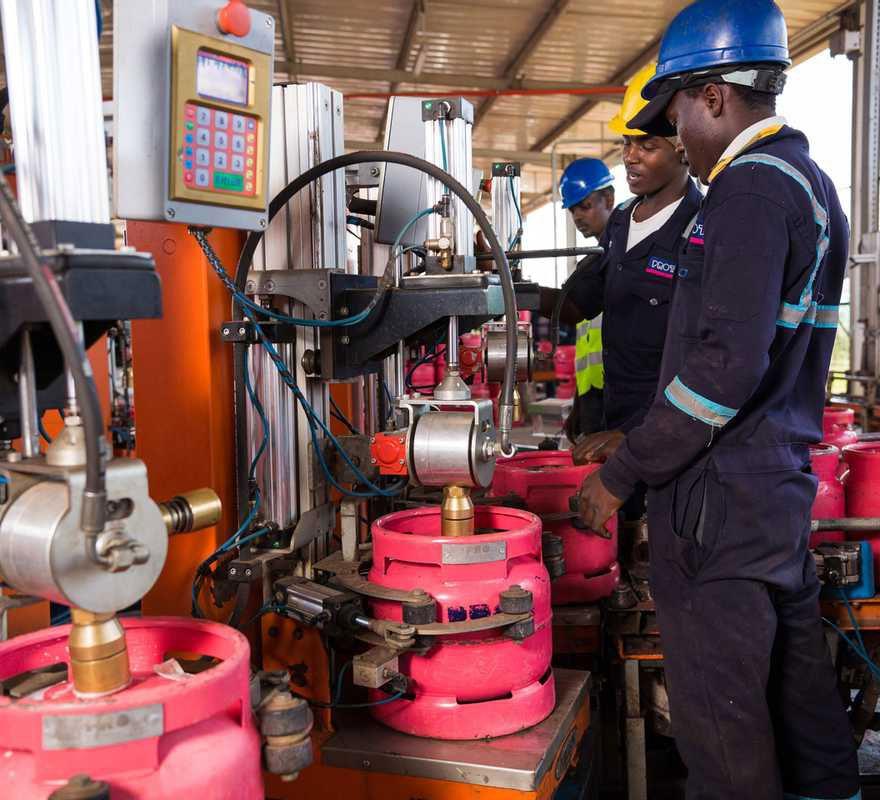
KEG Holdings
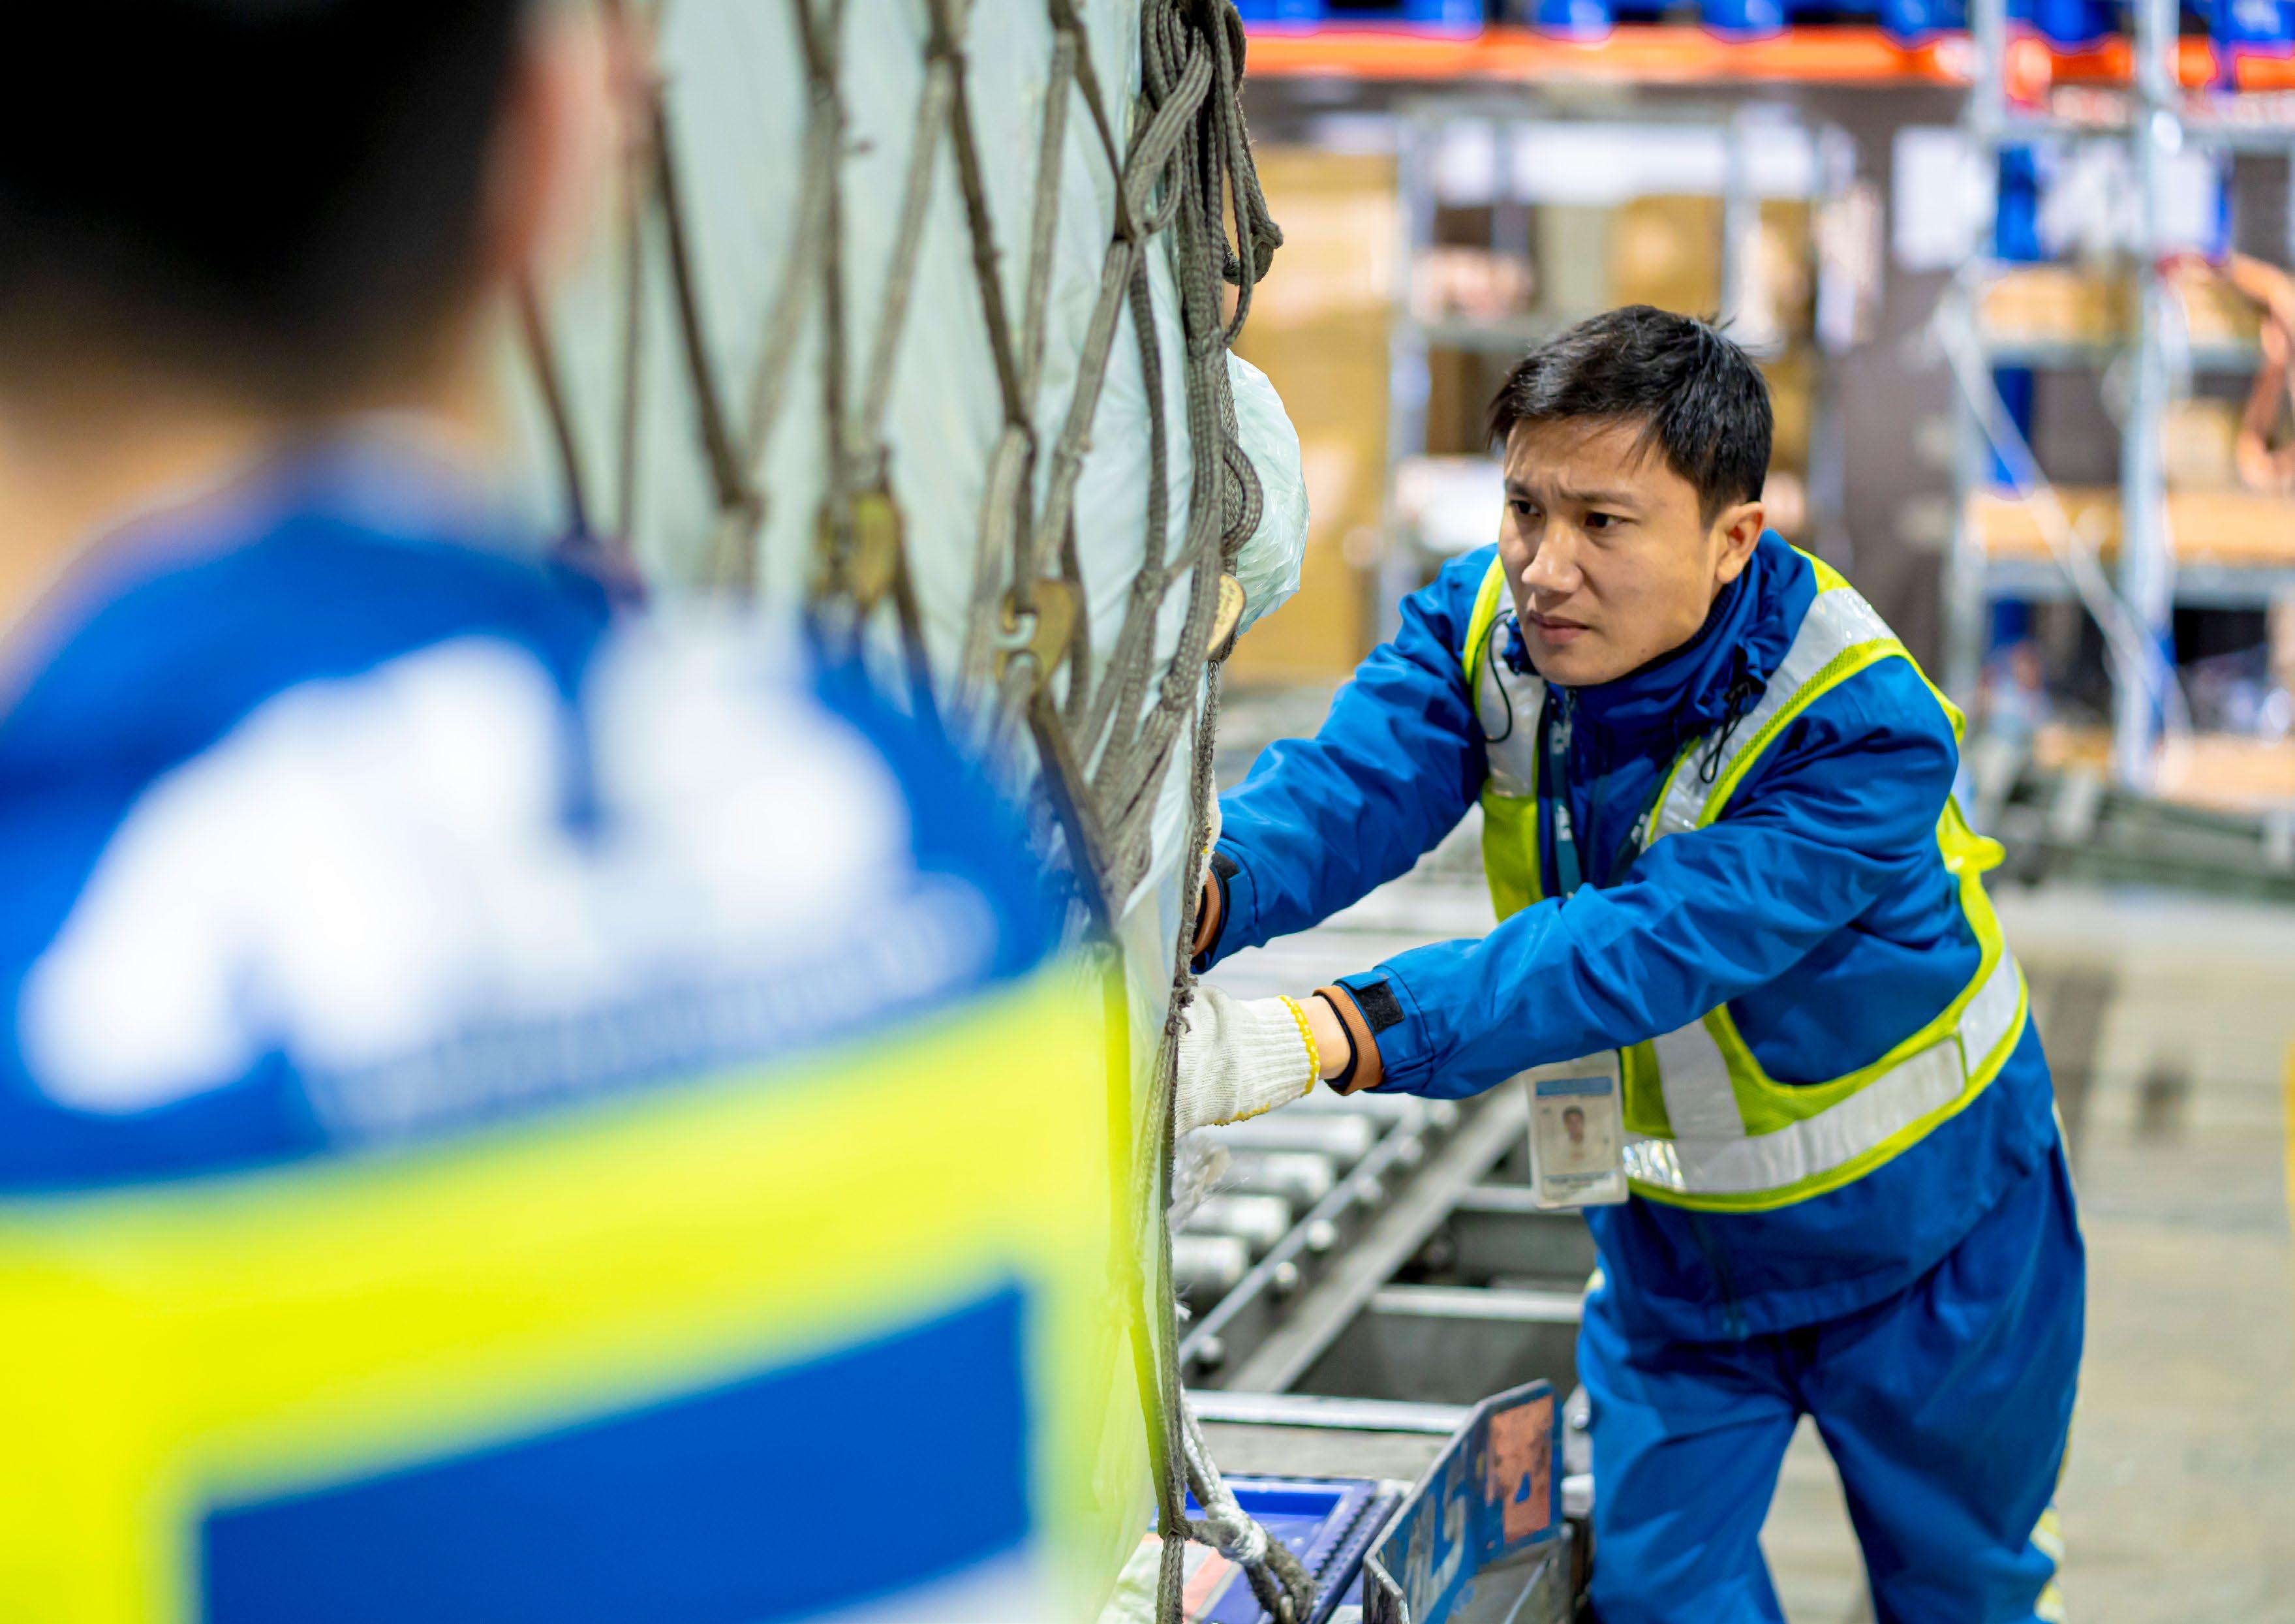
OUR IMPACT
SOCIO-ECONOMIC IMPACT
Job creation and job quality are fundamental to long-term, inclusive growth. By investing in critical transport and energy infrastructure, A.P. Moller Capital and its portfolio companies create stable jobs, strengthen supply chains and enable broader economic activity across their operating markets.
However, estimates by the International Labour Organization3 indicate that around 60% of the world’s workforce, more than two billion people, earns a living through informal employment. While informality exists in all countries, regardless of income level or stage of development, it remains particularly prevalent in developing and emerging economies.
Informal employment often limits workers’ access to essential protections and public services provided by governments. This increases vulnerability in areas such as income adequacy, occupational health and safety, and overall working conditions. At the same time, widespread informality poses broader economic challenges. These include constrained tax revenues and reduced fiscal capacity, which can undermine governments’ ability to invest in social protections and public services.
Against this backdrop, supporting the creation of formal, decent jobs through the companies A.P. Moller Capital invests in is critical. The portfolio’s contribution to jobs in 2025 exemplifies A.P. Moller Capital’s role in providing stable employment. Across the two funds, portfolio companies provided 19,151 direct jobs, including 4,709 held by women, and supported an estimated 176,141 indirect jobs across supply chains and local economies. They also generated $674m in direct value added and enabled an estimated $1,470m in additional economic activity.
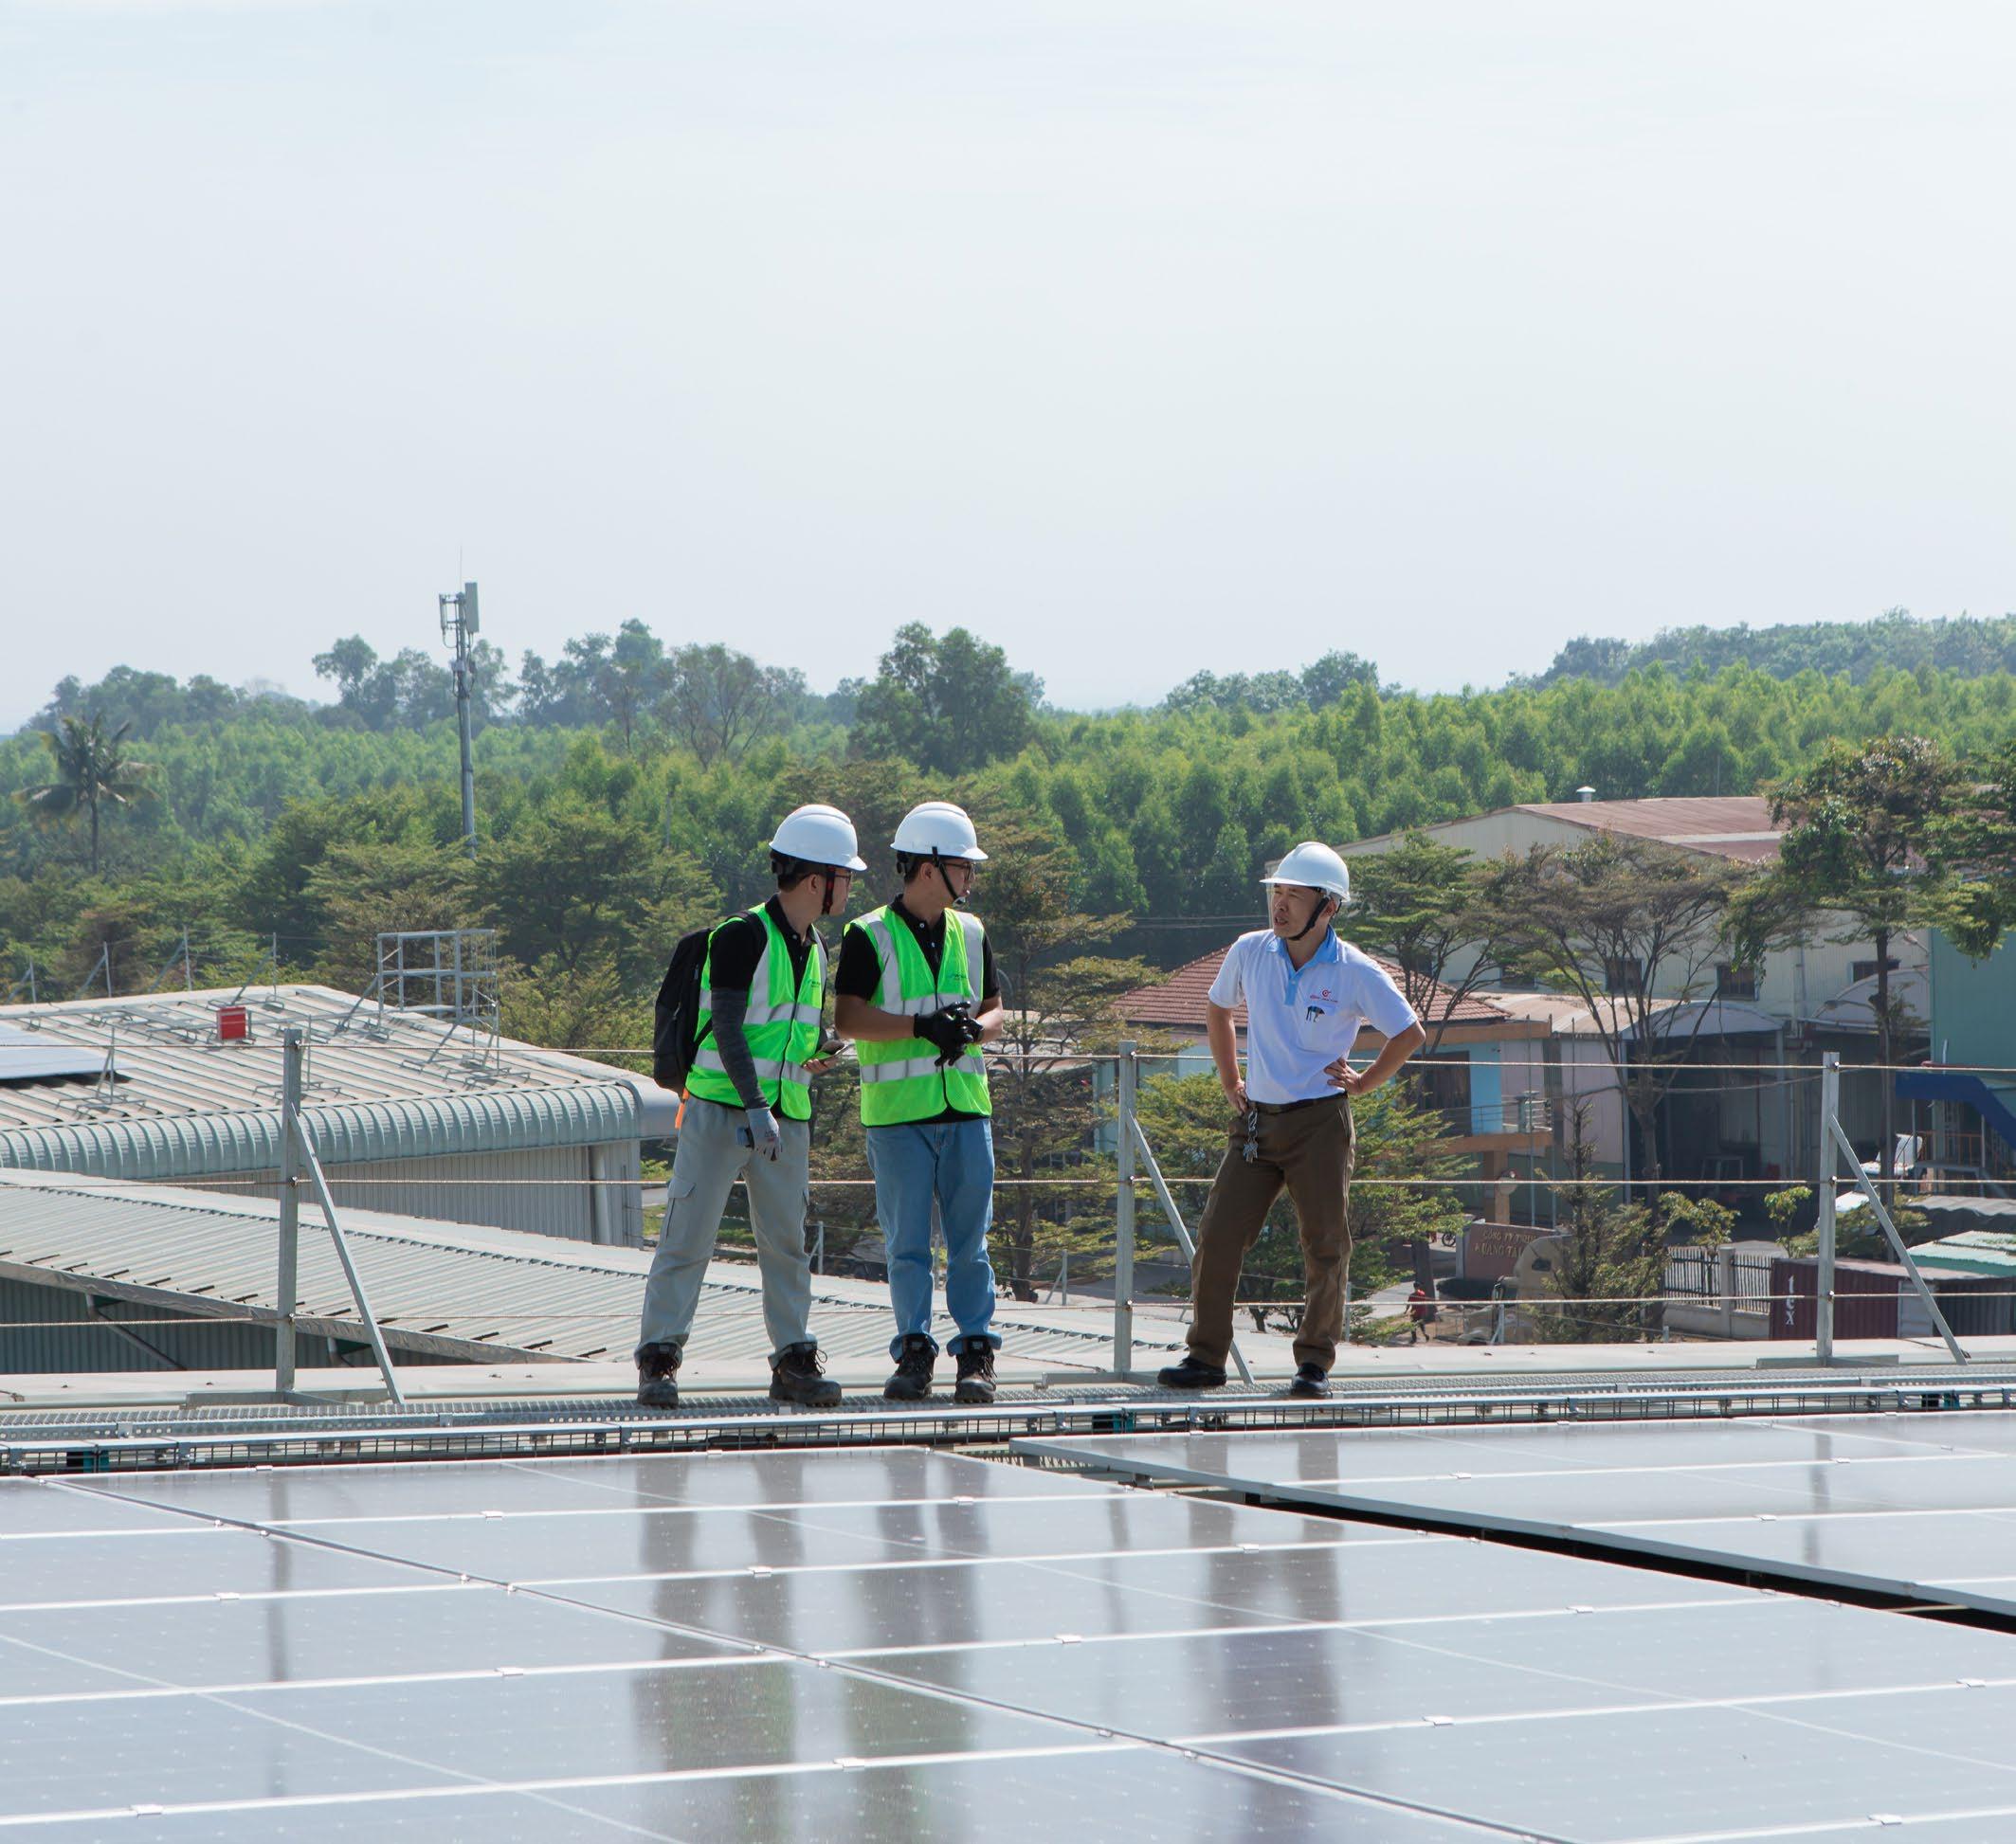

HOW WE MEASURE AND REPORT IMPACT
To understand the broader socio-economic effects of A.P. Moller Capital’s investments, the Joint Impact Model (JIM) is used. In an effort to streamline impact measurement and reporting, several international finance institutions have aligned on approaches to indirect impact modelling. Today, the JIM is a widely used tool by development finance institutions, multilateral development banks, asset managers and commercial banks to assess portfolio-level impact.
Utilising input data such as revenue and power production from investment portfolios, the JIM provides a way to estimate financial flows through the economy and its resulting economic (value added), social (employment) and environmental (greenhouse gas emissions)4 impact. An example of how socio-economic impact is assessed in practice is provided on page 26.
A.P. Moller Capital uses the JIM to report on the following impact indicators:
• Direct jobs: impacts at the portfolio company.
• Supply chain jobs: impacts at the portfolio company’s suppliers and their suppliers, as well as downstream actors (e.g. distributors, transporters).
• Induced: impacts associated with the spending of wages earned by employees of the portfolio company, its suppliers and the suppliers’ suppliers.
• Power enabled: impacts associated with the additional output generated by companies using the additional power generated by the client project, as well as by the companies’ supply chain.
In 2025, the JIM underwent an external quality assurance review and an update of macroeconomic statistics, strengthening the model’s reliability. Further details on the methodology are available here
195,292
Enabling industrial and export diversification in Côte d’Ivoire
Côte d’Ivoire’s export economy remains highly concentrated in agricultural commodities, limiting resilience to price volatility and external shocks. While the country has significant mineral and industrial potential, the ability to scale low-value bulk exports has historically been constrained by port capacity, handling efficiency and logistics costs. Targeted logistics infrastructure, through the Terminal Industriel Polyvalent de San Pedro (TIPSP), addresses these constraints and enables industrial expansion, export diversification and regional integration.
the construction value chain. Under an illustrative pass-through scenario, TIPSP-enabled cost reductions correspond to approximately 5,300 jobs and $27mn in GDP by 2030.
• Fertiliser imports: TIPSP removes capacity constraints and reduces transport and logistics costs by nearly 20%, strengthening agricultural input supply. Under an illustrative full pass-through scenario, fertiliser-related cost reductions correspond to approximately 2,700 jobs and $14mn in GDP by 2030.
Mineral and general cargo port terminals
TIPSP represents a structural upgrade to Côte d’Ivoire’s bulk logistics system. The terminal is operated by ARISE Ports and Logistics, which became an A.P. Moller Capital portfolio company in 2020. By providing deepdraft access, mechanised handling, buffer storage and dedicated industrial berths, TIPSP enables larger vessels, faster turnaround times and more reliable operations compared to legacy multipurpose infrastructure.
Enabled economic impacts
A study commissioned by A.P. Moller Capital and carried out by QBIS assessed the socio-economic impacts enabled by TIPSP across export, import and regional transit flows.
• Nickel ore: Exports existed prior to TIPSP; the port’s contribution is incremental. Based on an estimated 12% reduction in transport and logistics costs and established trade elasticities, TIPSP is estimated to enable around 8% of total nickel-related impacts, equivalent to approximately 2,000 jobs and $11mn in GDP by 2030.
• Manganese ore: Prior to TIPSP, exports were physically constrained by port capacity. TIPSP enables scale-up rather than displacement. By 2030, manganese exports facilitated by TIPSP are estimated to support approximately 47,100 jobs and $254mn in GDP, representing the full socioeconomic impact of this export flow.
• Cementitious cargo: Lower import costs for clinker and related inputs improve purchasing power across
• Iron ore transit: TIPSP enables San Pedro to function as a regional bulk export corridor. By 2030, iron ore exports facilitated via TIPSP are associated with approximately 22,700 mining jobs, $79mn in GDP and $251mn in export revenues in Mali and Guinea. While production value accrues outside Côte d’Ivoire, transit volumes generate domestic value added through port handling, logistics services and coordination, positioning San Pedro as a regional gateway.
Strategic significance
Taken together, these impacts demonstrate that TIPSP’s contribution extends beyond port operations. By lowering logistics costs, improving reliability and removing capacity constraints, the terminal strengthens upstream mining activity, supports downstream industrial users, enhances agricultural productivity and increases household purchasing power through lower input prices.
From a broader perspective, TIPSP illustrates how targeted logistics infrastructure can unlock economic value well beyond the port perimeter. Rather than relying on subsidies or price support, the terminal improves competitiveness through lower trade costs, greater reliability and scale. This positions Côte d’Ivoire to diversify its export base, strengthen industrial linkages and build resilience to external shocks, while simultaneously supporting regional economic integration across West Africa.
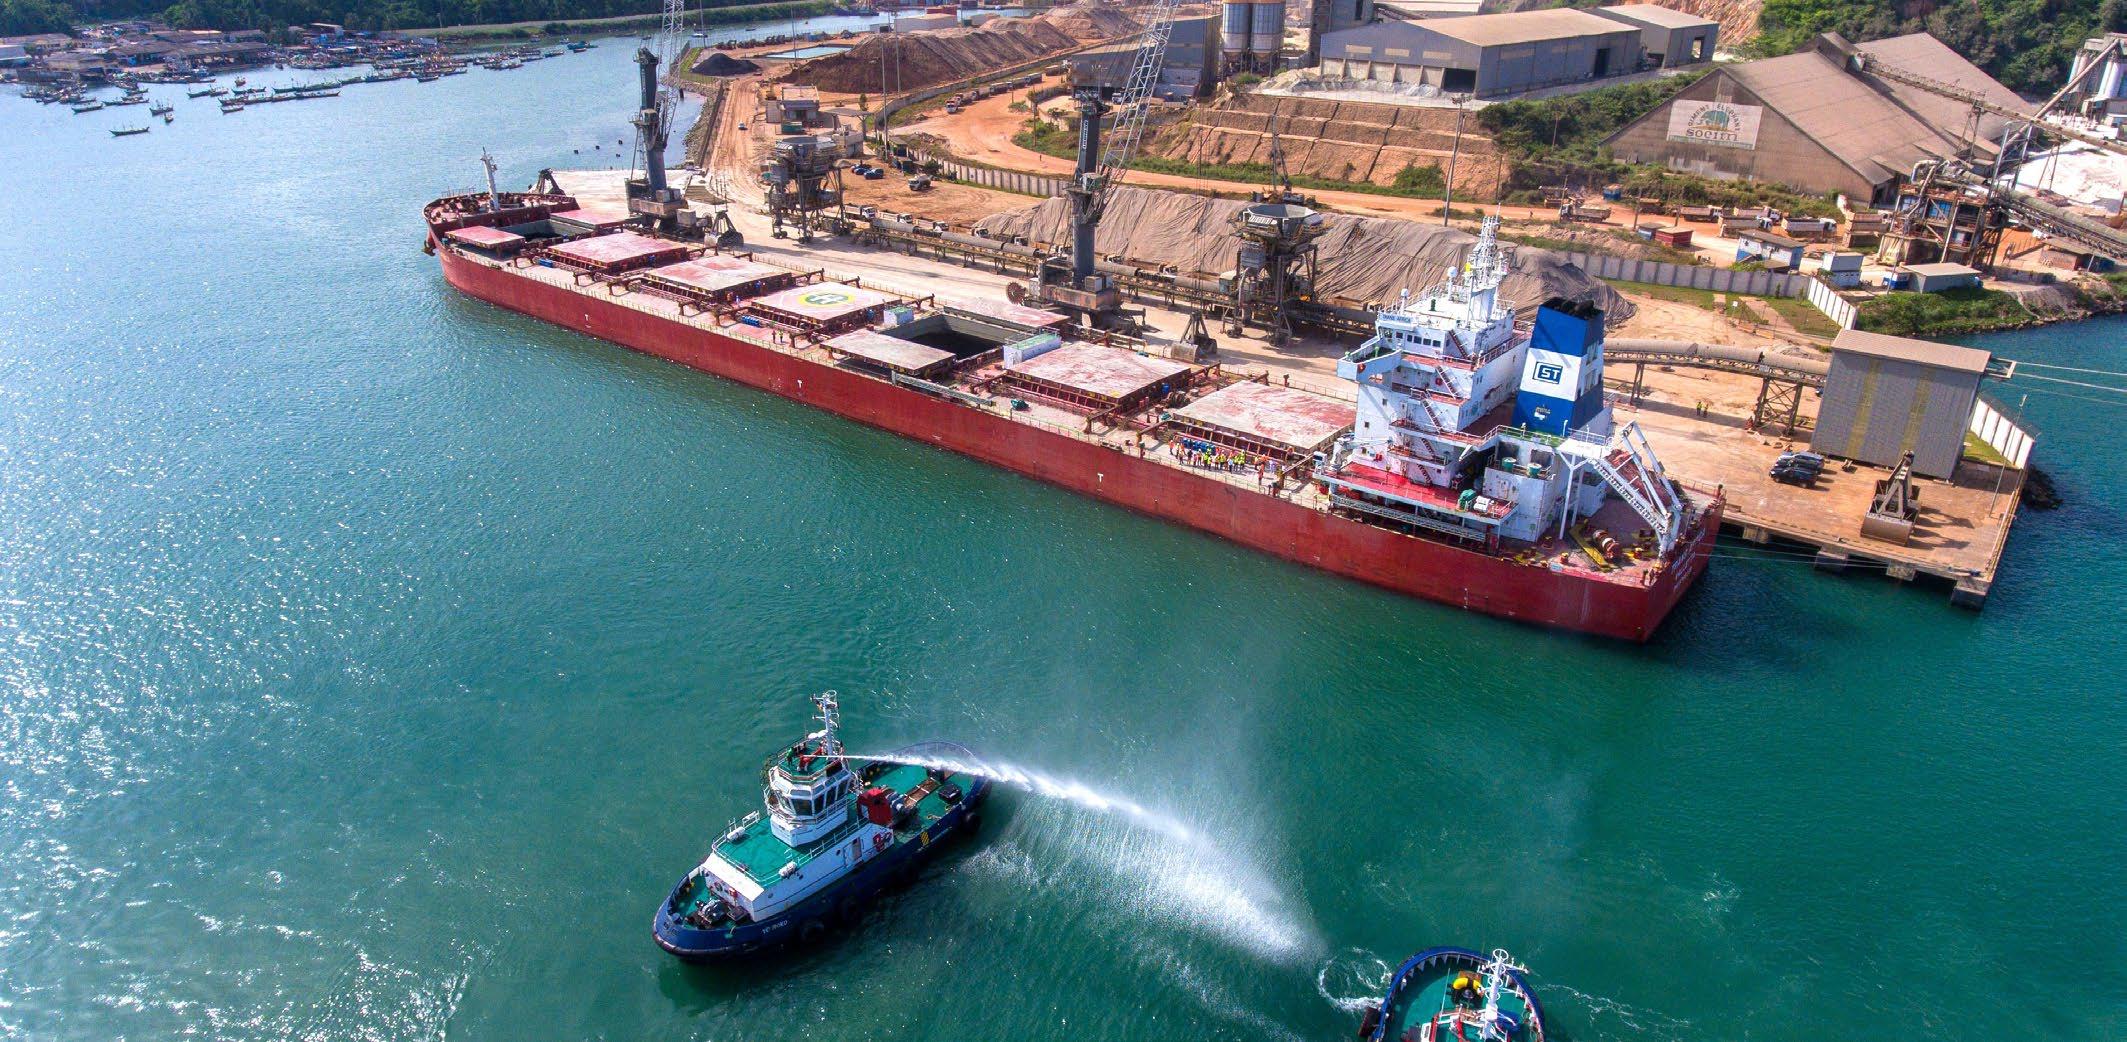
TIPSP reduces port handling costs, eliminates most expected demurrage, and enables larger, more efficient vessels, lowering total transport and logistics costs by around 12%. For nickel, this strengthens competitiveness and enables roughly 8% of total impacts. For manganese, TIPSP removes binding capacity constraints, enabling structural export scale-up and substantially larger jobs and GDP effects.
TIPSP in the global metal ore supply chain
Arise Ports & Logistics
ENVIRONMENTAL IMPACT
As an infrastructure investor in the transport and energy sectors, A.P. Moller Capital recognises that its portfolio includes assets that are emissions intensive. At the same time, these assets provide essential services that underpin economic activity, energy security and connectivity. The company’s approach is therefore focused on managing climate risks and reducing emissions responsibly over time, while considering local policy, infrastructure and market realities.
In AIF I, emissions remained relatively stable, with only a small increase in scope 1 and a small decrease in scope 2. In EMIF II, both scope 1 and scope 2 emissions decreased. This is in line with EMIF II’s commitment to reduce scope 1 and scope 2 emissions by 25% during the fund’s lifetime. The decrease reflects the implementation of targeted decarbonisation measures across the fund’s high-emitting transport and logistics portfolio, as well as continued progress by portfolio companies against their decarbonisation plans. Two companies, Vector Logistics in Southern Africa and HAUL’s asset CACC Cargolinx in Egypt, have set science-based net-zero targets and are actively implementing these to deliver on their emissionsreduction targets.
Where the implementation of decarbonisation measures sits outside a company’s direct operational control, best-in-class asset design can play an important role in lowering emissions over time. This is the case for HAUL’s YANMU East Cairo Logistics Park, where assets are leased to third parties. The facilities have been designed to high environmental standards, including Excellence in Design for Greater Efficiencies (EDGE) green building standard certification from the International Finance Corporation (IFC). By embedding resource efficiency and lower-carbon design choices from the outset, these
assets deliver ongoing operational benefits and have supported access to sustainable finance. A detailed case study, including the financing benefits achieved, is provided on page 30.
A.P. Moller Capital recognises that, even with robust decarbonisation strategies in place, some emissions will remain in the near to medium term. This is particularly the case in markets where lower-emission alternatives are not yet widely available, or where electricity grids are still carbon-intensive, reducing the impact of electrification.
In line with an avoid–reduce–mitigate hierarchy, A.P. Moller Capital prioritises avoiding and reducing emissions first. Where emissions cannot yet be
eliminated, it makes selective use of high-quality carbon credits as a complementary measure, with a strong focus on environmental integrity and alignment with broader development objectives. Pages 32–33 highlight one of the projects from which A.P. Moller Capital has purchased carbon credits.
Finally, A.P. Moller Capital continues to consider climate-related risks as part of its climate strategy and investment approach. As an infrastructure-focused investor, both physical and transition risks can directly affect asset resilience and operational performance. In 2025, the company continued to strengthen its climate risk assessments across the portfolio, aligned with the recommendations of the Task Force on ClimateRelated Financial Disclosures (see page 34).

Green building certification unlocks sustainable finance for YANMU East Cairo Logistics Park
Warehousing & logistics
A.P. Moller Capital, through EMIF II, is supporting the transition to sustainable infrastructure across highgrowth economies. In Egypt, this strategy is embodied by HAU Logistics, a joint venture between A.P. Moller Capital and Hassan Allam Utilities. One of its flagship developments, YANMU East Cairo Logistics Park (ECLP), has achieved EDGE Advanced certification from the IFC. The certification demonstrates how green logistics infrastructure can deliver environmental benefits while meeting the requirements for sustainable finance
ECLP is a large-scale, grade-A logistics development serving Egypt’s expanding consumer and industrial markets. The park comprises an area of approximately 270,000 m2, with 160,000 m2 of leasable space. It includes six warehouses serving eight tenants, among them global corporations such as Amazon, DHL Express and Pepsi. Total investment in the development amounts to approximately EGP 3.05bn, positioning ECLP as one of the most significant modern logistics parks in the Greater Cairo area.
EDGE Advanced certification
Three warehouses at ECLP achieved EDGE Advanced certification in late 2024. EDGE is a green building standard developed by the IFC, part of the World Bank Group, to promote resource-efficient buildings in emerging markets. To qualify, projects must demonstrate at least 20% savings in energy, water and embodied carbon in materials compared to a local baseline. The Advanced level recognises projects that exceed 40% energy savings.
At ECLP, the three certified warehouses delivered average savings of 49% in energy use, 53% in water use and 59% in embodied carbon in materials. These results reflect a combination of design-stage and construction-stage decisions made with sustainability in mind.
Energy savings were achieved through measures such as lighting activated by motion sensors, optimised windowto-wall ratios suited to Egypt’s hot climate, and reflective roof and wall finishes that reduce cooling demand.
Water savings were driven by low-flow faucet fixtures and dual-flush systems in bathrooms, along with an absence of water-intensive landscaping. Reductions in embodied carbon were achieved through careful material selection, such as the buildings’ cladding, and avoiding unnecessary layers in warehouse flooring.
Three additional warehouses are expected to achieve EDGE Advanced certification by the end of 2026 as tenants complete their fit-out works, further expanding the park’s portfolio of certified green assets.
Linking certification to sustainable financing
ECLP’s EDGE Advanced certification played a central role in securing EGP 1.5bn in financing from Commercial International Bank (CIB), Egypt’s leading private-sector bank. The loan was extended under CIB’s green financing framework, developed in collaboration with the IFC. Under this framework, projects that meet EDGE standards are eligible for a 2.8% cashback on construction loans.
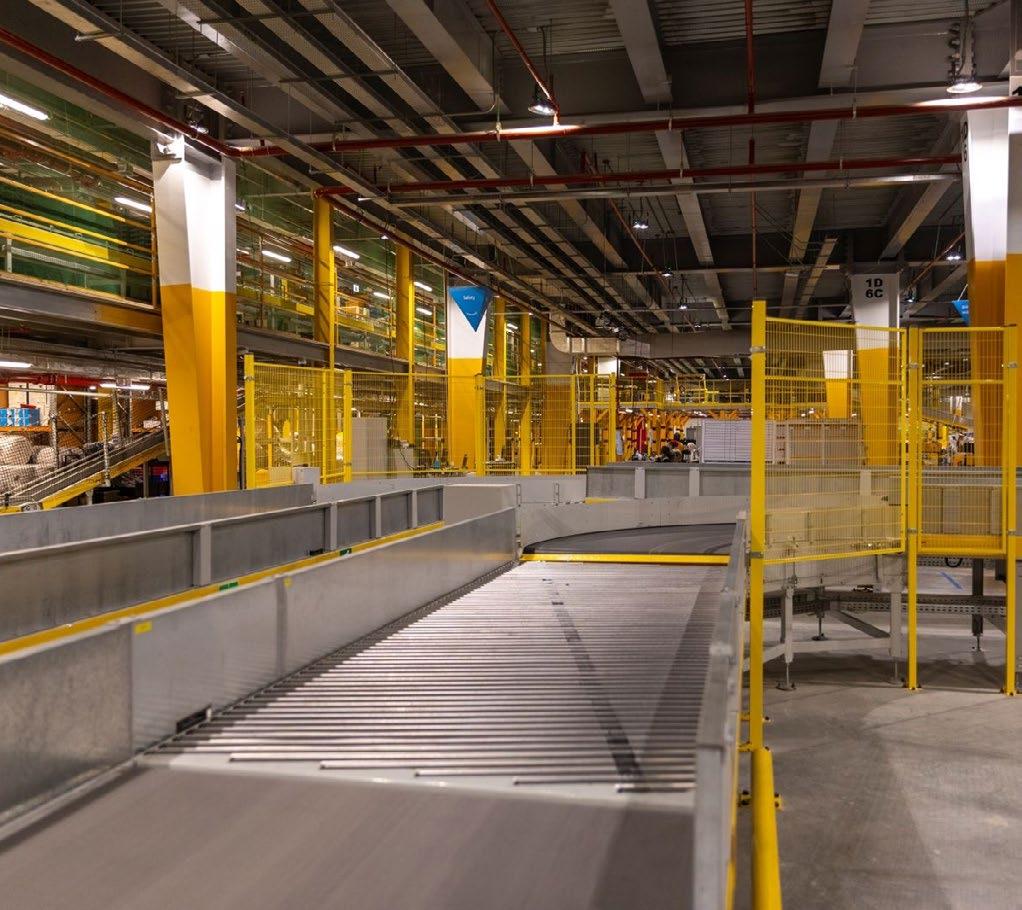
HAU Logistics
This mechanism directly links verified sustainability performance to financing terms, effectively lowering the cost of capital for certified green infrastructure.
Beyond financing, certification has strengthened ECLP’s market positioning. As the first logistics warehouses in Egypt to achieve EDGE certification at this scale and quality, the park has enhanced its attractiveness to multinational tenants seeking efficient, future-proofed and environmentally responsible facilities. Certification has become a commercial differentiator, supporting occupancy and lease value in a market with limited supply of grade-A, green warehousing.
A model for climate-smart infrastructure
For A.P. Moller Capital, ECLP aligns with EMIF II’s focus on building investment-grade infrastructure that delivers measurable environmental impact alongside strong commercial fundamentals. The achievement of EDGE certification is a tangible outcome of the shared commitment to decarbonisation and resource efficiency between A.P. Moller Capital and Hassan Allam Utilities.
As Egypt advances its climate and energy-efficiency agenda, ECLP shows how internationally recognised green building standards can enhance competitiveness and accelerate the transition to climate-smart infrastructure. The project offers a model for how certification, financial innovation and long-term asset value can be aligned in emerging markets’ logistics and industrial sectors.
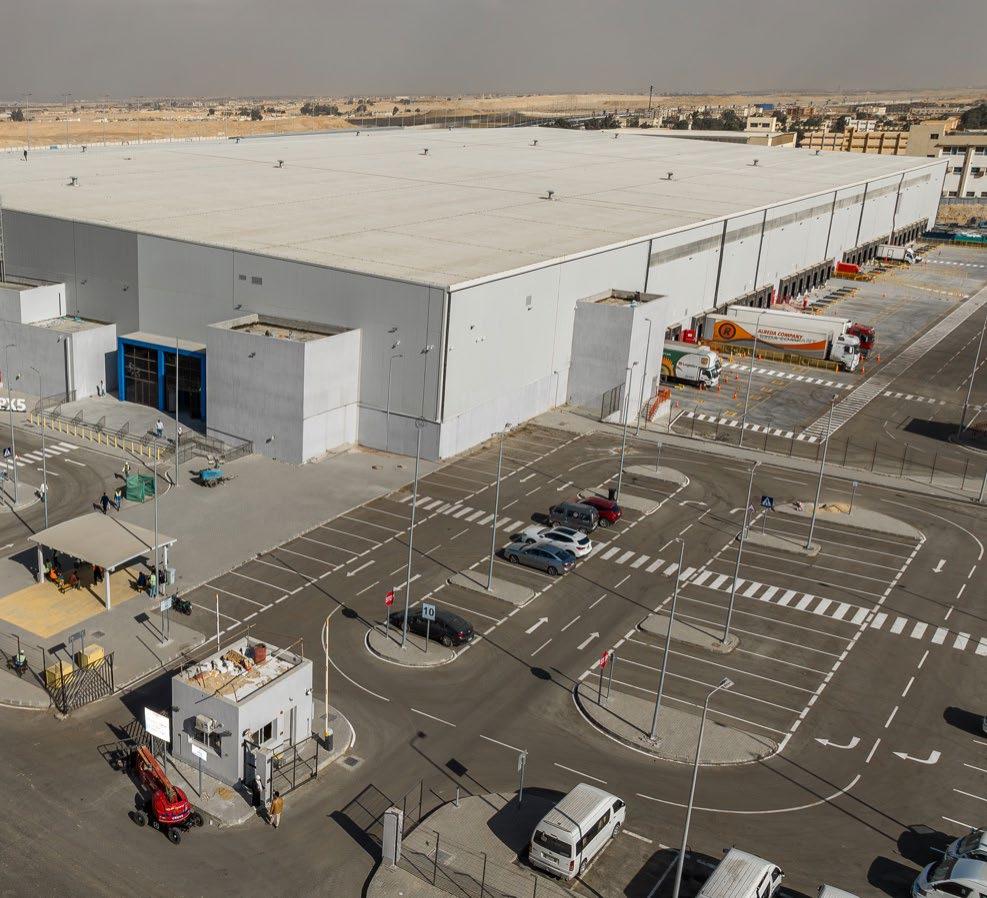
HAU Logistics
Private finance mobilises nature-based climate solutions in Rwanda
As part of a commitment under EMIF II, A.P. Moller Capital seeks to deliver positive environmental impact by prioritising emissions avoidance and reduction. Where this is not feasible, the fund offsets residual scope 1 and 2 emissions by purchasing nature-based carbon removal credits. While the primary focus of offsets is on mitigating emissions associated with the fund’s investments, this approach also mobilises private capital for climate action in emerging markets, including large-scale restoration projects with verified environmental and social benefits.
To implement this commitment, EMIF II procures carbon credits through Abatable, a specialised carbon credit procurement platform that helps source, evaluate, purchase and monitor high-quality credits. In 2024, A.P. Moller Capital signed a voluntary emission reduction purchase agreement (VERPA) to buy credits from the Rwanda Riparian Restoration Project. The project is managed by ClimatePartner, which provides corporate carbon accounting and reduction services, together with EcoPlanet Bamboo and local authorities, who are responsible for on-the-ground implementation.
Restoring Rwanda’s fragile watersheds
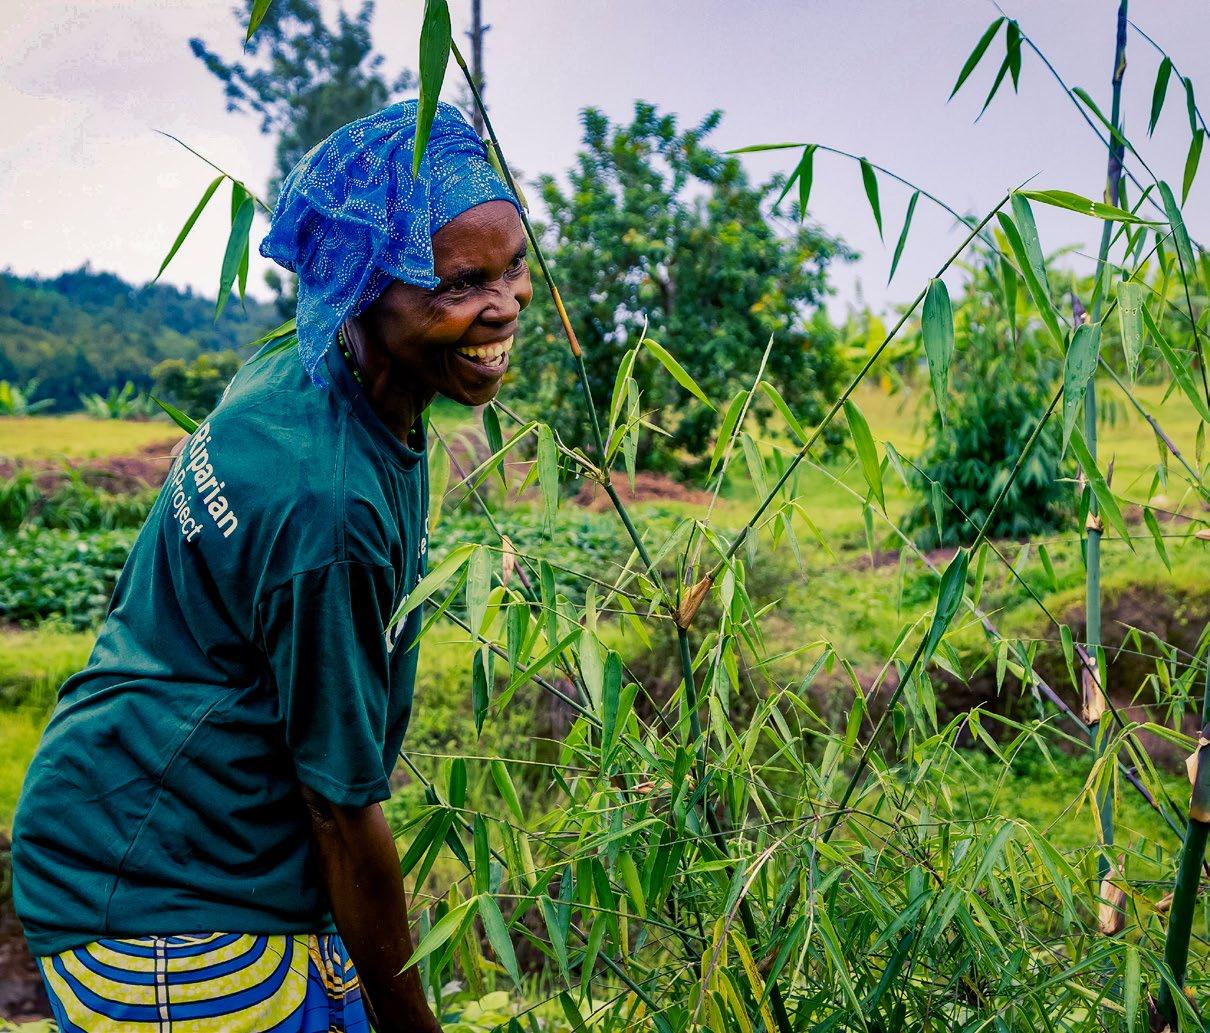
Rwanda’s hilly terrain, dense population and intense rainfall patterns make soil erosion a persistent threat to rural livelihoods. Many smallholder farmers, who often cultivate plots of one hectare or less, face declining yields as heavy rains strip topsoil and reshape riverbanks.
The Rwanda Riparian Restoration Project is addressing these challenges by planting non-invasive bamboo along 1,000 km of vulnerable riverbanks and buffer zones. Bamboo is well suited to these landscapes. It grows quickly and develops deep root systems that stabilise soils, while also sequestering significant amounts of carbon. This dual function enables the project to generate verified carbon credits. Verra, a non-profit organisation that manages the world’s largest voluntary carbon market standard, provides final certification of carbon credits, ensuring international standards are met.
The project builds on a successful 2019-2021 pilot that confirmed strong bamboo growth rates and community demand. ClimatePartner provided early-stage finance to launch the initiative, with EMIF II joining as a carbon offtaker for the duration of the project. Between 2022 and early 2023, EcoPlanet Bamboo and local communities planted roughly 200,000 seedlings across the first 500 km of buffer zones. A total of 400,000 seedlings will be planted across the 1,000 km project area.
Climate impact and community engagement
The first monitoring cycle took place in mid-2024. Field teams measured sampling plots – counting bamboo stems, recording diameters and assessing mortality –to produce a detailed report of bamboo biomass and carbon sequestration. This has been verified by a third party and is now being finalised for submission to Verra. Verified carbon credits are expected to be issued on a two-year cycle starting in 2026 and are contracted to amount to 264,792 tonnes CO2e to 2031.
Although carbon is the primary measurable environmental metric at this stage, some bamboo stands have already reached two metres in height and root systems are becoming established. Quantifying the impacts of this growth, such as reduced erosion and improved water quality, requires a longer timeframe. These impacts will be evaluated through the project’s Sustainable Development Verified Impact Standard (SD VISta). To complement Verra’s carbon-focused methodology, SD VISta verifies social and environmental outcomes aligned with the SDGs.
Community engagement is a defining feature of the project as well as a requirement under Verra and SD VISta. Monthly meetings in each village enable ongoing dialogue, ensuring concerns are addressed and local knowledge feeds into project management. Because the bamboo planting sites are located in remote valleys with limited road access, most workers are recruited locally. In 2023 alone, the project engaged nearly 500 workers, around 115 of whom hold permanent roles.
Social-impact initiatives
Alongside its role as a carbon offtaker, EMIF II provides an annual budget for social impact initiatives. This enables the project to pursue SD VISta certification and deliver benefits beyond carbon. ClimatePartner develops an annual impact plan in consultation with communities and reports on progress to A.P. Moller Capital twice a year.
In 2024 and 2025, activities focused on two priority themes identified by villages:
• Food security and regenerative agriculture
Smallholders often rely on a single annual harvest, leaving them vulnerable to pests and climate variability. In response, the project established a seven-hectare agroforestry cooperative using multilayered ‘edible forest’ systems. Incorporating a variety of perennial plants that return year after year, these systems are designed to produce a variety of foods and to be largely self-sustaining once established. Any surplus can be sold locally, generating income.
• Improved access to clean water
Several remote communities lacked a reliable drinking water supply. The project constructed four new water taps to provide safe access for households that previously relied on long walks to unprotected water sources. Monitoring of one of these taps between October 2022 and April 2025 indicates that 490 people have increased access to clean water. This number is estimated to rise to at least 1,000 people over the project lifetime. Monitoring of the remaining taps is ongoing.
The project’s model, namely high-integrity climate finance coupled with strong community partnership, has clear potential to scale within Rwanda and beyond. However, restoration projects like this are often too large and too long term to be financed through conventional loans or public funding alone. Private capital, such as that provided by A.P. Moller Capital, therefore plays a crucial bridging role. Early investment helps kickstart implementation. Meanwhile, long-term carbon offtake agreements provide revenue certainty that allows projects to plan and operate over multi-decade horizons, advancing national restoration goals while contributing to global climate change mitigation efforts.
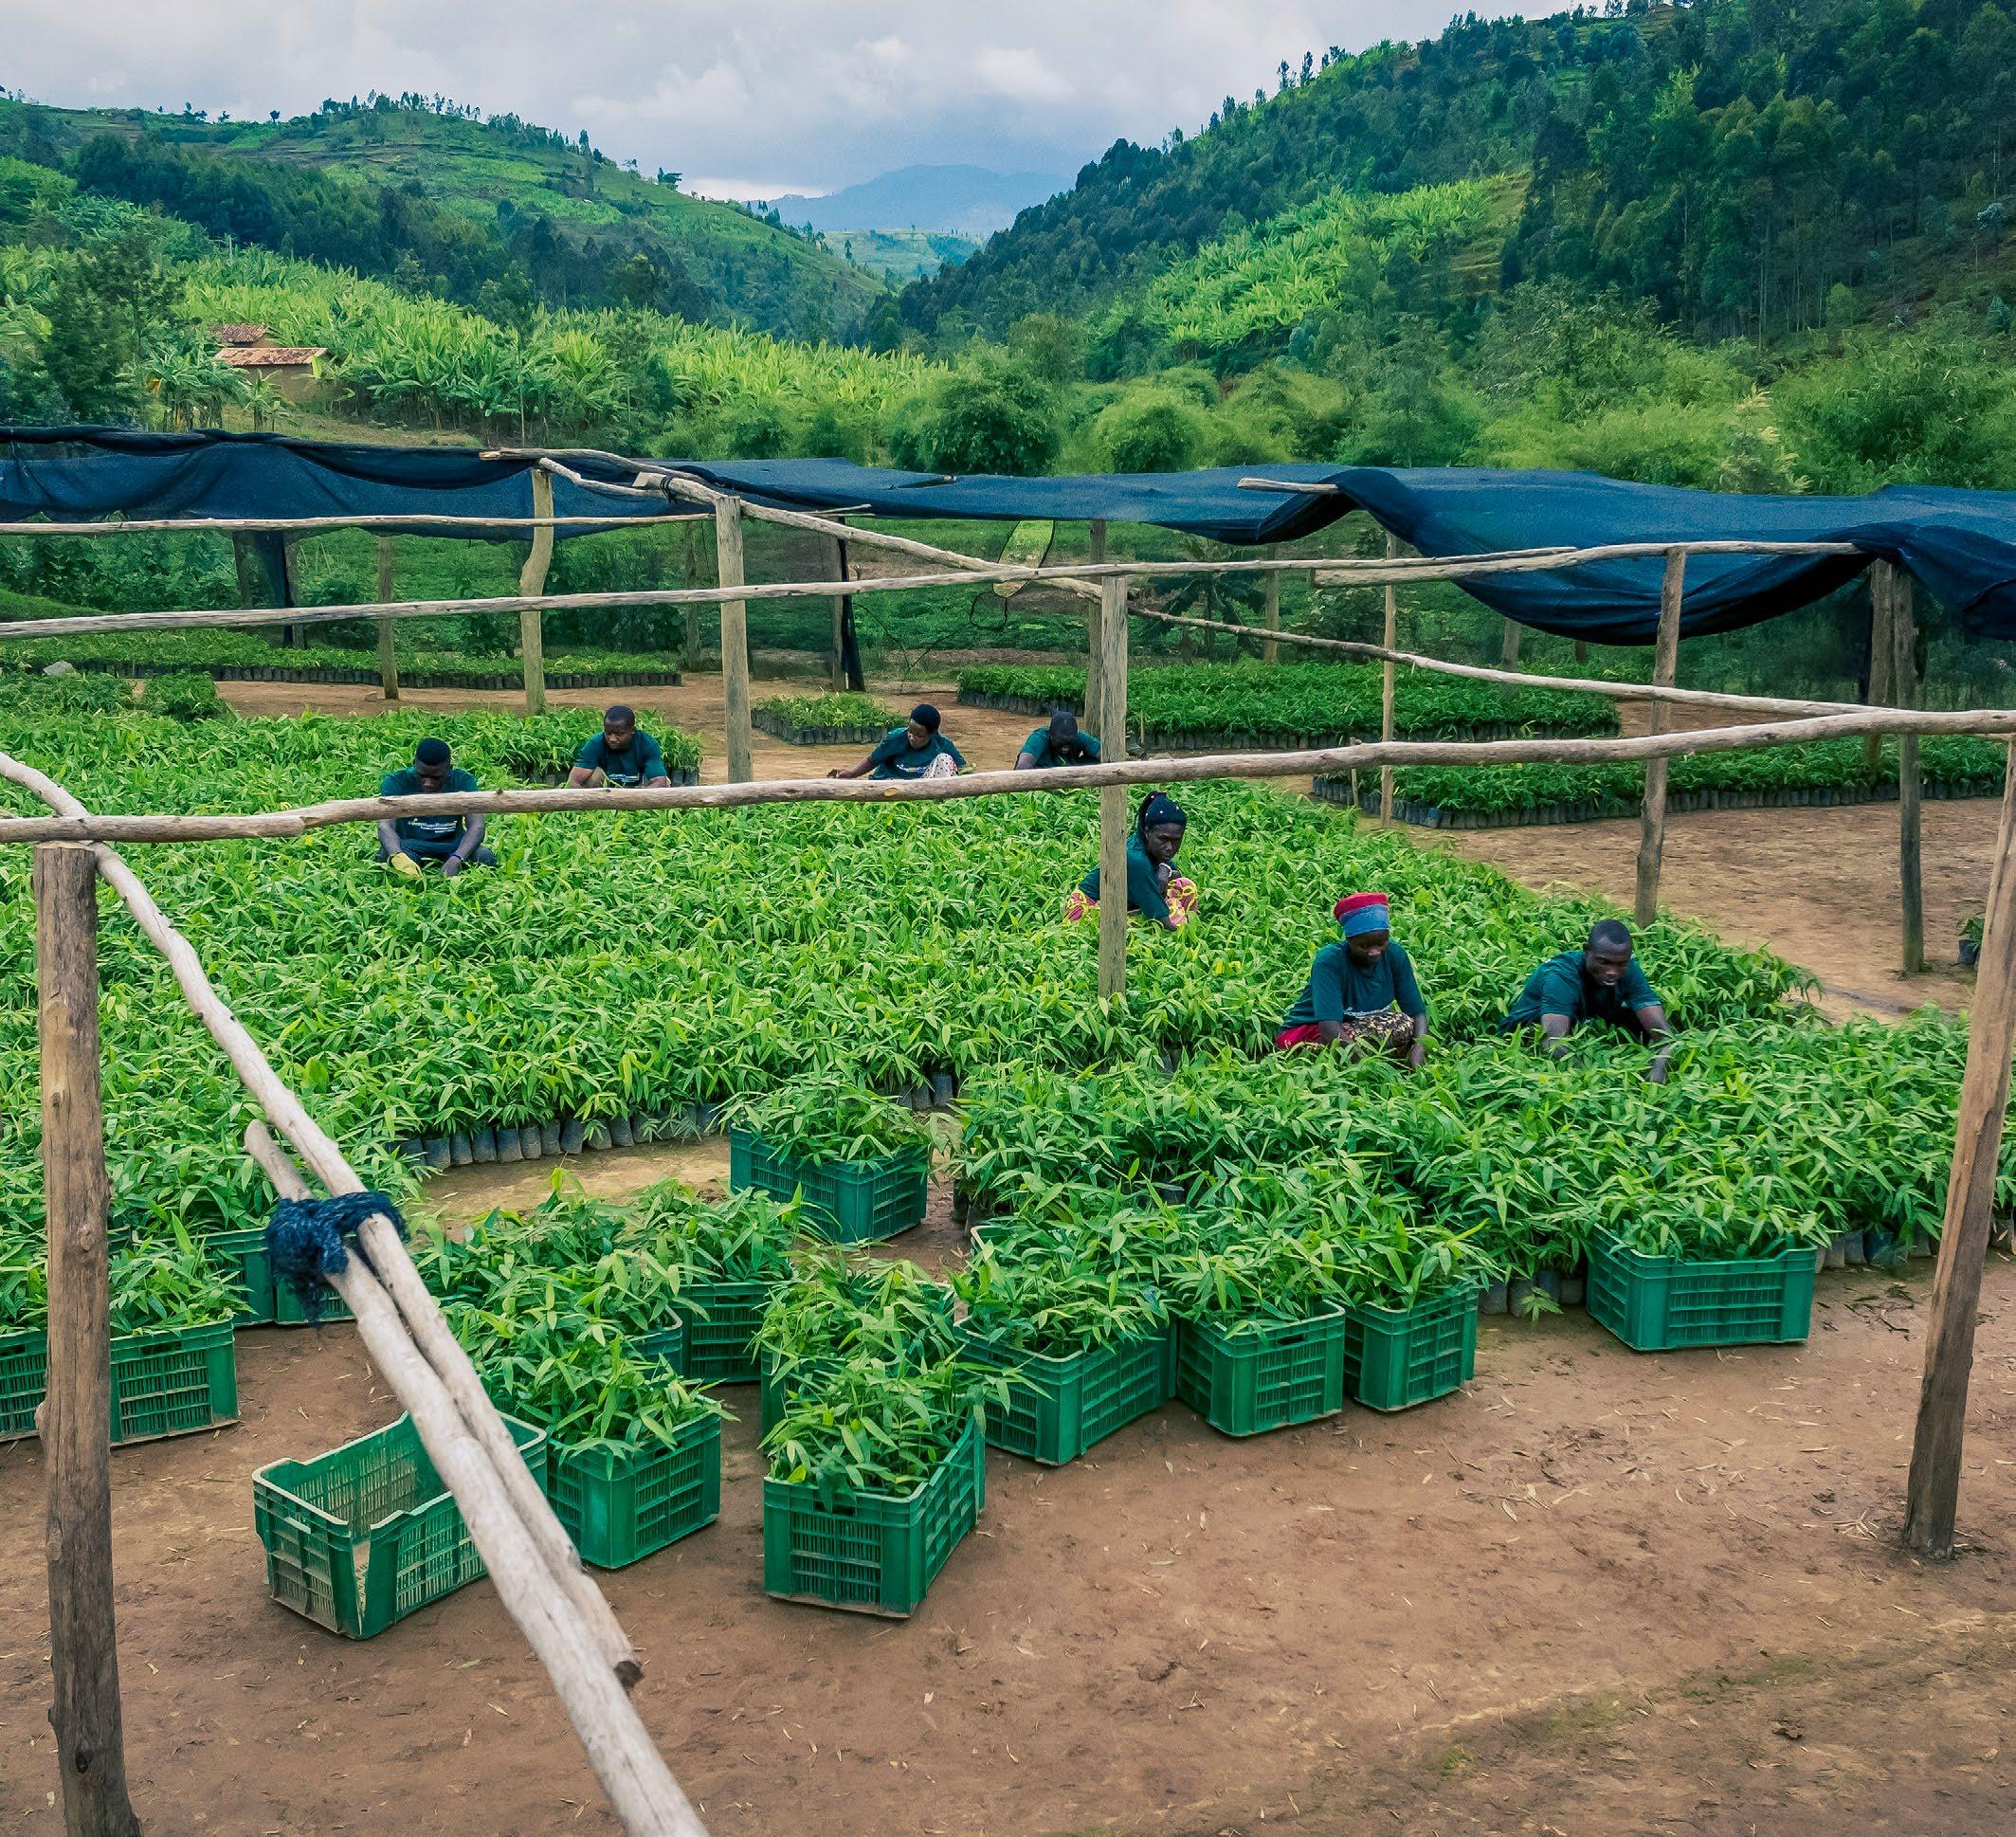
Rwanda Riparian Restoration Project
MANAGING CLIMATE RISK FOR LONG-TERM RESILIENCE
A.P. Moller Capital recognises that climate change presents potential financial risks to its investments, both now and in the future. To identify, assess and manage these risks, the company evaluates its portfolio companies for exposure to both physical risks arising from climate hazards and transition risks associated with changes in policy, technology, markets and consumer sentiment. Its approach is aligned with the principles of the Task Force on Climate-Related Financial Disclosures (TCFD), now incorporated into the International Financial Reporting Standards (IFRS) Sustainability Disclosure Standards, and with evolving international best practice.
To support this analysis, the company works with an external climate risk provider to assess climate-related financial risks across two forward-looking horizons: 2030 (near term) and 2040 (medium term). Risks are evaluated under two scenarios: a moderate transition pathway (RCP6 4.5) and a higher-risk pathway (RCP 8.5), reflecting greater physical and transition impacts. In 2025, A.P. Moller Capital expanded its scenario analysis to include the 2040 horizon alongside 2030, strengthening understanding of medium-term climate risks.
Across the 2030 horizon, climate-related risks to the portfolio remain limited under both scenarios. Estimated losses are assessed as low and are not considered material to the portfolio’s overall financial performance. These results considered both the projected physical hazard exposure at asset locations and the relative resilience of the underlying asset classes.
In the 2040 decade, the analysis indicates a material increase in climate-related financial risk, driven primarily by transition risk under the moderate transition scenario (RCP 4.5). This is largely explained by the scenario
assumptions on carbon pricing: for the African region, where the majority of the portfolio is located, carbon pricing is assumed to begin in 2040. Under the highemissions scenario (RCP 8.5), estimated losses are lower because this pathway typically assumes more limited or delayed policy action, meaning carbon pricing and other transition-related costs are less pronounced.
As climate policies evolve, A.P. Moller Capital will, as with physical risks, continue to monitor its portfolio to ensure resilience against emerging transition risks.
Integrating climate risk into risk management
Climate-related risks are embedded within A.P. Moller Capital’s broader risk governance and investment decision-making processes. Climate considerations form part of pre-investment screening and due diligence and are monitored throughout the asset life cycle alongside other material risks. Where risks are identified as potentially material, they are subject to deeper analysis. Where appropriate, mitigation measures are incorporated into investment documentation and ESAPs.
Ongoing oversight is maintained through quarterly portfolio reviews involving the investment team, ESG function and risk management. Through this integrated approach, A.P. Moller Capital actively supports portfolio companies in strengthening climate resilience and preparing for evolving transition-related risks, helping to safeguard long-term value creation.
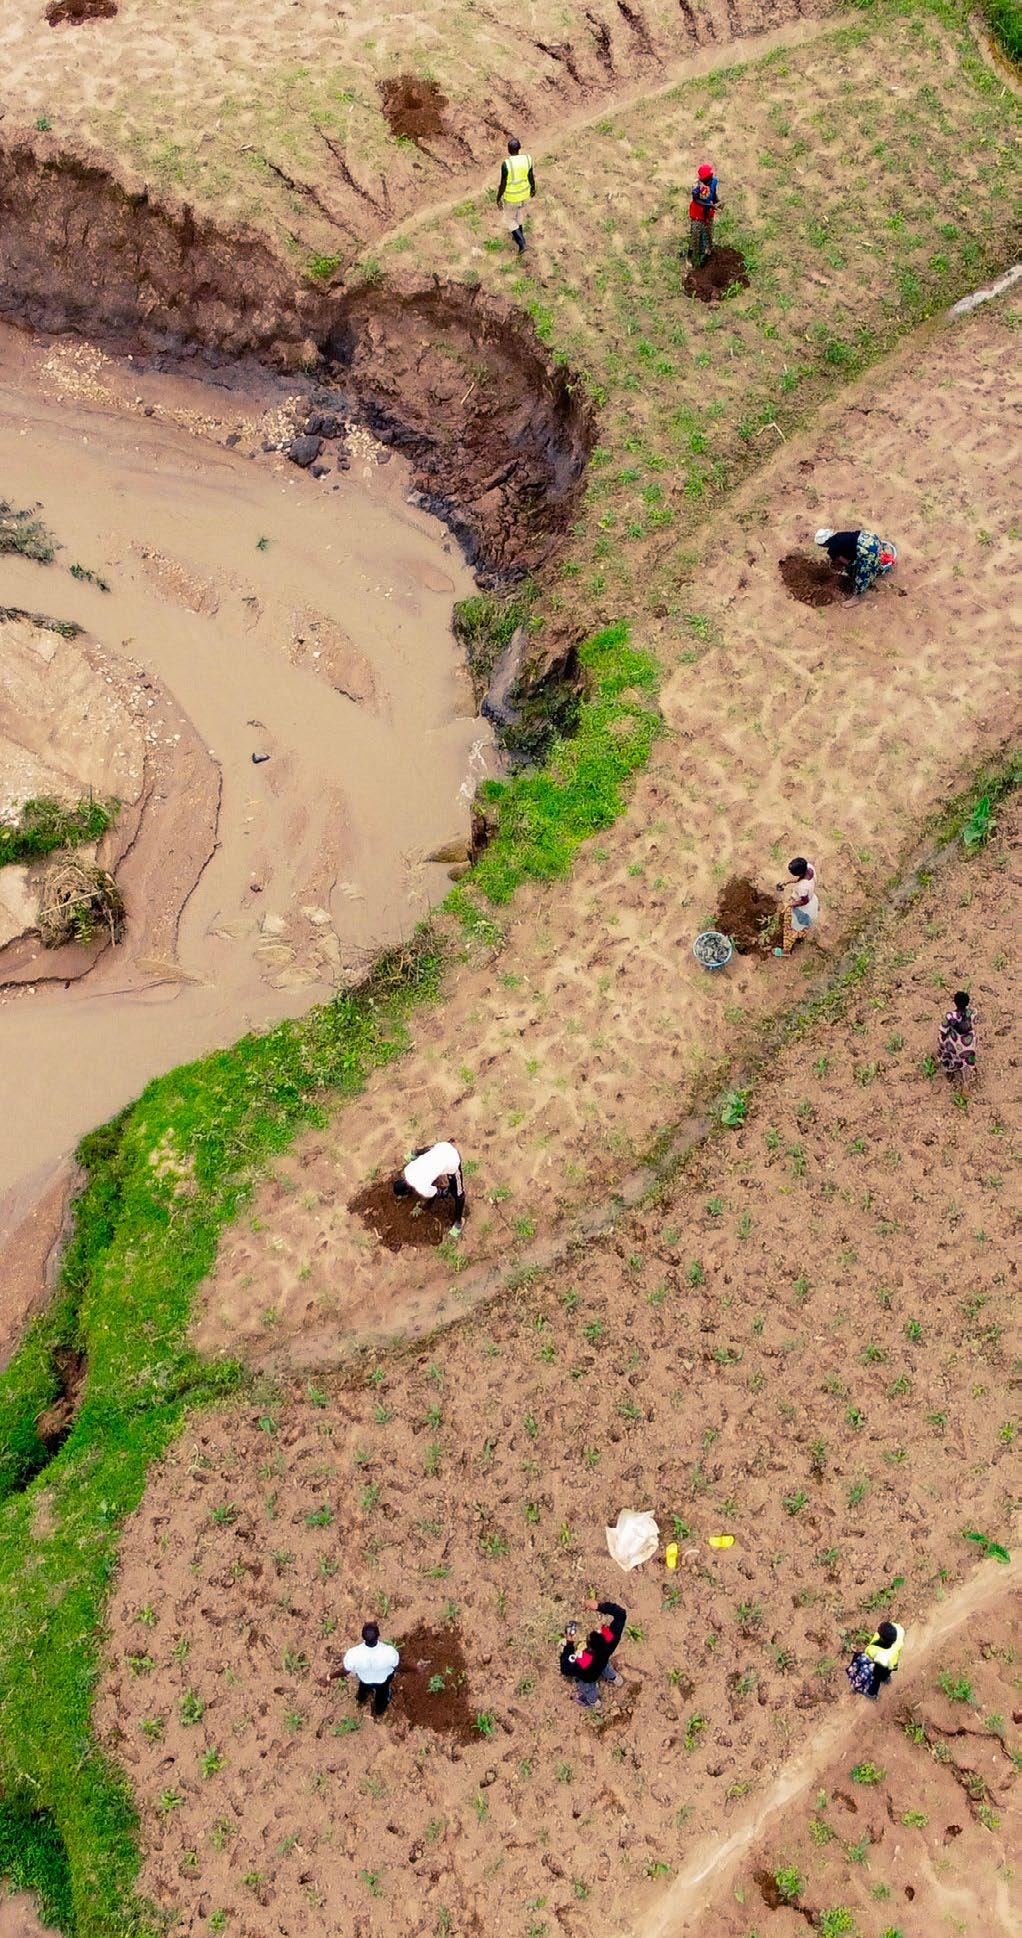
Rwanda Riparian Restoration Project
GOVERNANCE
ACTIVE OWNERSHIP AND ENGAGEMENT
GOVERNANCE FRAMEWORK
Active ownership and engagement are central to how A.P. Moller Capital works with portfolio companies, enabling the company to manage risks and enhance long-term value creation. This approach starts at origination, where ESG and impact considerations inform investment decisions, and continues throughout ownership to exit.
A.P. Moller Capital engages closely with portfolio company management teams on material ESG and impact topics, including progress against ESAPs, emerging risks and opportunities to strengthen ESG performance over time. This engagement takes place through a combination of direct discussions between management, the investment teams and the ESG team, and, where appropriate based on the size and risk profile of the company, formalised ESG Committee meetings. These committees provide a structured forum to track progress, review performance, escalate issues where needed and support accountability.
Active ownership is further reinforced through boardlevel oversight. A.P. Moller Capital holds board seats in all portfolio companies and works with boards and management teams to ensure ESG considerations are integrated into strategic decision-making and operational oversight.
Strong governance is a baseline requirement across the portfolio. It clarifies roles and accountability, supports sound decision-making and helps companies manage risk effectively. A.P. Moller Capital expects portfolio companies to operate to the same high standards of corporate governance as the manager. As with the Responsible Investment Framework, these expectations are rooted in A.P. Moller Capital’s Ethical Policy and aligned with applicable international standards and regulations.
To support consistent implementation across the portfolio, A.P. Moller Capital has a Portfolio Company Governance Manual, which sets out a core set of governance principles and policies that portfolio companies are required to adopt. The manual covers key areas such as ethical conduct and ESG oversight, anti-bribery and corruption, anti-money laundering and counter-terrorist financing, financial reporting and tax, conflicts of interest, whistleblowing and protection of brand and reputation. No corruption incidents were recorded in 2025. Portfolio companies are required to implement the core policies set out in the Governance Manual and to establish internal controls, procedures and training to ensure effective application. Compliance is monitored through regular reporting to A.P. Moller Capital, alongside ongoing engagement by the investment and ESG teams.
Bergé y Compañía
DISCLOSURES
The table below provides an overview of A.P. Moller Capital’s climaterelated disclosures in line with the recommendations of the TCFD, now incorporated into the IFRS Sustainability Disclosure Standards. It is included for ease of reference, allowing readers to identify quickly where each recommended
is addressed within this report.
ABBREVIATIONS
AIF I Africa Infrastructure Fund I K/S
AUM Assets under management
CIB Commercial International Bank
ECLP East Cairo Logistics Park
EDGE Excellence in Design for Greater Efficiencies
EV Electric vehicle
EMIF II A.P. Møller Capital – Emerging Markets Infrastructure Fund II
ESAP Environmental and Social Action Plan
ESG Environmental, social and governance
ESMS Environmental and Social Management System
GDP Gross domestic product
GwH Gigawatt hour
IFC International Finance Corporation
IFRS International Financial Reporting Standards
JIM Joint Impact Model
RCP Representative Concentration Pathway
RICC Responsible Investment Code of Conduct
RIF Responsible Investment Framework
SHA Shareholders’ agreement
TCFD Task Force on Climate-Related Financial Disclosures
TIPSP Terminal Industriel Polyvalent de San Pedro
VERPA Voluntary emission reduction purchase agreement