THE A.P. MOLLER GROUP
The A.P. Moller Group is a diversified group of industry companies. While independently run with dedicated boards and executive teams, we encourage and facilitate collaboration, networking, and sharing of best practices across our portfolio companies. A.P. Moller Holding is the parent company of the Group, investing in and building businesses with a positive impact on society – ‘nyttig virksomhed’.
A.P. Møller Holding A/S (hereafter referred to as A.P. Moller Holding) is the parent company of the A.P. Moller G roup (the G roup). The Annual Report of A.P. M oller Holding includes management review, consolidated f inancial statements , and parent company financial statements . The term A.P. Moller Holding group (the group) is used in the A nnual R eport for controlled and consolidated companies. In A.P. Moller Holding’s investment activities, investments owned by APMH Invest A/S are included.
The 20 24 compara tive figures are stated in brackets , except in ‘Letter from the CEO’
Møller Holding
MANAGEMENT REVIEW
LETTER FROM THE CEO

ROBERT M. UGGLA CEO
The A.P. Moller Group developed satisfactorily in 2025 and largely in line with expectations. The Group ended the year with a revenue of DKK 401bn (USD 61bn), EBITDA of DKK 68bn (USD 10bn), a net result of DKK 24bn (USD 4bn), and total assets of DKK 770bn (USD 121bn). At the end of 2025, A.P. Moller Holding remained debt free, with a full year cash inflow of DKK 19bn (USD 3bn). The net asset value increased by 22% to DKK 281bn (USD 44bn) , with our liquid public markets portfolio valued at DKK 52bn (USD 8bn)
CREATING LONG-TERM SHAREHOLDER VALUE
In the last ten years, since we restructured our Group and started building an investment organisation, A.P. Moller Holding’s net asset value has almost tripled, from DKK 107bn end 2015 to DKK 281bn end 2025 (or DKK 174bn created). During this period, the portfolio also became more diversified: In 2016, 100% of A.P. Moller Holding’s net asset value consisted of A.P. Moller - Maersk and Danske Bank , while t oday these two assets represent approximately 50% of our net asset value .
More recently, 2025 proved to be a mixed year, especially for the shipping related activities. Some of our offshore affiliates performed well, tankers had a reasonable year, but the container line activities of A.P. Moller - Maersk had a more challenging d evelopment in freight rates. On the other hand, we continue d to see strong results for APM Terminals, as container volumes were strong and the team delivered industry leading operating performance in many ports. During the year, APM Terminals successfully renewed concessions in Port Elizabeth, New Jersey, and Pier 400, Los Angeles, and secured new greenfield projects in Vietnam and Bangladesh, positioning the business for growth in important markets.
Danske Bank continued to deliver strong results with a net profit of DKK 23bn (USD 3bn) and is now performing in line with Nordic peers. It is a testament to the relentless efforts and turnaround since 2018, involving many leaders and Directors, to bring the bank back to its pole position in Nordic financial services. During this period, A.P. Moller Holding has been a highly engaged and unwavering shareholder despite the headwind s the bank has faced.
Unilabs and Faerch welcomed new CEOs during 2025. Unilabs exceeded our operating expectations for the year. Although the external market challenges in IVD (laboratory based diagnostics) remain, we also acknowledge how AI deployment, in particular in radiol ogy and pathology, is providing far better diagnostics accuracy, and thereby better patient outcomes, as well as interesting growth opportunities for Unilabs.
The future implications of AI are also a central consideration for our growth equity team, which has invested in 13 different technology companies since 2022, of which four investments were concluded in 2025. These are minority investments in next generation ventures, where we seek to leverage and strengthen our Group knowledge and network while targeting attractive returns on the capital deployed.
N otable transactions in the Group include Svitzer, which was successfully taken private during the year. At the end of 2025 , Svitzer acquired a majority shareholding in Buksér & Berging in Norway, as part of its growth strategy. We look forward to working closely with the founding family. A.P. Moller Holding’s industrial activities also continued to grow with Concentric acquiring Officine Mazzocco Pagnoni to strengthen its position as a tier one supplier to leading OEMs within construction equipment and trucking.
A.P. Moller Capital pursued several investments in 2025 across energy and logistics related activities. The team also pursued new partnerships with Berge Logistics in Spain and with the Ayala Group in the Philippines, expanding our Group’s network with str ong local partners and family owners. During the year, A.P. Moller Capital sold its shareholding in the grain port operator Mass Cereales in Morocco at an attractive return, after delivering operational improvements and growth. It is always bittersweet to sell a high performing and impactful business: While capital returns are redeployed in other useful activities, it is difficult to say farewell to colleagues and valued activities like the Morocco operation.
In line with our Group’s purpose, A.P. Moller Holding has also supported the development of scale -ups since its inception. In this respect, in 2025, Innargi opened its first geothermal heating facility , heating the equivalent of 6,500 households in Aarhus through the district heating network , targeting another 29,500 households equivalent to 110 MW. Innargi’s plant in Aarhus reduces dependency on imported biomass, at a time of geopolitical uncertainty, and provides a sustainable source of base load energy. Innargi also signed an agreement to develop a plant in Virum. Moreover, Iv3 Aqua completed the development of the Qurayyat Desalination Company Project, a modern desalination plant in Oman, providing 15% of all desalinated water to Oman’s national grid in a region with limited freshwater reserves.
MACRO AND REGULATORY DEVELOPMENTS
Geopolitical pundits have stressed that 2025 was characterised by an accelerated shift towards a multipolar world. Despite this development, global trade proved highly resilient and trade flows grew at a faster rate in 2025 than in the previous year, despi te an increase in US tariffs. More specifically, container volumes grew by 5.2%, outpacing global GDP growth.
As governments become increasingly concerned about supply chain related dependencies, the pressing question to political leaders is not just trade policy, but also how to enhance competitiveness of domestic industries. When Mario Draghi in 2024 articulated the EU’s competitive challenges, it resonated well with the views of its member states. The European Round Table for Industry and many business leaders have been vocal for a long time that the EU needs to reduce regulatory burdens to turn around its econo my. This also applies to the financial services industry: If capital requirements of Europe’s banks were reduced to the levels of their American counterparts, the absolute financing capacity of European businesses and households would be increased by an estimated EUR 1.9 trillion to EUR 2.7 trillion. In addition, there is opportunity to stimulate investments in growth and innovation by reducing the overlay of local legislation, e.g. Danish banks would be able to provide an additional DKK 200bn of funding to the local economy if the Danish government aligned its financial services regulations with EU rules.
For companies dependent on a global talent market, some of the regulatory headwinds are exacerbated by local tax rules, such as exit taxation, which makes it difficult to attract talent to certain countries. Several of our portfolio companies are experienc ing these challenges first hand. As we now embrace nascent and highly impactful technologies, including AI, the race for talent becomes even more consequential. Ultimately, the cost of not being competitive internationally is carried by countries, as corpo rate activities, know -how, and investments risk moving abroad.
As governments become increasingly concerned about supply chain related dependencies, the pressing question to political leaders is not just trade policy, but also how to enhance competitiveness of domestic industries.
ACKNOWLEDGING OUR COLLEAGUES ACROSS THE GROUP
Armed conflicts remain a major concern for our Group. With approximately 60 ongoing interstate and civil wars worldwide, not counting a number of unresolved disputes that risk erupting near term, conflicts are at their highest level since World War II.
Freedom of navigation is undermined and supply chains are attacked during these conflicts, adding to the human suffering. In the Middle East, our Group has approximately 8,000 colleagues, who provide essential services to local communities, from water desalination to logistics. The latter does not only cover the exports of hydrocarbons for the global energy markets, but there is also a pressing need for the import of agricultural products with reefer containers. As a Group, we do our utmost to develop and p rovide reliable solutions for our customers and the local communities we serve, while also keeping the safety of our colleagues and assets at the forefront of our minds.
As written by Arnold Peter Møller in 1946 in a letter to his son: ‘no loss should hit us which can be avoided with constant care’.
As we finalise our accounts for 2025, I convey my sincere gratitude to our Group’s Directors, Executives , and colleagues across the globe for their leadership and extensive efforts in the year that passed. A special note is sent to our colleagues in conflict areas, acknowledging the societal impact of their activities.
2025 marked the 50th anniversary of Maersk’s first container vessel sailing. On 5 September 1975, Adrian Mærsk departed on her maiden voyage from Newark, New Jersey. This new form of liner shipping enabled Maersk to provide a faster and more reliable service to customers. The history of the container serves as inspiration in our Group’s constant quest to stay relevant for the future.
‘No loss should hit us which can be avoided with constant care.’ A.P. MØLLER, 1946
FIVE-YEAR SUMMARY
CASH FLOW STATEMENT
HIGHLIGHTS

The A.P. Moller Group delivered a solid result in 202 5, despite economic headwinds in some of our larger segments, a continued complex geopolitical landscape, and shifting trade policies.
A.P. Moller Holding made a voluntary purchase offer for all issued shares in Svitzer. The company was delisted at the end of May 2025.
A.P. Moller - Maersk experience d continued pressure on freight rates but manag ed to improve reliability mainly due to the implementation of the Gemini Cooperation. APM Terminals continued to see solid growth and delivered a strong result in 2025.
The merger between Maersk Supply Service and DOF was successfully completed . DOF continues to see a solid improvement in its order backlog, mainly driven by activity in Brazil.
In June 2025, Concentric acquired OMP. We see a strong value proposition in the combined company.
Innargi opened its first geothermal district heating facility, expected to deliver heat to more than 36,000 households in Aa rhus when fully developed.
In December 2025, Danske Bank ended its three year probation period with the US authorities.
Our growth equity portfolio expanded during the year. The portfolio counted 13 investments at the end of 202 5
Net asset value increased by 2 2% to DKK 28 1bn, primarily attributable to the rise in share prices of A.P. MollerMaersk, Danske Bank, and DOF, in addition to cash inflow from shareholder distributions.
FINANCIAL PERFORMANCE
A.P. Moller Holding delivered a consolidated result of DKK 24bn, representing a return on equity of 4%. We benefited from a cash inflow of DKK 19bn and saw an increase in net asset value of DKK 51bn to DKK 281bn, primarily driven by a higher valuation of our larger listed portfolio companies.
A.P. Moller Holding is the parent company of the A.P. Moller Group, investing in ‘nyttig virksomhed’ – building and investing in businesses that have a positive impact on society. As a purpose -driven investment company leveraging more than 120 years of entrepreneurship, our focus is to build and buy platforms within our four thematic investment areas: Global trade; Energy transition; Circularity, water & waste recovery; and Demographic & societal change .
2025 proved to be yet another eventful year with high activity across our organisation. Among other things, the continued complex geopolitical landscape and advancing technology keep us vigilant.
Throughout the year, maintaining financial stability amid volatile markets has remained a key priority for the group . By sustaining a strong liquidity position , we are well prepared to deliver on our objectives and seize the opportunities we expect will arise in volatile markets while continuing to focus on our positive contribution to the society.
A.P. Moller Holding delivered a consolidated revenue of DKK 401bn and a net result of DKK 24bn, ending the year with a total equity of DKK 511bn. Operating profit and earnings fell compared to 2024, mainly due to a lower rate environment in the shipping segment . Our industrial businesses showed organic growth and have successfully integrated companies acquired in 202 4, but they were affected by inflation and volatility due to shifting trade policies . The results are significantly impaired by a 4% drop in th e average USD exchange rate compared to 2024.
A.P. Moller Holding recorded a cash inflow from our portfolio companies of DKK 19 bn, leading to growth in our liquidity , which reached D KK 5 2bn at year end.
Total assets and equity de creased due to the weakened USD exchange rate . This was partly offset by positive results, mainly driven by Danske Bank and our financial portfolio.
Net asset value increased by 22 % to DKK 28 1bn, primarily attributable to the rise in share prices of A.P. Moller - Maersk , Danske Bank , and DOF , in addition to cash inflow from shareholder distributions.
The valuation of our privately held portfolio companies remained largely stable over the year, though there were variations at individual company level. The privately held shipping assets were impacted by the weaker USD exchange rate.
OPERATING ACTIVITIES
In 2025, revenue fell by 6% to DKK 401bn, mainly due to a 4% drop in the average USD exchange rate. Energy transition and D emographic & societal change grew steadily, while G lobal trade businesses struggled in a market facing geopolitical and trade uncertainties
OPERATING COSTS
Operating costs matched 2024 levels, driven by sustained business activit ies and effective cost management However, inflationary pressure and expenditure related to strategic acquisitions and transformation initiatives continued to negatively affect costs.
EBITDA
Our operating profit declined from DKK 91bn in 2024 to DKK 68bn, primarily due to the drop in the USD exchange rate and reduced earnings from our shipping activities. However, this was partially balanced by increased profitability in Towage & marine services and businesses within Energy transitio n.
EBIT
EBIT fell by 20bn to DKK 28bn in 202 5, mainly attributed to reduced freight rates with in the container segment and a weaker USD. This decline was partially mitigated by lower impairment losses across the group
FINANCIAL ITEMS
Net financial expenses amounted to DKK 1bn, down from last year's net income of DKK 7bn, mainly reflecting a lower return from the liquidity portfolio and foreign exchange losses due to the lower USD exchange rate
TAX
Corporate income taxes comprise taxes calculated in accordance with various countries’ tax regimes. Land -based activities, which are subject to normal corporate income tax, include terminals, logistics, services and shipping agencies, sale of industrial pr oducts, diagnostics services, and financial profit from other equity investments. The taxation of shipping income is based on tonnage tax regimes and applies to a significant part of the group’s activities. Given tonnage taxation is not impacted by financ ial profits and is payable even in loss making years, the effective tax rate metric can fluctuate significantly over the years.
Tax for the year was DKK 4bn, down from DKK 5bn in 2024 drive n by lower profit levels. The effective tax rate increased from 10% to 13% in 2025, mainly due to the introduction of the Global Minimum Taxation (OECD Pillar Two).
RESULT FOR THE YEAR
Result for the year dropped from DKK 49bn in 2024 to DKK 24bn, mainly reflecting the headwinds within the container segment.
Result attributable to the owner of A.P. Møller Holding A/S was DKK 12bn compared to DKK 22bn in 202 4, positively impacted by the group’s share of the result in associated companies.
The DKK/USD average exchange rate was 4% lower than in 2024 and 11% lower when comparing end 2024 with end 2025
O ur expectations for the result for the year, as outlined in the Annual Report 2024 , were surpassed , largely attributable to improved market condition s for our shipping businesses compared with the financial outlook at the beginning of the year.
FINANCIAL RESULT FOR THE PARENT COMPANY
As the parent company of A.P. Moller Group, we strive to maintain an efficient and agile organisation with a constant focus on securing the necessary resources and capabilities to support our purpose.
Result for the year was DKK 7bn (DKK 23bn), reflecting lower earning s in our subsidiaries compared to 2024, mainly attributed to headwinds in Global trade .
As of 31 December 2025, total assets amounted to DKK 293 bn (DKK 302bn), with DKK 291 bn (DKK 300bn) attributed to investments in subsidiaries. The decrease in total assets was primarily due to the 11% decline in the USD exchange rate.
Equity at year end totalled DKK 292 bn (DKK 301bn), with DKK 179 bn (DKK 172bn) allocated to retained earnings.
FINANCIAL
DEVELOPMENT IN PORTFOLIO COMPANIES
2025 was marked by persistent macroeconomic uncertainty and geopolitical disruption, including prolonged Red Sea challenges that reshaped global trade lanes, and volatility in US trade driven by shifting trade policies. Even though freight rates remained under pressure, A.P. Moller - Maersk continued to expand freight volumes and improved reliability through the EastWest network via the Gemini Cooperation. Logistics & Services sustained margin expansion , and T erminals delivered record volumes, revenue, and profitability. In total, A.P. Moller - Maersk delivered a revenue of DKK 3 57 bn and a profit for the year of DKK 19bn
A.P. Moller - Maersk approved a dividend of DKK 480 per share , corresponding to a payout ratio of 40% in line with its dividend policy . A share buy -back programme of up to DKK 6bn has been initiated to be executed over a period of 12 months. The purpose of the programme is to adjust the capital structure through the cancellation of shares repurchased.
In December 2025, Danske Bank ended its three -year probation period with the US authorities, marking the closure of the Estonia case. The bank is executing well on its Forward ’28 strategy and is catching up to peers. The bank reported a net profit of DKK 23bn , down 3% from 2024 . Solid customer activity and the good financial health and resilience of their customers supported the financial result but were offset by higher loan impairment charges – though still at low levels – compared to 2024, which record ed a net impairment reversal of DKK 0.5bn .
Danske Bank continue d to have a robust capital and liquidity position with significant buffers well above regulatory requirements. At the end of 202 5, Danske Bank reported a CET1 ratio at 17 3%, which is well above regulation and the bank’s internal target of 16% and ensures a sufficiently prudent buffer to the capital requirement.
The dividend payment for 2025 amounted to DKK 22.72 per share , and Danske Bank has announced a new share buy -back programme of DKK 5bn. Total capital distribution ( dividend s and share buy -back programmes ) of DKK 23bn is equivalent to a dividend payout of 100% of net profit for 2025.
T he European clinical laboratory services market continued to face significant pricing pressure. Regulatory reforms, cost containment measures, and reimbursement constraints intensified competition and further compressed margins across the sector. Despite these headwinds, Unilabs demonstrated resilience, delivering 1% organic revenue growth. This solid performance stands out in a broader market slowdown, where many peers reported flat or declining revenues amid pricing erosion and rising operational costs.
Overall, Unilabs’ operational results for 2025 were in line with expectations, underscoring the company’s ability to navigate a challenging market environment as well as deliver on the business ’ ongoing transformation plan to support organic growth and improve profitability in the coming years .
Faerch experienced a challenging market backdrop in 2025 , shaped by continued geopolitical uncertainty and persistently
high food prices. Consumers adjusted their spending, and interest in alternative packaging grew as markets sought more efficient resource use. The company focused on portfolio optimisation and structural changes throughout the year. Despite these headwinds, Faerch delivered a n acceptable performance and successfully defended its leading market position and competitiveness. Operating margin has been maintained despite continued cost inflation as a result of disciplined cost management and operational efficie ncy.
Noble reported acceptable 2025 financial results with 8% yearover -year growth, driven by an improved utili sation rate, higher backlog , and more contracts despite declining day rates. Unfortunately, the backlog for 2026 remains challenging, but it is reported higher for 2027 . Noble returned approx imately DKK 2.3bn to its shareholders through a combination of dividends and share buy -backs.
In 2025, Svitzer experienced a volatile market impacted by geopolitical challeng es leading to changing trade routes and friendshoring , resulting in a lower than expected performance in the first half. However, improved cost management and efficiency measures, along with a recovery in shipping volumes, led to a strong second half. Overall, Svitzer achieved solid full -year results, with revenue up 4% on constant exchange rates and operating profit rising 5% to DKK 2bn compared to 2024.
DOF continue d to see strong activity in the subsea segment , and during 2025 it significantly g rew the order backlog, up 57%, securing roughly 77% of the 2026 revenue guidance. Its strong financial performance was supported by efficient operations and fleet optimisation. DOF delivered an EBITDA margin of 34%. Dividends for 2025 amounted to DKK 2.1bn corresponding to a dividend yield of 11%. DOF continues to see strong project activity and service demand.
Average Time Charter Equivalent (TCE) in Maersk Product Tankers fell significantly short of 2024 but remained above historic al averages. Relatively high but volatile spot market rates and a ttractive asset markets that enabled the company to sell
older tonnage at attractive prices had a positive impact on the result during the year .
In 2025, KK Group grew revenue by 4%, despite ongoing global challenges, ending the year with a record -high positive result. The company further integrated acquisitions, rebranded under the ‘Powering Change’ strategy, expanded in Asia with its largest manufacturing site , located in Bangalore, and set up a new US division to drive growth. KK Group expects continued industry headwinds in 2026 .
Concentric, acquired in October 2024, saw lower volumes throughout 2025 , mainly driven by the US market . The electrification division was affected by reduced North American government support for electric vehicles and transit bus supply chain disruptions. Although contribution margins remained stable, overall profitability declined due to lower sales volumes and increased capacity costs associated with continued resource investments, which were partially linked to the acquisition of Officine Mazzocco Pagno ni ( OMP )
EQUITY
As of 31 December 2025, total equity amounted to DKK 51 1bn , down from DKK 562bn – a decrease of 10 %. This drop was primarily due to the USD exchange rate falling by 11% compared to the end of 2024, as well as dividend payments to shareholders and non -controlling interests. The group saw benefits from improved annual results. Return on equity was 4%, compared to 9% previously, and the equity ratio declined from 68% to 66%.
A.P. Mol ler Holding’s share of equity fell to DKK 307 bn, from DKK 310bn.
DIVIDEND
Based on the financial result for 202 5, the Board of Directors proposes a dividend of DKK 1.0bn to A.P. Møller og Hustru Chastine Mc -Kinney Møllers Fond til almene Formaal (A.P. Moller Foundation). In 202 5, a dividend of DKK 1.0bn was paid.
INVESTMENT ACTIVITY
In April 2025, we announced a recommended voluntary purchase offer for all issued shares in Svitzer, with the aim of taking the company private to better support its long -term ambitions. As the largest shareholder, we saw that the listing had not created t he desired platform for growth, which is essential for maintaining Svitzer’s market position in a competitive and fragmented industry undergoing consolidation. The company was delisted at the end of May 2025.
In November 2025, Svitzer announced the acquisition of a 66.6% shareholding in Bu ksér og Berging AS, a leading Norwegian towage offshore and marine contracting company. The transaction was concluded on 2 January 2026.
In Ju ne 2025, C oncentric announced its strategic acquisition of OMP , a leading manufacturer of advanced oil pumps and fluid management components, headquartered in Funo, Italy. This acquisition provides Concentric with OMP's leading vane pump technology used by global OEMs and is expected to boost Concentric’s annual revenue by over 35% , as well as enhance performance and efficiency. We see a strong value proposition in the combined company, and the integration is progressing as planned.
In October 2025, Innargi opened its first geothermal district heating facility, expected to deliver heat to more than 36,000 households in Aarhus when fully developed. The next stage focuses on regulatory processes for the upcoming site. Innargi aims to finish the project before 2030. The project pipeline in Innargi continues to grow in both Denmark and Northern Europe, supporting the green energy security agenda in Europe.
Before year -end, an approval for geothermal research and extraction of geothermal heat in Virum, ano ther town in Denmark, was received, expected to supply heating to 10,000 households when fully developed.
Iv3 Aqua achieved C ommercial O peration D ate (COD) in November 2025 on the Qurayyat Desalination Company Project (acquired in 2024). The project now has an agreement with Oman’s government until 2047. The plant has an operating capacity of 200,000 m 3 per day and is able to supply over 15% of all desalinated water to Oman’s national grid.
By the end of 2025, our growth equity portfolio comprised 13 investments, including four new additions made during the year. We remain confident in the strategic value of investing in latestage growth companies and anticipate appealing risk -adjusted finan cial returns. To further support our investment team, we have opened an office in Singapore.
Our other portfolio companies have signed and completed a number of acquisitions, including the takeover of Panama Canal Railway Company by A.P. Moller - Maersk.
The c ash flow used for investing activities was mainly impacted by our investments in portfolio companies as well as activity in our financial portfolio. The total capital inflow from dividends, share buy -back programmes, and our financial portfolio was DKK 19 bn (DKK 17 bn), positively impacted by dividends , mainly from A.P. Moller - Maersk and Danske Bank , and share buyback programmes from Danske Bank
NET ASSET VALUE
At the end of 202 5, the net asset value increased to DKK 28 1bn, up 22% from the end of 2024. The development was mainly driven by the rise in the share price s of Danske Bank by 56% and of A.P. Moller - Maersk by 23%
We experienced a small 5% drop in the value of Noble , impacted by lower average day rates and rig utilisation ratio, while DOF rose 7% , supported by its strong financial performance and a significant ly improved order backlog
The net asset value is a volatile measure, not least over a shorter period, given our significant exposure to a few main portfolio companies. The net asset value calculation is based on different valuation methods. Our listed portfolio companies are assess ed using their share prices at the stock exchange. The privately held companies are assessed based on recognised valuation methods, and the financial portfolio on market capitalisation, primarily quoted prices.
FINANCIAL OUTLOOK
A.P. Moller Holding and its portfolio companies are exposed to global economic activity levels as well as development s in the global financial markets. Based on our expectations and financial guidance for our portfolio companies and current exchange rates, we expect that the 2026 EBITDA will be positive but lower than in 2025
The above statement is, by nature, subject to several uncertainties, including but not limited to, geopolitical uncertainties that will challenge global supply chains and global economic growth, and the rapid rise of economic nationalism and protectionism. This could cause actual results and performance to differ materially from our expectations. In addition, financial performance depends on several factors subject to uncertainties related to the uncertai n macroeconomic conditions as well as the future deve lopment of freight rates and volumes, import duties, demographic and societal changes, demand for sustainable solutions, commodity prices, including but not limited to, oil and energy prices, inflation, and interest rates.
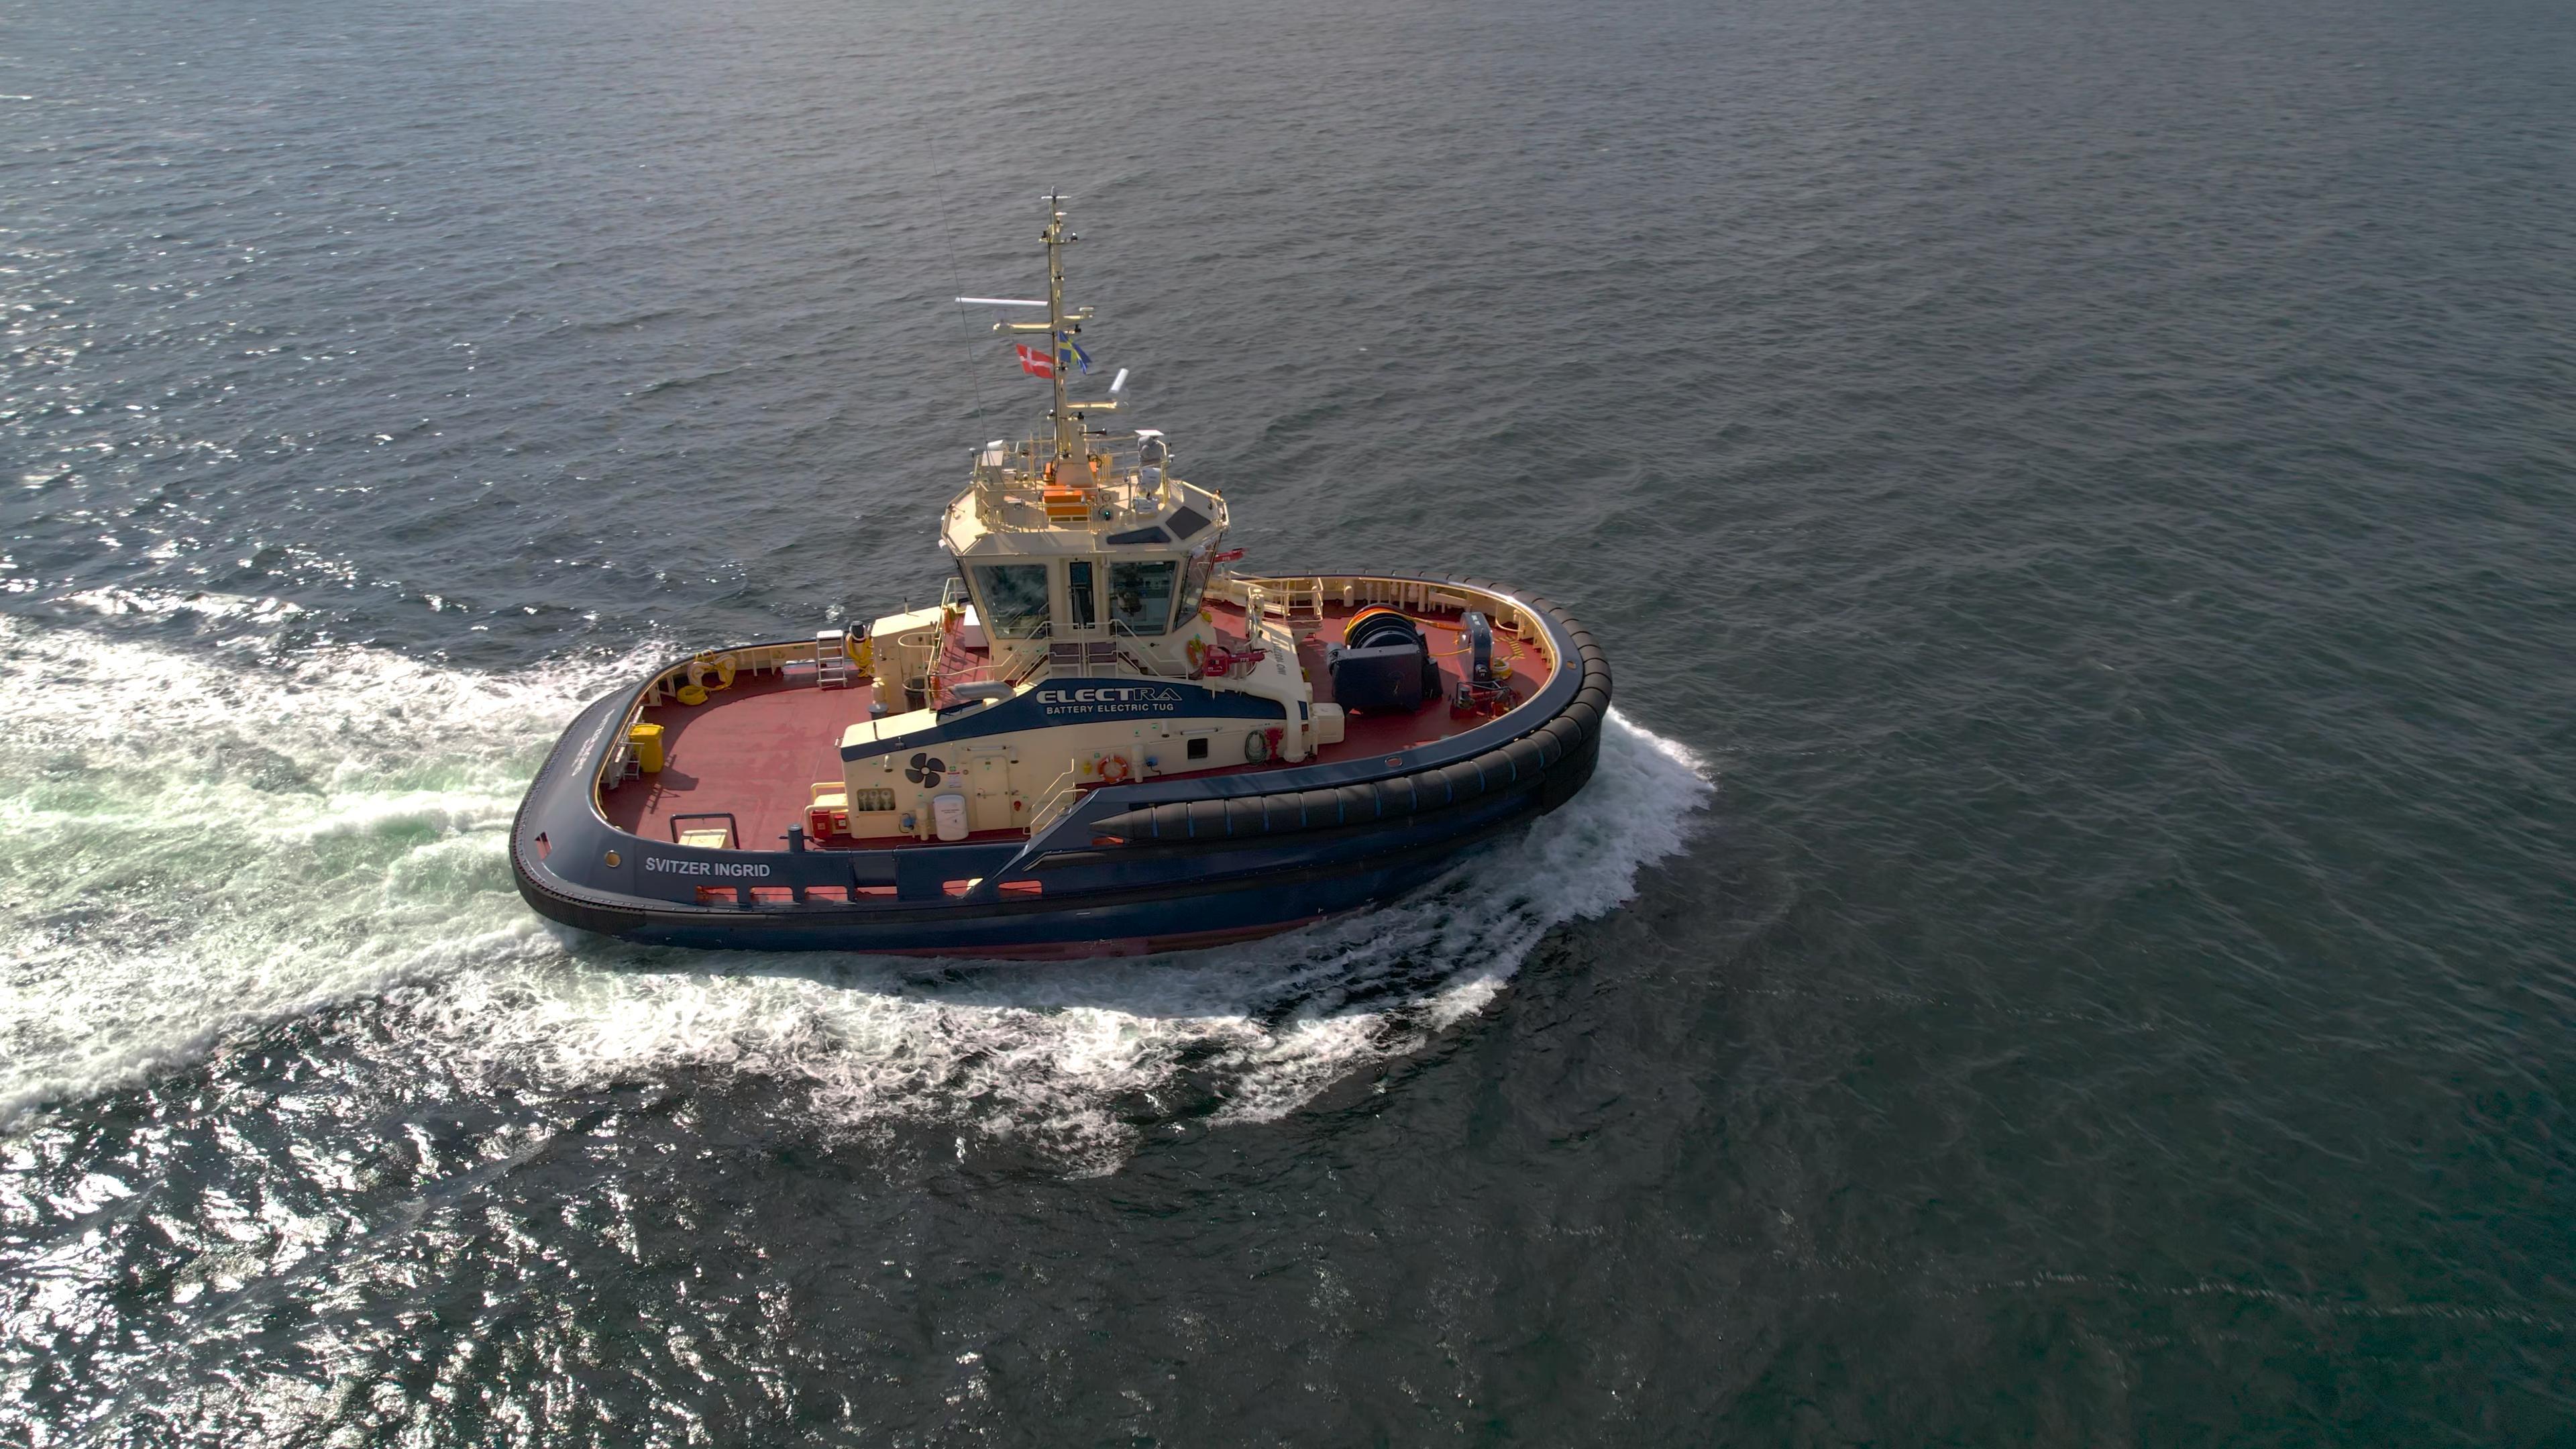
Svitzer Ingrid, Denmark's first electric tugboat, was christened by Her Majesty Queen Mary of Denmark in September 2025.
BUILDING A PORTFOLIO OF PLATFORMS FOR THE FUTURE
Our investment strategy is anchored in an ambition to build scalable platforms in areas where we have relevant experience and expertise so we can help drive long-term value and impact. We focus on long-term mega trends, and, as owners, we utilise and leverage the strengths and capabilities accumulated across our Group throughout more than 120 years. In doing this, we strive to fulfil our Group’s long-standing purpose of ‘nyttig virksomhed’ (having a positive impact on society).
Our strategy implies that we devote our time and resources to identifying and executing investments across sectors and countries, and within four themes that we believe will be relevant for multiple business cycles:
Global trade
Global trade is key to prosperity as it enables income and growth for people and societies. Our businesses enable global trade in different ways, for example by facilitating more efficient logistics across the globe and by building critical infrastructure. Financial services and the proliferation of efficient capital allocation are also drivers as well as beneficiaries of increased global trade.
Energy transition
Our societies depend on a steady and reliable supply of energy. At the same time, we need to migrate from the fossil sources that propelled the industrial revolution and drove wealth creation and consumption for many decades and move towards energy generation from non -fossil and renewable sources. Our focus is on this transition which will not happen overnight and maintaining access to energy is a necessity for our societies.
Circularity, water & waste recovery
Global consumption of resources and products is not in balance with our planet ’s ability to regenerate the resources consumed , nor to absorb the substantial generation of waste. Sustainable replacements are being adopted , and the use and utilisation of resources must be optimised. We are committed to the development of circular rather than linear production and consumption models.
Demographic & societal change
Across both mature and emerging economies, population demographics continue to change, which is creating challenging conditions for societal welfare models. These slow -moving but largely inevitable demographic and societal factors are transforming our soci eties. Absent continuous improvements in efficiency and new business models, the welfare imbalance in our societies will create unsustainable levels of inequality. We invest in digital and automated ways of working to address the welfare challenges arising from demographic change.
INVESTMENT MANDATES
We leverage our knowledge, expertise, and experience across four different mandates:
Principal holdings
Large control -oriented investments in companies backed by solid long -term trends. We prefer our principal investments to be platforms where we have the optionality of deploying additional capital over time for organic and inorganic expansion.
Growth equity
Patient minority investments in late -stage growth businesses. In addition to generating attractive financial returns, the objective is to leverage and continue to enhance domain knowledge within our core areas of expertise and investment themes .
Scale-ups
Rooted in our entrepreneurial legacy and spirit, we selectively initiate incubation projects and actual building of new businesses. Such greenfield projects and business building are based on internally generated ideas, a few of which are, after an extensive vetting process, pushed forward and initially funded by us. Over time, we typically bring in other investors.
Public markets
We apply active concentrated global strategies across various asset classes seeking to generate financial results above or in line with external market benchmarks.
ENGAGED AND ACTIVE LONG-TERM OWNERS
In the spirit of our founder, A.P. Møller, we are engaged and active long -term owners with a point of view on key matters. Stewardship and a continued focus on the quality of interactions between management, Board of Directors, and owner(s) are therefore c ritical to our success. In recent years , we developed and implemented a set of principles and guidelines defining our ownership model, and how we exercise it. These principles are rooted in our legacy, and we will continue to optimise our stewardship and o wnership model in the years to come.
A.P. Moller - Maersk Danske Bank Unilabs Faerch
A.P. MOLLER - MAERSK is an integrated transport and logistics company working to connect and simplify its customers’ supply chains. The company is a global leader in shipping activities.
DANSKE BANK is Denmark’s largest bank. Its core business includes private, business, institutional customer segments, and other financial services to the Nordic markets.
UNILABS is a leading diagnostics services provider in Europe, focusing on laboratory testing, pathology, and radiology. The company services both public and private healthcare providers across multiple countries.
FAERCH is a leading supplier of circular packaging solutions to the global food industry, serving leading food manufacturers and retailers around the world.
NOBLE is a leading offshore drilling company for the oil and gas industry. The company owns and operates one of the youngest and most advanced fleets in the offshore drilling industry.
CEO: Vincent Clerc
CFO: Robert Josef Erni
Representatives
• Robert M. Uggla (Chair)
Key figures end of 202 5
• Market cap: DKK 215 bn
• Ownership: 4 4.4 % / 5 2.3 % voting share
(USDm)
CEO: Carsten R. Egeriis
CFO: Cecile Hillary
Representatives
• Martin N. Larsen (Vice Chair)
Key figures end of 202 5
• Market cap: DKK 260 bn
• Ownership: 21.3% TOTAL INCOME (DKKm)
CEO : Badhri Srinivasan
CFO: Carsten Højlund
Representatives
• Jan T. Nielsen (Vice Chair)
CEO: Pernille Lind Olsen CFO: Sonja Østergaard
Representatives
• Henrik Poulsen (Chair)
• Jan T. Nielsen (Vice Chair)
CEO: Robert W. Eifler
CFO: Richard B. Barker
Representatives
• Claus V. Hemmingsen
Key
•
(EURm)
(EURm)
Svitzer DOF
SVITZER is a global leader in sustainable marine services , provid ing critical towage infrastructure and maritime solutions across Europe, AMEA, Australia, and the Americas.
DOF is a leading provider of global offshore marine services for the energy sector, including oil and gas companies, offshore renewable companies , and subsea contractors.
Maersk Product Tankers KK Group
MAERSK PRODUCT TANKERS is an
asset company, owning tankers transporting energy products worldwide for large energy companies and trading houses.
KK GROUP is a global technology partner delivering power electronics, controls, cooling, monitoring, and service solutions for renewable energy and energy intensive industries.
CONCENTRIC is a global leader in pump, fan , and thermal management solutions for the commercial vehicle market, helping customers increase fuel efficiency, reduce emissions , and improve engine control.
CEO: Kasper Friis Nilaus
CFO: Knud Winkler
Representatives
• Robert M. Uggla (Vice Chair)
• Louise Løn
CEO: Mons S. Aase
CFO: Martin Lundberg
Representatives
• Erik Bergöö (Vice Chair)
Key figures end of 2025
• Market cap: DKK 15 bn
• Ownership: 25.0%
REVENUE (DKKm)
REVENUE
(USDm, includes only DOF up to the merger with Maersk Supply Service in 2024)
CEO: Tina Revsbech
CFO: Christian Huss
Representatives
• Martin N. Larsen (Chair)
• Birgitte Schou
• Erik Bergöö
CEO: Mauricio Quintana
CFO: Bjørn R. Mogensen
Representatives
• S imon K. Ibsen ( Vice Chair)
CEO: Josh Meyer
CFO: Marcus Whitehouse
Representatives
• Simon K. Ibsen (Vice Chair)
• Jan T. Nielsen
REVENUE (USDm)
REVENUE (DKKm)
REVENUE (USDm)
Maersk Tankers A.P. Moller Capital Maersk Offshore Wind Innargi
MAERSK TANKERS is a service company providing commercial management solutions for shipowners in the tanker industry. The company operates one of the largest tanker fleets in the world.
A.P. MOLLER CAPITAL is an infrastructure fund manager focusing on high growth markets, combining attractive risk adjusted return s with a positive societal impact.
MAERSK OFFSHORE WIND is a provider of installation services to the offshore wind market accelerating the rollout of offshore wind farms .
INNARGI is a geothermal heating company aiming to heat millions of urban homes while leaving zero impact on our planet.
ZERONORTH is a technology company providing a range of software solutions that enable the shipping industry to reduce its impact on the climate while maintaining commercial performance.
CEO: Tina Revsbech
CFO: Christian Huss
Representatives
• Robert M. Uggla (Chair)
• Maria Pejter
• Martin N. Larsen
CEO: Kim Fejfer
CFO: Joe Nielsen
Representatives
• Robert M. Uggla (Chair)
CEO: Michael Reimer Mortensen
CFO: Jesper H øybye
Representatives
• Martin N. Larsen (Chair)
• Maria Pejter
CEO: Samir Abboud
CFO: Lars Heineke
Representatives
• Claus V. Hemmingsen (Chair)
• Steffen Risager
CEO: Søren Andersen
CFO: K arsten Gregory
Representatives
• Maria Pejter
Iv3 Aqua C2X Vioneo
IV3 AQUA is a water management company owning and operating water, wastewater, reuse plants, concessions , and related water utility businesses.
C2X is a green methanol production company aiming to develop and operate green methanol production facilities to supply both the chemical and shipping sectors.
VIONEO was established to be the world’s first large -scale producer of fossil -free plastics based on green methanol.
CEO: Olaf N. Krohg
CFO : Frederick Hung
Representatives
• Jan T. Nielsen (Vice Chair)
• Paulius Urbonas
CEO: Brian Davis
CFO: Alastair Maxwell
Representatives
• Jan T. Nielsen (Chair)
• Steffen Risager
CEO: Alex Hogan
CFO: Arnaud Cachard
Representatives
• Simon K. Ibsen (Vice Chair)
RISK MANAGEMENT
Our risk management setup is closely related to our investment strategy and allows us to safeguard the longevity of our portfolio companies by understanding the inherent risks associated with each of them and by supporting the companies in managing these risks in a changing environment.
Risk management reporting is an integrated part of our business processes, allowing A.P. Moller Holding to respond appropriately to the changing environments our businesses are operating in. The Board of Directors receives portfolio performance reports inc luding risk management measures on a regular basis throughout the year.
Being an investor focusing on capital risk, we continuously develop our risk framework, and we have embedded controls and operational risk mitigation processes in our critical daily operations. We have a constant focus on good governance, and we have implemented procedures to continuously assess and ensure that we follow market standards and developments. Further, in line with the purpose of the A.P. Moller Foundation, and to ensure t he long -term viability and longevity of A.P. MollerMaersk, our portfolio companies are structured as visualised on page 79
OUR PORTFOLIO COMPANIES
Having a long -term ownership horizon, our ambition for each investment is defined in a clear ownership strategy, considering sector specific market parameters and developments , as well as current and emerging risks.
Risks related to our portfolio companies include business and financial risks associated with operations and performance. The management of such risks is effectively anchored with the Board of Directors in each of the portfolio companies. Each entity has defined and implemented their own risk management framework, ma naging specific, defined risks. As owners, we monitor business performance in the portfolio companies closely as part of our ownership aspiration. We report on business and risk related issues to our Board of Directors as appropriate.
Our investment team focuses on large and long -term investments and brings valuable global investment expertise. As we evaluate investment opportunities, the investments will undergo committees and investment gates , where thorough risk analysis, due diligence, and mitigation are natural parts of the investment
evaluation process. Our risk management framework allows us to critically evaluate such risks . Investments will be abandoned where risks/rewards are not deemed attractive and in line with our values , as well as our financial and strategic beliefs.
As our investments are expected to have a long -term ownership horizon, we focus on the inherent risks related to such investments. At all times, it is part of our strategic beliefs to invest in and build businesses that have a positive impact on society. Hence, we strive to ensure that all our partners acknowledge our values and share our commitment to conduct business in an ethical, legal, and socially responsible manner.
PUBLIC MARKETS
A.P. Moller Holding has a financial portfolio primarily with exposure to global equity markets managed by our own public markets team. The overall objective of the portfolio is i) to create economic value in line with our values , ii) to ensure a part of our financial portfolio remains highly liquid, acting as a buffer for the company to be flexible and able to react as needed in relation to our portfolio companies or to significant changes in our cash flows , and iii) to deliver performance in line with a fi xed benchmark.
The Board of Directors approves the investment policy and defines the acceptable risk limits including a variety of risk management factors such as single line limits, currency exposures , and asset class weights. These, in combination with internal investment principles, guide the financial investments on a daily basis. We manage the market, credit, liquidity, and currency risks related to our financial portfolio by limiting maximum exposure to individual asset classes and underlying assets. The guidelines are reviewed regularly to ensure they reflect the market situation and our financial situation at any given time.
CORPORATE SOCIAL RESPONSIBILITY
A.P. Moller Holding invests in and builds businesses with a positive impact on society – ‘nyttig virksomhed’ – as defined by our founder A.P. Møller.
‘Nyttig virksomhed’ is a key element in our investment strategy, and we are open to reconsider our ownership of a business if its business model does not have a positive impact on society. Hence, social responsibility is integrated into our purpose and is core to everything we do.
As part of good governance practice, we have implemented policies and systems to secure a solid basis for our activities as an engaged investment company. We focus on mitigating the key risks of essential compliance areas including money laundering & financing of terrorism and bribery & corruption. As reflected in our Code of Ethics and business conduct , engaging in any kind of fraud , bribery, and corruption is strictly prohibited, which is one of the cornerstones in our overall framework for how to exercis e due care to prevent fraud, bribery and corruption internally , as well as in relation to third parties acting on behalf of A.P. Moller Holding. This is especially relevant in relation to our investments, where we, prior to investing, conduct thorough due diligence measures on the target and relevant counterparties su ch as advisors, co -investors, etc.
STATUTORY REPORT CF. SECTION 99B OF THE DANISH FINANCIAL STATEMENTS ACT
As an international investment company with a broad range of investment activities, A.P. Moller Holding has a significant influence on society. We acknowledge the responsibilities that this entails and make an effort to ensure that we are recognised as a trustworthy group of companies.
The Board of Directors of each of our portfolio companies define their own specific policies and Codes of Conduct. We are represented on each board in companies where we hold a minimum of 50% of the votes, and our representatives ensure that relevant policies, including those related to human rights, climate change, and environmental impact, are implemented and enforced.
For A.P. Moller Holding’s statutory statement on CSR in accordance with section 99 b of The Danish Financial Statements Act, please refer to: https://apmoller.com/wpcontent/uploads/2026/03/APMH -CSR -Report -2025.pdf
STATUTORY REPORT CF. SECTION 99D OF THE DANISH FINANCIAL STATEMENTS ACT
In line with our core values, responsible use of information and data is part of our overall aim to adhere to high ethical standards. Pursuant to the requirements and with an outset in our daily operations and activities, A.P. Moller Holding has implemented a D ata E thics P olicy based on five principles reflecting how we use and process both personal and non -personal data as well as general data and information. The policy addresses our aim to be transparent as appropriate and acting responsibly with respec t and dignity both towards our employees and when working with third parties. The policy complements our policies and procedures on handling of personal data, IT -security, etc.
SUSTAINABILITY HIGHLIGHTS
The companies in the A.P. Moller Group define and execute their own sustainability initiatives. In 2025, numerous activities were launched of which a few are highlighted here. For more details, please refer to the respective sustainability reports.
A.P. Moller - Maersk took delivery of 10 new dual -fuel methanol vessels bringing its fleet to 19, advanced its multi -fuel portfolio approach through a liquefied biomethane supply agreement , and completed successful trials using blended e -methanol and ethanol fuels.
C2X signed an agreement with Microsoft to deliver 3.6 million metric tonnes of carbon removal units over 12 years from its Beaver Lake project in Louisiana, expected to produce over 500,000 metric ton ne s of bio -methanol annually and capture and store around 1 million metric tonnes of CO 2 annually.
Concentric installed 80,000 sq uare feet of solar panels at its Pune factory site in India, generating approx imately 900 kW of renewable energy and bringing the total to 200,000 square feet of solar panels installed across its sites.
Innargi began operations of its first geothermal district heating plant in Aarhus, Denmark. Once completed, the city's geothermal heating system is expected to supply 20% of its heating needs by 2030 while reducing the city's CO 2 emissions by approximately 165,000 tonnes annually.
KK Group ’s power converters and control systems, which are at the heart of each wind turbine, enabled 18 gigawatts of wind power in 2025, roughly equivalent to the power it would take to fast -charge 120,000 EVs at the same time.
Iv3 Aqua 's subsidiary, Qurayyat Desalination Company, reached the C ommercial O peration D ate of its desalination plant in Oman in November, three months ahead of schedule. The plant now has the capacity to produce up to 200 million litres of potable water per day, supplying over 15% of all desalinated water delivered to the national grid.
Unilabs partnered with Oxipit to implement AI assisted chest X -ray solutions across key European markets, speeding up diagnoses and improving accuracy to deliver faster, more reliable patient care.
A.P. Moller - Maersk ’s first dual -fuel methanol vessel, Laura Mærsk, received the first e -methanol from the newly inaugurated Kassø facility in Denmark in May 2025.
Svitzer launched Denmark's first electric tugboat, Ingrid. The tug will perform most tasks using electrical power, thereby reducing annual CO₂ emissions by 600900 tonnes. In December, Svitzer also committed to purchasing four electric, 26 metre TRAnsverse tugs.
BOARD OF DIRECTORS

Ane M.M. Uggla Chair
Chair of the Board of Directors
• A.P. Møller og Hustru Chastine Mc -Kinney Møllers Fond til almene Formaal
• Den A.P. Møllerske Støttefond
Other management duties
• Estemco III ApS (CEO)
• Timer ApS (CEO)

Claus V. Hemmingsen
Chair of the Board of Directors
• DFDS A/S
• Innargi Holding A/S
• HusCompagniet A/S
• Rambøll Gruppen A/S
Member of the Board of Directors
• A.P. Møller og Hustru Chastine Mc -Kinney Møllers Fond til almene Formaal
• Den A.P. Møllerske Støttefond
• Noble Corporation PLC
• Det Forenede Dampskibs -selskabs Jubilæumsfond
• Fonden Mærsk Mc -Kinney Møller Center for Zero Carbon Shipping
• Global Maritime Forum Fonden
Other management duties
• CVH Consulting ApS (CEO)
• Committee for Corporate Governance, Denmark (member)
Jan Leschly
Member of the Board of Directors
• UTR Sports LLC
• The Leschly Tennis Foundation
• Nightingale Veterinary Partners
Other management duties
• Adjunct Professor at Copenhagen Business School
Lars-Erik Brenøe
Member of the Board of Directors
• A.P. Møller og Hustru Chastine Mc -Kinney Møllers Fond til almene Formaal
• A.P. Møller og Hustru Chastine Mc -Kinney Møllers Familiefond
• Monjasa Holding A/S
• Odense Havn A/S
• Operaparkfonden
Other management duties
• LEBrenoe (personally owned law firm)
EXECUTIVE BOARD

Robert M. Uggla Chief Executive Officer
Other management duties, etc.
• A.P. Møller - Mærsk A/S (Chair)
• A.P. Møller Capital P/S (Chair)
• Maersk Tankers A/S (Chair)
• Svitzer Group A/S (Vice Chair)
• IMD (Director of the Foundation Board)
• International Business Leaders’ Advisory Council of the Mayor of Shanghai , IBLAC (Member)
• Agata ApS (CEO)
• Estemco XII ApS (CEO)
Robert M. Uggla is appointed to the Board of Directors in a number of entities controlled by A.P. Møller Holding A/S.

Jan T. Nielsen Chief Investment Officer
Other management duties, etc.
• C2X Ltd. (Chair)
• Faerch Group Holding A/S ( Vice Chair )
• Iv3 Aqua Holding A/S (Vice Chair)
• Unilabs Group Holding ApS (Vice Chair)
• Concentric AB (Board member)
• LEGO A/S (Board member)
• Copenhagen International School ( M ember of the Board of Governors)
• Thorsgaard Holding ApS (CEO)
Jan T. Nielsen is appointed to the Board of Directors in a number of entities controlled by A.P. Møller Holding A/S.

Martin N. Larsen Chief Financial Officer
Other management duties, etc.
• Ammonia Carriers A/S (Chair)
• Maersk Offshore Wind A/S (Chair)
• Maersk Product Tankers A/S (Chair)
• Navigare Capital Partners A/S (Chair)
• Assuranceforeningen SKULD (Gjensidig) (Vice Chair)
• Danske Bank A/S (Vice Chair)
• Danmarks Eksport - og Investeringsfond (EIFO) (Board member)
• Maersk Tankers A/S (Board member)
• MVKH ApS (CEO)
Martin N. Larsen is appointed to the Executive Board and Board of Directors in a number of entities controlled by A.P. Møller Holding A/S.
FINANCIAL STATEMENTS
CONSOLIDATED INCOME STATEMENT FOR 1 JANUARY TO 31 DECEMBER
CONSOLIDATED STATEMENT OF COMPREHENSIVE INCOME
CONSOLIDATED BALANCE SHEET
AS OF 31 DECEMBER
CONSOLIDATED CASH FLOW STATEMENT FOR 1 JANUARY TO 31 DECEMBER
Cash and bank balances include DKK 6.0bn (DKK 7.0bn) relating to cash and bank balances in countries with exchange rate control or other restrictions. These funds are not readily available for general use by the parent company or other subsidiaries.
CONSOLIDATED STATEMENT OF CHANGES IN EQUITY
BASIS OF PREPARATION
Note 1.1: General accounting policies
This note sets out general accounting policies for A.P. Møller Holding A/S that relate to the financial statements as a whole. Where an accounting policy is generally applicable to a specific note to the financial statements, the policy is described within that note.
BASIS OF PREPARATION
The consolidated financial statements for 202 5 for A.P. Møller Holding A/S have been prepared on a going concern basis and in accordance with the IFRS Accounting Standards as adopted by the EU (IFRS) and additional Danish disclosure requirements for large enterprises in class C.
The consolidated financial statements are presented in DKK million (DKKm), and all values are rounded to the nearest thousand except when otherwise stated.
The accounting policies are consistent with those applied in the consolidated financial stat ements for 202 4, except for the changes to accounting standards that were effective from 1 January 202 5 and endorsed by the EU. The changes have not had a material impact on the financial statements.
CONSOLIDATION
The consolidated financial statements comprise the parent company A.P. M øller Holding A/S , its subsidiaries , and proportionate shares in joint arrangements classified as joint operations.
Subsidiaries are entities controlled by A.P. M oller Holding. Control is based on the power to direct the relevant activities of an entity and the exposure, or right , to variable returns arising from it. In that connection, relevant activities are those that significantly affect the investee’s returns. Control is usually achieved by directly or indirectly owning or in other ways controlling more than 50% of the voting rights, or by other rights, such as agreements on management control.
Joint arrangements are entities in which A.P. Moller Holding, according to contractual agreements with one or more parties, has joint control. The arrangements are classified as joint ventures if the contracting parties’ rights are limited to net assets in separate legal entities, and as joint operations if the parties have direct and unlimited rights to the assets and obligations for the liabilities of the arrangement.
Note 1.1:
General accounting policies
– continued
Entities in which A.P. Moller Holding exercises a significant but non -controlling influence are considered associated companies. A significant influence is usually achieved by directly or indirectly owning or controlling 20 -50% of the voting rights. Agreements and other circumstances are considered when assessing the degree of influence.
Consolidation is performed by summarising the financial statements of the parent company and its subsidiaries in accordance with A.P. Moller Holding’s accounting policies. Intra -group income and expenses, shareholdings, dividends, intra -group balances , and gains on intra -group transactions are eliminated. Unrealised gains on transactions with associated companies and joint arrangements are eliminated in proportion to A.P. Moller Holding’s ownership share. Unrealised losses are eliminated in the same way, unless they indicate impairment.
When the group ceases to consolidate or applies equity accounting for an investment because of a loss of control, joint control, or significant influence, any retained interest in the entity is remeasured to its fair value, with the change in the carrying amount recognised in profit or loss. This fair value becomes the initial carrying amount for the purpose of subsequently accounting for the retained interest as an associate, joint venture, or other equity investment. In addition, any amounts prev iously re cognised in other comprehensive income in respect of that entity are accounted for as if the group had directly disposed of the related assets or liabilities. Therefore, amounts previously recognised in other comprehensive income are reclassified to profit or loss .
Non -controlling interests’ share of the result for the year and of equity in subsidiaries is included as part of A.P. Moller Holding’s result and equity , respectively , but shown as separate items.
FOREIGN CURRENCY TRANSLATION
The functional currency of the parent company is USD. DKK has been selected as the presentation currency as the ultimate owner of the group, A.P. Moller Foundation, is located in Denmark.
In the translation to the presentation currency of the parent company, subsidiaries, associated companies, or joint arrangements with functional currencies other than DKK, the total comprehensive income is translated into DKK at average exchange rates, and the balance sheet is translated at the exchange rates as of the balance sheet date Exchange rate differences arising from such translations are recognised directly in other comprehensive income and in a separate reserve of equity.
The functional currency v aries from business area to business area. For the group’s global trade activities, the functional currency is typically USD. This means, among other things, that the carrying amounts of property, plant and equipment and intangible assets and, hence, depreciation and amortisation , are maintained in USD from the date of acquisition. For other activities, the functional currency is generally the local currency of the country in which such activities are performed, unless circumstances suggest that a different currency is appropriate
Transactions in currencies other than the functional currency are translated at the exchange rate prevailing on the date of the transaction. Monetary items in foreign currencies not settled by the balance sheet date are translated at the exchange rate as of the balance sheet date. Foreign exchange gains and losses are included in the income statement as financial income or expenses.
STATEMENT OF COMPREHENSIVE INCOME
Other comprehensive income consists of gains and losses not recognised in the income statement, including exchange rate adjustments arising from translation from the functional currency to the presentation currency, fair value adjustments of other equity investments (at FVOCI), cash flow hedges, forward points and currency basis spread , and actuarial gains/losses on defined benefit plans, etc. The group’s share of other comprehensive income in associated companies and joint ventures is also included.
On disposal or discontinuation of an entity, the group’s share of the accumulated exchange rate adjustment relating to the relevant entity with a functional currency other USD, is reclassified to the income statement. Accumulated value adjustments of equity instruments classified as equity instruments at fair value through other comprehensive income will remain in equity upon disposal.
Other comprehensive income includes current and deferred income tax to the extent the items recognised in other comprehensive income are taxable or deductible.
Note 1.1: General accounting policies –
continued
NEW FINANCIAL REPORTING REQUIREMENTS
In 2025, A.P. Moller Holding adopted the amendments to IAS 21 - The E ffects of Changes in Foreign Exchange Rates, which introduced requirements to assess when a currency is exchangeable into another currency and when it is not. The amendments have had no material effect on the consolidated financial statements.
A.P. Moller Holding has not yet adopted the following new or amended accounting standards and requirements that have not yet become effective :
• Amendments to IFRS 9 and IFRS 7 – amendments to the classification and measurement of financial instruments
• IFRS 18 Presentation and Disclosure in Financial Statements
The amendments to IFRS 9 and IFRS 7 clarify derecognition of financial liabilities on the settlements date with an optional policy for early derecognition via electronic payments. They provide additional guidance on assessing contractual cash flows for financial assets with ESG and similar features, clarify the treatment of non -recourse and contractually linked instruments, and introduce enhanced disclosures for contingent features and equity instruments measured at fair value through OCI. The amendments ar e effective from 1 January 2026 and are not expected to have any significant impact on recognition and measurement.
IFRS 18, which will be effective from 1 January 2027, replaces IAS 1 and introduces new requirements for presentation within the income statement, including specified totals and subtotals.
Furthermore, the standard requires all income and expenses to be classified within the income statement in one of five categories: operating, investing, financing, income taxes, and discontinued operations.
A.P. Moller Holding is currently working to identify all the impacts that IFRS 18 will have on the financial statements and notes to the financial statements. The initial expected material impacts on the consolidated financial statements are as follows:
• The tax line item in the current income statement will be classified either under operating or income tax categories based on whether they are under the scope of IAS 12 or not
• Foreign exchange differences will be classified in the same category as the related income and expenses from the items giving rise to the foreign exchange differences
• Interest received will be classified under investing activities on the cash flow statement
• A new note to the financial statements for the required disclosures on management -defined performance measures will be included
Other new standards, amendments, and interpretations that are not yet effective have not been disclosed, as we do not anticipate them having a material impact on the group’s consolidated financial statements.
DEFINITIONS OF FINANCIAL RATIOS
Return on equity is calculated as result for the year in proportion to the average total equity for the year.
Equity ratio is calculated as total equity end of year in proportion to total assets end of year .
Note 1.2: Significant accounting estimates and judgments
This note describes the significant accounting estimates and judgments that management has identified as having a potentially material impact on the group’s consolidated financial statements.
The preparation of the consolidated financial statements requires management to make estimates and judgments on an ongoing basis and form assumptions that affect the reported amounts. Management forms its estimates and judgments based on historical experience, independent advi ce, external data points , in-house specialists , and on other factors believed to be reasonable under the circumstances.
In its assumption setting, management deals with various aspects of uncertainty. One aspect of uncertainty is the assessment of control over investments classified a s associates, joint ventures, and subsidiaries, where the assessment forms the basis for classifica tion. Another aspect is the measurement of uncertainty, where management makes assumptions that derive the value of recognised assets and liabilities. These assumptions concern the timing and amount of future cash flows as well as the risks inhere nt in these.
In certain areas, the outcome of business plans, including ongoing negotiations with external parties to execute those plans or the outcome of negotiations to settle claims that are raised against the group, is highly uncertain. Therefore, assumptions may change, or the outcome may differ in the coming years, which could require a material upward or downward adjustment to the carrying amounts of assets and liab ilities.
The areas and their related impact in which the group is particularly expose d to material uncertainty over the carrying amounts as at the end of 202 5 are included in the individual notes as outlined below:
Note Significant accounting estimates and judgments Estimate/ Judgment Impact
Note 2.2 EU Emissions Trading Systems (ETS) classification determination Judgment L
Note 2.5 Recognition and measurement of deferred tax assets and uncertain tax positions Estimate M
Note 3.1 Cash -generating unit determination
Note 3.1 Impairment testing key assumptions
Note 3.2 Useful life and residual value estimates
Note 3.8 Provisions for legal dispute assumptions
Note 3.9 Measurement of acquired assets, liabilities, and contingent liabilities Judgment H
Note 5.4 Operations in countries with limited access to repatriating surplus cash assumptions Judgment L
Level of potential impact to the consolidated financial statements:
• L = Low
• M = Medium
• H = High
CLIMATE-RELATED RISKS
When preparing the consolidated financial statements, management considers climate -related risks , including where these could potentially impact reported amounts materially , and continuously monitors regulatory changes and developments. The areas in which the group has assessed climate -related risks at the end of 2025 are included in the individual notes including note 2.2, 3.1, and 3.2. Management is of the opinion that climate -related risks have not had a material impact on the group’s significant account ing estimates and judgments.
CHANGE IN ACCOUNTING ESTIMATES
As a result of the annual useful life review at the end of 2025, the useful lives of vessels will increase from 20 years to 25 years and will be applied prospectively as a change in the accounting estimate, effective 1 January 2026. The change is expected to result in reduced depreciation of around DKK 4.5bn in 2026. The change in useful lives has not impacted the financial position or results for 2025 or any previous periods.
OPERATING PROFIT
Note 2.1: Revenue
TYPES OF REVENUE
Types of revenue have been organised according to our four investment themes:
• Global trade includes shipping activities, sale of bunker oil, integrated transportation, fulfilment and management solutions, including landside and air transportation, warehousing and supply chain management offerings, gateway terminal activities, towage and related marine activities, and trading, etc.
• Energy transition includes sale of goods and services for renewable solutions
• Circularity, water & waste recovery includes sale of food packaging solutions, recycled plastic, and operators of water utility businesses
• Demographic & societal change includes mainly diagnostic services within laboratory, imaging, and pathology specialities
CONTRACTS WITH CUSTOMERS
Set out below is the reconciliation of the revenue from contracts with customers to the amounts disclosed as total revenue
Note 2.1: Revenue – continued
CONTRACT BALANCES
Amounts in DKKm
T rade receivables in the balance sheet include accrued income and contract assets comprising unbilled amounts representing the group’s right to consideration for the services transferred to date. All deferred income is recognised in the income s tatement within 12 months.
Under the payment terms generally applicable to the group’s revenue generating activities, prepayments are only received to a limited extent. Typically , payment is due upon or after completion of the services.
Part of the deferred income presented in the balance sheet constitutes contract liabilities , which represent advance payments and billings in excess of the recognised revenue.
There were no significant changes in accrued and deferred income during the reporting period.
Impairment losses disclosed in note 4.3 relate to receivables arising from contracts with customers.
PERFORMANCE OBLIGATIONS
Performance obligations are products and services that are to be completed under existing customer contracts. There is no performance obligations after five years.
ACCOUNTING POLICIES
Revenue is recognised when the performance obligation has been satisfied, which happens upon the transfer of control to the customer at an amount that reflects the consideration to which the group expects to be entitled in exchange for the goods and servic es.
Revenue from shipping activities is recognised over time as the performance obligation is satisfied, including a share of revenue from incomplete voyages at the balance sheet date. Invoiced revenue related to an estimated proportion of remaining voyage tim e and activities at the destination port is deferred. The percentage of completion is calculated as the remaining number of days of a voyage, as a percentage of the total number of days a voyage is estimated to last. Detention and demurrage fees are recogn ised over time until the customers’ late return or pick -up of containers.
Revenue from terminal operations and towing activities is recognised upon completion of the service. In container terminals operated under certain restrictive terms of pricing and service , etc., the value of tangible assets constructed on behalf of the concession grantor is recognised as revenue during the construction.
Revenue from most freight forwarding activities is recognised over time.
Revenue from the sale of goods is recognised upon the transfer of control to the buyer.
Contract work in progress and services are included in revenue based on the stage of completion so that revenue corresponds to the selling price of the work performed and service s completed in the financial year (the percentage -of-completion method) .
No significant element of financing is deemed present , as sales are made with credit terms which are consistent with market practice. Revenue from sales is recognised based on the price specified in the contract, net of the estimated volume discounts. Accumulated experience is used to estimate and provide for the discounts, using the expected value method, and revenue is only recognised to the extent that it is highly probable that a significant reversal will not occur.
Note 2.2: Operating costs
1 Includi ng DKK 114m (DKK 7 3m) related to research and development expenditures
Customary agreements have been entered into with employees regarding compensation in connection with resignation w ith consideration for local legislation and collective agreements.
The remuneration expense for share -based payments included in wages and salaries amounts to DKK 296m (DKK 256m). Please refer to note 5.1 for further information about share -based payment s.
FEES AND REMUNERATION TO THE EXECUTIVE BOARD AND BOARD OF DIRECTORS
The Executive Board of A.P. Moller Holding is considered key management personnel. The group has a cash -settled incentive plan to members of the Executive Board and grants have been awarded on a yearly basis . The incentive plan provides an annual bonus and long -term incentive programmes, which are determined by the development in the value creation of the underlying investments . The main part s of the long -term incentive programmes are capped.
TO STATUTORY AUDITORS
Note 2.2: Operating costs – continued
SIGNIFICANT ACCOUNTING JUDGMENTS
Climate-related risks
The group is subject to the new EU Emissions Trading System (ETS), a cap -and -trade system to reduce emissions via a carbon market. Implementation of the EU ETS requires the group to purchase EU allowances (EUAs) representing the right to emit a specific amount of greenhouse gases.
The group has purchased EUAs as spot, future , or forward contracts. EUA futures and forwards satisfy the conditions for the ‘own use ’ exemption and are off -balance -sheet items.
EUA contracts are classified as other current assets upon delivery of certificates. They are measured at cost of settlement and are not subject to remeasurement until surrender. The cost of settlement includes all purchase, conversion , and other directly attributable costs such as transaction costs.
The accrual is recognised as fuel is burnt in the group’s applicable shipping activities, measured at expected cost for the required EUAs, based on actual emissions and the price of the EUAs, which is calculated as a weighted average price of EUA spots, futures , and forwards. The corresponding cost is presented as bunker cost.
Note 2.3: Depreciation, amortisation and impairment losses, net
1 In 2024, a reversal of impairment of DKK 18m related to assets held for sale is included
For more information, reference is made to note 3.1, 3.2, and 3.3.
Note 2.4: Gain on sale of non-current assets, etc., net
Gains include the sale of vessels and equipment DKK 1.5bn (DKK 2.3bn) and sale of businesses DKK 0. 1bn (DKK 1.9bn).
Losses are related to the sale of vessels and equipment DKK 0. 5bn (DKK 0.4bn) and sale of other non -current assets DKK 0.1bn (DKK 0.5 ).
ACCOUNTING POLICIES
Operating costs comprise costs incurred in generating revenue for the year, including costs for crew, labour, raw materials and consumables, repair and maintenance, and sales and administrati on
Note 2.5: Tax and deferred tax
T he group generates profit across multiple business sectors and countries. Corporate income taxes comprise taxes calculated in accordance with various countries’ tax regimes, including global minimum taxation (OECD Pillar Two).
The land -based activities, which are subject to normal corporate income tax, include terminals, logistics, services and shipping agencies, sale of industrial products, diagnostics services, and financial profit from other equity investments.
The taxation of shipping income, generated by vessels providing services on the high seas, calling at multiple ports across the globe, is outlined in the OECD Model Tax Convention, Article 8 (Shipping Article). Under the Shipping Article, activities are taxable in the jurisdiction where the ship owning and operating entity is resident. Within ou r group, this is predominantly in Denmark and Singapore.
To encourage ship registration in Europe and ensure global competitiveness of the European Maritime Industry, the EU has approved a specific shipping regime. This is normally referred to as tonnage tax which calculates corporate income tax, based on the ne t tonnage of the fleet. Consequently, under the tonnage tax regime, no credit is given for losses and, despite massive capital investments in containers and vessels, no tax deductions are granted for depreciation or operating expenses.
Tonnage tax regimes apply to the main part of the group’s activities within global trade and result in a stable annual tax liability. Given the liability to tonnage tax is not impacted by financial profits, and is payable even in loss making years, the eff ective tax rate (ETR) metric can fluctuate significantly.
Note 2.5: Tax and deferred tax – continued
Three elements are key to understanding how the global minimum taxation rules will impact the g roup. First, the g roup does not set up artificial structures in low -tax jurisdictions for tax purposes or earn significant profits in such jurisdictions, which means that the group’s business structure itself is not impacted significantly by the rules, but some additional tax may become payable where services are provided in low -tax jurisdictions. Second, tax incentives given to capital projects, such as critical infrastructure, will be considered less effective going forward , as it will impact the effective tax rate and thereby the basis for potential top -up tax. Third, although the rules exclude ‘international shipping income ’, the definition is more restrictive than the global definitions usually applied under a tax treaty following the OECD Model Tax Convention or under Danish tonnage tax.
Assets Liabilities Net liabilities
The unrecognised deferred tax assets have no significant time limitations. There are no substantial unrecognised tax liabilities on investments in subsidiaries, associated companies , or joint ventures.
SIGNIFICANT ACCOUNTING ESTIMATES
Deferred tax assets
Judgment ha s been applied with respect to the group’s ability to utilise deferred tax assets. Management considers the likelihood of utilisation based on the latest business plans and recent financial performances of the individual entities. Net deferred tax assets recognised in entities having recognised an accounting loss in either the current or preceding period amount to DKK 1.0bn (DKK 1.4bn). These assets mainly relate to unused tax losses or deductible temporary differences generated during construction of terminals, where taxable profits have been generated either in the current period or are expected within a foreseeable future.
Uncertain tax positions
The group is engaged in a number of disputes with tax authorities of varying scope. Appropriate provisions and recognition of uncertain tax positions have been made where the probability of the tax position being upheld in individual cases is considered le ss than 50%. Claims, for which the probability of the group’s tax position being upheld is assessed by management to be at least 50%, are not provided for. Such risks are instead evaluated on a portfolio basis by geographical area and country risk. Provisi ons and uncertain tax liabilities are recognised when the aggregated probability of the tax position being upheld is considered less than 50%.
Note 2.5: Tax and deferred tax – continued
ACCOUNTING POLICIES Tax
Tax comprises an estimate of current and deferred income tax as well as adjustments to previous years ’ taxes . Income tax is tax on taxable profits and consists of corporation tax , withholding tax of dividends, etc. Tax is recognised in the income statement to the extent it arises from items recognised in the income statement, including tax o n gains on intragroup transactions that have been eliminated in the consolidation.
Deferred tax
Deferred tax is calculated on temporary differences between the carrying amounts and tax bases of assets and liabilities. Deferred tax is not recognised for differences on the initial recognition of assets or liabilities where , at the time of the transaction , neither accounting nor taxable profit/loss is affected, unless the differences arise in a business combination. In addition, no deferred tax is recognised for undistributed earnings in subsidiaries when the group controls the timing of dividends . N o ta xable dividends are currently expected. A deferred tax asset is recognised to the extent that it is probable that it can be utilised within a foreseeable future.
The group applies the IAS 12 exception to recognising and disclosing information about deferred tax assets and liabilities related to Pillar Two income taxes.
Intangible assets
INVESTED CAPITAL
3
2
1
Note 3.1: Intangible assets –
continued
The carrying amount of goodwill has been allocated to the following operating cash -generating units (CGUs) based on the management structure.
1 From 2025, Tray and Recycling PET are defined as one cash -generating unit, reflecting the integration of
cling as a key pre -material supplier for the Tray business
IMPAIRMENT – KEY ASSUMPTIONS APPLIED
T he outcome of the impairment tests is subject to estimate s of the future development of freight rates and volumes, demographic and societal changes, demand for sustainable solutions, commodity prices, including but not limited to oil and utility prices, inflation, and the discount rates before tax applied as well as assumptions specific to the CGU Management determines these key assumptions by considering past experience as well as market analysis and future expectations based on supply and demand trends.
1 The growth rates applied reflect current market expectations for the relevant period. The discount rates are after tax
Note 3.1: Intangible assets – continued
RESULT OF IMPAIRMENT ASSESSMENTS
Logistics & Services
Management ’s revenue outlook reflects current market conditions relating to rates and volumes and updated commercial expectations. The CGU is expected to deliver sustainable growth toward its long term objectives. Assumptions exclude future investment driven elements and reflect only the performance of the existing asset base.
Margin assumptions reflect operational improvements and cost management. SG&A cost efficiency is expected to improve through automation and AI. Variable costs are expected to improve as productivity increases, supported by technology and process improvements. The annual impairment test is based on the estimated value in use from the five -year business plan for 2026 -20 30, where the volume and improved margin growth assumptions reflect the current expectations for the relevant period.
The impairment test showed headroom between the value in use and the carrying amount. Management is of the opinion that the assumptions applied are sustainable.
Demographic & societal change
Future cash flow estimates are based on current budgets and long -term business projections with an extended forecast period for 2031 -2038 . These forecasts anticipate steady growth supported by demographic trends and a diverse range of contracts with governments, insurance companies, healthcare providers, and clinics. Projections assess organic growth potential, considering factors such as sales, margins, and necessary investments. Management views the expected growth rate as realistic, with external analyse s supporting long -term growth expectations .
The impairment test showed headroom between the value in use and the carrying amount as of 31 December 2025. The sensitivity test performed shows that there is headroom for a reasonable possible change in the key assumptions, individually.
Circularity
Future net cash flow estimates are derived from current budgets and business plans that analyse market opportunities, sales, and operational margins. These plans account for necessary investments to sustain and grow the business. The average revenue growth rates in the forecast period (2026 -2030) are generally kept unchanged compared to prior year . M anagement considers the average growth rates for reasonab le based on the business and market plans at hand
The impairment test showed headroom between the value in use and the carrying amount. The sensitivity test performed shows that an increase above 0.25 ppts in the discount rate or a decline of 1.00 ppts in the EBITDA margin, individually, will eliminate the headroom
OTHER INTANGIBLE ASSETS WITH INDEFINITE USEFUL LIFE
Terminal and service c oncession righ ts include DKK 216m (D KK 228 m) related to terminal rights with indefinite useful life. These terminal rights are included in the impairment test for Terminals.
B rand names with indefi nite useful life of DKK 3.6bn (DKK 3.0bn ) are included in the cash -generating units Circularity and Energy transition (other solutions) . T hus, the asset is carried at cost without amortisation, as it is estimated that the brand will generate net cash inflows for an indefinite period
Note 3.1: Intangible assets –
continued
SIGNIFICANT ACCOUNTING ESTIMATES
Impairment tests
The recoverable amount of each cash -generating unit is determined based on the higher of its value in use and fair value less costs to sell. The estimated value in use is calculated using certain key assumptions for the expected future cash flows and is se nsitive to the terminal growth rate and the discount rate. The valuation (level 3) is prepared by discounting expected net cash flows.
Current market values for vessels, etc., are estimated using acknowledged brokers. In Terminals, the recoverable amount is measured at fair value less cost of disposal, reflecting a market participant’s perspective.
Projected future cash flows are estimated based on financial budgets , forecasts, and business plans. T hese projections are subject to judgments and estimat ion s and are based on experience and external sources, where available.
The terminal growth rate is determined based on the future expected economic growth rate. Replacement CAPEX during the terminal period is determined based on management ’s plans and expectations for the future. In Terminals, cash flows are discounted until concession end. These projections incorporate anticipated concession extensions as well as costs and benefits associated with restructuring and improvements that a potential buyer would consider to maximise terminal value.
The discount rates applied reflect the time value of money as well as the specific risks related to the underlying cash flows, i.e. project and/or country -specific risk premium s to reflect local market conditions Any uncertainties reflecting past performance and possible variations in the amount or timing of the projected cash flows, are generally reflected in the discount rates.
SIGNIFICANT ACCOUNTING JUDGMENTS
Determination of cash-generating units
Management applies judgment in the de termination of cash -generating units that are expected to benefit from the business combination from which goodwill is allocated and in the selection of methodologies and assumptions applied in impairment tests. The determination of cash -generating units differs for various business areas.
Ocean operates its fleet of container vessels and hub terminals in an integrated network. Consequently, Ocean activities are tested for impairment as a single cash -generating unit.
Logistics & Services, including first -mile activities, is considered one cash -generating unit . Management views Logistics & Services products as an integrated network , with the activities tested for impairment as a single cash -generating unit .
In Terminals, each terminal is considered an individual cash -generating unit for impairment tests, except when the capacity is managed as a portfolio.
Supply vessels and product tanker vessels with similar functionality and operating environment are considered as one cash -generating unit.
Towage & maritime services, Demographic & societal change, Circularity, and E nergy transition (renewable solutions and other solutions) are each considered as one cashgenerating unit.
Note 3.1: Intangible assets
– continued
ACCOUNTING POLICIES
Intangible assets are measured at cost less accumulated amortisation and impairment losses. Amortisation is calculated on a straight -line basis over the estimated useful lives of the assets. The fair value of any future contingent payments is include d in the cost at acquisition. Subsequent adjustments are recognised in the income statement.
For container terminals operated under certain restrictive price and service conditions, etc., concessional rights to collect usage charges are included under intangible assets. The cost includes the present value of minimum payments under concession agree ments and the cost of property, plant and equipment constructed on behalf of a grantor of a concession. The rights are amortised from the commencement of operations over the concession peri od. The concession period ranges from 10 to 34 years, with an avera ge of 17 years.
Goodwill arises when the group acquires a business and pays a higher amount than the fair value of its net assets, primarily due to the synergies the g roup expects to create. Goodwill is not amortised but is subject to annual impairment reviews. Goodwill has an indefinite useful life, while most other intangible asset classes have definite lives . T he useful lives of other classes are as follows:
Note 3.2: Property, plant and equipment
useful lives and residual values are reassessed on a regular basis.
in DKKm
3.2:
continued
Please refer to note 1.2 and 3.1.
RESULTS OF IMPAIRMENT ASSESSMENTS
Impairment losses per cash -generating unit recognised are specified as follows:
T he recoverable amount of each cash -generating unit is determined based on the higher of its value in use or fair value less cost of disposal . The estimated value in use is calculated using certain key assumptions for the expected future cash flows and applied discount factor s. Current market values for vessels, etc., are estimated using acknowledged brokers.
Projected cash flow models are used when fair value is not obtainable or when fair value is deemed lower than value in use. The cash flow projections are based on financial budgets and business plans approved by management.
Impairment reversal 2025
Reversal of impairment losses are mainly related to terminals. Reference is made to note 3.1.
Impairment losses 2024
Impairment losses are mainly related to terminals. Reference is made to note 3.1.
Impairment reversal 2024
Reversal of impairment of vessels is related to sale of business es
Note 3.2: Property, plant and equipment
– continued
PLEDGES
Property, plant and equipment with a carrying amount of DKK 3.1bn (DKK 3.6bn) has been pledged as security for loans of DKK 0.7bn (DKK 0.9bn).
SIGNIFICANT ACCOUNTING ESTIMATES
Useful lives and residual values
Useful lives are estimated annually based on experience. When an asset’s useful life changes, management revises the estimates for individual assets or groups of assets with similar characteristics due to factors such as quality of maintenance and repair, technical development, or environmental requirements.
The residual value of container vessels is difficult to estimate given their long useful lives, the uncertainty of future economic conditions, the market for conventional fuel vessels, and the uncertainty of future steel prices, which are considered the main determinants of the residual value. A dditionally, the acceleration of the development of vessels with a lower carbon footprint may generate downward pressure on the market for second -hand conventional fuel vessels. Generally, the residual value of conta iner vessels is initially estimated at 10% of the purchase price excluding dry -docking costs.
Climate-related risks
Management has also considered the impact of decarbonisation and climate -related risks on the useful lives of existing assets. Such risks include new climate -related legislation restricting the use of certain assets, new technology required by climate -related legislation, and the increase in restoration costs for terminal sites due to new and/or mo re comprehensive policies.
T he useful lives of container vessels and related assets that operate on bunker fuel have been considered in conjunction with A.P. Moller - Maersk’s net zero by 2040 target , including in the annual useful life review at the end of 2025 as disclosed in note 1.2.
ACCOUNTING POLICIES
Property, plant and equipment are valued at cost less accumulated depreciation and impairment losses. Depreciation is charged to the income statement on a straight -line basis over the useful lives at an estimated residual value. The useful lives of assets are typically as follows:
Vessels , etc.
Containers, etc.
Buildings
Terminal infrastructure
20 -25 years
15 years
10 -75 years
10 -30 years or concession period, if shorter
Warehouses and related infrastructure 5-25 years or lease term, if shorter Aircrafts and related components 3-30 years
Plant and machinery, cranes, and other terminal equipment 3-25 years
Other operating equipment, fixtures, etc. 3-10 years
Estimated useful lives and residual values are reassessed on a regular basis.
Cost comprises the acquisition price as well as cost s directly associated with the asset until it is ready for its intended use.
The cost of an asset is divided into separate components, which are depreciated separately if the useful lives of the individual component s differ. Dry -docking costs are recognised in the carrying amount of the vessels when incurred and depreciated over the period until the next dry -docking.
The cost of assets constructed by the group in cludes directly attributable expenses and indirect costs related to materials, components , and payroll that directly concern the construction of assets. For assets with a long construction period, borrowing costs during the construction period from specific as well as general borrowings are attributed to the cost of the asset. In addition, the cost includes the net present value of estimated costs of removal and restoration.
Note 3.3: Right-of-use assets
Amounts in DKKm
As part of the group’s activities, customary leasing agreements are entered into, especially regarding the chartering of vessels, leasing of containers and other equipment , and real estate. In some cases, leasing agreements comprise purchase options exercisable by the group and options for extending the lease term. The group also enters into concession agreements that provide the right to use some existing infrastructure or land as required to carry out the terminal business.
To optimise lease costs during the contract period, the group sometimes provides residual value guarantees in relation to equipment leases. At year -end , the expected residual values were reviewed to determine if these reflected the actual residual values achieved on comparable assets and expectations about future prices. As of 31 December 202 5, DKK 1.3 bn (DKK 2. 0bn) is expected to be payable and is included in the measurement of lease liabilities.
Leases to which the group is committed, but for which the lease term has not yet commenced , have an undiscounted value of DKK 6 1.6 bn (D KK 67.6 bn). They comprise approx. 8 5 (87 ) contracts commencing between 202 6 and 2029 (202 5 and 202 9).
Certain terminal concession agreements contain variable payment terms that are linked to future performance, i.e. number of containers handled. Such payments are recognised in the income statement in the period in which the condition that triggers those pa yments occurs.
Lease liabilities are disclosed in note 4.2, 4.3, 4.4, and 5.2.
Amounts in DKKm
Amounts recognised in the income statement
from sublease of right -of-use assets
in the income statement
Amounts in DKKm
Note 3.3: Right-of-use-assets – continued
ACCOUNTING POLICIES
Right -of-use assets are mainly lease d vessels , containers , concession agreements, and real estate property . Lease contracts for vessels and containers are typically made for fixed periods of about five years but may have extension options as described together with lease liabilities. Concession agreements and real estate contracts are negotiated on an individual basis and contain a wide range of terms and conditions.
Leases are recognised as a right -of-use asset with a corresponding liability at commencement of the lease . The right -of-use asset is depreciated over the shorter of the asset’s useful life and the lease term on a straight -line basis.
The interest element of lease payments related to leases capitalised under IFRS 16 is recognised in the income statement under financial expenses.
Payments associated with short -term leases and leases of low -value assets are recognised on a straight -line basis as an expense in the income statement under operating costs.
Note 3.4: Investments in associates
Summarised financial information for associates that are material for the group as of 31 December 2025 are presented below.
DANSKE BANK A/S, ASSOCIATED COMPANY
Since 1928, A.P. Moller Group has been a shareholder in Danske Bank - a Nordic universal bank offering a diversified platform across the Nordic markets.
Amounts in DKKm
Note 3.4: Investments in associates – continued
T he group’s share of the car rying amount in Danske Bank A/S is reconciled as follows:
Amounts in DKKm
As of 31 December 202 5, the market value amount ed to DKK 55 4bn (DKK 36 2bn).
OTHER ASSOCIATED COMPANIES
In addition to the interests in material associated companies disclosed above, the group also has interests in a number of individually immaterial joint ventures and associates.
in DKKm
ACCOUNTING POLICIES
Share of result in associated companies is recognised net of tax and corrected for the share of unrealised intra -group gains and losses. The item also comprises any impairment losses for such investments and their reversal.
Investments in associated companies are recognised at the group’s share of the equity value inclusive of goodwill less any impairment losses. Goodwill is an integral part of the value of associated companies and is therefore subject to an impairment test t ogether with the investment as a whole. Impairment losses are reversed to the extent the original value is considered recoverable.
Note
3.5: Loans receivable
Loans receivable amount to DKK 70. 4bn (DKK 113 7bn) and consist primarily of term deposits with a maturity of more than three months. For details on the assessment of the expected losses on term deposits, please refer to note 4.3.
ACCOUNTING POLICIES
Loan s receivable are initially recognised at fair value, plus any direct transaction costs , and subsequently measured at amortised cost using the effective interest method. W ritedown s are made for expected losses based on specific individual or group assessments.
Note 3.6: Other receivables
Other receivables primarily consist of prepayments made for operational activities that will be utilised after twelve months amounting to DKK 12.1bn (DKK 13.6bn)
ACCOUNTING POLICIES
Other receivables are generally recognised at nominal value, substantially corresponding to amortised cost and impaired for expected losses based on the expected loss model as described in IFRS 9
Note 3.7: Inventories
The amount of inventories recognised as an expense during the period amounts to DKK 54.4bn (DKK 65.7bn).
ACCOUNTING POLICIES
Inventories mainly consist of bunker, spare parts not qualifying as property, plant and equipment, and raw materials and consumables. Inventories are measured at the lower of cost including delivery costs and indirect production costs and net realisable value, primarily according to the FIFO method. The cost of finished goods and work in progress includes direct and indirect production costs.
Note 3.8: Provisions
from business combinations
Non -current provisions
Restructuring includes provisions for decided and publicly announced restructurings and includes mainly staff redundancy costs. Legal disputes, etc. include , among other things , indirect tax and duty disputes. Other primarily includes provisions for warranties and onerous contracts
Reversals of provisions primarily relate to legal disputes and contractual disagreements, which are recognised in the income statement under operating costs and tax.
SIGNIFICANT ACCOUNTING ESTIMATES
Management’s estimate of the provisions for legal disputes, including disputes on taxes and duties, is based on the knowledge available on the substance of the cases and a legal assessment of these. The resolution of legal disputes, through either negotiations or litigation, can take several years t o be reached and the outcome s are subject to considerable uncertainty.
Note 3.8: Provisions - continued
ACCOUNTING POLICIES
Provisions are recognised when the group has a present legal or constructive obligation from past events. The item includes, among others, legal disputes, provision s for onerous contract s, and unfavourable contracts acquired as part of a business combination. Provisions are recognised based on best estimates and are discounted where the time element is significant and where the time of settlement is reasonably determinable.
Note 3.9: Acquisition/sale of subsidiaries and activities
DURING 2025
Panama Canal Railway Company (Ocean)
On 1 April 2025, the g roup acquired 100% of the shares in Panama Canal Railway Company (PCRC). PCRC operates a 76 km single -line railway adjacent to the Panama Canal, mainly facilitating cargo movement between the Atlantic and Pacific Oceans.
Goodwill is mainly attributable to expected future synergies from PCRC ’s established operational framework, decreasing the time and resources the g roup would need to invest in building the capabilities from scratch. Goodwill was allocated to the Ocean CGU . Acquired goodwill is not deductible for tax purposes.
From the acquisition date to 31 December 2025, PCRC contributed with insignificant revenue and net profit. Had the acquisition occurred on 1 January 2025, the impact on the g roup ’s revenue and net profit would have been insignificant.
Other
During 2025, a number of other acquisitions were completed. The acquisitions were smaller addons in current portfolio companies and businesses, including Officine Mazzocco Pagnoni (OMP) .
The accounting for the business combination s is considered provisional as of 31 December 202 5, as the valuation of intangible assets is not yet finalised.
Other acquisitions also include minor adjustments to the valuation of intangible assets acquired during 2024, as the accounting for the business combination s wa s considered provisional as of 31 December 2024.
DIVESTMENTS DURING 2025
No material sales were undertaken during 2025.
Note 3.9: Acquisition/sale of subsidiaries and activities - continued
ACQUISITIONS DURING 2024
Transaction related costs recognised in the income statement amounted to DKK 104m .
Concentric (Energy transition)
On 29 August 2024, the group announced a public cash offer to the shareholder s of Concentric AB. At the end of the acceptance period on 16 October 2024, the offer had been accepted by 95.4% of the shareholders. On 7 November 2024, the company was delisted and traded on Nasdaq Stockholm for the last time. The group initiated a compul sory buy -out of the outstanding shares that was completed in 2025.
Concentric is one of the world’s leading players in flow control and fluid power technology for the commercial vehicle market, providing customers with advanced technology pumps, thermal management , and hydraulic systems. With its products, Concentric aims to improve customer efficiency through better fuel economy, reduc ed emissions, and improv ed engine control through technical solutions and precision engineering.
The purchase price allocation resulted in goodwill of DKK 3 .1bn . Acquired goodwill is not allowable for tax purposes.
The acquisition contributed revenue of DKK 0.3bn and an insignificant net profit. Had the acquisition occurred on 1 January 2024, the impact on the group’s revenue would have been DKK 2.4bn and net profit of DKK 0.1bn, including amortisation of intangibles recognised in the acquisition
Other
During 2024, a number of other acquisitions were completed. The acquisitions were smaller addons in current portfolio companies and businesses.
DIVESTMENTS DURING 2024
The group completed the transaction to combine Maersk Supply Service and DOF. With the completion of the agreement, our group holds 25% of the share capital in the combined company.
Furthermore, the merger of ZeroNorth and Alpha Ori Technologies was completed during 2024 leading to A.P. Moller Holding group no longer having control of the business .
No other material sales were undertaken during 2024.
SIGNIFICANT ACCOUNTING JUDGMENTS
Business combinations
Upon acquisition of new entities, the acquired assets, liabilities, and contingent liabilities are measured at fair value. In fair value assessments, significant judgments have been made and estimates have been applied using various valuation techniques.
Note
3.9:
Acquisition/sale of subsidiaries and activities - continued
ACCOUNTING POLICIES
Upon the acquisition of new entities, the acquired assets, liabilities , and contingent liabilities are measured at fair value at the date when control was achieved using the acquisition method. Identifiable intangible assets are recognised if they arise from a contractual right or can otherwise be separately identified. The d ifference between the fair value of the acquisition cost and the fair value of the acquired identifiable net assets is recognised as goodwill. Contingent consideration is measured at fair value and any subsequent changes to contingent consideration are rec ognised as financial income or financial expense in the income stateme nt. If contingent consideration is settled by issuing a predetermined number of shares, the contingent consideration is classified as equity and is subsequently not remeasured at fair value. Transaction costs are recognised as operating costs in the income statement and as cash flow from operating activities in the cash flow statement .
When the group ceases to have control of a subsidiary, the value of any retained investment is remeasured at fair value , and the value adjustment is recognised in the income statement as a gain or loss on the sale of non -current assets. The difference between sales proceeds and the carrying amount of the subsidiary is recognised in the income statement, including fair value of the contingent consideration at the time of sale. Contingent cons ideration is remeasured at fair value with changes recognised in th e income statement.
The effect of the purchase and sale of non -controlling interests without changes in control is included directly in equity.
Note 3.10: Assets held for sale or distribution
ASSETS HELD FOR SALE AS OF 31 DECEMBER 2025
A ssets held for sale relate mainly to vessels and an aircraft , expected to be sold in 2026 An impairment loss of DKK 146m has been recognised.
ASSETS HELD FOR SALE AS OF 31 DECEMBER 2024
A ssets held for sale relate mainly to vessels as well as production facilities and equipment, for which the sale was subsequently completed in 2025.
ACCOUNTING POLICIES
Assets held for sale are recognised when the carrying amount of an individual non -current asset, or disposal group of assets, is recovered principally through a sales transaction rather than through continued use. Assets are classified as held for sale whe n activities to carry out a sale have been initiated, when the activities are available for immediate sale in their present condition, and when the activities are expected to be disposed of within 12 months. Liabilities directly associated with assets held for sale are presented separately from other liabilities.
Assets held for sale are measured at the lower of the carrying amount immediately before classification as held for sale and the fair value less costs to sell. Impairment tests are performed immediately before classification as held for sale. Non -current assets are not depreciated or amortised while classified as held for sale. Measurement of deferred tax and financial assets and liabilities is unchanged .
When an asset or a disposal group has been classified as held for sale or distribution, but the requirements are no longer met, the assets and related liabilities cease to be classified as held for sale. The cessation of the classification as held for sale will be reflected in the period in which the change of circumstances has occurred. Comparative figures are not restated, and any adjustments to the carrying value of assets and liabilities previously classified as held for sale are recognised in the perio d in which the circumstances have changed.
Note 4.1: Financial income and expenses
CAPITAL AND FINANCING
Note 4.2: Borrowings and lease liabilities reconciliation
1 Includes fair
Issued bonds include green bonds of DKK 19.0bn (DKK 17.1bn), while bank and other credit institutions include green loans of DKK 4.8bn (DKK 2.0bn), primarily used to finance investments in dual -fuel vessels, electrified material -handling equipment, and construction of low -emission buildings.
Cash flows from financing activities related to total borrowings are adjusted for cash flow from hedges of DKK 0.8bn (DKK 0.0bn). The maturity analysis of lease liabilities is disclosed in note 4.3.
Note 4.2: Borrowings and lease liabilities reconciliation - continued
ACCOUNTING POLICIES
Financial liabilities
Financial liabilities are initially recognised at fair value less transaction costs. Subsequently, the financial liabilities are measured at amortised cost using the effective interest method, whereby transaction costs and any premium or discount are recog nised as financial expenses over the term of the liabilities. Fixed interest loans, subject to fair value hedge accounting, are measured at amortised cost, with an adjustment for the fair value of the hedged interest component.
Lease liabilities
Lease liabilities are measured at the present value of the lease payments over the lease term, at the interest rate implicit in the lease, or at the group’s incremental borrowing rate (IBR). The applied IBR reflects the group’s credit risk, leased amount, and contract duration, as well as the nature and quality of the asset’s security and economic environment in which the leased assets operate. To determine the IBR, where possible, the group uses recent third -party financing received by the individual lesse e as a starting point, with adjustments to reflect changes in financing conditions since that financing was received. Where such financing is not available, the group uses a build -up approach that starts with a riskfree interest rate adjusted by credit risk and specific risks faced by the lessee such as asset type, geographical risks, etc.
Subsequently, the lease liability is measured at amortised cost with each lease payment allocated between the repayment of the liability and financing cost. The financ ing cost is charged to the income statement over the lease period using the IBR that was used to discount the lease payments.
The following lease payments are included in the net present value:
• Fixed payments (including in -substance fixed payments), less any lease incentives receivable
• Variable lease payments which are based on an index or a rate
• Amounts expected to be payable by the lessee under residual value guarantees
• The exercise price of a purchase option if the lessee is reasonably certain to exercise that option, and payments of penalties for terminating the lease if the lease term reflects the lessee exercising that option
E xtension and termination options in lease contracts are included in contracts where it is reasonable that the group will exercise th ose options. These terms are used to maximise operational flexibility in terms of managing contracts. In determining the lease term, management considers all facts and circumstances that create an economic incentive to exercise an extension option, or not exe rcise a termination option. Most of the extension and termination options held are exercisable only by the group and not by the respective lessor. The assessment is reviewed if a significant event or a significant change in circumstances occur s, which affects this assessment and is within the control of the lessee. Where the group will probably exercise specific purchase options, those options are included in the measurement of the lease liability with the corresponding right -of-use asset depreciated over the asset’s useful life rather than lease term.
Note 4.3: Financial instruments and risks
Hedges comprise primarily currency and interest rate derivatives as well as oil price hedges, which are further described in the following sections.
The gains/losses of the derivatives are recognised as follows:
The group’s activities expose it to a variety of financial risks:
• Market risk
• Credit risk
• Liquidity risk
The group’s risk management programmes focus on the unpredictability of financial markets and seek to minimise the potential adverse effects on the group’s financial performance. The group uses derivative financial instruments to hedge certain risk exposur es.
Risk management is most effectively managed by each portfolio company. Consequently, the management of risks related to our portfolio companies is anchored with the Board of Directors in each of our portfolio companies. A.P. Moller Holding monitors business performance in the portfolio companies closely as part of our ownership aspiration.
MARKET RISK
Market risk covers changes in market prices, such as foreign exchange rates, interest rates, and share prices that w ill affect the group’s profit or the value of its holdings of financial instr uments. The sensitivity analyses in the currency risk and interest rate risk sections below relate to the position of financial instruments as of 31 December 20 25 .
The sensitivity analyses for currency risk and interest rate risk have been prepared on the basis that the amount of net debt, the ratio of fixed to floating interest rates of the debt , and the proportion of financial instruments in foreign currencies remain unchanged from hedge designations in place at 31 December 20 25 . Furthermore, it is assumed that the exchange rate and interest rate sensitivities have a symmetrical impact, i.e. an increase in rates results in the same absolute movement as a decrease in rates .
The sensitivity analyses show the effect on profit and equity of a reasonable possible change in exchange rates and interest rates.
Hedges comprise primarily currency derivatives and interest rate derivatives, which are further described in the following sections.
CURRENCY RISK
The group’s currency risk relates mainly to the fact that while income from global trade is denominated mainly in USD, the related expenses are incurred in both USD and a wide range of other currencies such as BRL, C NY , DKK, and EUR. Income and expenses from the group’s other activities are primari ly denominated in local currencies, thus reducing the group’s exposure to these currencies. As the net income is primarily in DKK, EUR , GBP, and USD, th ese are also the primary financing currencies.
Note 4.3: Financial instruments and risks – continued
The main purpose of hedging the currency risk in each portfolio company is to hedge the DKK, EUR , or USD value of the portfolio company’s net cash flow and reduce fluctuations in the net profit of the portfolio company. The group uses various financial derivatives, including forwards and cross -currency swaps , to hedge these risks. The key aspects of the currency hedging policy are:
• Net cash flows in significant currencies other than DKK, EUR, and USD are generally hedged using a layered model with a 12 -month horizon
• Significant capital commitments or divestments in currencies other than DKK, EUR, and USD are hedged
• Most debt in currencies other than DKK, EUR, and USD is hedged depending on the assetliability match and the currency of the generated cash flow
Currency derivatives hedge future revenue, operating costs, and investments/divestments, and are recognised on an ongoing basis in the income statement and the cost of property, plant and equipment, respectively. There is not any proxy hedging for the curr ency risk hedging, and therefore the economic relationship between the hedged exposure and the hedge is high. Effectiveness is assessed using the critical terms match approach according to IFRS 9.
Hedges of future revenue and operating costs mature within a year (mature within a year). There are no hedges of investments at the end of 2025 ( no hedges of investments ).
For hedges related to operating cash flows and investments, a gain of DKK 929m in 2025 (loss of DKK 875m) is recognised in other comprehensive income, and the cash flow hedge reserve amounts to a gain of DKK 344m as of 31 December 2025 (loss of DKK 579m). For hedges where the cost of hedging is applied, the forward points are recognised in other comprehensive income and transferred with the effective hedge when the hedged transaction occurs. The cost of hedging reserve amounts to DKK 0m (DKK 0m). There was no i neffectiveness in 2025 (no ineffectiveness ).
Amounts in DKKm
Besides the designated cash flow hedges in the table above, the group uses derivatives to hedge currency exposures that do not qualify for hedge accounting. These derivatives are classified as fair value through profit or loss. The average FX hedge rates for swaps in cash flow hedge s were EUR/USD 1.14 (1.13) and GBP/USD 1.52 (1.52). The average FX hedge rates for swaps in combined fair value hedges were EUR/USD 1.18 (1.18) and USD/NOK 8.28 (8.2 5).
Other hedges recognised at fair value through p rofit and loss :
Amounts in DKKm
Note 4.3: Financial instruments and risks – continued
The group’s sensitivity within global trade activities to an increase in the USD exchange rate of 10% against all other significant currencies, to which the activities are exposed, is est imated to have the following symmetrical impact:
Currency sensitivity for financial instruments Profit before tax Equity before tax
in DKKm
The sensitivities are based only on the impact of financial instruments that are outstanding at the balance sheet date and are thus not an expression of the group’s total currency risk.
OIL PRICE RISK
The majority of the group’s trading of commodity products is related to inventory stocks of crude oil and bunker oil, as the products are bought in large quantities and stored for processing and resale. The oil price risk arising from the oil price exposur es is mitigated by entering into commodity derivative agreements. The overall exposure limit is set in the risk policy, defining a maximum net open position. On 31 December 2025, the group entered into oil derivative position s shown in the next table
The group’s sensitivity to a +/ - 10% change in the oil price, all else being equal, is estimated to have a symmetrical impact on profit and equity before tax with immaterial difference . An increase of 10% would affect the profit and equity before tax negatively by approx. DKK 0.3bn (DKK 0.4bn) , and a decrease would lead to a positive impact of the same magnitude. The sensitivities are based on the impact of financial instruments that are outstanding at the balance sheet date.
The fair value of commodity hedges, all of which mature within one year, is as follows:
INTEREST RATE RISK
The group has most of its debt denominated in DKK, EUR, and USD, but part of the debt (e.g. issued bonds) is in other currencies such as NOK . The group strives to maintain a combination of fixed and floating interest rates on its net debt, reflecting expectations and risks.
Interest rate risk is managed within a range set for the percentage of gross debt carrying fixed interest, net of hedging. The level as of 31 December 2025 is 57% (53 %) , excluding IFRS 16 leases.
A general increase in interest rates by one percentage point is estimated, all other things being equal, to positively affect profit before tax and equity, excluding tax effect, by approx. DKK 1.0bn (DKK 1.0bn) and by approx. DKK 0.7bn (DKK 0.6bn), respectively.
This analysis assumes that all other variables, in particular foreign currency rates, remain constant.
The hedging of interest rate risks is done by cross -currency swaps and interest rate swaps. The hedging is a mix of fair value hedging, combined fair value hedging, and cash flow hedging.
Combined fair value hedging is applied when cross -currency swaps are entered into to swap fixed -rate debt denominated in currencies other than DKK, EUR, and USD into floating -rate debt in DKK, EUR, or USD. Each hedge relationship is split into a fair value hedge of the benchmark interest rate component and a foreign currency hedge of the implied credit margin. The change in the currency basis spread is treated as a cost of hedging and transferred to the income statement over the term of the hedge relationsh ip.
The carrying amount of bonds is adjusted with the fair value change of the bonds attributable to the benchmark interest rate and is adjusted and recognised in the income statement together with the fair value change of the swap attributable to the change in the interest benchmark rate. Value changes attributable to the credit margin are recognised in other comprehensive income and included in the cash flow hedging reserve.
Ineffectiveness from cash flow hedges due to buy -back of issued bonds is recognised in the income statement with a cost of DKK 13m (cost of DKK 0m).
Note 4.3: Financial instruments and risks – continued
An economic relationship is established through critical terms match. The source of ineffectiveness is the credit risk of the hedging instruments. If the hedged transaction is prepaid, the change in basis spread will be recognised in profit or loss as ineffectiveness. The cost of hedging reserve amounts to DKK 121m (DKK 17m).
Borrowings by interest rate levels inclusive of interest rate swaps:
Note 4.3: Financial instruments and risks – continued Interest rate hedging of borrowings
Note 4.3: Financial instruments and risks – continued
CREDIT RISK
Trade receivables
The group is expose d to financial and commercial counterparties, but has no particular concentration of customers or suppliers. To minimise the credit risk, financial vetting is undertaken for all major customers and financial institutions, adequate security is required for commercial counterparties, and credit limits are set for financial institutions and key commercial counterparties.
The group applies the simplified approach to providing the expected credit losses prescribed by IFRS 9, which permits the use of the lifetime expected loss provision for all trade receivables. To measure the expected credit losses, trade receivables have b een grouped based on shared credit risk characteristics and the days past due. In accordance with IFRS 9, non -due trade receivables have also been considered for impairment
Approx. 43% (57%) of the provision for bad debt is related to trade receivables overdue by more than one year.
Other financial assets at amortised cost
Other financial assets at amortised cost comprise loan s receivable, finance lease receivables , and o ther receivables. These financial assets are considered to have a low credit risk, and thus, the impairment provision calculated based on 12 months’ expected losses is considered immaterial. The financial assets are considered to be low risk when they have a low risk of default, and the issuer has a strong capacity to meet its contractual cash flow obligations in the near term.
LIQUIDITY RISK
The capital allocation in A.P. Moller Holding is an annual process and approved by the Board of Directors. The objective of the process is to assess the overall investment capacity and investment pipeline, as well as key risks over the coming period. In ad dition, the liquidity profile and capital structure are managed by each portfolio company in accordance with financial policies approved by the Board of Directors in each entity. Capital is managed to meet the objective of a solid capital structure over th e business cycle and to maintain an appropriate liquidity profile.
As of 31 December 2025,
Note 4.3: Financial instruments and risks – continued
Liquidity reserve is defined as undrawn committed revolving facilities with more than one year to expiry, securities , term deposits, listed securities, and cash and bank balances, net of cash management overdraft, excluding overdrafts and balances in countries with exchange control or other restrictions
As of 31 December 2025, cash and bank balances include investments in money market funds (MMFs) amounting to DKK 7. 0bn (DKK 0.0bn). Undrawn committed loans, dedicated to financing specific assets , amount to DKK 0.9bn (DK 0.0bn).
Deposits and bank balances are primarily held in relationship banks with a credit rating of at least A -. No individual counterparty exposure is above 10% . Some group entities have ISDA agreements for trading of derivatives, under which the group entities have a right to a net settlement in the event of certain credit events. This results in the credit risk being limited to the net position per counterparty.
For information about cash and bank balances in countries with exchange control or other restrictions, see text to the consolidated cash flow statement.
Based on the liquidity reserve, loans for the financing of specific assets, the maturity of outstanding loans, revenue back -log , and the current investment profile, the group’s financial resources are deemed satisfactory.
The average term to maturity of loan facilities in the group is around four years (around four years).
Maturities of liabilities and commitments:
It is of great importance for the group to maintain a financial reserve to cover the group’s obligations and investment opportunities , and to provide the capital necessary to offset changes in the group’s liquidity due to changes in the cash flow from operating activities.
The flexibility of the financial reserve is subject to ongoing prioritisation and optimisation, among other things, by focusing on the release of capital and following up on the development in working capital , revenue back -log, and capital commitments .
Note 4.3: Financial instruments and risks – continued
ACCOUNTING POLICIES
Financial instruments including shares, bonds, and similar securities are recognised on the trading date at fair value , and subsequently measured at the quoted market price for listed securities and at estimated fair value for non -listed securities using generally acknowledged valuation techniques. Fair value adjustments from equity investments at fair value through other comprehensive income (FVOCI) remain in equity upon disposal. Dividends are recognised in the income statement.
Derivative financial instruments are recognised on the trading date at fair value , and measured at estimated fair value using generally acknowledged valuation tech niques based on relevant observable swap curves and exchange rates.
The effective portion of changes in the value of derivative financial instruments designated to hedge highly probable future transactions is recognised in other comprehensive income until the hedged transactions are realised. At that time, the accumulated gains/losses are transferred to the items under which the hedged transactions are recognised.
The effective portion of changes in the value of derivative financial instruments used to hedge the value of recognised financial assets and liabilities is recognised in the income statement , together with changes in the fair value of the hedged assets or liabilities that can be attributed to the hedging relationship. Currency basis spread s and forward points are considered a cost of hedge and recognised in other comprehensive income and deferred in equity until realisation
The ineffective portion of hedge transactions and changes in the fair value of derivative financial instruments, which do not qualify for hedge accounting, are recognised in the income statement as financial income or expenses for interest and currency -bas ed instruments, and as other income/costs for oil price hedges and forward freight agreements.
Trade receivables are initially measured at the transaction price. The loss allowance is measured by the simplified approach according to IFRS 9, applying a provision matrix to calculate the expected lifetime losses. The provision matrix includes impairmen t for nondue receivables.
Note 4.4: Financial instruments by category
at fair value through profit/loss
Carried at fair value through OCI
¹ Where no fair value is stated, the amount equals carrying amount
2 Designated at initial recognition in accordance with IFRS 9
1 Where no fair value is stated, the amount equals carrying amount
FINANCIAL INSTRUMENTS MEASURED AT FAIR VALUE
Financial instruments measured at fair value can be divided into three levels:
• Level 1 Quoted prices (unadjusted) in active markets for identical assets or liabilities
• Level 2 Inputs other than quoted prices included within level 1 that are observable for the asset or liability, either directly (i.e. as prices) or indirectly (i.e. derived from prices)
• Level 3 Inputs for the asset or liability that are not based on observable market data
The f air value of listed securities is within level 1 of the fair value hierarchy. Non -listed shares and other securities are within level 3 of the fair value hierarchy.
The f air value of derivatives is mainly within level 2 of the fair value hierarchy and is calculated based on observable market data as of the end of the reporting period. A minor amount of crude oil price derivatives is within level 1 of the fair value hierarchy. Investments in money market funds (MMFs) are also within level 2, valued using the daily published net asset value (NAV) with observable underlying prices, but there is no active market quote for the fund units.
The f air value of level 3 assets and liabilities is primarily based on the present value of expected future cash flows , including estimates received from private equity fund managers . A reasonable possible change in the discount rate is not estimated to affect the group’s profit or equity significantly. For non -listed shares, the price of recent investments into the company is applied , as the investments are mainly made in early -stage companies, unless a later fundraising round or impairment is applicable.
Financial assets and liabilities measured at fair value:
Movement within financial assets during the year in level 3:
continued
Movement within financial
FINANCIAL INSTRUMENTS CARRIED AT AMORTISED COST
The f air value of short -term financial assets and other financial liabilities carried at amortised cost is not materially different from the carrying amount. In general, fair value is determined primarily based on the present value of expected future cash flows . However, w here a market price was available, this was deemed to be the fair value.
The f air value of listed issued bonds is within level 1 of the fair value hierarchy. Fair value of the remaining borrowing items is within level 2 of the fair value hierarchy, and is calculated based on discounted future cash flows.
Note 4.4: Financial instruments by category –
continued
DEBT INSTRUMENTS (FVOCI)
The group’s debt instruments at fair value through OCI include investments in quoted debt instruments and are included under Securities in the balance sheet. Interest income, foreign exchange revaluation , and impairment losses or reversals are recognised in the income statement and calculated in the same manner as for financial assets measured at amortised cost. The remaining fair value changes are recognised in OCI. Upon derecognition, the cumulative fair value change recognised in OCI is recycled to profi t or loss.
OTHER EQUITY INVESTMENTS (FVOCI)
The group has investments in equity shares in both listed and non -listed companies. The group holds non -controlling interests (between 0.1% and 15%) in these companies. These investments were irrevocably designated at fair value through OCI as the group considers them to be strategic in nature.
ACCOUNTING POLICIES
Other financial investments
Equity instruments, etc., including shares, bonds, and similar securities, are recognised on the trading date at fair value, and subsequently measured at the quoted market price for listed securities and at estimated fair value for non -listed securities. F air value adjustments from equity investments are classified in the following measurement categories:
• Through other comprehensive income (FVOCI) , or
• Through the income statement (FVPL)
Fair value adjustments from equity investments at fair value through other comprehensive income remain in equity upon disposal.
Dividends are recognised in the income statement.
Note 4.5: Pensions and similar obligations
Amounts in DKKm
Of which:
As an employer, the group participates in pension plans according to normal practice in the countries in which we operate. Generally, the pension plans within the group are defined contribution plans, where contributions are recognised in the income statement on an accrual basis. A number of entities have defined benefit plans, in which retirement benefits are based on length of service and salary level. To a limited extent, these defined benefit plans also include payment s of medical expenses, etc.
Overall, the plans have an average duration of appr ox. 10 years (11 ye ars ), and approx. 54% (5 4%) of the obligation is in respect of pensioner members. In 202 6, the group expects to pay contributions totalling DKK 149m (DKK 168m) to funded defined benefit plans.
Other than the insurance contracts and a small proportion of other holdings, the plan assets held by the group are quoted investments.
Amounts in DKKm 2025 2024
of plan assets
Note 4.5: Pensions and similar obligations –
continued
The liabilities are calculated using assumptions that are the group’s best estimate of future expe ctations bearing in mind the requirements of IAS 19. The group’s plans are funded in accordance with applicable local legislation.
Amounts in DKKm
Th e majority of the group’s defined benefit liabilities are in Switzerland 15% (13%) and the UK 68% (71%). All of the plans in Switzerland and the UK are funded. Although all of the UK plans are now closed to new entrants, active members in the two largest plans continue to accrue new benefits. The smaller UK plans are all closed to new accruals, although a salary link remains in some of the plans.
Note 4.5: Pensions and similar obligations –
continued
As well as being subject to the risks of falling interest rates , which would increase the obligation, poor asset returns , and pensioners living longer than anticipated, the group is also subject to the risk of higher -than -expected inflation. This is because many pension benefits, particularly in the UK plans, increase in line with inflation although some minimum and maximum limits apply.
ACCOUNTING POLICIES
The r ates of life expectancy reflect the most recent mortality investigations, and in line with market practice, an allowance is made for future improvements in life expectancy. The group a ssumes that future improvements will be in line with the latest projections of 1.25% for all UK plans. As of 31 December
Pension obligations are the net liabilities of defined benefit obligations and the dedicated assets adjusted for the effect of minimum funding and asset ceiling requirements. Plans with a funding surplus are presented as net assets on the balance sheet. Th e defined benefit obligations are measured at the present value of expected future payments to be made, in respect of services provided by employees, up to the balance sheet date. Plan assets are measured at fair value. The pension cost charged to the in come statement consists of calculated amounts for vested benefits and interest in addition to settlement gains or losses, etc. Interest on plan assets is calculated with the same rates as used for discounting the obligations. Actuarial gains/losses are rec ognised in other comprehensive income.
Pension plans where the group, as part of collective bargaining agreements, participates together with other enterprises – so called multi -employer plans – are treated as other pension plans in the financial statements. D efined benefit multi -employer plans , where sufficient information to apply defined benefit accounting is not available, are treated as defined contribution plans.
As of 31 December 2025, t he sensitivity of the liabilities and pension cost , to the key assumptions in the UK plans are as follows:
Around 80% of the UK liabilities are now covered by insurance policies. Therefore, movements in the liabilities due to changes in assumptions would equally impact the assets’ value related to the buy -in policies, resulting in a reduced movement in the overall balance sheet position. No contributions to the UK plans are expected or paid for 2025 and no contributions are expected for 2026.
Note 4.6: Non-controlling interests
The group’s subsidiaries with significant non -controlling interests include: Amounts in DKKm
Note 4.7: Share capital
The share capital comprises 2,000 shares of DKK 1m corresponding to a total nominal value of DKK 2,000m All shares are fully issued and paid up and n o shares hold special rights.
There has been no change from last year.
A d ividend has been distributed at DKK 0.5m per share in 2025 (DKK 0.5m).
Summarised financial information (before intercompany eliminations):
The demerger of Svitzer Group A/S from A.P. Møller - Mærsk A/S was concluded at the end of April 2024. Therefore, A.P. Møller - Mærsk A/S’ financial information for 2024 up to the demerger includes the consolidation of Svitzer Group A/S.
ACCOUNTING POLICIES
Equity includes total comprehensive income for the y ear comprising the result for the year and other comprehensive income. Proceeds on the purchase and sale of own shares and dividends from such shares are recognised in equity.
The translation reserve comprises the group’s share of accumulated exchange rate differences arising from translation from the functional currency into the presentation currency. Differences arising from translation to the presentation currency are recognised in other comprehensive income and will not be reclassified to the income statement.
The reserve for other equity investments is comprise d of accumulated changes in the fair value of equity investments (at FVOCI), net of tax.
Reserve for hedges includes the accumulated fair value change of derivatives qualifying for cash flow hedge accounting, less amounts already reclassified to the income statement or transferred as basis adjustments, net of tax , as well as forward points and currency basis spread.
OTHER DISCLOSURES
Note 5.1: Share-based payment
Programmes disclosed below are solely awarded to certain key employees and members of the Executive Board in portfolio companies. There are no share -based payment programmes introduced for neither key management personnel nor employees in A.P. Møller Holding A/S.
A.P. MØLLER - MÆRSK A/S (A.P. MOLLER - MAERSK)
As part of the r emuneration policy, A.P. Moller - Maersk has established long -term incentive programmes. Performance shares, restricted shares, and stock options have been granted to members of the Executive Board and certain key employees at A.P. Moller - Maersk. Some performance conditions apply to the programmes, and the programmes must be settled by existing B -shares of nominal DKK 1,000 in A.P. Møller - Mærsk A/S.
Note 5.1: Share-based payment –
continued
1 The weighted average exercise prices for the 2024 stock option movements reflect the exercise prices after the 2024 Svitzer modification. The opening balance for the 1 January 2024 disclosure has not been restated and is based on exercise prices before the 2024 Svitzer modification
2 The share options granted in 2025 relate to the correction of share options erroneously recorded as granted in 2024
3 The share options forfeited in 2025 relate to the correction of share options erroneously recorded as forfeited in 2024, partly offset by 2025 forfeitures
T he range of exercise prices for the outstanding share options as per 31 December 2025 was DKK 7,271 to DKK 23,994 (DKK 7,271 to DKK 23,994).
OTHER SHARE-BASED PAYMENT PROGRAMMES
The group has introduced a number of other equity -settled and cash -settled share -based payment programmes in its non -listed portfolio companies. The programmes are for key employees as well as members of the Executive Board and Board of Directors in the respective portfolio companies.
Certain programmes include a co -investment programme, however , due to service conditions, they are defined as cash -settled share -based payment programmes. The programmes are based on fair market value. Due to a put option issued for the benefit of the co -investors, the group has an obligation to buy back the shares. The liability is recognised in the balance sheet
ACCOUNTING POLICIES
Equity settled performance shares , restricted shares, and share options granted to certain key employees as part of the po rtfolio companies long -term incentive programmes are recognised as remuneration expenses over the vesting period at estimated fair value at the grant date and result in a corresponding adjustment in equity.
Cash -settled performance awards allocated to employees as part of the portfolio companies long -term incentive programmes are recognised as staff costs over the vesting period and result in a corresponding adjustment in other payables.
At the end of each reporting period, the group revises its estimates of the number of awards that are expected to vest based on the non -market vesting conditions and service conditions. Any impact of the revision is recognised in the income statement with a corresponding adjustment to equity or other payables.
Note 5.2: Commitments
SHORT-TERM AND LOW-VALUE LEASES
As part of the group’s activities, customary agreem ents are entered into regarding charter and operating leases of vessels, containers, and port facilities. Furthermore, the group has entered into low -value lease agreement s for operating leases of property, etc.
The future lease payments for short -term and low -value lease agreements are:
CAPITAL COMMITMENTS
The group has the following capital commitments:
Amounts in DKKm
The capital commitments will be financed by cash flow from operating activities as well as existing and new loan facilities.
Newbuilding programmes as of 31 December 2025
Capital commitments to newbuilding programmes as of 31 December 2025 Amounts in DKKm
As of 31 December 2024, commitments related to newbuilding programmes amounted to DKK 57.0bn.
Note 5.3: Contingent liabilities
CONTINGENT LIABILITIES
Contingent liabilities consist of legal cases, tax issues, custom bonds, volume commitments, and other disputes.
Legal
The group is involved in several legal cases and other disputes. Some of these involve significant amounts and are subject to considerable uncertainty. The group continuously assesses the risks associated with the cases and disputes and their likely outcome. It is the opinion of management that, apart from items recognised in the financial statements, the outcome of these cases and disputes are either not probable or cannot be reliably estimated in terms of amount or timing. The group does not expect these to have a material impact on the consol idated financial statements.
Tax
The group is subject to a tax audit in Germany concerning allocation of taxation rights to shipping income between Denmark and Germany as well as to a tax investigation in India concerning a deemed supply of services between Indian Goods and Services Tax ( GST) registrations of the group in India.
The group is also involved in various other tax disputes, including indirect tax disputes, some of which involve significant amounts. The group continuously assesses the risks associated with tax disputes and their likely outcome and considers the risk related to these disputes remote, and therefore, a material impact on the consolidated financial statements is not expected.
Other
Custom bonds o f DKK 5.2bn (DKK 6 .1bn) have been provided to various port authorities in India.
The group has entered into a number of agreements with terminals and port authorities, etc. comprising volume commitments , including an extra payment , in case minimum volumes are not met.
E xcept for customary agreements within the group’s activities, no material agreements have been entered into that will take effect, change , or expire upon change of control of the company.
Note 5.4: Cash flow specifications
Amounts in DKKm
1 Including intangible assets of DKK 2.8bn (DKK 1.9bn)
Other non -cash items relate primarily to the adjustment of provisions.
Note 5.4: Cash flow specifications - continued
SIGNIFICANT ACCOUNTING JUDGMENTS
Operations in countries with limited access to repatriating surplus cash
The group operates worldwide and , in this respect, has operations in countries where the ability to repatriate surplus cash is complicated and time consuming. In these countries, management makes judgments as to whether these cash positions can be recognised as cash or cash equivalents.
ACCOUNTING POLICIES
Cash flow from operating activities includes all cash transactions other than cash flows arising from invest ing and financing activities such as invest ments and divestments, received dividends, principal payments of loans, instalments on lease liabilities, paid and received financial expenses , and equity transactions. Capitalisation of borrowing costs is considered non -cash items, and the actual payments of these borrowing costs are included in cash flow from financing.
Cash and cash equivalents comprise cash and bank balances net of bank overdrafts where overdraft facilities form an integral part of the group’s cash management. It also includes investments in money market funds (MMFs) that provide same -day liquidity, are readily convertible to known amounts of cash , and carry an insignificant risk of changes in value. MMFs are measured at fair value through profit or loss under IFRS 9 but presented as cash equivalents.
Note 5.5: Related parties
Trade payables include customary business -related accounts regarding shipping activities
Note 5.5: Related parties - continued
Management consists of the Board of Directors and the Executive Board of A.P. M øller Holding A/S, A.P. M øller og Hustru Chastine Mc -Kinney M øllers Fond til almene Formaal , and their close relatives (including undertakings under their control). Dividends paid by listed entities controlled by the group have not been included in the overview.
A.P. Møller og Hustru Chastine Mc -Kinney Møllers Fond til almene Formaal, Denmark is the parent company and the ultimate owner.
A.P. Møller Holding A/S’ related parties comprise its owner A.P. Møller og Hustru Chastine Mc -Kinney Møllers Fond til almene Formaal as well as the Board of Directors and Executive Boards of A.P. Møller Holding A/S and A.P. Møller og Hustru Chastine Mc -Kinney Møllers Fond til almene Formaal. Related parties also comprise subsidiaries, associated companies, and joint ventures. All agreements have been negotiated on market -based terms.
Dividends distributed to A.P. Møller og Hustru Chastine Mc -Kinney Møllers Fond til almene Formaal amounted to DKK 1.0bn (DKK 1.0bn) .
Note 5.6:
Events after the balance sheet date
No events of importance to the Annual Report have occurred during the period from the balance sheet date until the presentation of the financial statements.
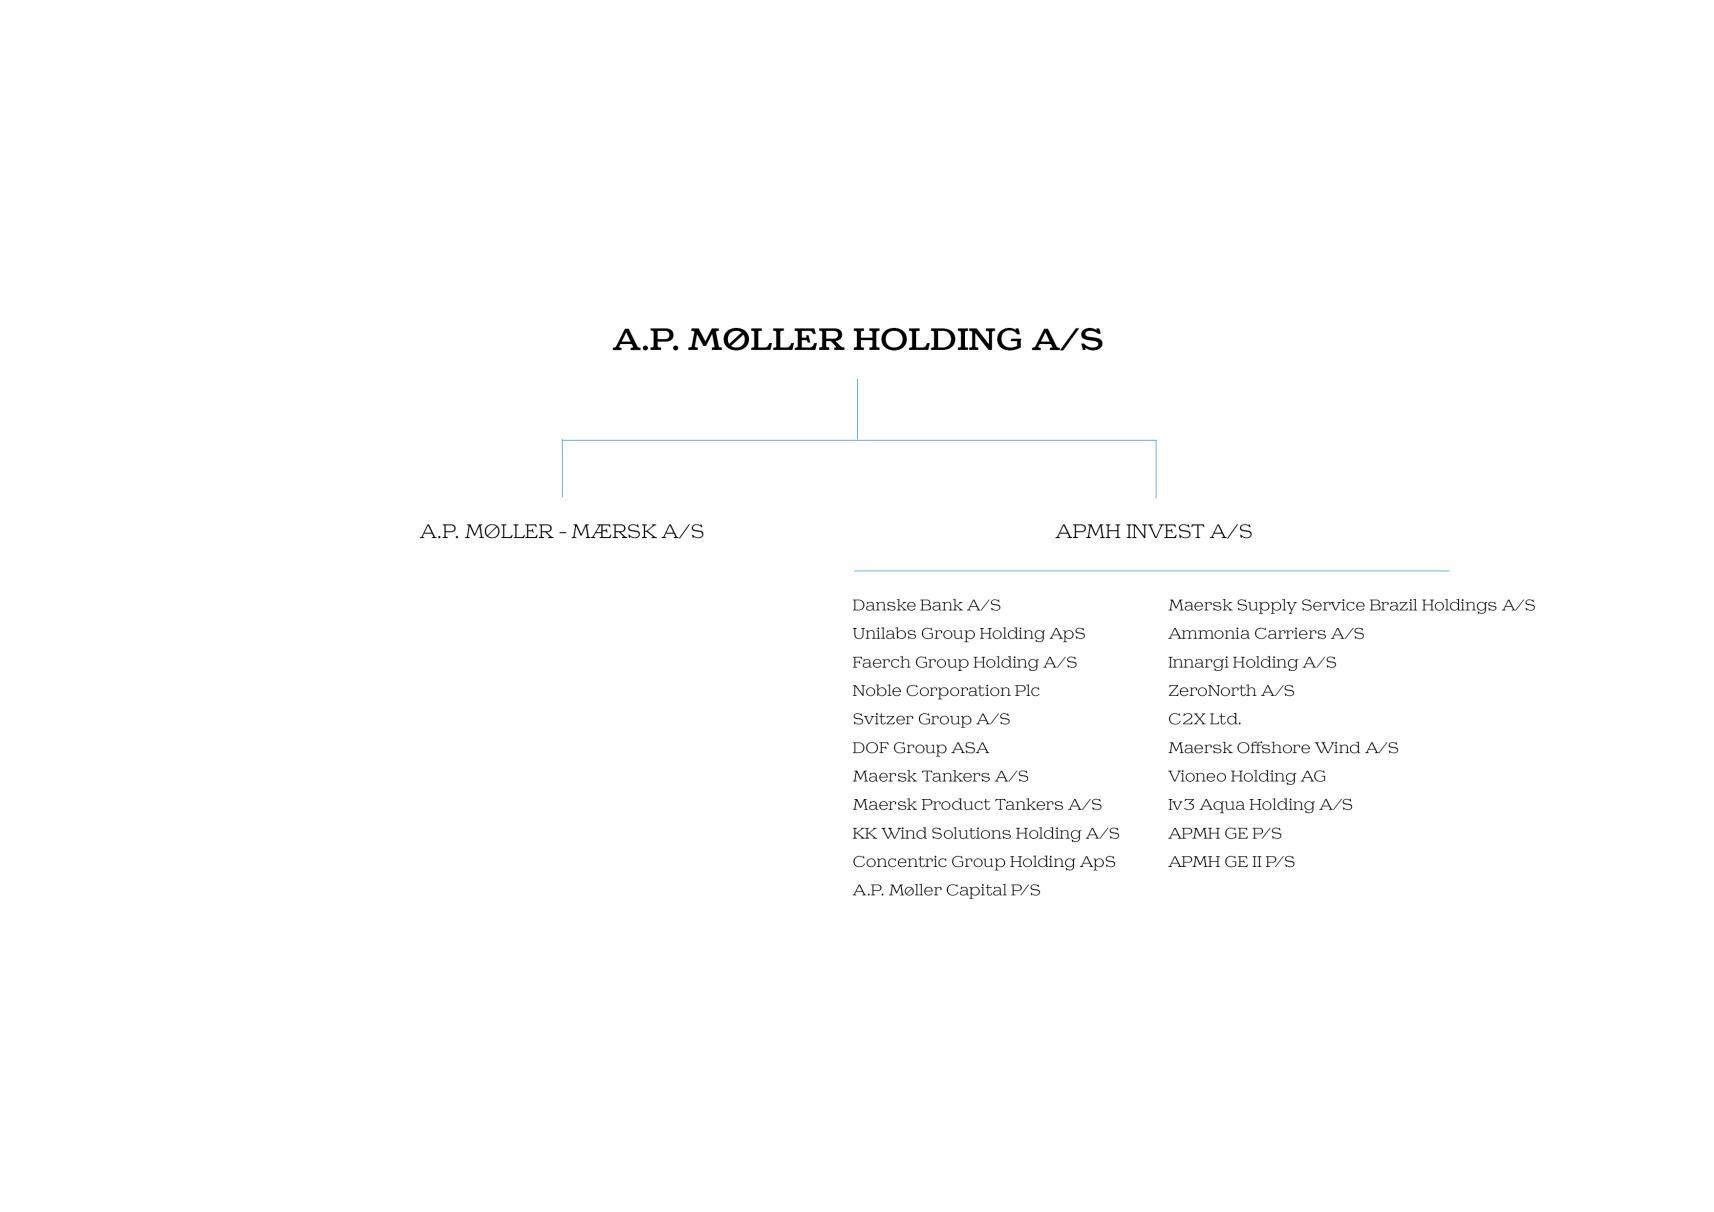
Note 5.7: Company overview – continued
A.P. Moller Holding group comprises more than 1,0 00 companies, of which the holding entity of each portfolio company is listed below.
Subsidiary
BALANCE SHEET AS OF 31 DECEMBER
STATEMENT OF CHANGES IN EQUITY
Amounts in DKKm
1 Other adjustments primarily comprise exchange rate adjustments and share buy -back programmes in subsidiaries , applying the equity method
Note 1: Investments in subsidiaries
1 Disposals include share buy -back programmes in subsidiaries
COMPANY OVERVIEW AS OF 31 DECEMBER 2025
Subsidiary
1 Percentage of total number of issued shares. The ownership share and voting share ha ve been adjusted for A.P. Moller - Maersk’s holding of own shares as of 31 December 202 5. Without the adjustment, the ownership share amounts to 41.5 1% and voting share to 51.45%
Please refer to the company overview for A.P. Moller Holding group of companies as stated in note 5.7, which is an integrated part of this note.
Note 2: Staff costs
A.P . Moller Holding has a cash -settled incentive plan to members of the Executive Board and grants have been awarded on a yearly basis . The incentive plan provides an annual bonus and long -term incentive programmes, which are determined by the development in the value creation of the underlying investments . The main parts of the long -term incentive programmes are capped.
Note 3: Property
Note 6: Deferred tax
Deferred tax is calculated based on the difference between the carrying amount and the tax base of assets and liabilities. Management expects the deferred tax asset to be utilised by the company itself or by the group of jointly taxed companies within a fe w years.
Note 4: Tax on result for the year
Note
5: Distribution of result for the year
Note 7: Share capital
The share capital consists of 2,000 shares with a nominal value of DKK 1m and amounts to DKK 2bn as of 31 December 2025.
Note 8: Contingent liabilities
The company is included in national joint taxation with other Danish companies in the A.P. Moller Holding g roup. The company is jointly and severally liable for the payment of taxes and withholding tax.
Note 9: Events after the balance sheet date
No events of importance to the Annual Report have occurred during the period from the balance sheet date until the presentation of the financial statements.
Note 10: Accounting policies
The financial statements for 20 25 for A.P. Møller Holding A/S have been prepared on a going concern basis and in accordance with the provisions of the Danish Financial Statements Act applying to large enterprises of reporting class C.
With reference to section 86(4) of the Danish Financial Statements Act, no cash flow statement has been prepared for the company.
With reference to section 96(3) of the Danish Financial Statements Act, the company has not presented fees to statutory auditors.
With reference to section 98c(6) of the Danish Financial Statements Act, the company discloses transactions with related parties that were not on an arm’s length basis.
Compared to the accounting policies described for A.P. Møller Holding A/S as stated in note 1.1 to the consolidated financial statements, the company’s accounting policies differ mainly in the following areas:
• Shares in subsidiaries are measured under the equity method. The share of the result after tax in the subsidiaries is recognised as a separate line item in the income statement. Goodwill and other intangible assets with indefinite useful li fe are recognised as part of the investment and amortised over a m aximum of 25 years
• Shares in associates that are retained shareholding s in a former subsidiary will initially be recognised with the same carrying amounts as previously and hence, the carrying amounts will be presented as transfers
• Dividends from subsidiaries are recognised as a receivable at the time of declaration
• Other equity in vestments are measured at fair value and the fair value adjustment is recognised through the income statement. Therefore , other equity investments classified at fair value through other comprehensive income in the consolidated financial statement s are recognised in the income statement in the financial statements for A.P. Møller Holding A/S
The financial statements have been prepared under the same accounting policies as last year .
The financial statements are presented in DKK million.
INCOME STATEMENT
Share of result in subsidiaries
Share of result in subsidiaries is recognised net of tax and corrected for the share of unrealised intra -group gains and losses. The line item also includes amortisation and impairment of goodwill recognised as part of the equity investment.
Other external expenses
Other external expenses comprise expenses for administration, office supplies, etc.
Other
income
Other income comprises service fees.
BALANCE SHEET
Investments in subsidiaries
Investment s in subsidiaries are accounted for under the equity method which is used as a consolidation method . The investments are initially recognised at cost and adjusted thereafter to recognise the company’s share of the post -acquisition profits or losses of the investee, and the company’s share of movements in equity of the investee. Accounting policies of eq uity accounted investees have been changed where necessary to ensure consistency with the policies adopted by the company. Dividends received are r ecognised as a reduction in the carrying amount of the investment.
When the company’s share of losses in an equity accounted investment equals or exceeds its interest in the entity, including any other unsecured long -term receivables, the company does not recognise further losses, unless it has incurred obligations or made payments on behalf of the other entity.
Unrealised gains on transactions between the company and its subsidiaries are eliminated in full.
Business combinations under common control are accounted for at carrying values using predecessor accounting , i.e. pooling of interests when the entity acquired has been under control of another member of the same group company before the acquisition. A difference between the carrying value and the consideration paid are recognised directly in equity.
REPORTS
MANAGEMENT’S STATEMENT
We recommend that the Annual Report be adopted at the Annual General Meeting.
Copenhagen, 24 March 202 6
Executive Board
Robert
Maersk Uggla CEO
Jan Thorsgaard Nielsen
CIO
Martin Nørkjær Larsen
CFO
The Board of Directors and the Executive Board have today considered and adopted the Annual Report of A.P. Møller Holding A/S for the financial year 1 January – 31 December 20 25
The consolidated financial statements have been prepared in accordance with IFRS Accounting Standards as adopted by the EU and further requirements in the Danish Financial Statements Act, and the parent company financial statements have been prepared in accordance with the Danish Financial Statements Act. The m anagement review has been prepared in accordance with the Danish Financial Statements Act.
In our opinion, the consolidated financial statements and the parent company financial statements give a true and fair view of the financial position at 31 December 20 25 of the group and the parent company and of the results of the group and parent company operations and consolidated cash flows for the financial year 1 January – 31 December 20 25
In our opinion, the m anagement review includes a true and fair account of the development in the operations and financial circumstances of the group and the parent company, of the results for the year , and of the financial position of the group and the parent company, as well as a description of the most significant risks and elements of uncertainty facing the group and the parent company.
Board of Directors
Ane Mærsk Mc -Kinney Uggla
Chair
Claus V. Hemmingsen
Jan Leschly
Lars -Erik Brenøe
INDEPENDENT AUDITOR’S REPORT
To the shareholder of A.P. Møller Holding A/S
BASIS FOR OPINION
We conducted our audit in accordance with International Standards on Auditing (ISAs) and the additional requirements applicable in Denmark. Our responsibilities under those standards and requirements are further described in the Auditor’s Responsibilities for the Audit of the Financial Statements section of our report. We are independent of the group in accordance with the International Ethics Standards Board for Accountants’ International Code of Ethics for Professional Accountants (IESBA Code) and the add itional ethical requirements applicable in Denmark, and we have fulfilled our other ethical responsibilities in accordance with these requirements and the IESBA Code . We believe that the audit evidence we have obtained is sufficient and appropriate to provide a basis for our opinion.
STATEMENT ON MANAGEMENT REVIEW
Management is responsible for management review.
Our opinion on the financial statements does not cover management review, and we do not express any form of assurance conclusion thereon.
OPINION
In our opinion, the consolidated financial statements give a true and fair view of the group’s financial position as of 31 December 20 25 and of the results of the group’s operations and cash flows for the financial year 1 January - 31 December 20 25 in accordance with I FRS Accounting Standards as adopted by the EU and further requirements in the Danish Financial Statements Act.
Moreover, in our opinion, the parent company financial statements give a true and fair view of the parent company’s financial position as of 31 December 20 25 and of the results of the parent company’s operations for the financial year 1 January - 31 December 20 25 in accordance with the Danish Financial Statements Act.
We have audited the consolidated financial statements and the parent company financial statements of A.P. Møller Holding A/S for the financial year 1 January - 31 December 20 25 , which comprise income statement, balance sheet, statement of changes in equity , and notes, including material accounting policy information , for both the group and the parent company, as well as statement of comprehensive income and cash flow statement for the group (financial statements).
In connection with our audit of the financial statements, our responsibility is to read management review and, in doing so, consider whether management review is materially inconsistent with the financial statements or our knowledge obtained during the audit, or otherwise appears to be materially misstated.
Moreover, it is our responsibility to consider whether management review provides the information required under the Danish Financial Statements Act.
Based on the work we have performed, in our view, management review is in accordance with the consolidated financial statements and the parent company financial statements and has been prepared in accordance with the requirements of the Danish Financial Statements Act. We did not identify any material misstatement in management review.
MANAGEMENT’S RESPONSIBILITIES FOR THE FINANCIAL STATEMENTS
Management is responsible for the preparation of the c onsolidated financial statements that give a true and fair view in accordance with I FRS Accounting Standards as adopted by the EU and further requirements in the Danish Financial Statements Act and for the preparation of the parent company financial statements that give a true and fair view in accordance with the Danish Fina ncial Statements Act, and for such internal control as management determines is necessary to enable the preparation of the financia l statements that are free from material misstatement, whether due to fraud or error.
In preparing the financial statements, management is responsible for assessing the group’s and the parent company’s ability to continue as a going concern, disclosing, as applicable, matters related to going concern and using the going concern basis of acc ounting in preparing the financial statements unless management either intends to liquidate the group or the parent company or to cease operations, or has no realistic alternative but to do so.
AUDITOR’S RESPONSIBILITIES FOR THE AUDIT OF THE FINANCIAL STATEMENTS
Our objectives are to obtain reasonable assurance about whether the financial statements as a whole are free from material misstatement, whether due to fraud or error, and to issue an auditor’s report that includes our opinion. Reasonable assurance is a hi gh level of assurance, but is not a guarantee that an audit conducted in accordance with ISAs and the additional requirements applicable in Denmark will always detect a material misstatement when it exists. Misstatements can arise from fraud or error and a re considered material if, individually or in the aggregate, they could reasonably be expected to influence the economic decisions of users taken on the basis of these financial statements.
As part of an audit conducted in accordance with ISAs and the additional requirements applicable in Denmark, we exercise professional judgment and maintain professional scepticism throughout the audit. We also:
• Identify and assess the risks of material misstatement of the financial statements, whether due to fraud or error, design and perform audit procedures responsive to those risks, and obtain audit evidence that is sufficient and appropriate to provide a basis for our opinion. The risk of not detecting a material misstatement resulting from fraud is higher than for one resulting from error as fraud may involve collusion, forgery, intentional om issions, misrepresentations, or the override of internal control.
• Obtain an understanding of internal control relevant to the audit in order to design audit procedures that are appropriate in the circumstances, but not for the purpose of expressing an opinion on the effectiveness of the group’s and the parent company’s i nternal control.
• Evaluate the appropriateness of accounting policies used and the reasonableness of accounting estimates and related disclosures made by management.
• Conclude on the appropriateness of management’s use of the going concern basis of accounting in preparing the financial statements and, based on the audit evidence obtained, whether a material uncertainty exists related to events or conditions that may cas t significant doubt on the group’s and the parent company’s ability to continue as a going concern. If we conclude that a material uncertainty exists, we are required to draw attention in our auditor’s report to the related disclosures in the financial sta tements or, if such disclosures are inadequate, to modify our opinion. Our conclusions are based on the audit evidence obtained up to the date of our auditor’s report. However, future events or conditions may cause the group and the parent company to cease to continue as a going concern.
• Evaluate the overall presentation, structure , and contents of the financial statements, including the disclosures, and whether the financial statements represent the underlying transactions and events in a manner that gives a true and fair view.
• Obtain sufficient appropriate audit evidence regarding the financial information of the entities or business activities within the group to express an opinion on the consolidated financial statements and the parent company financial statements . We are responsible for the direction, supervision , and performance of the group audit. We remain solely responsible for our audit opinion.
We communicate with those charged with governance regarding, among other matters, the planned scope and timing of the audit and significant audit findings, including any significant deficiencies in internal control that we identify during our audit.
Copenhagen, 2 4 March 202 6
PricewaterhouseCoopers
Statsautoriseret Revisionspartnerselskab CVR No 33 77 12 31
Lars Baungaard
State Authorised Public Accountant mne23331
T ue Stensgård Sørensen
State Authorised Public Accountant mne32200
Photos P. 3 Steen Brogaard
P. 12 Svitzer Pp. 22 -23 Steen Brogaard