
2026 Healthcare Real Estate Outlook
What ’ s inside :
Decision-ready market signals
Execution frameworks: prototypes + repeatable design to compress timelines
Partnership advantages that can open facilities 20–30% faster


2026 Healthcare Real Estate Outlook: What to Watch in Capital
, Costs, and Care Delivery
Patients are moving faster than projects Clinics near where people live and work are full, yet too many ambulatory plans are still in pre-con 2026 is the year to close that gap With fundamentals strong and borrowing conditions easing at the margins, systems can finally trade “wait and see ” for “do and measure ” : bank the right sites, streamline approvals, standardize what repeats, and use developer capital to preserve debt capacity for clinical priorities Execution not enthusiasm separates openings from intentions. This outlook details where conditions are improving, what risks still deserve respect, and how leaders can translate market tailwinds into operational wins
Outpatient Keeps Pulling the Train
Outpatient care remains the growth engine Across the top 100 U S markets, medical office building (MOB) occupancy has held near record territory thanks to steady absorption and limited new supply Smaller, fast-growing metros are even tighter, a reminder that access, convenience, and population inflows are the real capacity constraints
Implication for 2026: Health systems will keep prioritizing ambulatory surgery, imaging, and clinic footprints closer to where people live and work often beyond the core campus because that’ s where access and volume growth converge
Rates & Credit: Supportive But Not “Cheap”
Markets point to a gentler rate path than in 2024–2025, but not a return to the near zero era Translation: debt becomes incrementally friendlier, but discipline still rules Expect lenders to stay selective and to prize stable rent rolls, strong credits, and clean structures Work your growth assuming “good, not free” capital
Capital Markets
Through mid-2025 the investment market was defined by a wide bid ask spread despite healthy leasing Trading volumes troughed, driven more by capital frictions than tenant demand As rate visibility improves, expect the cleanest, best located, system anchored assets to clear first
2026 outlook: A modest thaw from 2025’ s low, uneven by asset quality and tenancy On/adjacent campus assets and long-term, credit anchored deals should lead
Capital Markets & Investment Trends
Sales momentum returned in 2024 and stabilized in 2025 After a sharp rebound in 2024, activity in 2025 reflected improving liquidity but selective underwriting Expect gradual volume growth into 2026 as rates ease at the margins and price discovery narrows bid-ask
Pricing turned the corner By 2025, all property pricing indices showed modest YoY gains versus 2023 declines, with MOB pricing trending up on a $/SF basis as fundamentals and rent growth improved We expect continued stabilization in 2026 absent a macro shock
Cap rates stabilized In early 2025, MOB cap rates averaged ~6 9% (first quarterly decrease since mid-2022) Traditional office remained higher and more volatile Our base case for 2026 is flat to slightly compressing MOB cap rates if financing costs drift lower and NOI grows Why this matters to health systems: Stable pricing + easing rates improve refi/recap options and developer capital terms, particularly for anchored, well leased assets with clear care delivery value

Construction & Delivery: A Pulse After the Trough
After slowing for two years, the pipeline is showing life MOB starts rebounded off Q4 2024 lows and accelerated into mid 2025 If that cadence holds, projects that solved entitlement, utilities, and early procurement in 2025 will open while others are still in pre-con
Costs remain the separator. 2024 completions carried materially higher build costs, and new deliveries command higher face rents than the in-place market That premium won ’t vanish in 2026 so owners must defend it with throughput, staffing efficiency, and lifecycle savings; replacement cost alone won ’t convince finance committees
Balance Sheet Protection + Speed-to-Market
With costs elevated and debt capacity precious, systems are leaning into developer-led delivery, ground leases, monetizations, and selective JV equity to sequence rollouts without overconcentrating on-balance-sheet debt. Growth is also pushing farther off campus, which elevates entitlement, neighborhood context (access, parking, wayfinding), and municipal coordination as schedule-critical levers Pair that with standardized clinic prototypes, early procurement and you have a replicable 2026 playbook
Why prototypes now: Repeating 70–80% of what is in every clinic unlocks speed, reliability, and better staff/patient flow Standardization enables parallel entitlement, bulk procurement, and predictable commissioning across multiple sites.
Executive takeaway: 2026 should reward credit quality, location, and operational clarity. If you ’ re sequencing monetization, align with prototype-driven rollouts to capture stronger pricing.

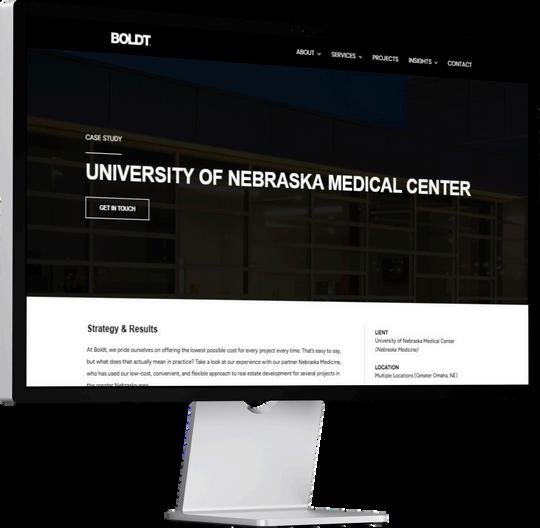

Working with Boldt, the University of Nebraska Medical Center (UNMC) advanced a standardized ambulatory clinic prototype to scale access across its network The result? A multi-site rollout path with fewer surprises, faster openings, and lifecycle savings that help justify new build rents even as replacement costs stay elevated
Case In Point
Risk Watchlis
Rate-path vola be uneven, kee
Specialty trad tightness pers slip openings b
Neighborhood parking, and s items if not pre
How Developers Help Health Systems
Financial Expertise & Strategic Planning: Optimize capital allocation across a multi-site roadmap; align scope, lease terms, and credit with enterprise goals
Risk Mitigation & Cost Control: Proven GMP strategies, contingency governance, and packagelevel procurement to curb overruns
Access to Diverse Funding Sources: Lender/investor relationships enable tailored structures (ground lease, leaseback, tax-exempt pathways where eligible, JV equity)
Efficient Project Execution: Integrated development and construction oversight compresses schedule, bringing revenue online sooner
Bottom line: Developer partnerships unlock capital, transfer delivery risk, and preserve borrowing capacity freeing leadership to invest in care delivery
What We Expect To Be True By Q4 2026
Outpatient
mid-90s, b

Cap rates s p y y p g g visibility improves
Deal volume improves unevenly, with system-anchored, best-located assets clearing first as bid-ask narrows
Delivery advantages decide winners: entitlement readiness, prototype discipline, and early procurement shave months and de-risk outcomes
The Boldt Difference
This year, we ’ ve continued to redefine what healthcare real estate development can look like by putting transparency and partnership at the center of every project
At Boldt, transparency isn’t optional it’ s foundational Our open-book approach ensures you know exactly where costs and savings come from, eliminating guesswork and building trust
We partner with healthcare clients to deliver smart, cost-effective solutions that align with your goals and resources With over 90% client retention, we ’ re proud to be a trusted ally in shaping the future of care
6.5B+


Chris White | Business Development Manager chris white@boldt com