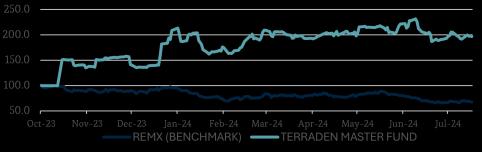
During the quarter, our portfolio generated a positive alpha of 16.5%. However, this relative gain came against the background of a consistently weak market and a benchmark (REMX) that lost 17.2%.
This was a quarter of two halves. Despite broadly telegraphed headwinds for energy transition, the selection and weighting of our positions provided valuable protection against the continued pressure on the sector (see Portfolio Results, on page 27, for the illustration of the portfolio segmentation). Initially, sentiment may have been helped by strong speculative momentum in liquid commodities (notably copper and gold). But this run popped around May 21, and we entered a “second half” of the quarter, marked by aggressive loss-harvesting ahead of the end of the fiscal year in Australia, where 12-month “losers” were liquidated across the board. All in all, we managed to outperform the market by underweighting lithium, staying away from nickel and cobalt, and reducing our positions in graphite. Instead, we have established positions in critical minerals that are often peripheral to energy transition and are not currently suffering from oversupply – e.g. high purity alumina (semiconductors), germanium (low orbit satellite swarms), fluorspar (uranium conversion) and manganese, which benefited from significant supply dislocations since January. We also registered strong gains in rare earths and niobium. The core energy transition metals will eventually come back, not least because of the expected rise in storage demand (e.g., for data centers required by the AI revolution). Our East/West bifurcation thesis remains as relevant as ever.
(16%)
(7%)
(3%)
(-2%)
(10%)
(2%) REMX Benchmark (-18%)
Oil (1%)
(1%) Iron Ore 62% (5%)
S&P500 (4%)
MARKET OVERVIEW
GLOBAL MARKETS
Source: Bloomberg Finance L.P.
During the spring quarter, doubts deepened whether “the West”, and in particular Europe, has the wherewithal to resist China’s dominance in energy transition metals. The entire electrification value chain has been at the forefront of Xi Jinping’s focus on “productive forces”, whereby Chinese consumers will remain disenfranchised by intensified financial repression while their savings will be redirected enmassetowards bulging manufacturing overcapacity Given poor domestic demand conditions, much of this productive surplus is being unleashed on China’s trade partners unable to compete against the state-directed support system established by Beijing. Upstream, this means that
cobalt, nickel and lithium remain oversupplied for the next 18 months, while the situation in graphite remains uncertain, due to some substitution from synthetic graphite.
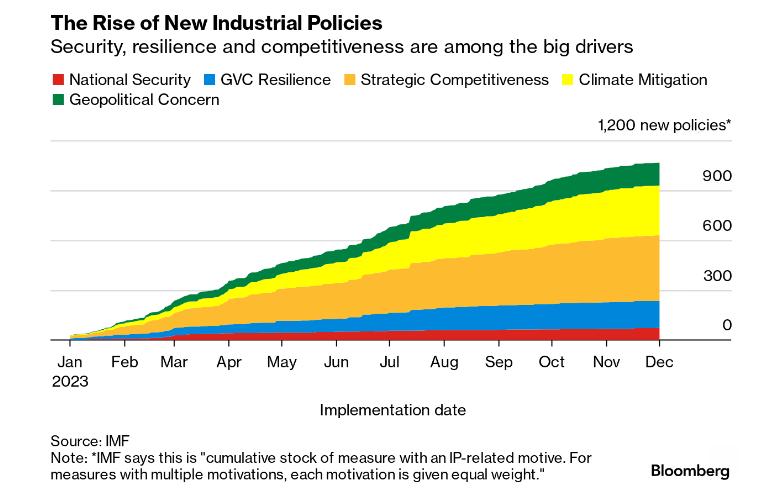
The West will have to figure something out. For now, the “something” is trade protectionism. All the main drivers of economic activity: data centers, decarbonization, deglobalization and remilitarization are promising to be extremely critical-mineral-intensive. Despite the well-publicized problems in the EV sector, it is very unlikely that the West will simply capitulate to China’s predatory policies, given how critical these strategic mineral-intensive sectors are to economic security.
Transportation is one sector that illustrates how difficult it is to address these dilemmas. Yet despite the negative press, EV sales continue to grow - thanks to falling battery prices, advancements in nextgeneration battery technology (see p.15), and improving economics compared to ICE vehicles. Global EV sales increased 23% YOY during the first five months of the year. Eight of the ten largest EV markets saw ongoing growth in May, led by China and the US, which together account for over 75% of global EV sales. Sales in Germany slipped after EV incentives were withdrawn, and the UK became Europe’s largest EV market. However, outside Europe, Brazil, India, and Thailand are showing substantial increases in EV adoption.
The International Energy Agency (IEA) estimates that global electric car sales could reach around 17m units in 2024. By the end of this year, the projected EV market share could be up to 45% in China, 25% in Europe, and over 11% in the United States. Global passenger EV sales are still expected to exceed 30 million vehicles in 2027 and grow to over 73 million per year by 2040 – exactly as previously anticipated. But volume is not margin. Rapid EV depreciation, caused by uncertainty surrounding remaining battery life, undermines the secondary market, potentially leading to further price reductions and threatening profitability.
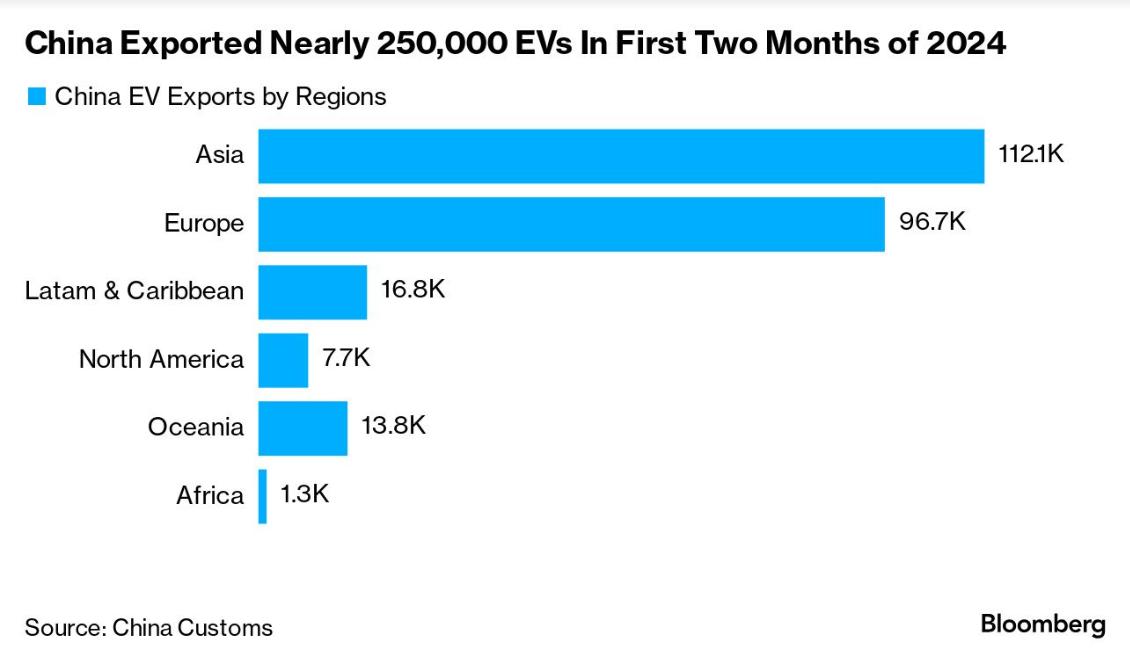
Still, what started out as global concern over climate change, has now disintegrated into a Darwinian exercise in no-holds-barred trade weaponization. China’s global exports of EVs, batteries and solar equipment amounted to USD $143 billion last year, or 4.2% of total exports. That had risen quickly from USD $37 billion in 2020, or 1.4% of exports. But while EV prices have more than halved in China over the eight years to 2023, average European prices have actually increasedby EUR €18,000.
The problem is that the response to Chinese overcapacity means more overcapacity ex-China. Lithium-ion battery demand for EVs and stationary storage came in at around 950 GWh last year, but global battery manufacturing capacity was 2,600 GWh, or closer to 1,820 GWh at a more typical
capacity utilization rate. Some 7.9 TWh of annual battery manufacturing capacity has been announced for the end of 2025, compared to demand projections of 1.6 TWh. With such gaps, it is difficult to properly project the future minerals demand, but from the portfolio management perspective, this means a stubborn focus on project quality and, preferably, low beta to the commodity prices (which, in mining, often translates into longer duration).
Facing heavily subsidized competition requires gigantic government spending at a time when public coffers in the West are already saddled with burdens from the fiscally irresponsible past. Literally trillions will be needed each year for the green transition, defense spending and the restructuring of global value chains all of which are inflationary. Just for defense spending, the G7 may need to boost outlays to 4% of GDP, which translates into an additional USD $10 trillion from the public purse. We have recently run a webinar to sensitize the market to the immense mineral demand that this sector represents. The link to the webinar is here.
With such a massive pull of funds needed for reindustrialization, the question arises whether foreign demand for Western government paper will be sufficient to cap the long-term interest rates. Or will
the cost of capital expenditure outweigh the investment opportunity, some of which (e.g., defense) is not instantly productive? Despite nearly four years of economic expansion in the US, we are already noticing a drop in “dollar recycling” by Middle Eastern oil producers. This contributes to persistently high long-term rates and puts a floor under the US dollar, tempering commodities’ run. It is quite remarkable that gold could perform so strongly in the presence of a strong greenback. We are probably witnessing the emergence of a new global monetary paradigm, with “healthier” interest rates than those observed in the second decade of this century (the “QE era”). Of course, they will be “healthy” for anyone but the buy-and-hold bond investors.
Paradoxically, softer price data observed in the US towards the end of the quarter could yet prove supportive for the dollar, given that the decline in interest rate swaps (one year/zero coupon) failed to keep pace with the drop in inflation expectations. It means that real rates in the US will remain high just as the ECB cut rates without much conviction that inflation in Europe had been vanquished, particularly in the service sector
US
Mixed picture here. Overall, the EV share of US auto sales was 6.9% in the first quarter of 2024, flat from Q1 2023 but an increase from 4.5% in Q1 2022. Full Q2 numbers will be marred by car dealers’ software outages. Tesla and GM saw a slowdown, owing to their product cycles. There are some bright spots, however. For example, Ford's EV sales surged significantly, up 129% in April, YOY and a 97% increase YTD
However, upstream from the showrooms, the US mining permitting labyrinth is exhibiting all signs of rusty dysfunction, with Minnesota and Nevada seemingly oblivious to the imperatives of nationwide economic security. We are limiting our exposure to US mining to what’s already permitted.
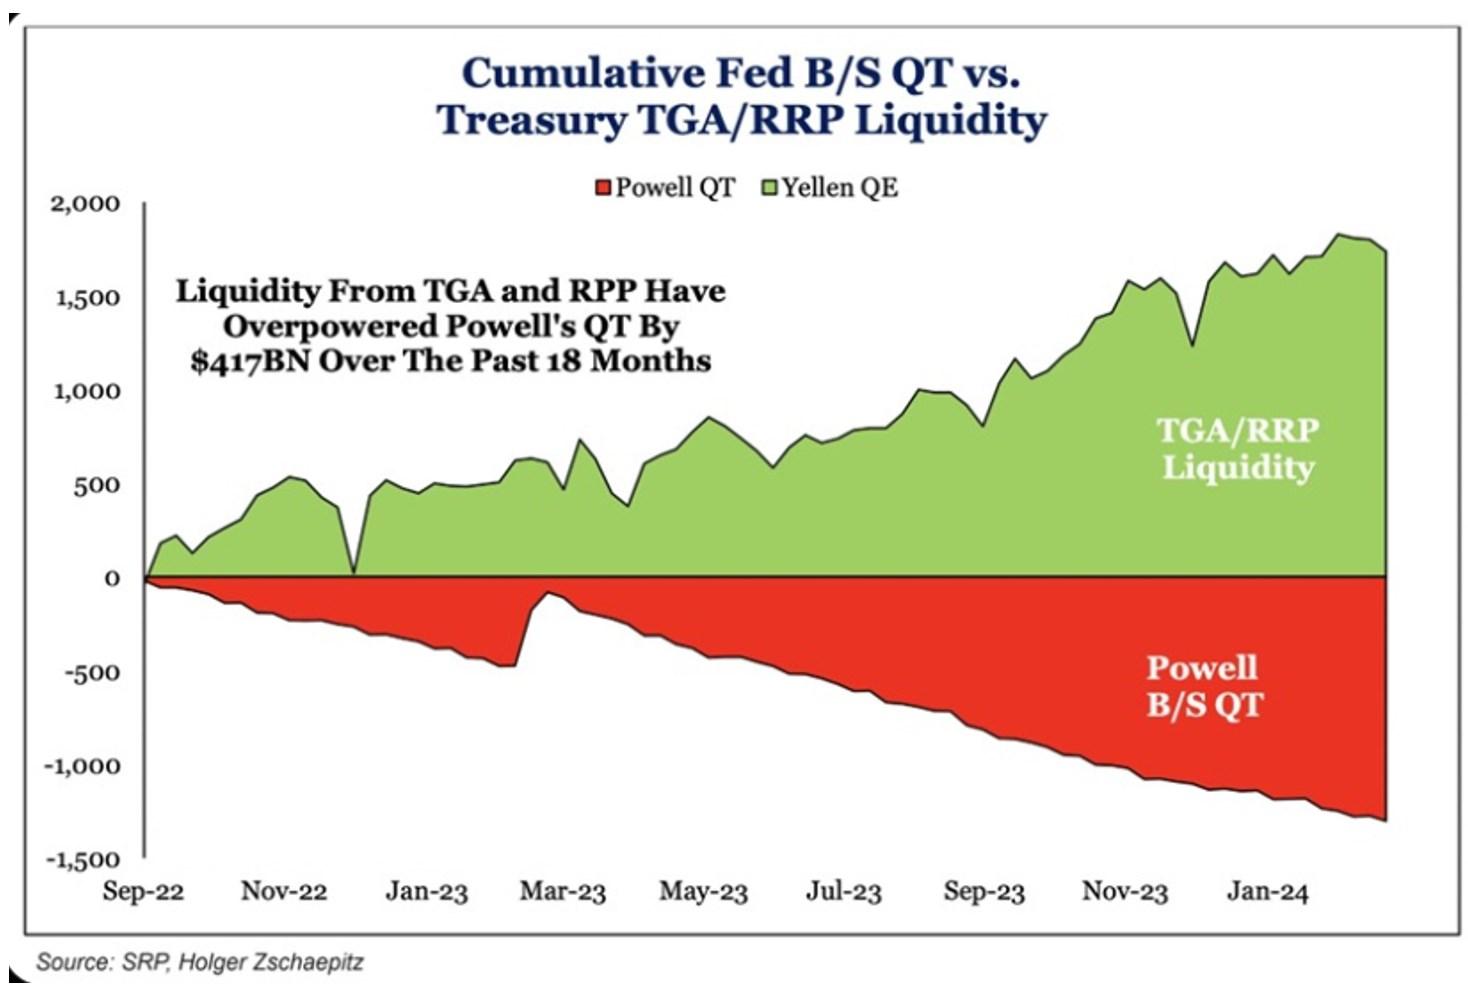
This execution gap illustrates a worrisome disconnect between the actual economic activity and the well-lubricated conditions in the financial markets, Fed or not Fed. The Treasury Department’s liquidity injections, engineered via reverse repos and the general account, have more than offset the Fed’s USD $95 billion per month QT, which effectively functions as a backdoor push against inflation.
During the quarter, these buoyant liquidity conditions propelled the generic equity indices to a series of all-time highs. Yet both the direction and the momentum are standing on weak foundations. The concentration is such that the S&P500 continues to advance even as most of its member companies are losing ground. On this, it is worth noting that our portfolio actually outperformed against the S&P500 in April and in May.
Fed officials have been signaling they would soon like to slow the QT, decelerating the Treasury runoff from USD $60 billion to USD $25 billion, with the end result being a balance sheet of pre-Covid proportions. But there are fears that if the government floods the market with Treasury bills, it could jeopardize QT. During the so-called repo crisis of September 2019, the Fed had to step in when a dearth of buyers briefly sent overnight lending rates above 10%.
Is this a credible risk? The attractive US yields are being gobbled up by Japanese institutions, while the GCC countries and China are largely absent. At USD $1.167 trillion, Japan is now the largest non-US holder of Treasuries. Belgium (a putative conduit for Chinese transactions) has been a net seller.
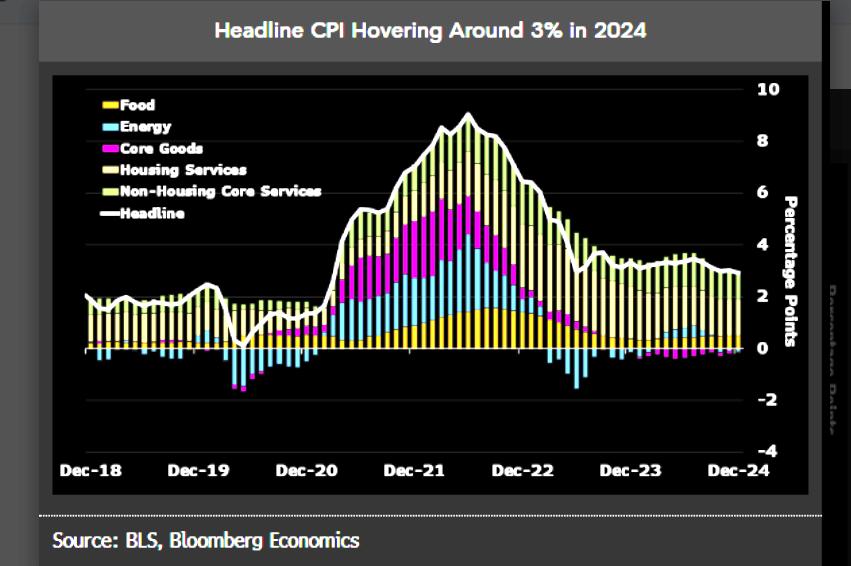
While the Bank of Canada, European Central Bank, Sweden’s central bank, and Swiss National Bank (twice) all lowered their key interest rates, the Fed remained on the sidelines. But for how much longer with it remain an outlier? Unlike in 2021-22, the remaining inflation is driven by nontradables, with the politically sensitive “rent” category standing out.
Fears abound that a change of guard in the White House could be potentially inflationary – with budget deficits deepened by further tax cuts, a debased currency to massage the current account, higher tariffs on imports, curbs on immigration and scaled back subsidies for sustainable energy. Much of this could reverse global capital flows and some flattening of the inverted 2/10 curve following Biden’s catastrophic debate performance could point in this direction. During the strong dollar period since 2021, the US received inflows amounting to some 1.5% of GDP. A reverse would only help the PRC.
EUROPE
The continent’s self-style leader, Emmanuel Macron, believes that the EU must become an economic and military power to withstand the might of the US and China or face long-term decline. He
advocates boosting military capabilities, a carbon border tax on imports and EU-wide support for batteries for electric vehicles and other strategic industries.
Unfortunately, this ideational activism has not shielded Macron from poor showing in the recent elections. The weakness of the governments in Paris and Berlin comes at a time when the differential market performance is tilting in America’s favor. Losses of green parties in the elections to the European Parliament threaten to shake up the bloc’s climate ambitions and policy priorities. Rightwing voters have correctlyidentified the EU’s regulatory overreach as a competitive own goal against jurisdictions in Asia that do not feel compelled to follow this lead (not only China, but also India and Indonesia). In reaction to the European elections, Mario Draghi argued that “China’s trade abuses are at the heart of the biggest social and political problems that have plagued Europe and the US over the past 20 years. The lack of international rules and dispute settlements created unfair competition that led voters to turn against democratic values”. Il Supermario ha parlato.
The continent is now facing painful choices between more borrowing, budget cuts, and tax increases. Worryingly, the EU’s share of global exports is dropping, falling below 14%, from a peak of 16.3% in 2016. But Europe’s trade-to-GDP ratio in 2022 was 106%, compared to 27% in the US, so any decoupling from China will be rather complicated. Whoever prevails in the US elections, Europe’s centrist politicians fear that antagonizing Beijing over trade will only drive Xi Jinping further into Putin’s arms, improving Russia’s odds in its war in Ukraine. As much as 3% of German GDP and 2% of France’s are China-dependent. According to Saab’s CEO, Western defense firms remain heavily dependent on China, for metals and for alloys. Even for gunpowder.
EVs and critical minerals are at the forefront of these dilemmas and it’s a rather mixed picture. Volkswagen's orders for electric vehicles more than doubled in Europe in the first quarter of 2024 compared to a year ago. Meanwhile, imported Chinese EVs have been clogging car terminals at European ports. With a bit more strategic finesse, European carmakers could turn the tables on the Chinese carmakers and promote inward FDI at the cost of technology transfers.
The jury’s out on whether this will happen. Chery Auto, China's largest automaker by export volume, announced in April that it has signed a joint venture with Spain's EV Motors to open its first European manufacturing site in Catalonia. BYD announced in late 2023 that it will build its first European EV production base in Hungary (set to start operating in three years). Leapmotor partnered with Stellantis last year, and it is reported it will start producing small EVs in Poland.
Where are the critical materials coming from to feed all this production? From the Chinese value chain? Even if that’s true, our only European lithium investment – Savannah in Portugal – has been notching the most sustained gains, quarter after quarter. We have also kept our exposure to graphite in Sweden (Talga) and are looking at a (producing) tungsten opportunity in Portugal.
The continent is finally launching some more imaginative solutions. Battery passports will be mandatory for EVs sold in the European Union from February 2027. These passports, using blockchain technology to map supply chains, will show the composition of batteries, including the origin of key materials, their carbon footprint, and recycled content. The first one has already been developed by Volvo and UK startup Circulor. The passport will be first applied to Volvo’s new EX90 SUV which has just gone into production.
CHINA
China is the opposite of the US – robust production growth up and down the value chain, on shaky financial grounds. In April, sales of EVs in China exceeded 50% of all car sales for the first time. The National Development and Reform Commission (NDRC) expected to see more than 110 new energy vehicle models among a total of 150 new cars launched this year, further intensifying competition. The country has 127 EV brands and 150 battery manufacturing factories in production /or construction. BYD remains the most prominent brand and sold 1m models in Q2. By 2026, the company’s annual production capacity in China will reach 6.6 million EVs up from 2.9 million at the end of 2023.
Pure Genius? Chinese electric vehicle industry has been accused by the Center for Strategic and International Studies, of receiving at least USD $231 billion in government subsidies and aid since 2009. A separate investigation by Nikkei Asia’s has recently revealed the scale of the subsidiesincluding deferred payments systems, direct transfer of funds, tax breaks, or public provision of infrastructure and services below market prices. Four of the top 10 recipients were EV- or batteryproducers. CATL leads other technology companies in terms of state support (worth USD $30 billion last year). Under Chinese accounting standards, such annual subsidies are disclosed as “nonrecurring items” that count toward a given year's net profit. For CATL, the 2023 support amounted to 13% of its net profit, doubling the cost advantage that China has over Western manufacturers (EV production is now 25-30% cheaper than the Western rivals’). As a result, the overcapacity in EV batteries is 4x the size of the domestic market and will rise to more than six times in 2025. By comparison, in the solar
industry, the 1,000GW of capacity compares with the local demand of 320GW annually, causing a 50% drop in prices. The upstream (mining) industry goes unmentioned, but it benefits from state support, too, as exemplified by China’s fast developments in Zimbabwean lithium (see p.17).
Produce, and they will come. Or will they? A typical qualm about the CCP’s approach to China’s woes is that the leadership justain’tdoin’nuffto incentivize consumption to meet all this supply. The headline number (USD $20 trillion in savings) is actually quite misleading because, after 20 years of uneven growth, the top 2% of the population controls 80% of the wealth, which leaves 98% of Chinese people with an average bank account of USD $3,000 per person and a balance sheet that is potentially under water after three years of deflation in real estate values. As is usually the case in balance sheet recessions, any liquidity injection will be used to repay debt or to save, not to boost consumption or investment. Credit growth has been lackluster, and the M1 money supply contracted in May at the fastest rate, according to data from 1996. That could explain why the support for the ailing real estate market has been so tepid. A CNY ¥300 billion (USD $42 billion) facility, announced during the quarter, is destined for companies buying up completed-but-unsold housing stock. Goldman Sachs has estimated, however, that getting outstanding housing inventory back to 2018 levels would require 26 times more (CNY ¥7.7 trillion)
The problem with Xi Jinping’s “productive forces” is that China already accounts for 31% of global industrial production. How do you grow it from here? For three years now, China’s capacity utilization rate across industries has been lingering below 76%, but it occasionally drops below this level in automotive production. China’s overall trade balance saw a massive USD $82.6 billion surplus in May, well above estimates. Still, potential trade barriers in the US and the EU represent risks to further export-oriented growth. For now, Beijing’s bet is on swamping its Asian neighbors. During the first quarter, shipments to the ASEAN bloc were up almost 13%.
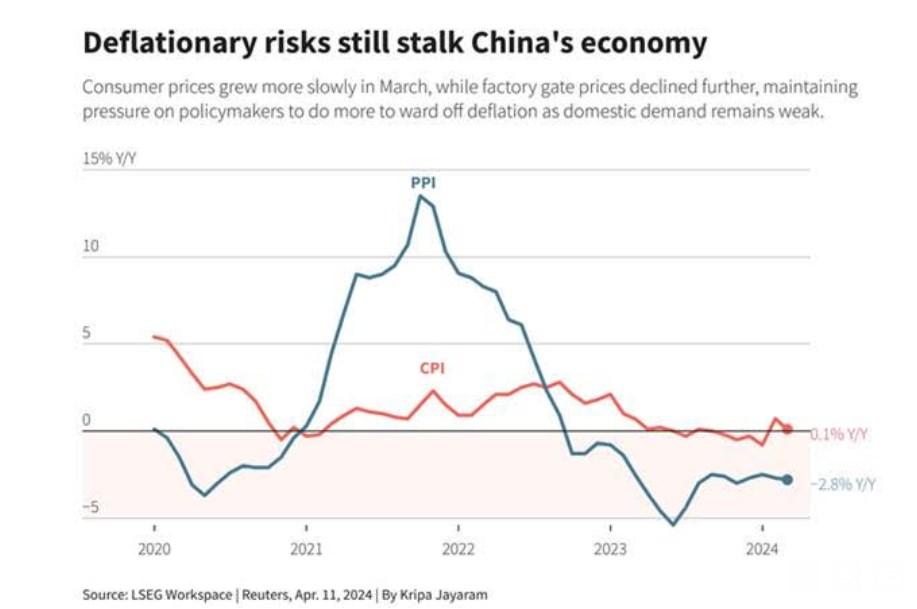
Output is relatively healthy, which helps boost GDP figures, but any progress in driving the volume of sales is being offset by falling prices. Q1 was the fourth consecutive quarter of negative deflators (1.1%), implying that nominal GDP has stagnated at around 4%, in line with the average of the last two years. Of course, all this means deflation. Despite the government-led increase in utility costs and train fares, China’s CPI inflation remained subdued, coming in at 0.3% YOY in May,
During the quarter, China expanded its list of critical minerals, adding uranium to the list. China aims to produce one-third of its uranium domestically.
EMERGING MARKETS
One solution for Chinese producers has been to expand into emerging markets, where the only meaningful battery competition comes from South Korea. Sales of Chinese EVs to Brazil increased to 48,000, an eightfold increase from the same period last year. It’s in Brazil (not Hungary) that BYD is building its first factory outside Asia and is planning to announce another one in Mexico by year-end. In Chile, BYD and Tsingshan are developing lithium cathode factories.
Chinese producers have engaged in tariff workarounds to enter the Western markets as “Malaysian”, “Mexican” or “Moroccan” products. The USTR has now warned Zocalo that the North American trade agreement was not meant as a back door to China. Mexico promptly responded by refusing to offer incentives to Chinese automakers despite the government previously handing out enticements such
as cheap land and tax cuts. And Ontario is clamoring for 100% EV tariffs in Canada to realign its policy with the southern neighbor.
In addition to Mexico, Vietnam, Poland, Morocco, and Indonesia are benefiting from the reshuffling of supply chains in response to US-China tensions. As a group, they represent 4% of global GDP, yet they’ve attracted slightly over 10% of all greenfield investment since 2017. Poland trails only China in global battery production rankings, hosting the likes of LG Chem Ltd., Northvolt AB, SK Innovation Co. and Umicore SA Shipments of made-in-Poland lithium-ion batteries are equivalent to 2.4% of all exports.
Volkswagen’s executive has recently admitted that LFP (lithium-phosphate-iron) supply chain is advancing fast in Morocco, a country rich in phosphate resources and in cobalt (for NCM batteriesnickel-cobalt-manganese). Last year, CNGR Advanced Material, a Chinese maker of battery components, announced it was joining forces with African private investment fund Al Mada to build a USD $2 billion industrial base in Morocco. Battery materials will start flowing from there to Europe in 2025.
Saudia Arabia announced that it wants to hit USD $100 billion of foreign direct investment annually by 2030, compared to USD $17 billion it received annually between 2017-2022. Ceer, Saudi Arabia’s first EV brand, has signed a USD $2.2 billion deal with Hyundai Transys for EV drive systems.
India, too, aims to attract at least USD $100 billion a year in gross FDI. EV sales there jumped 91% to 90,996 units in fiscal year 2023-24, while electric two-wheeler sales rose 30% to 947,087 units.
Counterpoint Research predicts a 66% increase in India's EV sales this year, capturing a 4% market share in the passenger vehicle segment. India has launched a USD $7 billion initiative to support 10,000 new electric buses across 169 cities. The national goal is to deploy 50,000 new electric buses by 2027 as part of India's transition to electric mobility in public transport.
CRITICAL MINERALS POLITICS
Here’s a list of the key developments during the quarter:
• US and EU officials failed to agree on a common approach to critical minerals during the summit of the Trade and Technology Council (TTC).
• The German government earmarked about EUR €1 billion (USD $1.1 billion) for raw materials investments via Germany’s state-owned KfW development bank. It will consist of equity capital to make acquisitions of minority stakes in mining companies and will be rolled out over the next four years. Apparently, the investments will be coordinated with Italian and French initiatives in the raw materials sector. It will focus on mineral projects defined as “critical” in the European Union’s Critical Raw Materials Act.
• The EU’s is creating an Economic Security Council, a position like Japan’s existing ministerial post. Critical mineral sourcing, as well as access to chemicals and energy will be the key prerogatives of this new portfolio.
• The Biden administration slapped a 102.5% tariff (up from 27.5%) on Chinese EVs and components. Initially, anode products (graphite) and permanent magnets (rare earths) have been earmarked for delays in application of these harsher tariffs.
• Australia and the European Union signed Partnership on Sustainable Critical and Strategic Minerals to build “secure, stable, ethical, and sustainable critical and strategic minerals supply chains.”
BATTERY DEVELOPMENTS
NCM (nickel-cobalt-manganese) and NCA (with aluminium) batteries are still making up 56% of total EV batteries However, LFP (lithium-iron-phosphate) batteries are gaining market share, benefiting from technology improvements reducing cell prices to USD $53/kWh. Driven by Chinese advances, the LFP chemistry is expected to make up over 50% of the global passenger EV market within the next two years, up from 44% in April. In June, Automotive Cells Company, led by Stellantis and Mercedes, has put on hold two of its three sites to switch from NCM batteries, to the cheaper LFP.
Other key developments:
• Nissan will begin to produce solid-state batteries for EVs at scale, with 100MWh per month starting April 2028. The automaker will introduce ‘giga-casting’ machines to improve efficiency and drive down costs for future models.
• Fresh research has focused on diamond batteries, which harness the energy released from radioactive diamond crystals made from carbon-14 atoms, which decay by emitting beta particles over an exceptionally long period. Diamond batteries are claimed to have a functional lifespan of around 28,000 years, far exceeding traditional battery technologies like lithium-ion.
• Tesla's energy storage business model involves sourcing cells from suppliers and assembling them into complete energy storage systems, including the Megapack, a large-scale energy storage system for office buildings and factories, and the Powerwall for homes.
• In Japan, Honda Motor Co. and Mitsubishi Motors Corporation announced a 50-50 joint venture called Altna Co. Altna Co. aims to optimize EV usage costs, enhance battery lifetime value, and improve resource circulation within Japan. The venture will also address the growing demand for grid storage batteries to support increased renewable energy use in Japan. Honda will contribute its control and connecting technologies for EVs and batteries, while Mitsubishi will provide power-generation expertise.
COMMODITY OVERVIEW
LITHIUM
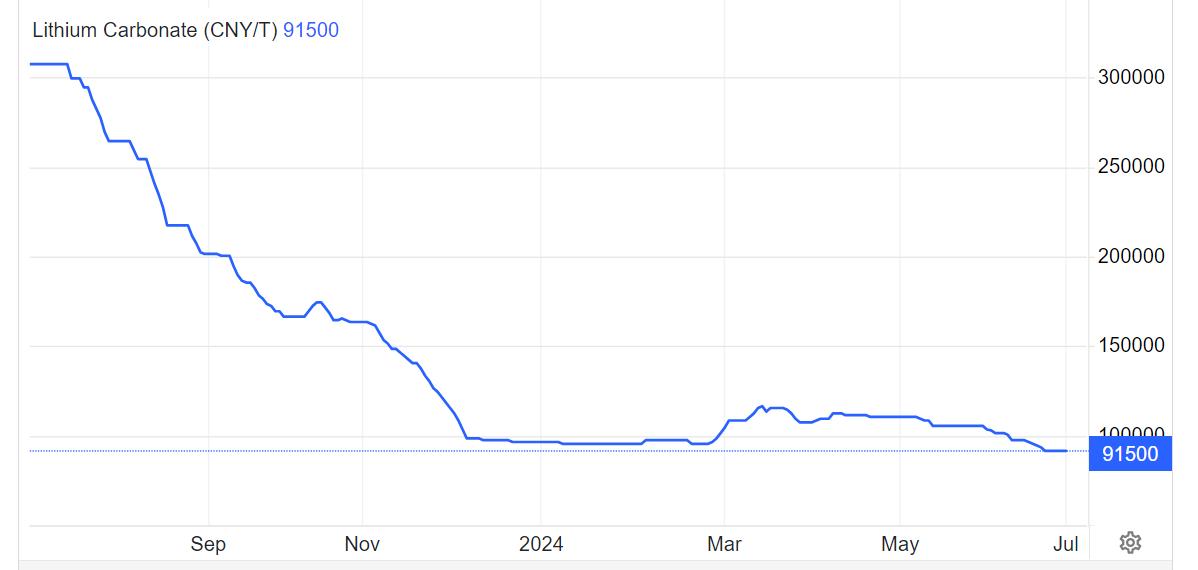
Slow market activity saw the price of lithium carbonate hover around USD $13,400/t in China. Chinese lithium hydroxide is not faring any better, reaching USD $12,300/t, down 14% from US$14,300/t The hydroxide to carbonate discount is emblematic for China’s increasing reliance on LFP batteries (lithium iron phosphate) that require carbonate feed. 6% spodumene concentrate, produced by miners, is priced below the USD $1,000/t.
The reasons for the oversupply inside China are now well documented. Four new Chinese spodumene mines were commissioned in Zimbabwe between May and October of last year, the largest of which, Yahua’s Kamativi, sports a capacity of 350t per annum. Together with the operations rolled out by Sinomine, Zhejiang Huayou, Chengxin and Canmax Technologies, the Sino-Zim complex will deliver 1.2Mt of spodumene, or a quarter of the total African production. Add to this the Chengxin/Yahua partnership in Ethiopia, where the Kenticha mine is expected to commence production this year, as well as some better-known assets in Mali – run by Ganfeng Lithium and Hainan Mining – and we obtain a picture of increased shipments against the already weak, oversupplied market. Last year, China imported 400kt of lithium spodumene and petalite from Zimbabwe, while just in the first four
months of this year, the numbers point to an annualized inflow of 1.4Mt, vs totaled installed Zimbabwean capacity of 1.7Mtpa.
Why can’t Western companies compete with the Chinese state arms in Zimbabwe? Because, Harare is in talks with Beijing for a USD $533 million revamp of the state railway company.
And regardless of the weak market, more supply is coming. Kuvimba’s future Sandawana mine in Zimbabwe is of a size that is only comparable with the mammoth operations in the DRC (Manono) and Mali (Goulamina), both of which were historically controlled by Western juniors and are yet to start regular shipments. All this means that Africa, which three years ago represented barely 2% of the global hard rock lithium supply, will control a market share of 18% later this decade, and that is assuming that the competition survives at these prices. It is not clear what concentrate grade travels across the Indian Ocean, but Chinese refineries can process spodumene with grades as low as 3.0% Li2O with minimal technical constraints. The estimated conversion costs from spodumene to carbonate range between CNY ¥23,000-¥35,000/t, depending on the grade (USD $3,440 - $4,800/t).
The second source of oversupply is Chinese lepidolite (low-grade lithium). The resilience of China’s lepidolite production remains a riddle. A low-grade, say 0.25%, feedstock needs a series of rotary kilns to churn out sizable product at volumes three times the spodumene conversion. All this would represent a prohibitive capex hurdle for a Western operator. But not for a subsidized Chinese company, apparently. Especially given that there isa market for a 2.5% carbonate inside the PRC and brownfields permitting is a breeze. Today, lepidolite cash costs of vertically integrated producers range from USD $8,000-$13,000/t for grades between 0.3% to 0.5% Li2O. Conversion opex from lepidolite to carbonate is a good 50-60% higher than for spodumene (CNY ¥40,000 to ¥55,000/t – or between USD $5,500/t to $7,580/t). This lepidolite overhang constitutes a cap on lithium prices. It is estimated that production from low grade lepidolite assets in China currently runs at 40% utilization rates but could return to the market if prices were to rise substantially.
The International Energy Agency has published its eagerly awaited update on Global Critical Minerals Outlook. IEA notes that although lithium demand rose by around 30% during the course of 2023, lithium prices fell by over 75%. On the chemical front, numerous lithium refineries are scheduled to commence operations and expand capacity in 2024 and 2025, primarily in Argentina, Australia, and China. This refining node is key here because most of the recently announced (Western) supply reductions or postponements have been associated with hard rock lithium, not midstream chemicals.
According to IEA, 85% of all lithium refining will remain concentrated in just three countries, raising what is typically referred to as “geopolitical” risk.
Against that sobering background, the longer-term outlook is more promising. The volume of production from the announced lithium mining projects appears to grow slightly till 2030, then stagnating afterwards. This relative investment reticence is probably caused by the extreme volatility of the price swings, which disincentivizes outlays for new capacity and is holding back wellcapitalized mining majors from entering this space.
In positive news for the extractive industry, the lithium market will remain almost exclusively reliant on primary production (mining), with only 3% coming from recycling.
COBALT
During the quarter, Henan-based CMOC Group, formerly known as China Moly, was accused by a top US official of using “predatory” tactics to depress cobalt prices. A recent spat with the government Kinshasa prevented the Chinese company from shipping any cobalt out of the country, but it didn’t stop it from stockpiling ever larger volumes at CMOC’s flagship Tenke mine. The news about this growing stockpile was purposefully leaked to the market, generating a virtual overhang in anticipation of Kinshasa and Beijing eventually ironing out their differences. This perception, in addition to the
actual 6% physical surplus in the market, contributed to a collapse in cobalt prices from USD $82,000/t a year ago to USD $27,200/t now. The slump led to the mothballing of the development of the single cobalt project in the US, Idaho Creek, owned by Australia’s Jervois Global. The US Department of Defense had previously allocated USD $15m for the feasibility study of this project.
CMOC and Fujian-based battery giant CATL also jointly own Kisanfu, a copper-cobalt mine located some 30km southwest from the Tenke mine. It has a nameplate capacity of 30ktpa of cobalt. Just in the first quarter of this year, these two Congolese assets already contributed 25kt of cobalt, all but annihilating any hopes for a revival of Western production. Hence the US government comment.
The DRC is the source of nearly 70% of the 230ktpa of cobalt mined worldwide. Most of this material ends up in China, which processes 80% of the world’s metal, including the by-product output from nickel mines in Indonesia. The southeast Asian country ramped up its production by 41% last year, becoming the 2nd largest source of the metal. Much of that production comes from Weda Bay on Halmahera Island in North Moluccas, where a large, coal-powered metallurgical complex is 57%owned by Wenzhou-based stainless-steel giant Tsingshan. Tsingshan acquired the stake from Mitsubishi a decade ago. France’s Eramet remains the minority partner in this venture and has recently paired up with Tsingshan for a lithium project in Argentina’s Salta province.
On current plans, Weda Bay may operate for half a century. Frighteningly, in a race to secure an everlarger share of the market, Jakarta has laid out plans to doubleits nickel and cobalt production in the next two years. However, the new government apparently has some second thoughts about it.
GRAPHITE
China controls 75% of natural graphite supply chain, with 99% of all the world’s spherical graphite produced domestically. For good measure, the PRC also controls 74% of synthetic graphite supply chain, starting with 69% control of the coke feed necessary for the synthesis.
It’s been six months since Beijing announced an embargo on exports of graphite products. Following pre-emptive stockpiling by customers prior to Beijing’s cut-off in December, shipments of natural graphite from China all but ceased. While November exports reached nearly 24kt, December volume barely reached 2kt. It fell further in January before stabilizing around these levels in February. Any trickle of material that does leave China is destined for South Korea, leaving clients in Japan, Germany, and the US deprived of any inflows. China’s exports of spherical graphite, which were boosted to 12kt during the stockpiling episode last November, fell to less than 2kt per month.
Only exports of active anode material (AAM) have recovered somewhat since the December slump, with Viktor Orban’s Hungary emerging as the second largest importer of the Chinese shipments.
Until the advent of China’s export curbs, a view prevailed that natural flake had an edge over synthetic alternatives owing to environmental advantages and approximately 50% cost savings. This represented a significant opportunity for high-quality, large flake producers. But although natural
graphite is usually less expensive and requires less energy to produce, synthetic graphite has its advantages in terms of fast-charging capabilities and cycle life. The cross-border shipment dislocations caused by China’s move could eventually reverse this market trend and see carbon intensity advantages yield to economic security, especially if prices of natural graphite begin to rise significantly.
Since 2021, China has ramped up its output of synthetic graphite and plans to produce 4.6 billion tonnes of synthetic graphite until 2025 (92% of all demand – 70kg/EV). From the viewpoint of a ‘green’ transition, the shift back towards synthetics could be self-defeating unless the feed material is manufactured using clean energy.
NICKEL
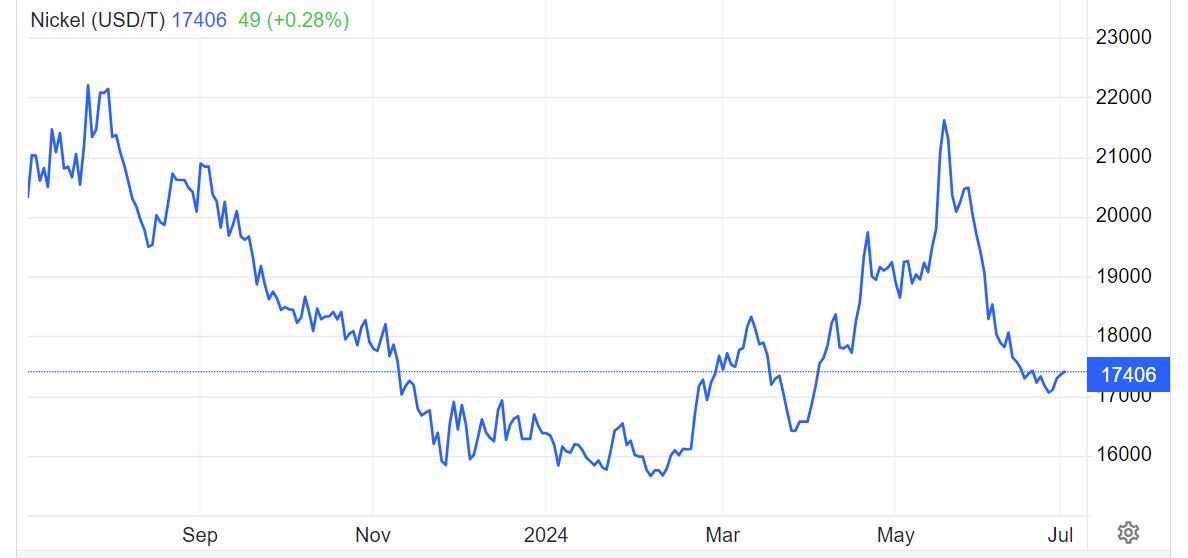
Following a wild ride during the quarter, nickel may have gained 2.84%, but both Western sulfide producers – Canada and Australia – are struggling to keep their industry alive. Canada is actively considering trade measures against China and Indonesia over what Ottawa labels “manipulation” of nickel market.
The pricing distress is such that BHP, First Quantum, Glencore, Independence Group, Wyloo and South32 – meaning almost all of Western nickel producers except Vale – are shutting down production.
Sulfide nickel, such as produced in Canada and Australia, was also previously shipped from Russia, but in April, Russian metal was banned from London Metals Exchange and the Chicago Mercantile Exchange. It washed up in Shanghai instead. Separately, the United States has banned all Russian imports of nickel (as well as aluminum and copper.) Russia was the source of much sulfide material available on the LME, and nickel price jumped up 22% on the news, but only for a couple of days.
The Philippines and Indonesia are the key suppliers of lateritic nickel. From 2018 to 2023, refined nickel products grew 1.4-fold to 3.1Mt, primarily driven by growth in Indonesia, which saw an almost fivefold increase in production. In many respects, the market has become unbalanced. Geographical concentration of the top producing country (Indonesia) grew from 30% to 45%, whereas the proportion of production from the top three producers grew from 50% to 70%. The projected pipeline indicates that refined nickel production will continue to grow, reaching 3.9Mt in 2040, with the most increase in nickel pig iron and nickel metals, each growing by around a quarter to 2040. Again, this production is primarily driven by Indonesia, which will see a 1.5-fold increase in refined nickel production by 2040. In fact, Indonesia’s share will be boosted from 45% last year to 59% in 2040. IEA anticipates that this shift towards utilizing more matter from lateritic deposits (e.g. from Southeast Asia) will continue through 2030. A mixture combining Class 1 nickel and recycled material will also increase during the remainder of this decade.
The US and its ally, the Philippines, are discussing ways to stop China from dominating nickel processing in Indonesia. The trilateral security partnership that now links Manila with Tokyo and Washington would involve a partnership in which the Philippines would supply the raw metal material, for the US to provide the financing and a third country (Japan or South Korea) offering the technology required for smelting and refining.
During the quarter, Indonesian smelters imported raw ore from the Philippines at record volumes, hitting 500kt in April. The reason being that Indonesian mines are having trouble meeting the needs of plants which last year churned out 1.8Mt of refined product. This, in turn, has been caused by two unrelated phenomena. As the most recent El Nino eased, the conditions around Sulawesi have become wetter, slowing down production in lateritic open pits. Secondly, tighter government production quotas have also contributed to slimmer ore output. All this prompted stronger shipments from Indonesia’s northern neighbor.
Between now and 2025, supplies of nickel sulfate are (more than) adequate. However, IEA cautions that longer-term nickel sulfate requirements exceed the expected sulfate supply. This conclusion is based on anticipated output from all the announced projects slated for production around 2030 and beyond.
RARE EARTHS
In early May, prices of rare earths recovered following several months of continuous decline. Praseodymium/neodymium (NdPr) oxide price went up 0.6% in April to hit CNY ¥391,500 (USD $54,027) per tonne. Chinese state-owned China Northern Rare Earths was one of those that contributed to the positive sentiment in early May by setting NdPr oxide prices higher, in anticipation of high demand. But then, orders failed to materialize at levels initially expected and the market remained well-supplied.
Heavy rare earths are showing stronger price support. Dysprosium oxide went up 10% month-onmonth, finishing May at RMB 2,175,000 (USD $300,150) per tonne. This is a good reason to focus on those mining projects that are richly endowed with dysprosium and terbium.
China is set to produce 84% of global NdPr oxide supply in 2024, even though the level below USD $60/kg is often considered a threshold below which marginal production in China is not profitable.
These low prices suit the strategy of the CCP as they are way below levels that would incentivize capacity investment at most ex-China producers, including Lynas and MP Materials, the only major rare earths miner-processors in the Western world. The Chinese are reading the structure of the Western industry correctly. Australian and Canadian juniors are more likely to be in a capitalintensive stage. Operating in liberal market economies, they also need higher prices and lower volatility to attract investors and support expansions. Building capacity is also complicated by the fact that it is now illegal for Chinese engineers to share their rare earths’ skillset with foreign counterparts.
Almost all ex-China pipeline NdPr capacity needs prices above the current levels to achieve a profit margin of at least 15%.
An initiative has been launched in Washington to seek to generate “Western” markets that do not reflect the low prices set by Beijing’s subsidized, state-owned or state-directed strategy, but would instead be based on the reality of the physical contracts in the West. One idea is for the DOE (or another department?) to securitize commercial banking leverage for a US trading platform dedicated to critical materials (e.g., Employ America’s MakingtheMarket:DOECanSecureOurSupplyChain withFinancialInnovation). Another one is to create an index of prices from private contracts, but with a cap and a floor for as long as the “nascent” industry needs to be protected (super profits would be shared among participants up and down the value chain – as it was done with platinum in the 1970s).
We have recently done some work on the defense applications for 12 out of 17 rare earth oxides. The US stockpiling and recycling strategy is woefully inadequate. No wonder that Western rare earths explorers (e.g. in Brazil) outperform critical minerals companies that specialize in battery metals.
MANGANESE
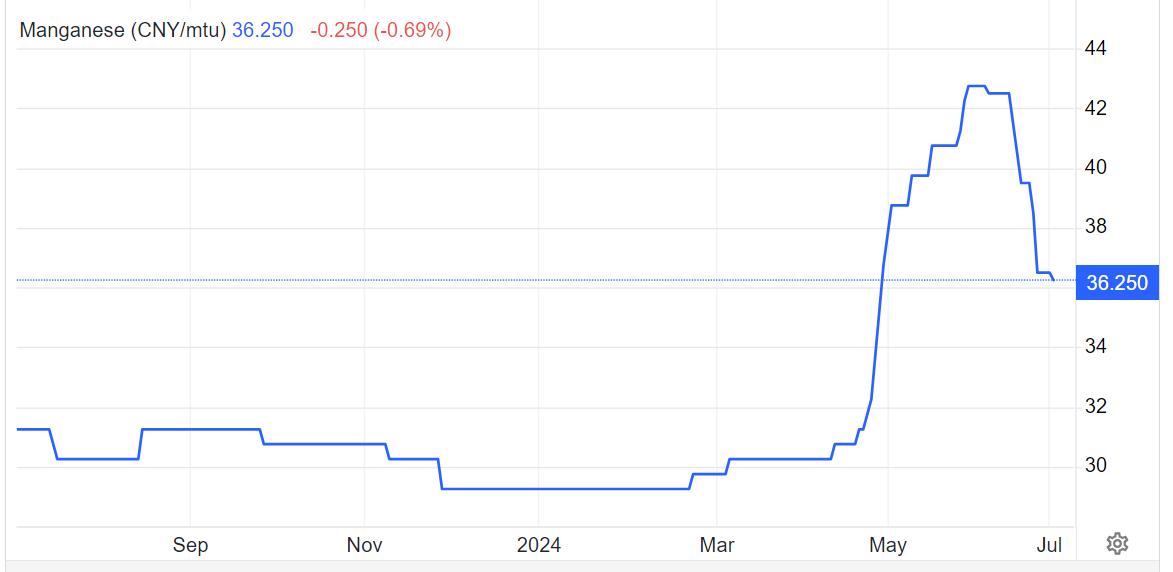
Interesting events have swept this year through global manganese supply, prompting us to seek exposure to producing assets (Jupiter Mines in South Africa). In late March, a cyclone swept through Groote Eylandt, an island off Australia’s Northern Territory’s Arnhem Land. It is there that Australian major mining company South32 operates a 6-decade old manganese mine. Prices recorded for 37% of the product at Port Elizabeth in South Africa’s Eastern Cape reacted immediately, adding 8%. South32 announced that it did not expect the operation to run smoothly until early 2025. Groote Eylandt produces around 1.8 million tonnes of manganese, almost half of Australia’s total output.
Then came Gabon, the site of 4.6Mt of manganese production and the world’s second-largest supplier after South Africa. On April 26, a train belonging to the Société d'exploitation du Transgabonais (Setrag) was derailed, damaging several hundred meters of track and suspending traffic in both directions. It affects the connection to Franceville, and thus transportation of manganese from an operation nearby. The 650km long line was put into operation in 1978, but its long stretches still use wooden sleepers, which decompose easily in the moist climate, increasing the frequency of such accidents. The immediate impact of the train derailment was quite spectacular – a 25% jump in the company’s share price.
Gabon’s manganese was until the 2000s an exclusive terrain for French companies and to this day Paris-headquartered Eramet is the country’s largest producer. However, 31.7% of Gabon’s ores are destined for China. The bulk of this production is provided by South Manganese Investment, a Hong Kong listed entity operating Bembele mine with 1Mt pa.
DISCLAIMER
This newsletter and the views expressed herein (the ‘Newsletter”) are for discussion and general information purposes only. This Newsletter does not have regard to the specific investment objective, financial situation, suitability, or the particular need of any specific person who may receive this Newsletter and should not be taken as advice on the merits of any investment decision. In addition, this Newsletter should not be deemed or construed to constitute an offer to sell or a solicitation of any offer to buy any security described herein in any jurisdiction to any person, nor should it be deemed as investment advice or a recommendation to purchase or sell any specific security.
THIS NEWSLETTER IS CONFIDENTIAL, IS INTENDED ONLY FOR THE PERSON TO WHOM IT HAS BEEN PROVIDED and is intended for distribution only to sophisticated investors, financial institutions, financial services licensees, and their advisers. This Newsletter is not intended for viewing by retail clients or members of the general public. and under no circumstance may a copy be shown, copied, transmitted, or otherwise given to any person other than the authorized recipient without the prior written consent of Amvest Capital Asset Management LLC (the "Manager"). Notwithstanding anything to the contrary herein, each recipient of this document (and each employee, representative, or recipient) may disclose to any and all persons, without limitation of any kind, the tax treatment and tax structure of: (i) the proposed private investment vehicle (the "Fund") and (ii) any of its transactions, and all materials of any kind (including opinions or other tax analyses) relating to such tax treatment and tax structure. The distribution of the information contained herein in certain jurisdictions may be restricted, and, accordingly, it is the responsibility of any prospective investor to satisfy itself as to compliance with relevant laws and regulations.
The information contained herein is preliminary, is provided for discussion purposes only, is only a summary of key information, is not complete, and does not contain certain material information about the Fund, including important conflicts disclosures and risk factors associated with an investment in the Fund, and is subject to change without notice. Unless otherwise indicated, the information contained herein is believed to be accurate as of the date on the front cover. No representation or warranty is made as to its continued accuracy after such date.
This document is not intended to be, nor should it be construed or used as an offer to sell, or a solicitation of any offer to buy, interests, or shares in the Fund. No offer or solicitation may be made prior to the delivery of a definitive private placement memorandum (the "Memorandum") which will contain additional information about the Fund, including disclosures relating to risk factors and conflicts of interest. The information contained herein does not take into account the particular investment objectives or financial circumstances of any specific person who may receive it and is qualified in its entirety by the Memorandum. In the event of any discrepancies between the information contained herein and the Memorandum, the Memorandum will control. The information herein is not intended to provide, and should not be relied upon for, accounting, legal or tax advice, or investment recommendations. You should make an independent investigation of the investment described herein, including consulting your tax, legal, accounting, or other advisors about the matters discussed herein.
An investment in the Fund may not be suitable for all investors. An investment in the Fund will be suitable only for certain financially sophisticated investors who meet certain eligibility requirements, have no need for immediate liquidity in their investment, and can bear the risk of an investment in the Fund for an extended period of time.
Investing in financial markets involves a substantial degree of risk. There can be no assurance that the investment objectives described herein will be achieved. Investment losses may occur, and investors could lose some or all of their investment. No guarantee or representation is made that the Fund’s investment program, including, without limitation, its investment objectives, diversification strategies, or risk monitoring goals, will be successful, and investment results may vary substantially over time. Nothing herein is intended to imply that the Fund’s investment methodology may be considered “conservative”, “safe”, “risk-free” or “risk averse”. Economic, market, and other conditions could also cause the Fund to alter its investment objectives, guidelines, and restrictions. The past performance is no indication of current or future performance. The performance data do not consider the commissions and costs incurred on the issue and redemption of units.
Certain information contained in this document constitutes "forward-looking statements," which can be identified by the use of forward-looking terminology such as "may,” "will,” "should,” "expect,” "anticipate,” "target,” "project,” "estimate,” "intend,” "continue," or "believe" or the negatives thereof or other variations thereon or comparable terminology. Due to various risks and uncertainties, actual events or results or the actual performance of the Fund may differ materially from those reflected or contemplated in such forward-looking statements.
THESE MATERIALS CONTAIN INSUFFICIENT INFORMATION TO MAKE AN INVESTMENT DECISION. NEITHER THE U.S. SECURITIES AND EXCHANGE COMMISSION NOR ANY STATE SECURITIES COMMISSION HAS REVIEWED OR APPROVED THESE MATERIALS.
This is an advertising document. The state of the origin of the Fund is the Cayman Islands. In Switzerland, this document may only be provided to qualified investors within the meaning of Art. 10 Para. 3 and 3ter CISA. The representative in Switzerland is Zeidler Regulatory Services (Switzerland) AG, Neustadtgasse 1a, CH-8400 Winterthur, whilst the paying agent is Rothschild & Co Bank AG, Zollikerstrasse 181, CH-8034 Zurich. The constitutional documents of the fund, the private placement memorandum, and the annual report may be obtained free of charge at the registered office of the Swiss Representative.
ABOUT THE FUND
PORTFOLIO TEAM
AMVEST TERRADEN CRITICAL MINERALS FUND invests in global equity of companies active in the exploration, development, and mining of strategic minerals for new technologies critical for decarbonization, including transportation, energy generation, and storage. Terraden focuses exclusively on companies active in the Western (non-Chinese, non-Russian) value chain, with a strong emphasis on ESG compliance.
AMVEST CAPITAL is a specialist investment management and corporate finance firm solely focused on the natural resources sector. Founded in 2017 and based in New York City, Amvest partners with companies worldwide to develop sustainable and socially responsible natural resource assets. To learn more, visitamvestcapital.com.