Many cities and regions have embraced the concept of transit-oriented development (TOD). From Copenhagen to Singapore, this planning approach has successfully helped build compact and more livable cities by promoting higher built densities and mixed-use developments.
But is it really a story of success everywhere? Can a general formula for development exist for all cities? What happens in the case of existing dense settlements? Has TOD really been the catalyst for development of dense settlements in India?
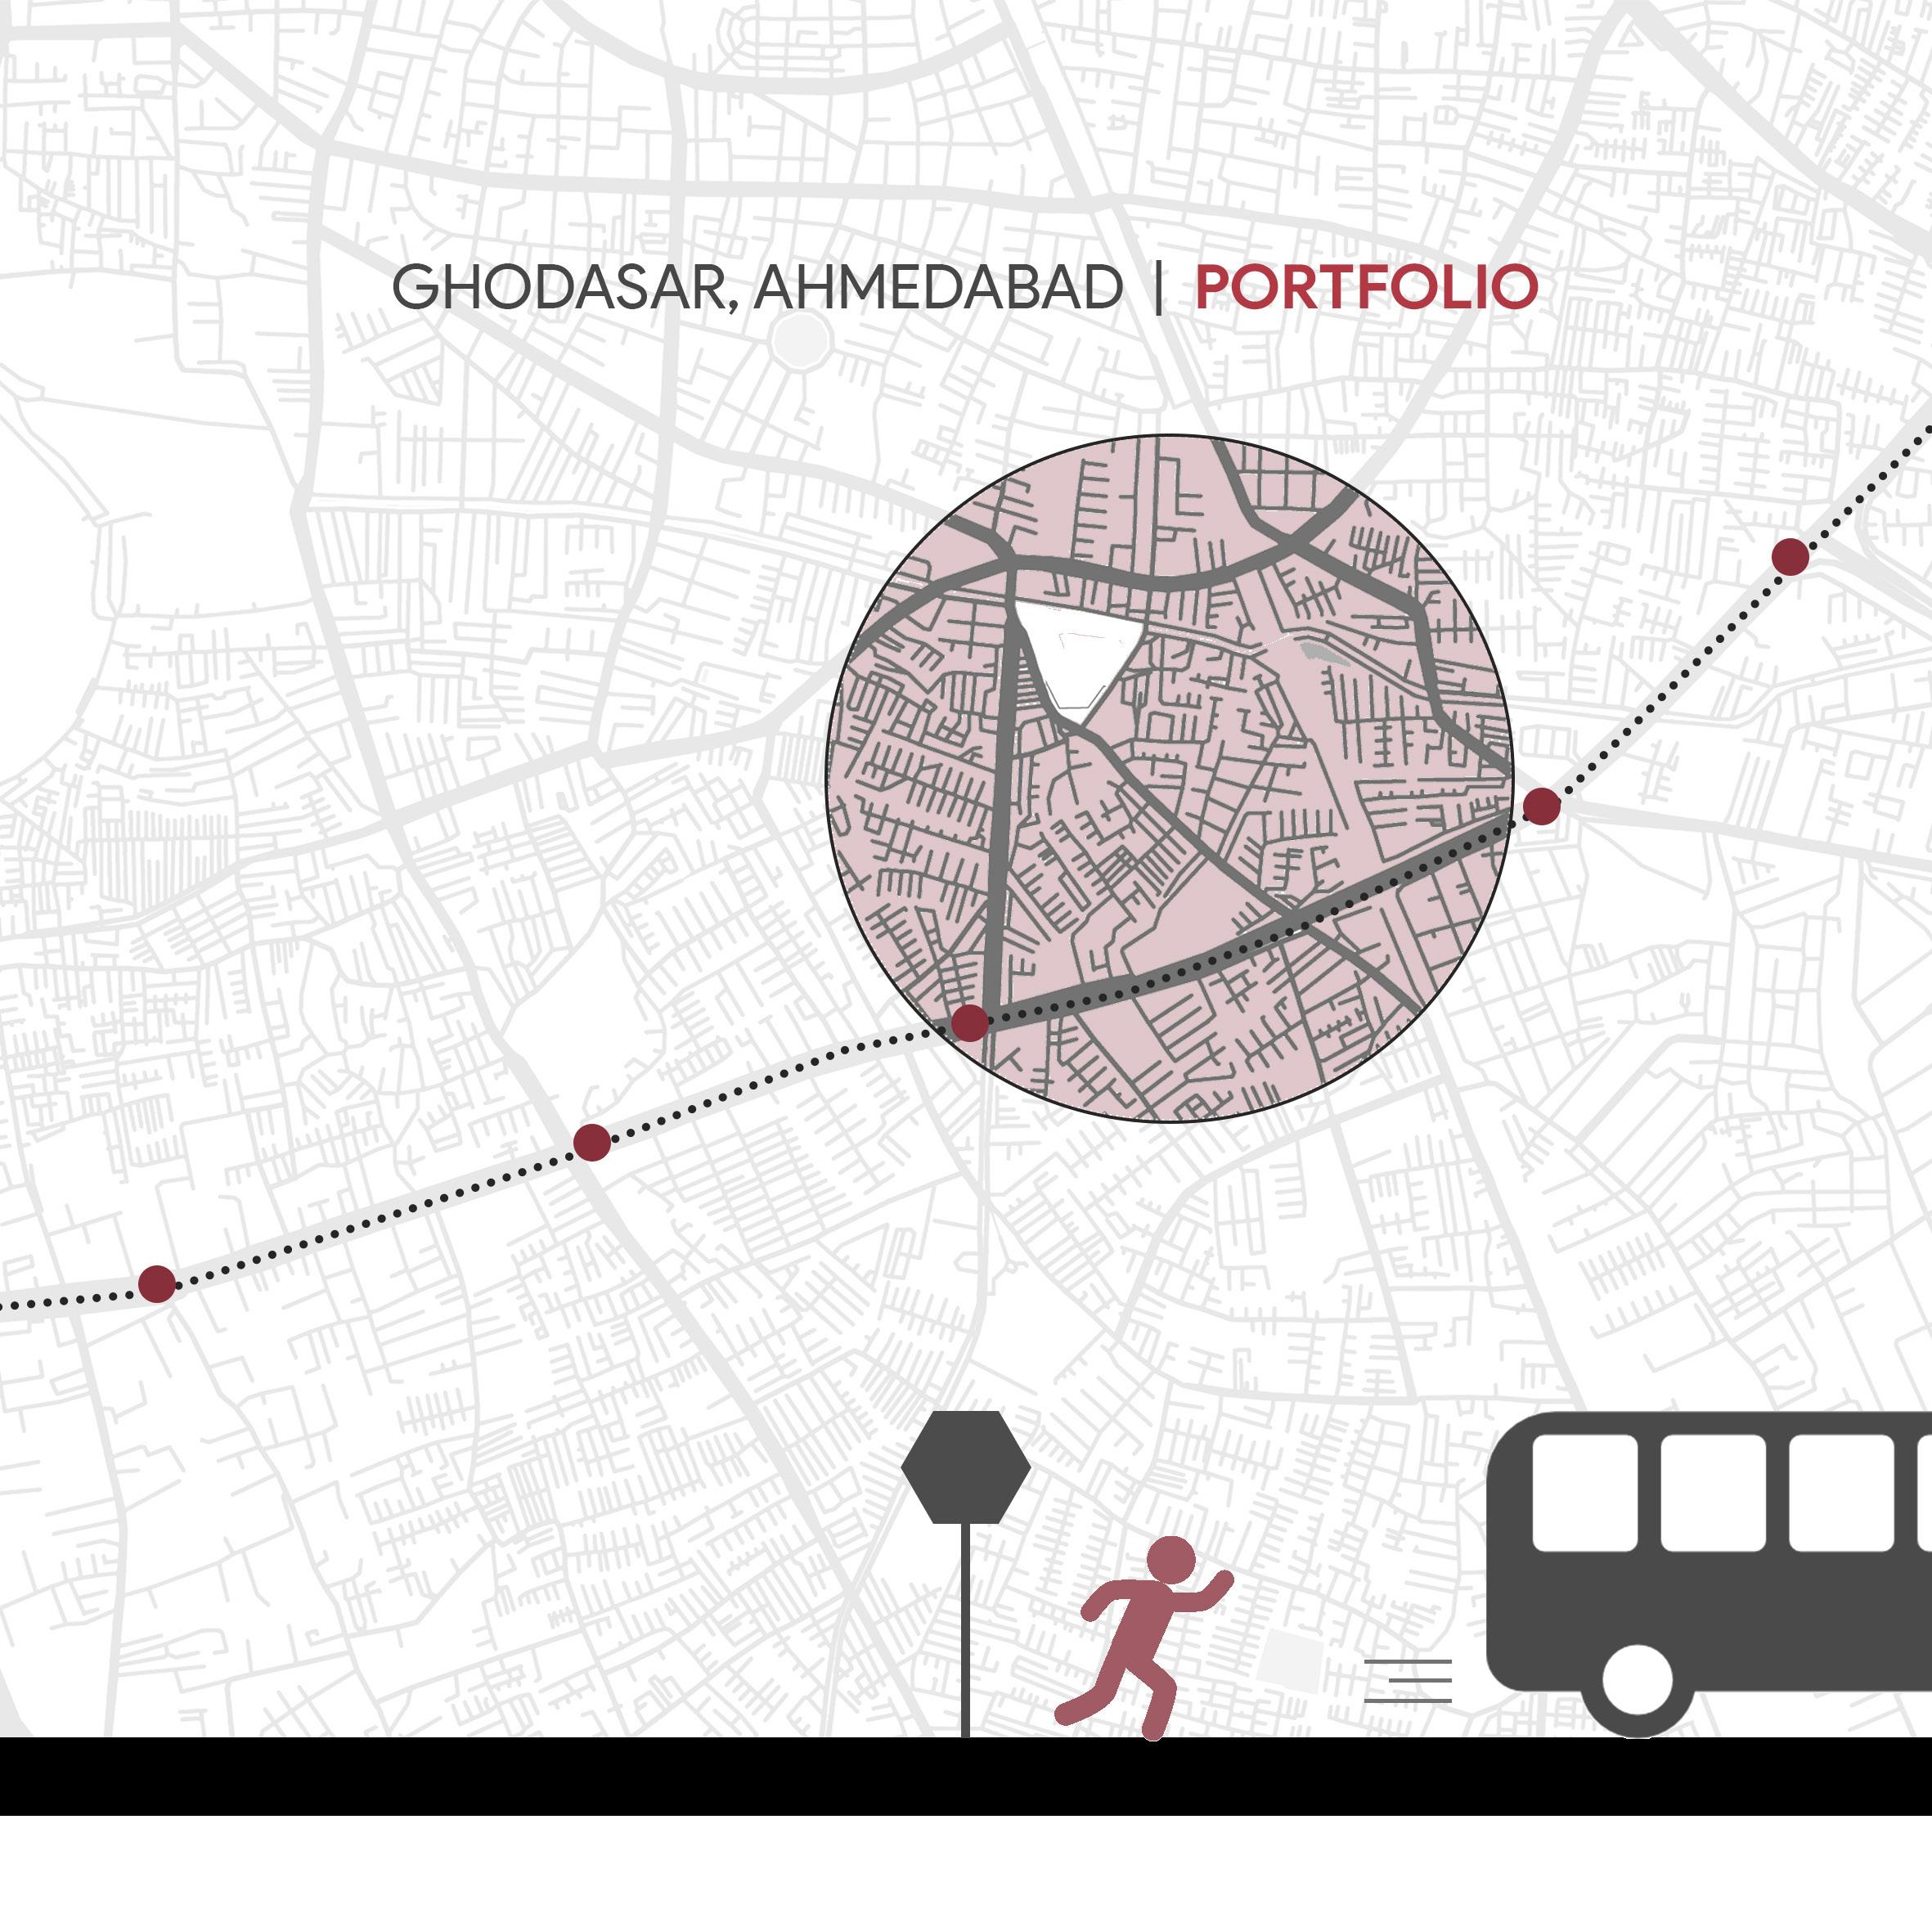
This portfolio focuses on understanding the delayed pace of development in a highdensity settlement like Ghodasar, Ahmedabad. It constitutes a qualitative and quantitative analysis of 1 sq. km area in the neighborhood of Ghodasar, through various parameters of evolution and urban transformation, street networks, built form, land development, policy and infrastructure.
01 Overview 01
Introduction to the city
Ghodasar : Understanding the precinct
A timeline of transformation
Varying tempos of transformation
02 TOD-ness in Ghodasar 07
Overview of TOD in Ahmedabad
What does TOD intend to do?
Reading between the lines
Why are people not walking?
Activating Edges : Cadila Road and Canal Road
Isolating Edges : NH8 and Railway Line
03 The Stunted Pace of TOD 15
Land markets driving development
Interpreting land demand and density
Built form regulations
Policy implications 04 Choices and Affordability 21
The composite city model
Unequal land value escalation restricts housing stock
Disposable income affects travel behavior
TOD induced gentrification 05 Where, When and How? 29
Where is TOD failing?
Need for adjustments in TOD policy
The 3V Framework – Node, Place & Marketplace values 06 Conclusion 33
Ahmedabad has seen substantial diversification and expansion in terms of land development and economy, owing to the growth of the industrial sector, especially in the eastern parts of the city. The three GIDC estates namely, Vatva, Naroda, Odhav have been major drivers of growth in the surrounding regions.
Ghodasar is one such example of an urban village that has transformed morphologically and socially, as a response to the growth of these industrial estates.
This initial chapter looks at the elementary facts about the place - geographical location, timeline of transformation and the different factors affecting the pace of evolution.
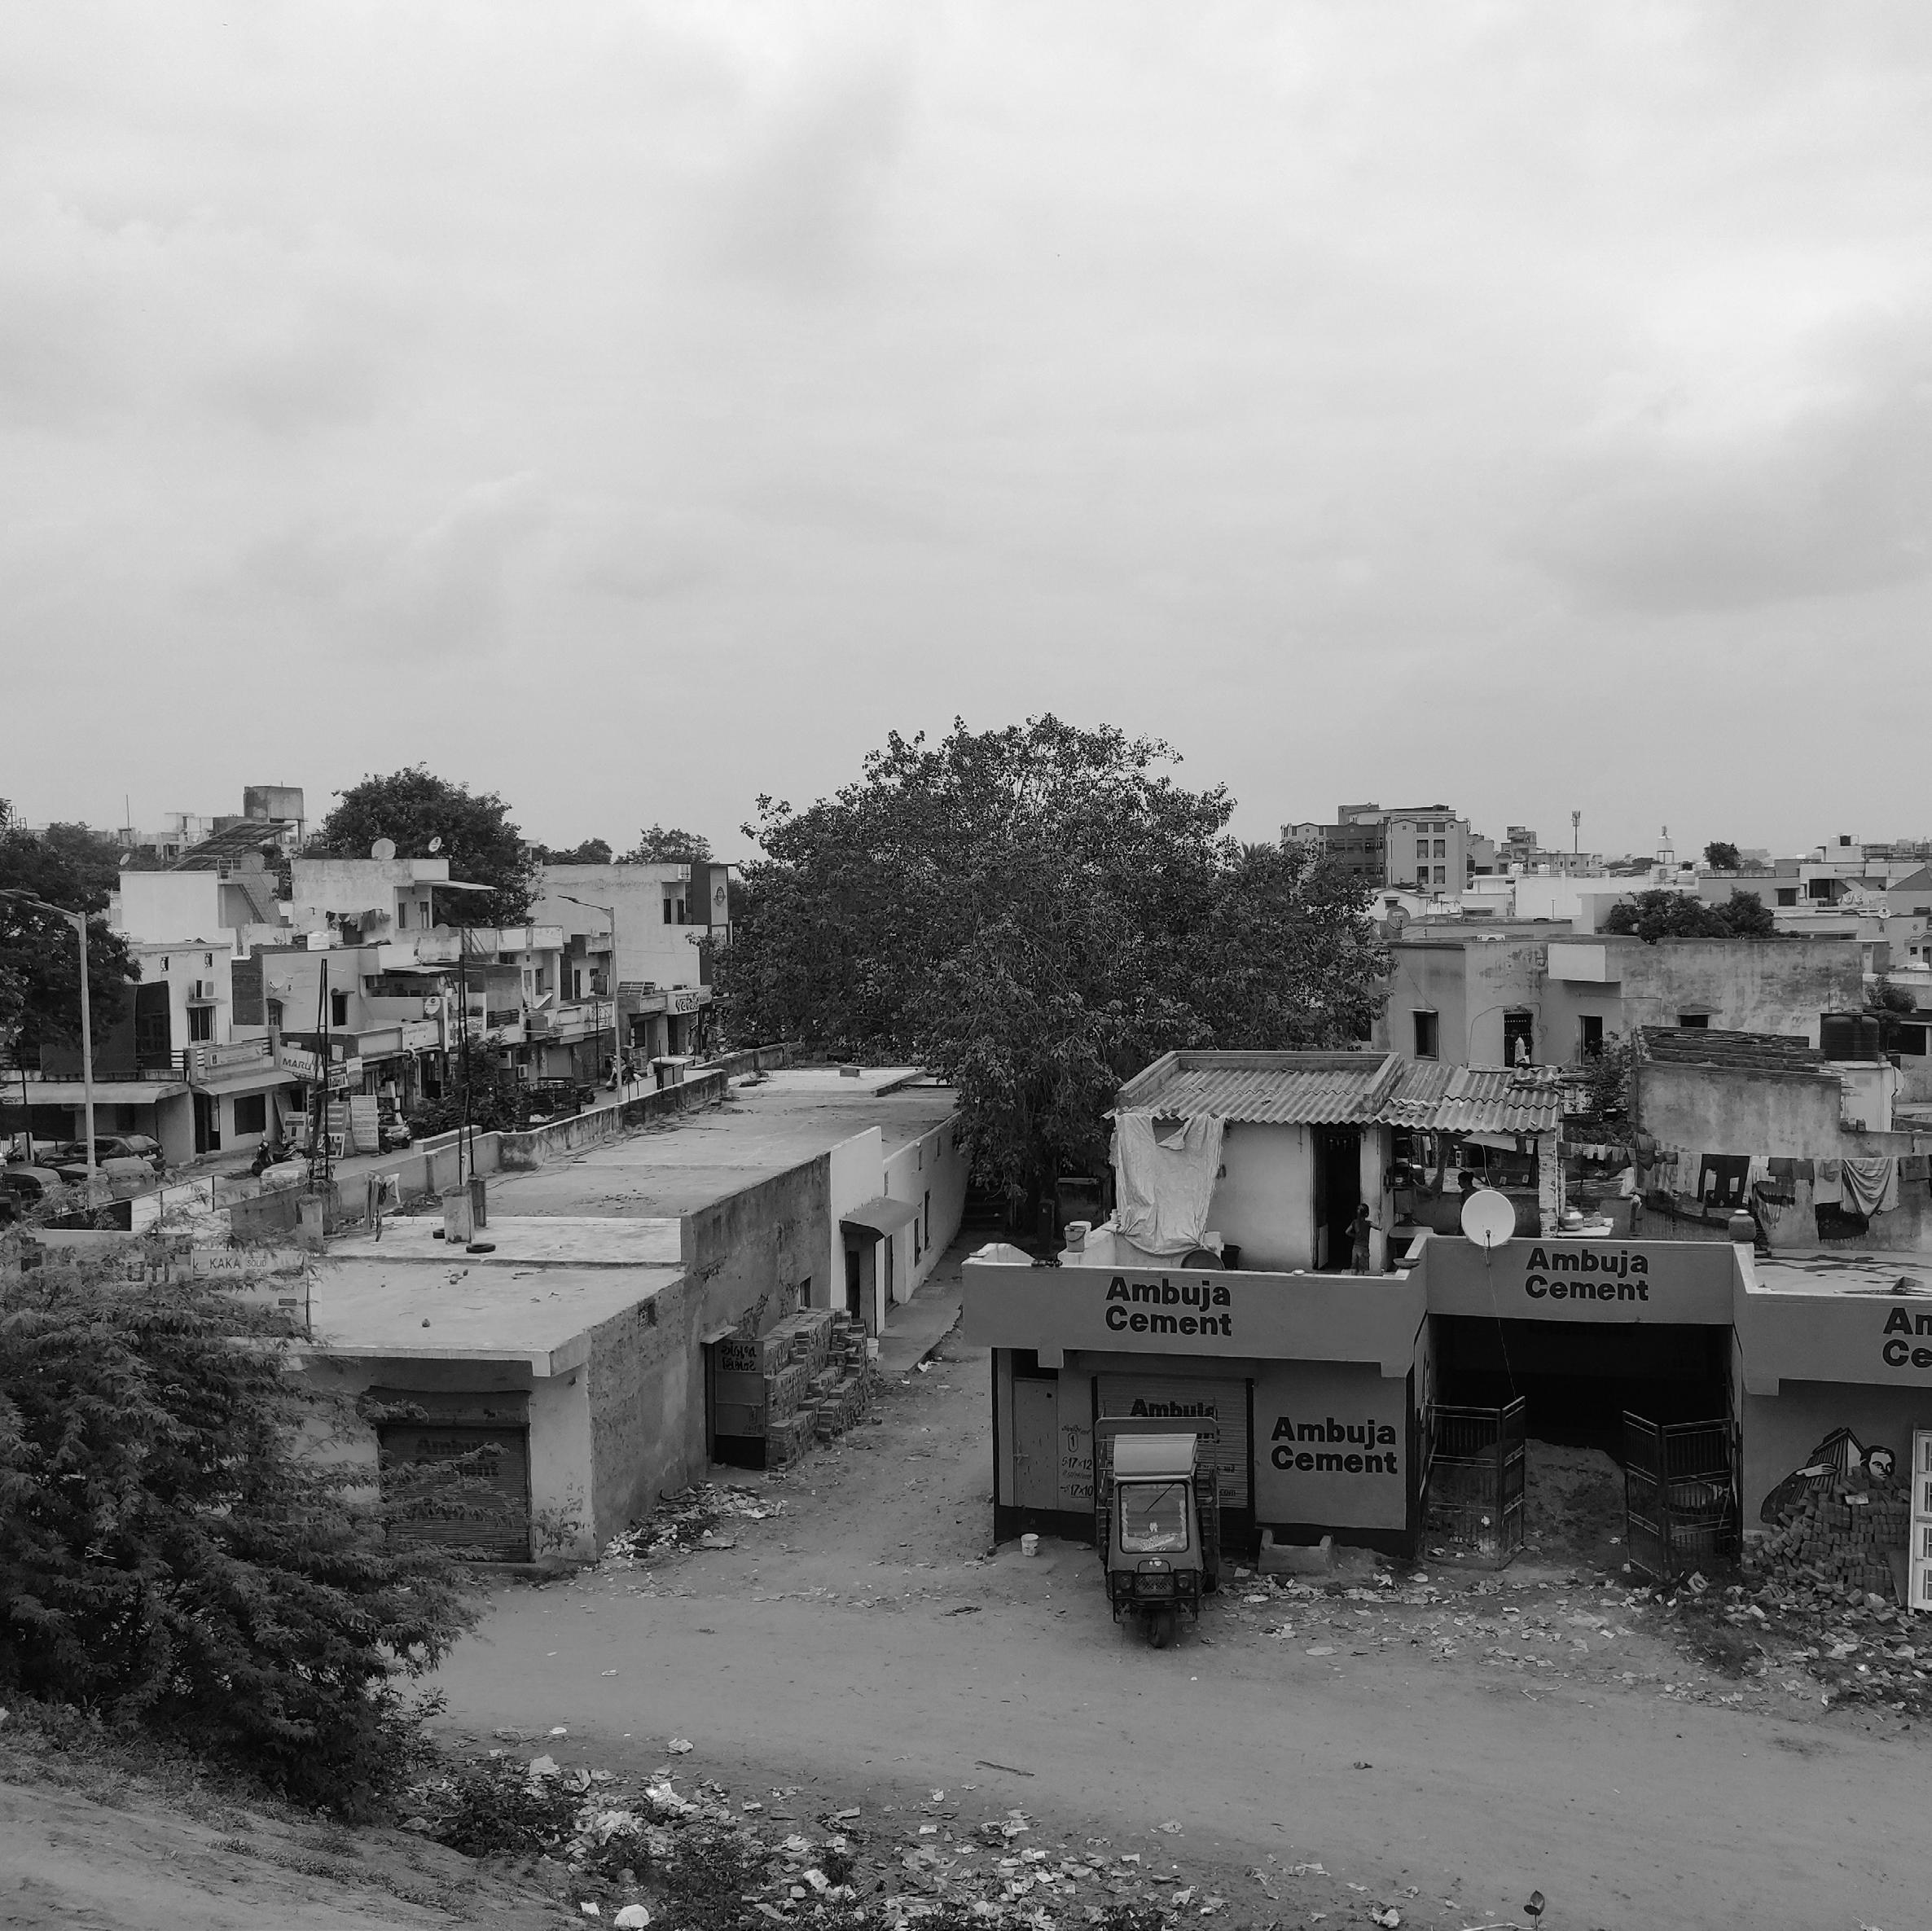
As the industrial areas developed, people from old city, Rampura, Navpura and other towns started migrating to the outskirts in search of job opportunities. They settled around the industrial areas, resulting in the development of several urban villages.
Ghodasar, an outcome of this process, is situated between the old city walled area and the GIDC (Gujarat Industrial Development Corporation) estates like Vatva, Odhav and Naroda.

55.7Lakhs
Population

466km2
Spatial Extents

Governance

11km
City Centre (Ashram Road)
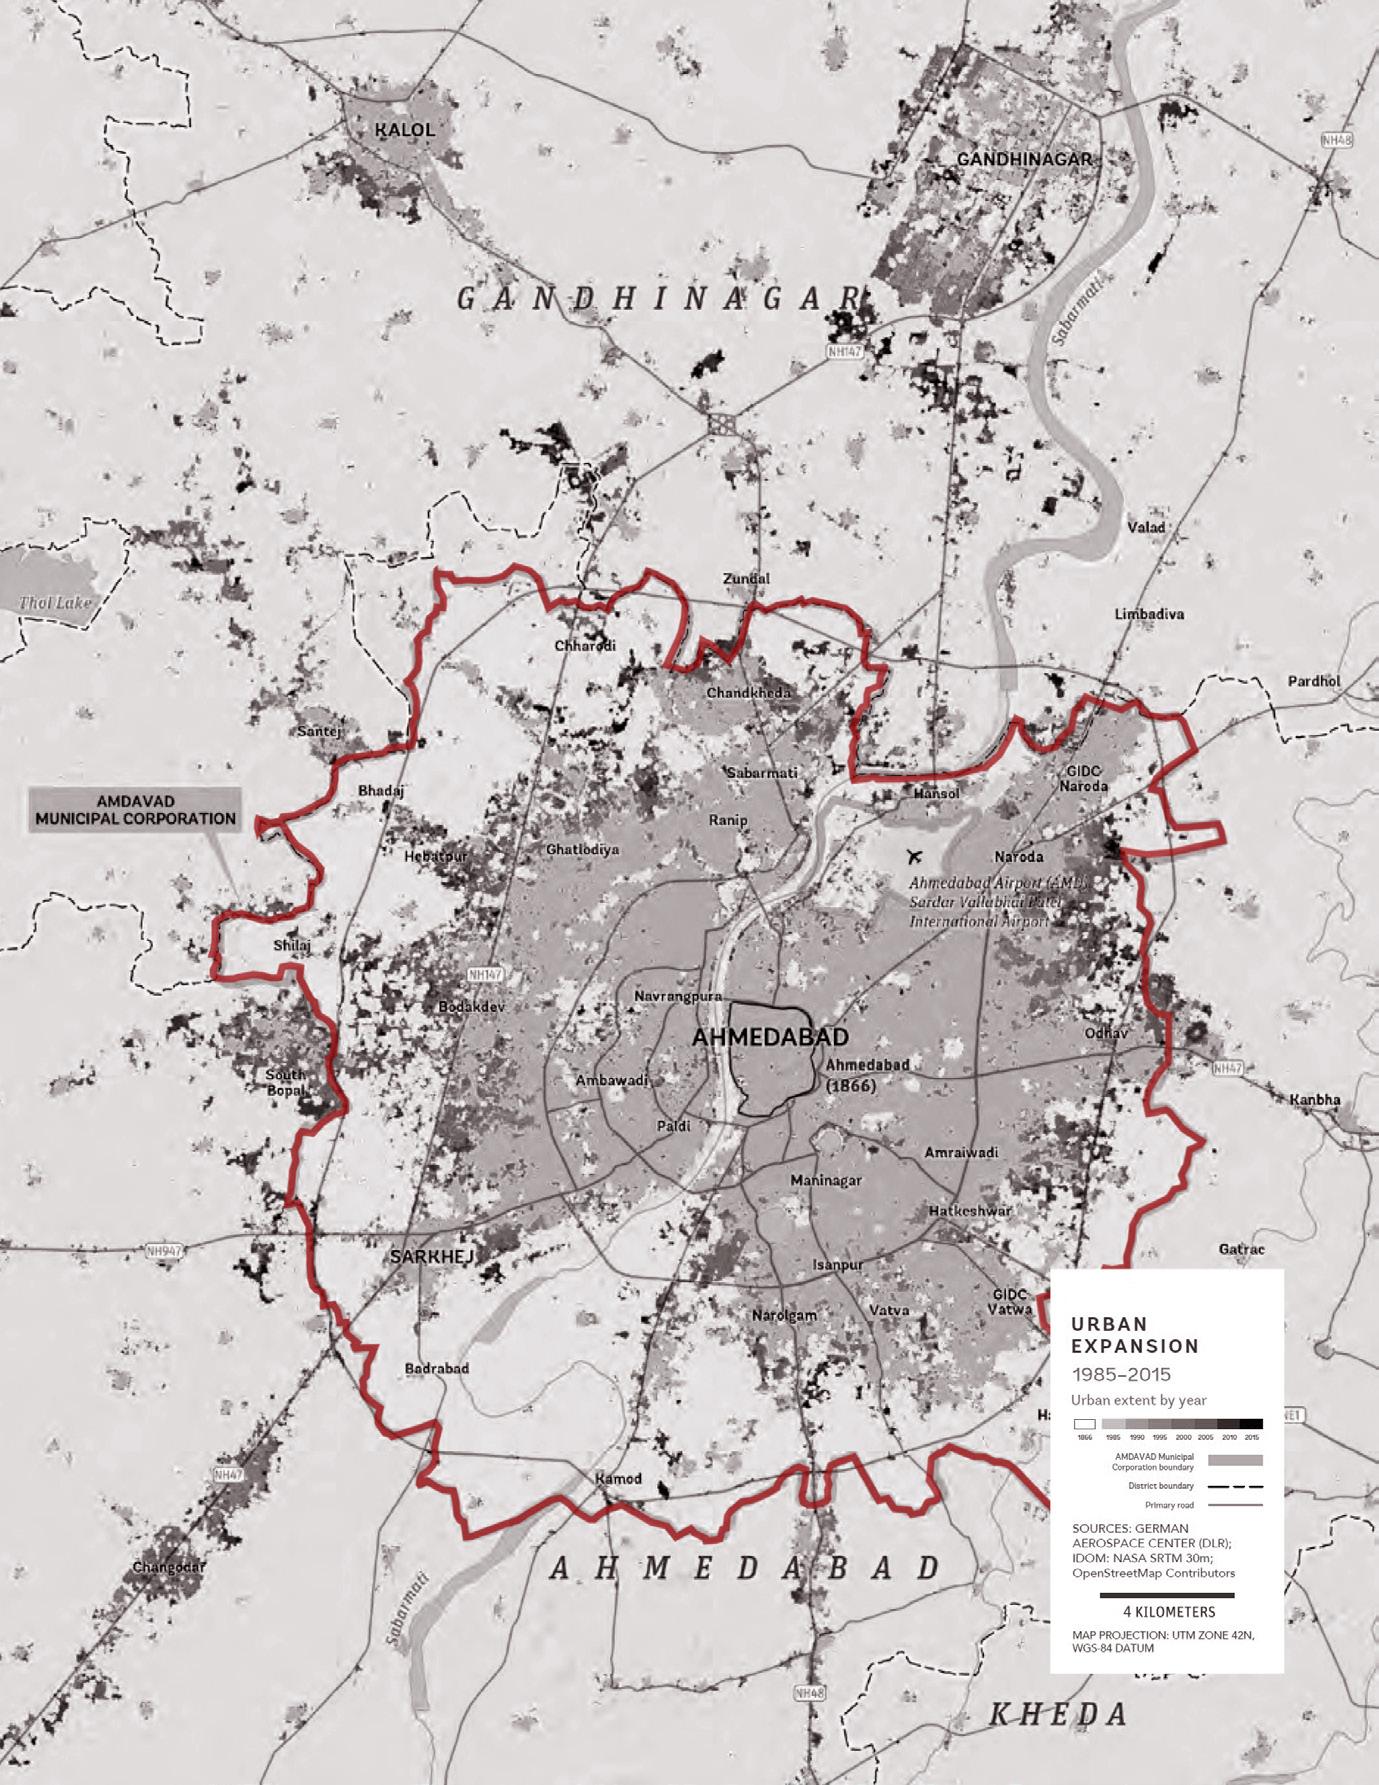
Ahmedabad City Extents and the Precinct
Source:WorldBankGroup,2020

ECOLOGICAL
Collapse of school building due to earthquake

POLICY
Canal redevelopment by Irrigation Department
132ft Ring Road
Canal Road
Ghodasar Lake
Maninagar Railway line
Ghodasar Gam
Cadila Laboratory
BRTS Corridor
Avalon Courtyard Apartments
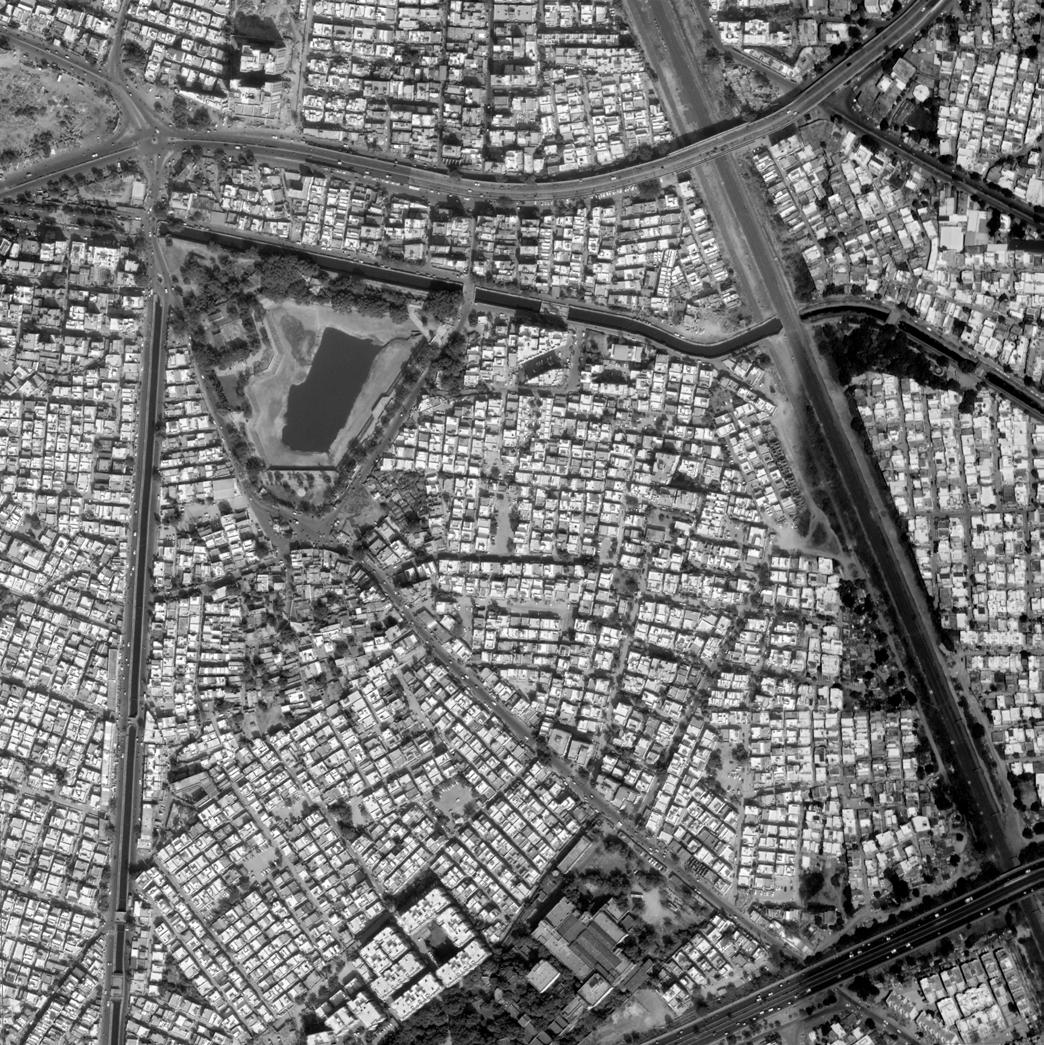
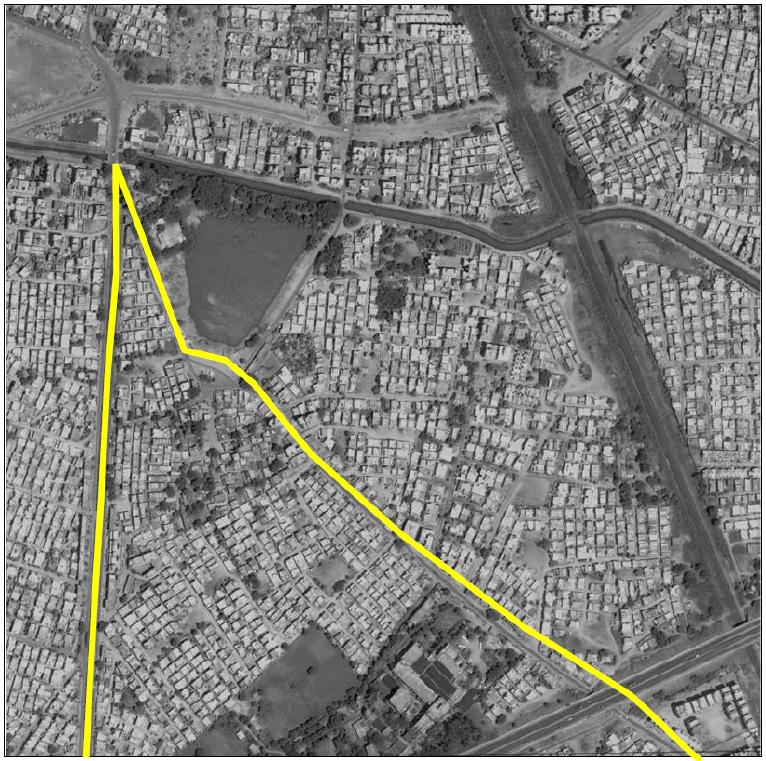
Ghodasar is a small neighborhood in south-eastern Ahmedabad, nestled between the walled city and the industrial estates. It has a relatively low-rise and dense urban fabric, that is predominantly residential in nature with semidetached, row housing, bungalows, and a few apartment complexes.
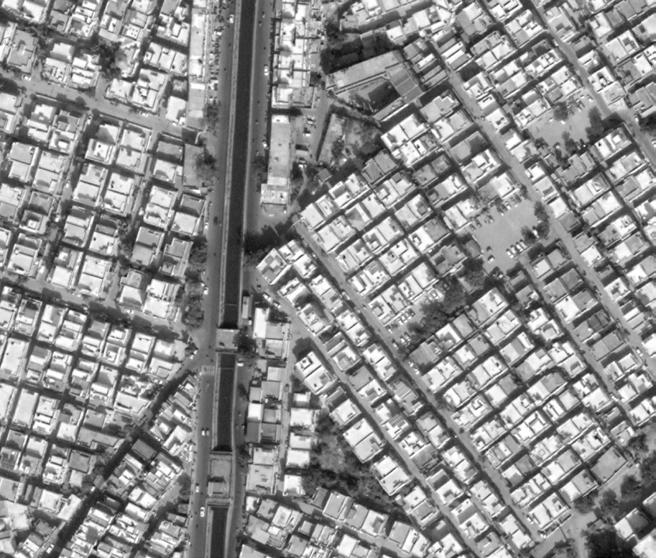
Dense Urban Fabric Grain

PHYSICAL
Road widening and relaying by AMC

POLICY
Lake redevelopment as part of city wide AMC scheme
TRANSPORTATION
Bus Rapid Transit System (BRTS) initiated

POLICY
TOD zone marked as per CDP 2021
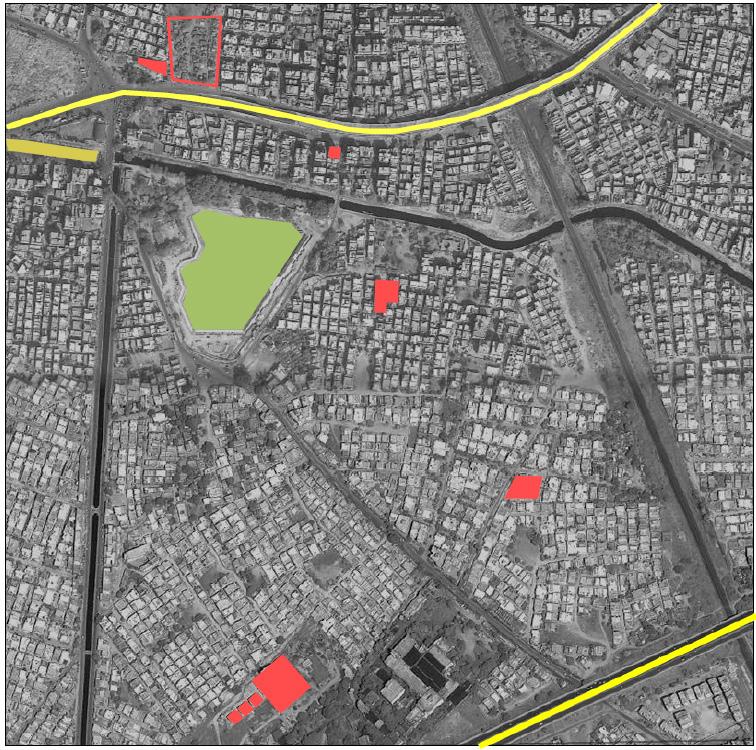
During the years of 2004-2005, the Ahmedabad Municipal Corporation (AMC) widened and re-laid roads - specifically, the Cadila road that runs across the area in the centre. This was done to accommodate the increased traffic flow from the industrial areas towards Maninagar.
During 2008-2009, there was a gradual shift towards more mixed-use developments, especially along the arterial and sub-arterial roads.
Phase 1 of the BRTS project was implemented along the Narol-Naroda highway or NH8. Consequently, due to the increase in population and demand, open or vacant lands were taken over by new construction.
Second Phase of Evolution (2012- Present)
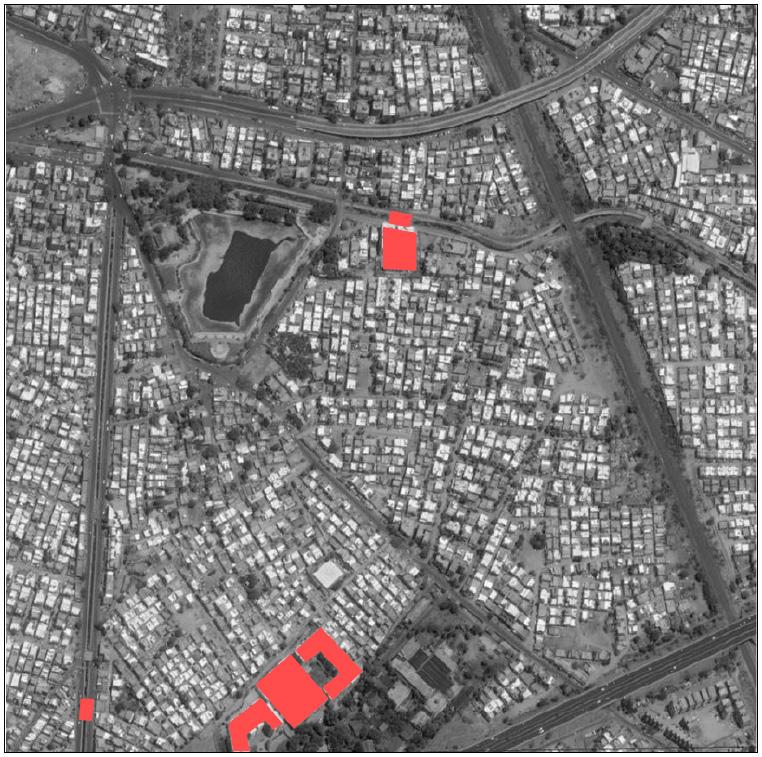
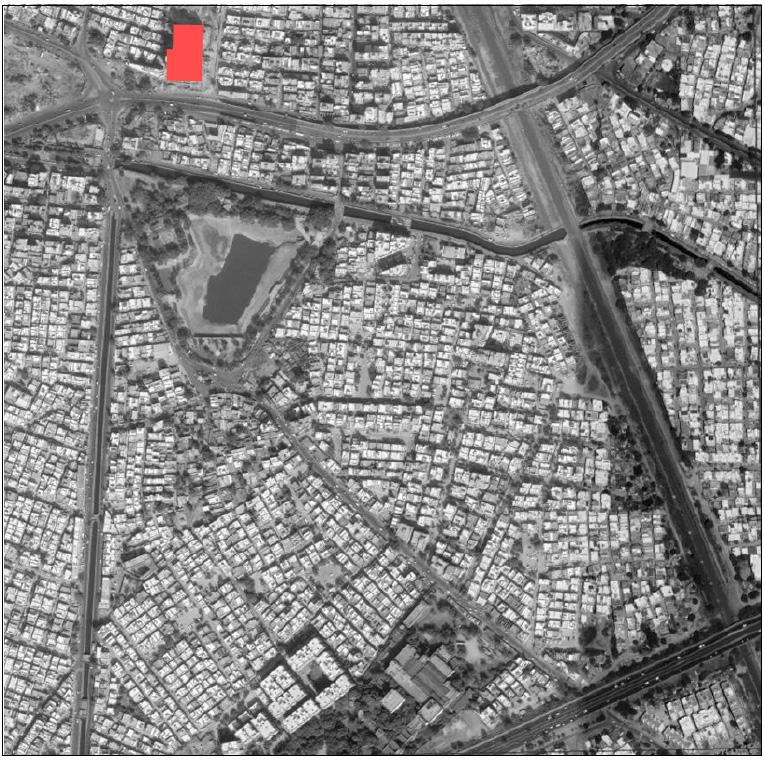
Part of Ghodasar area falls within the TOD zone which led to an increase in the maximum permissible built-up area on any plot. This is evidently seen in the increase in construction of high rise buildings along NH8, indicating the high value and potential that BRTS could be creating for this area.
After 2013, this expeditious pace of development began to slow down and growth became relatively stagnant.
High developments became few and far apart, which is evident as they are restricted only to the edges with no further construction happening in the interior areas of Ghodasar.
TOD or transit-oriented development has been part of the jargon often used in planning circles, both internationally and in the Indian context. We often see planners promoting this urban planning technique as the most effective solution to address the challenges of urbanization that our cities face today.
It relies on the concept of planning livable communities with high-density mixed land-use within walking distance of mass transit. But is it really a story of success everywhere?
This chapter gives an overview of the BRTS model implemented in Ahmedabad and the intended outcomes of this policy. It then looks into the details of how this has manifested on-the-ground through the study of connectivity, walkability and accessibility in Ghodasar.
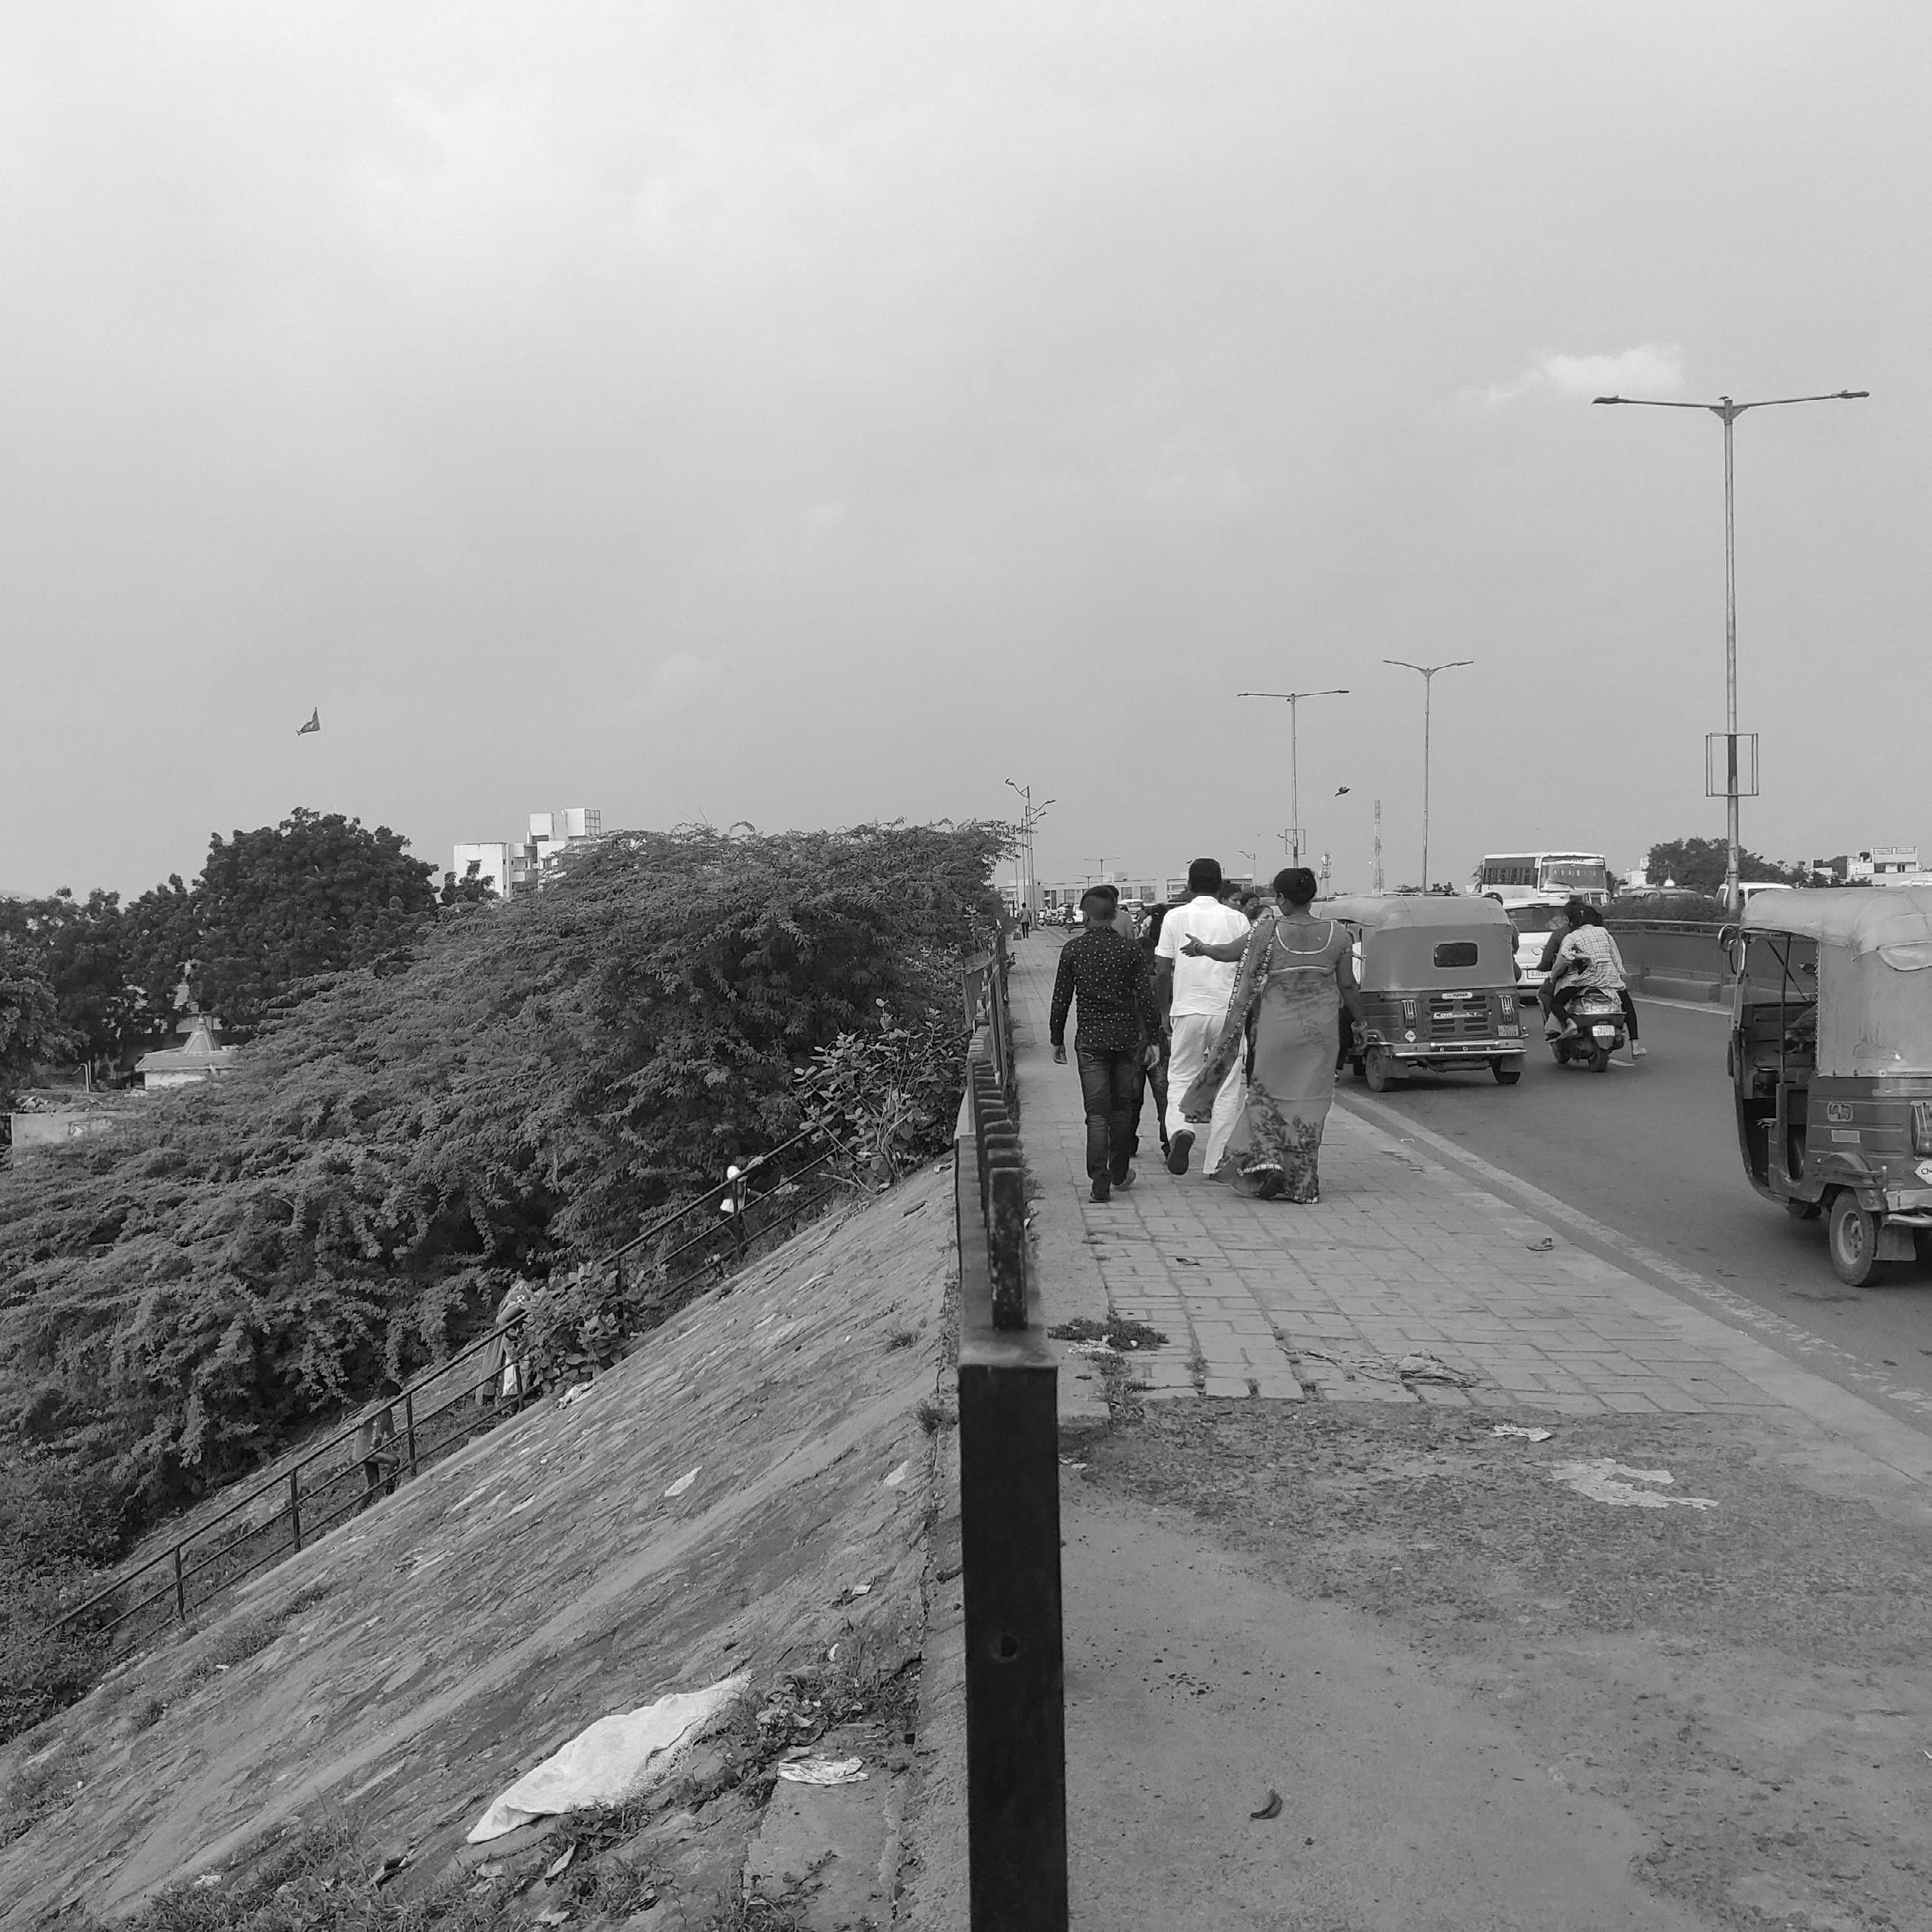
BRTS in Ahmedabad has been running for 13 years now but development around the transit corridor has not been much affected specifically by the BRTS.
In Ahmedabad, a 400m wide band around the BRTS network and proposed metro rail is termed as Transit-Oriented Zone (TOZ) and allowed higher FSI of 4 and the central business district in close proximity to the two networks is allowed a much higher FSI of 5.4.
Around 96% of the station catchments have low intersection density or pedestrian - oriented street intersections per sq km, which reduces accessibility.
In the existing situation of Ghodasar where density is high, the permitted FSI is not being utilised. It is essential to address these issues as higher densities with inclusivity are one of the major factors indicating the success of TOD.
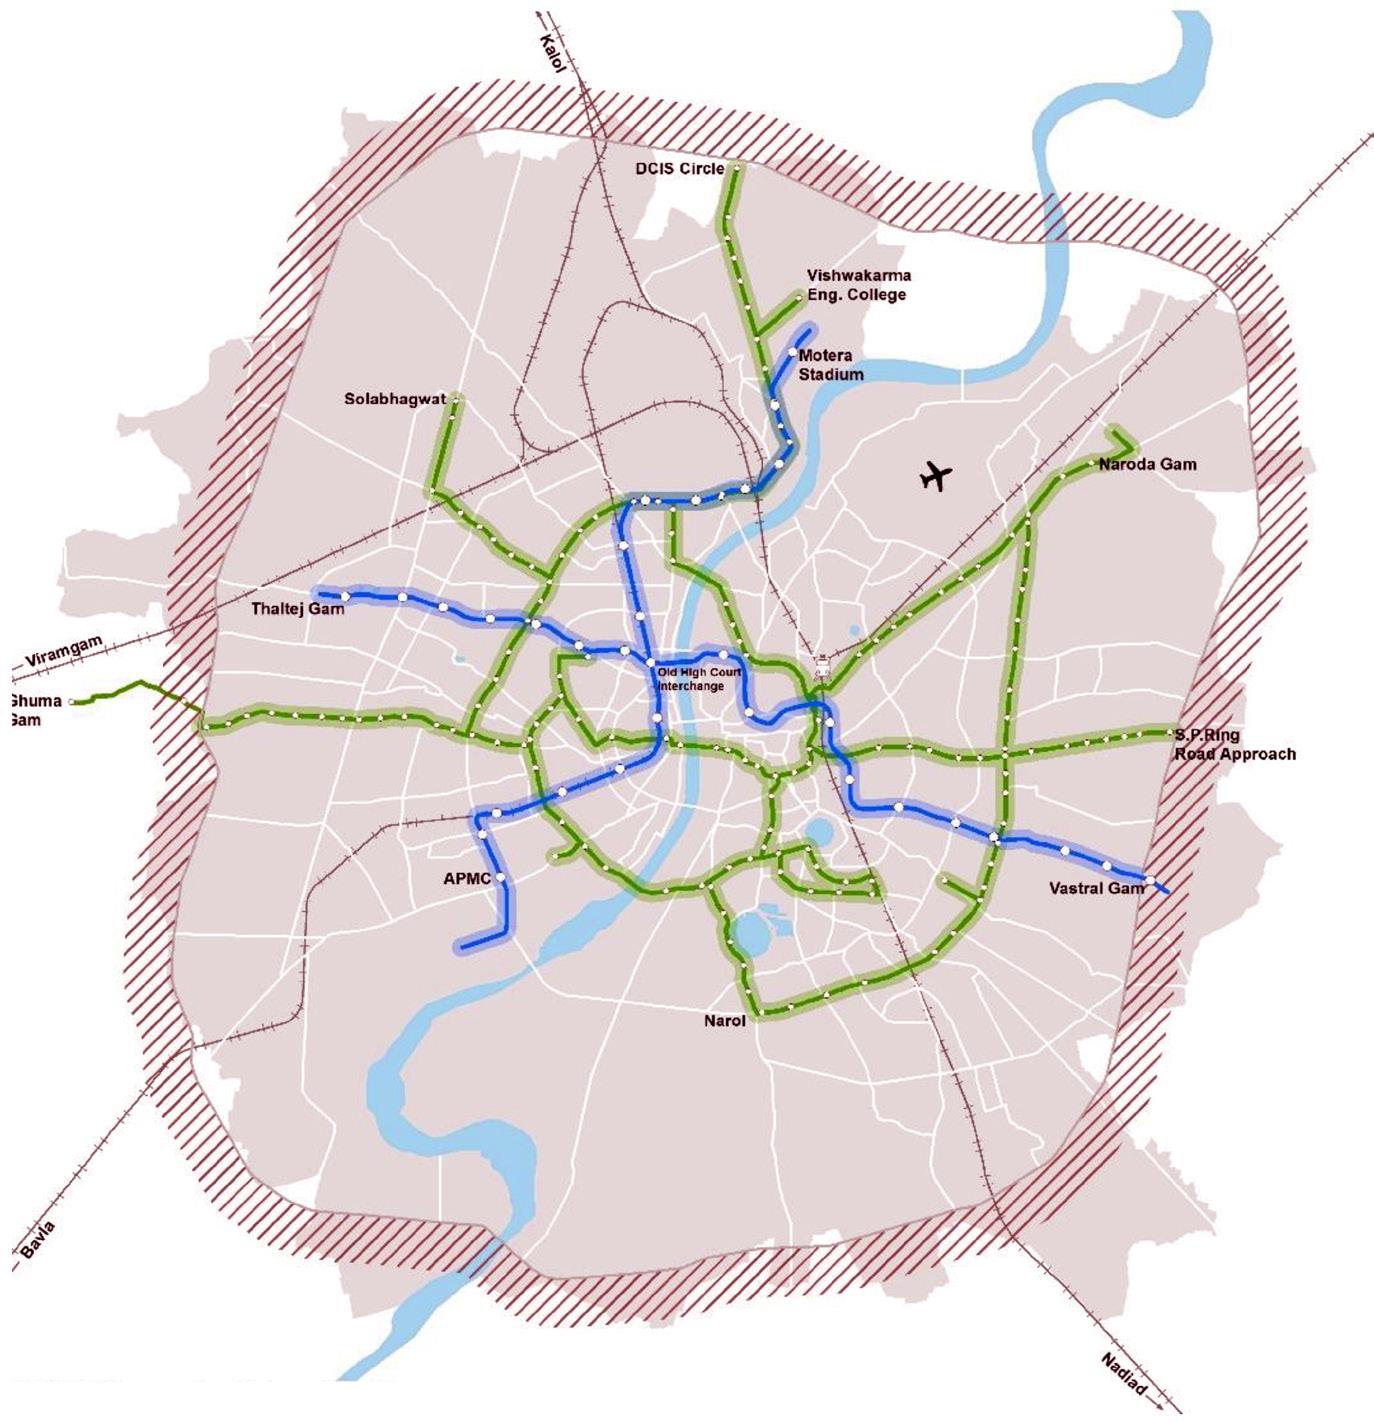
BRTS and MRT (proposed) network in Ahmedabad
Source:CenterforUrbanEquity,2017
Transit Oriented Development (TOD) is a planning and design strategy that promotes urban development that is compact, mixed-use, pedestrian- and bicycle-friendly, and closely integrated with mass transit. Proximity to mass transit improves access to TOD neighborhoods, boosting their attractiveness and increasing real estate value.

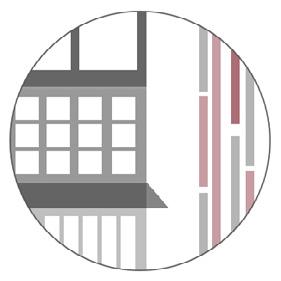
Developing neighborhoods that promote walking - High quality, unobstructed pedestrian footpaths that provide basic mobility for all
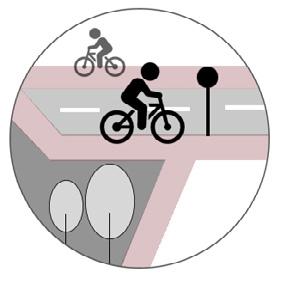
Prioritize non-motorized transport networks - Design that ensures safety of cyclists with complete network of infrastructure
Locate development near highquality public transport - Frequent, fast and reliable high-capacity rapid transit that reduces dependence on private vehicles
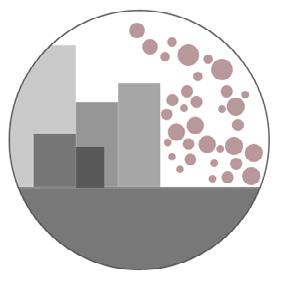
Optimize density and transit capacity - Intensification of multiple uses that helps ensure access to public transit
Plan for mixed use - Balanced mixe of complementary uses and activites that ensure shorter daily commutes.
Create regions with short commutes - Various uses and activites located close together to minimise time and energy while maximising potential for interaction

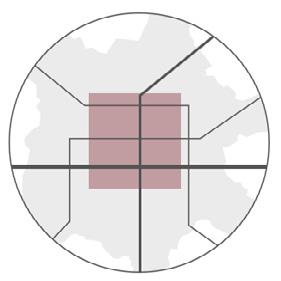
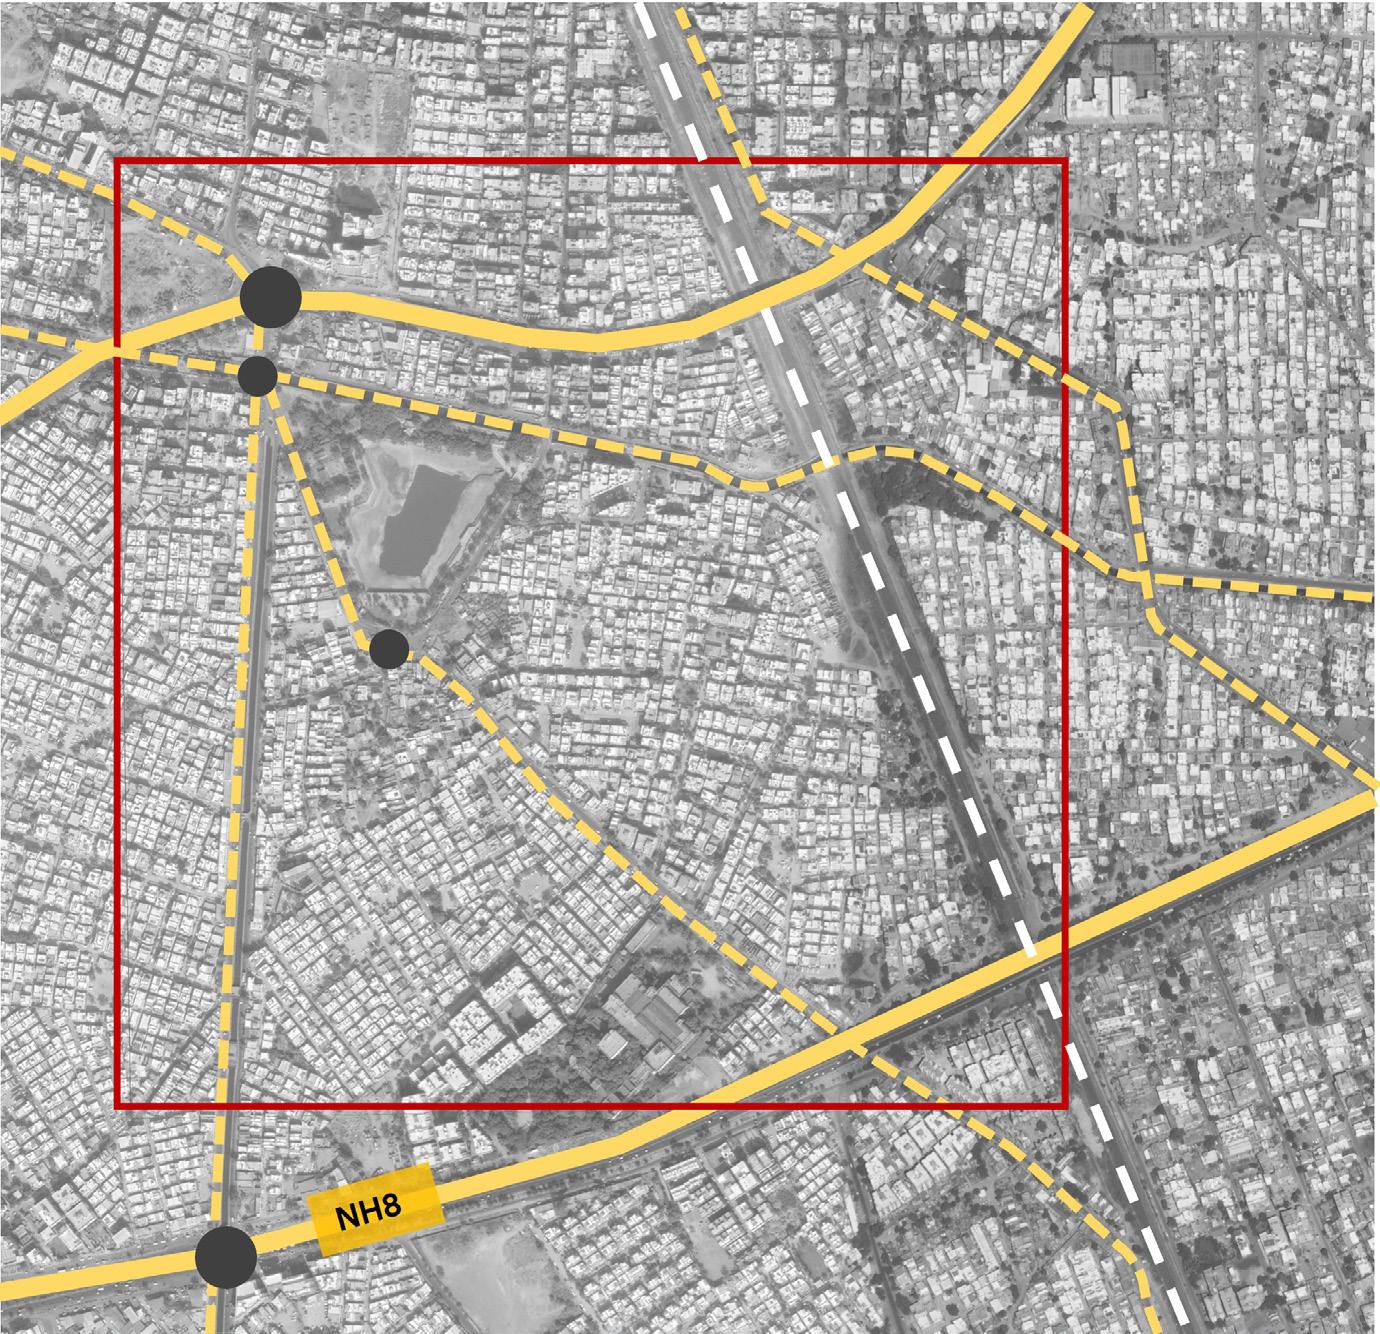
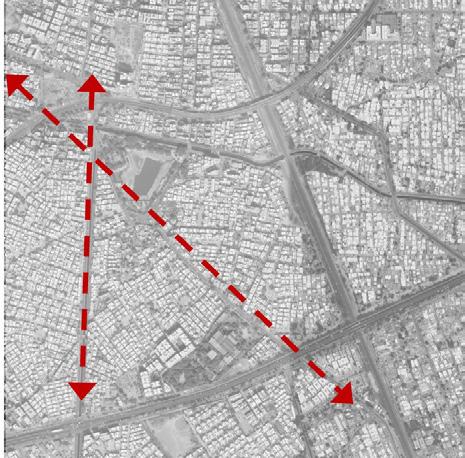
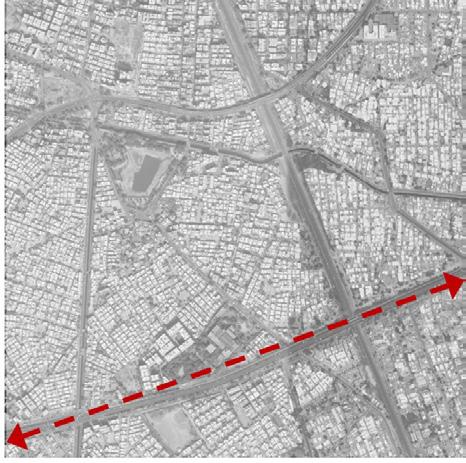
The precinct is situated between the 132ft ring road to the north and the NH8 to the south. It is flanked by the Canal road to the left and Maninagar railway line to the right. These transit corridors form strong edges around the area and contribute to the physical and social character of the region.
At the city level, the precinct is well connected and the city traffic passes through the precinct, especially the traffic flow from the industrial estate area towards Maninagar and other residential areas.
Each of the transit edges have varying but significant impacts on the walkability and perception of streets in the precinct.
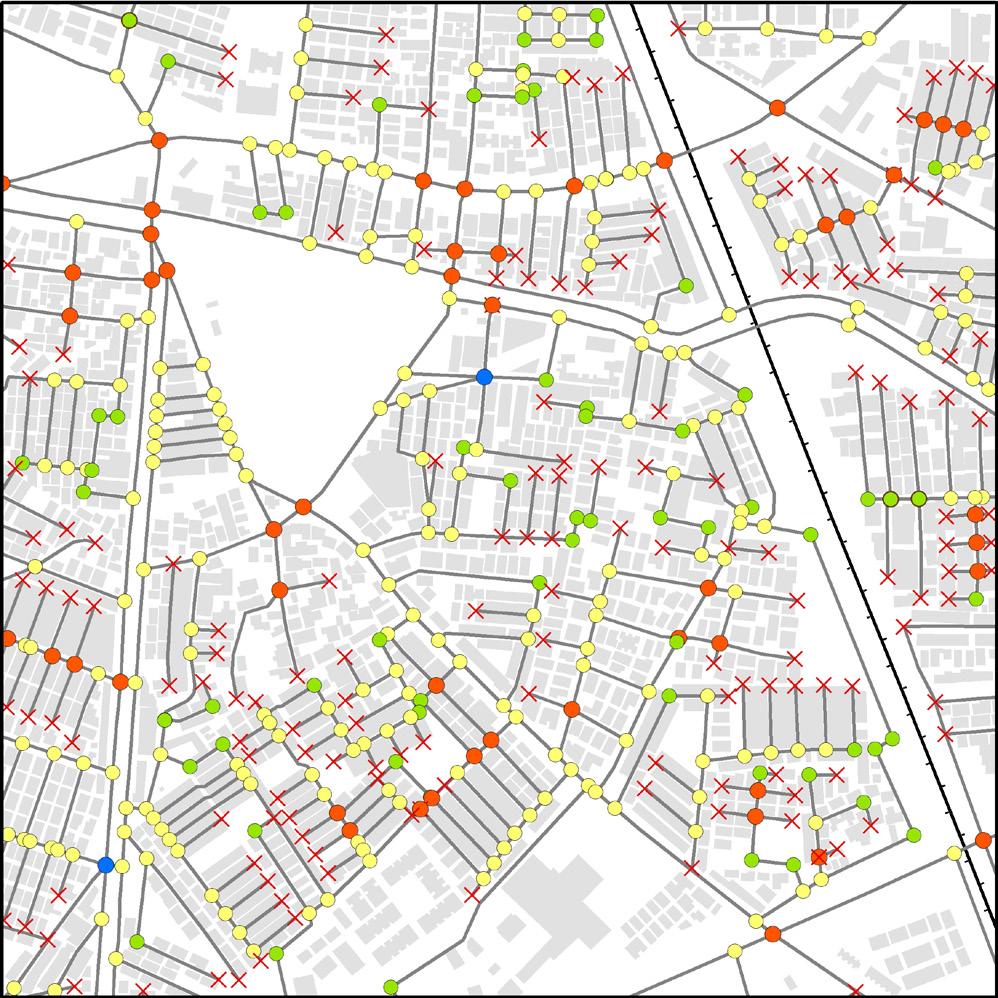
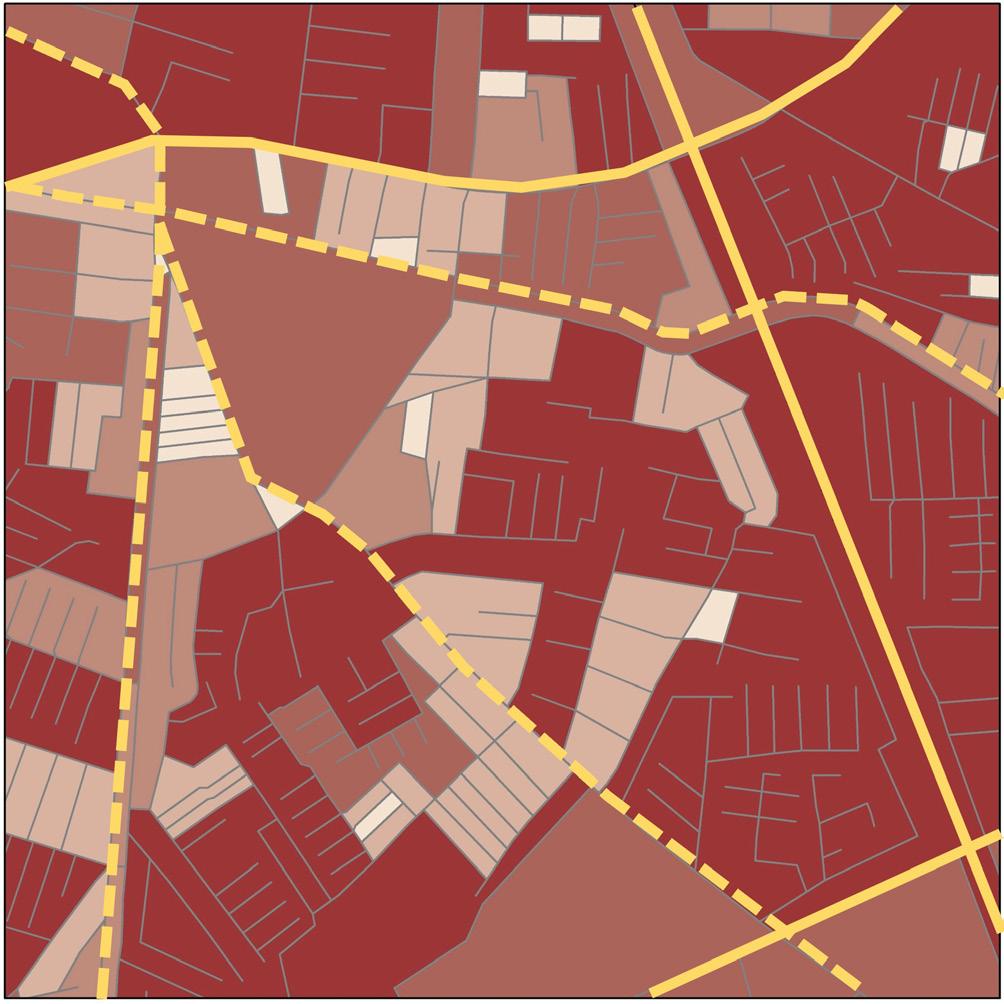
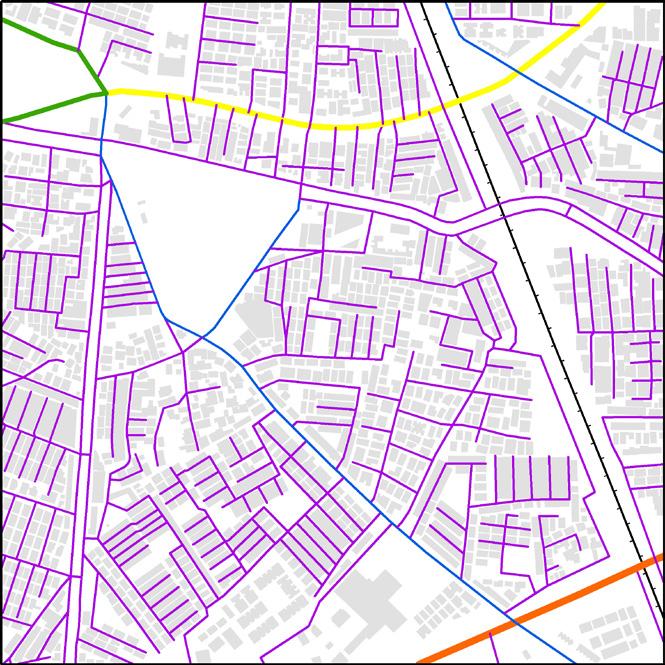
While the precinct is well connected at the city level, there is poor connectivity within the precinct.
On average, the block perimeters of Ghodasar are on the higher end which reduce the walkability and accessibility for pedestrians. A high street density of 30.2km/km2 would generally imply better connectivity. However, the higher number of dead - ends add to the density without doing much for connectivity of the area. Larger number of linklengths with dead ends indicates longer travel distances and hence the increased dependency on private vehicles.
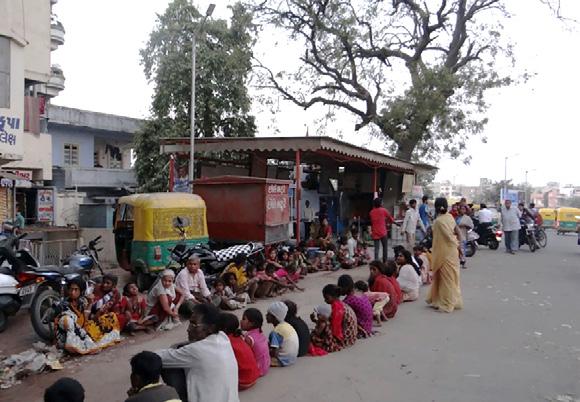
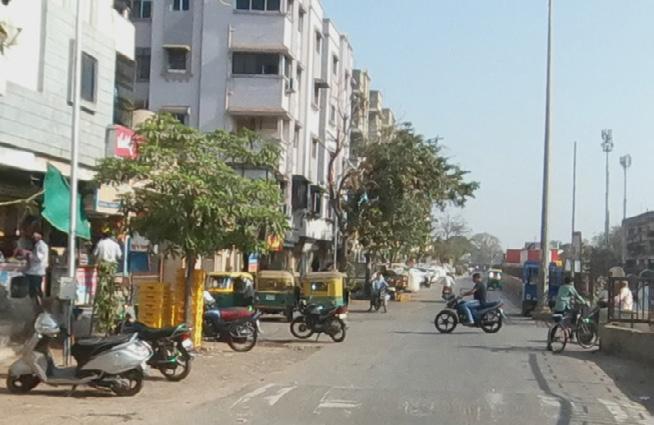
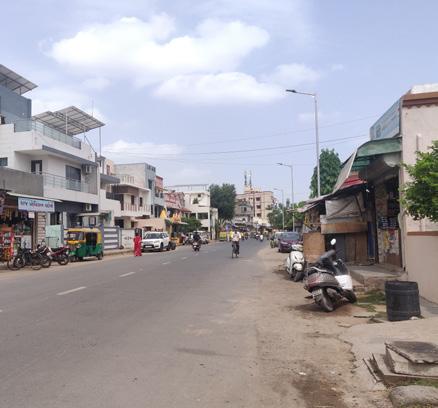
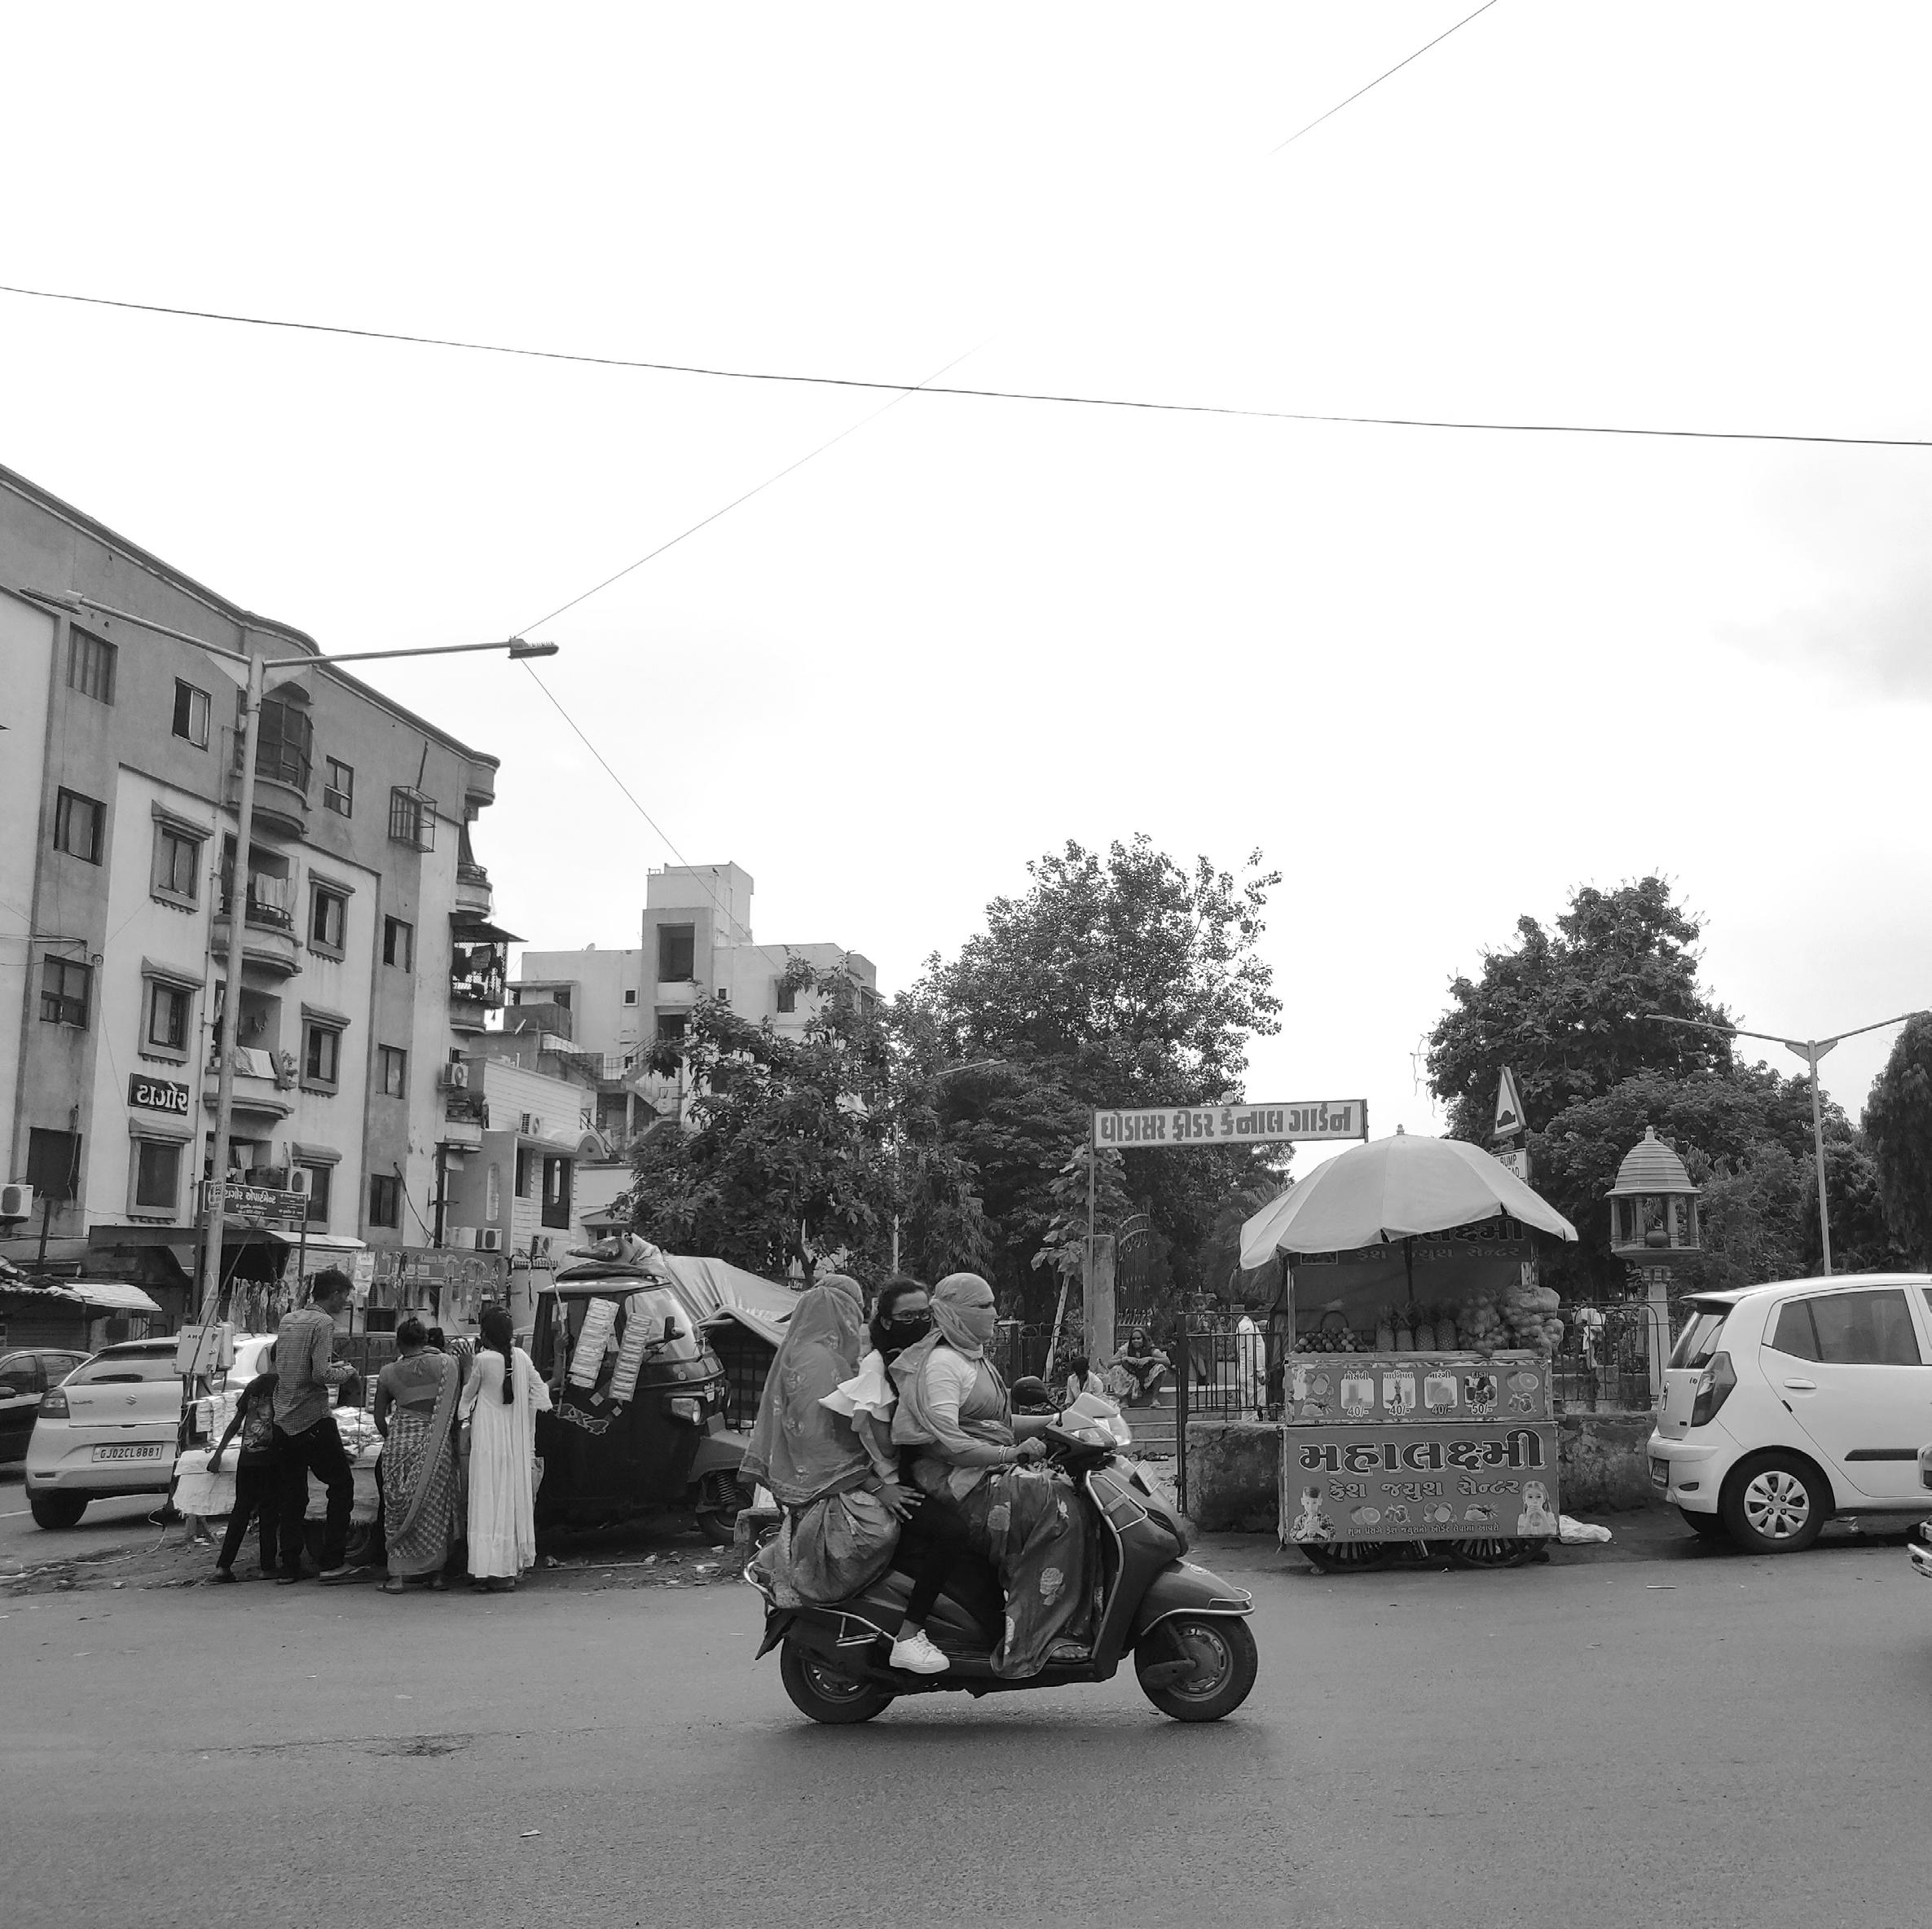
Cadila road and Canal road show a mixture of uses along a street that can create an interactive street edge. In addition to this, the adjoining built forms with their terraces, doors and windows overlooking the street, provide a spatial experience and a sense of safety.
With shops, commercial outlets, schools, banks and a number of other serviceoriented stores, Cadila road is a vibrant mixed-use street that connects two major thoroughfares. This is in stark contrast to the street along the NH8.
Block sizes are relatively small and more accessible
Transparent and active street edge – continuous line of building fronts –making it accessible and walkable
Sub-arterial roads with moderate traffic flow. But, on-road parking provides a buffer to pedestrians
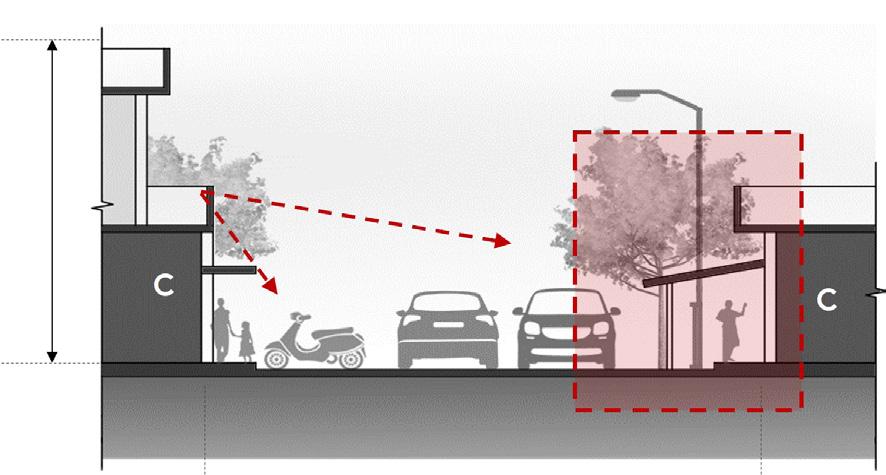

Overlooking built forms give a sense of enclosure and hence a sense of safety

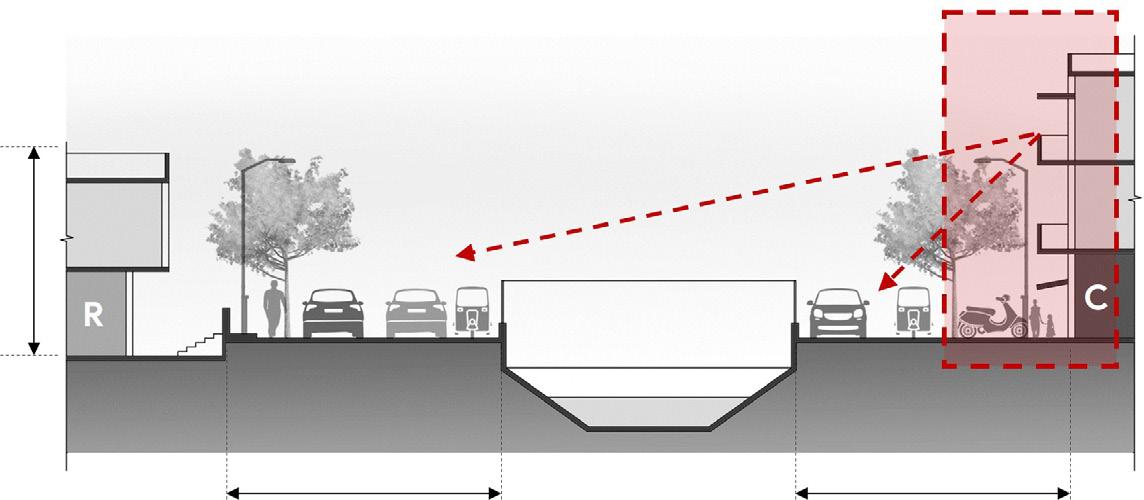
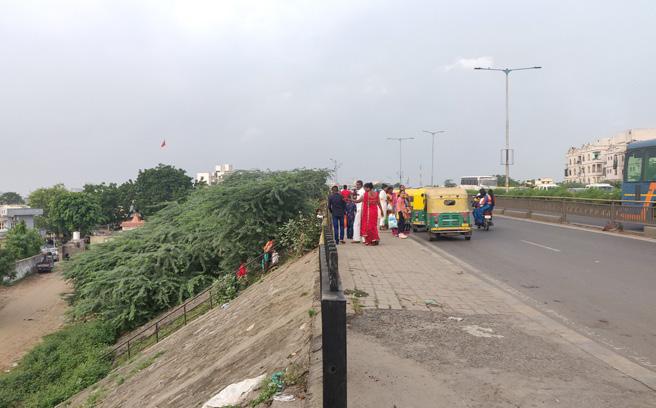
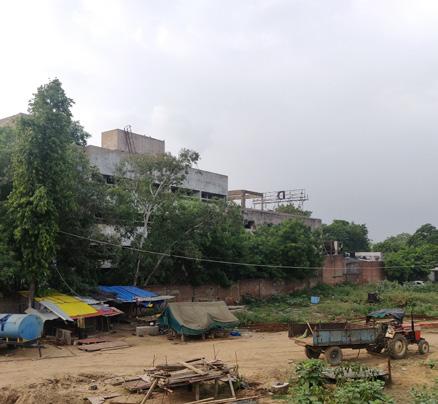
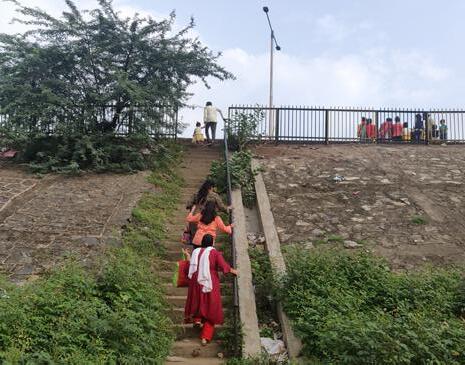
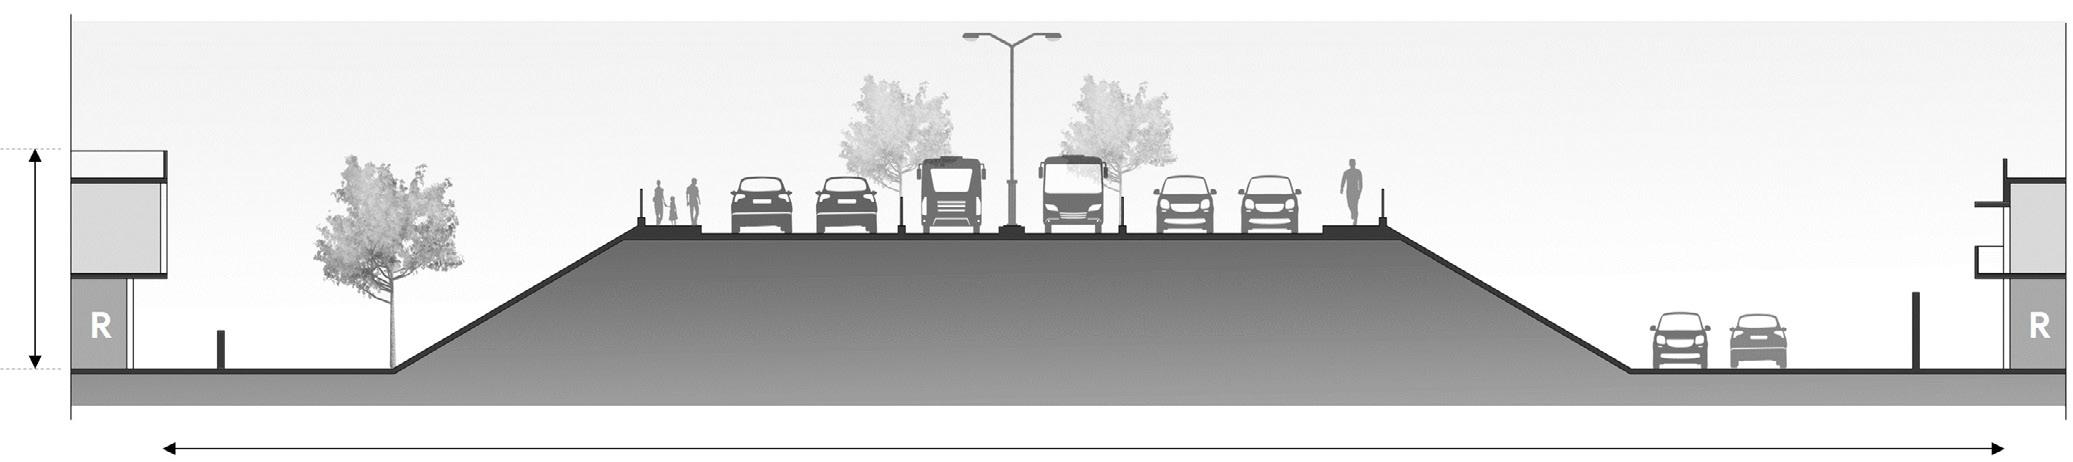
By virtue of the topography in this stretch, the highway is elevated with filled earth below, which results in a lack of adequate street frontage for these plots.
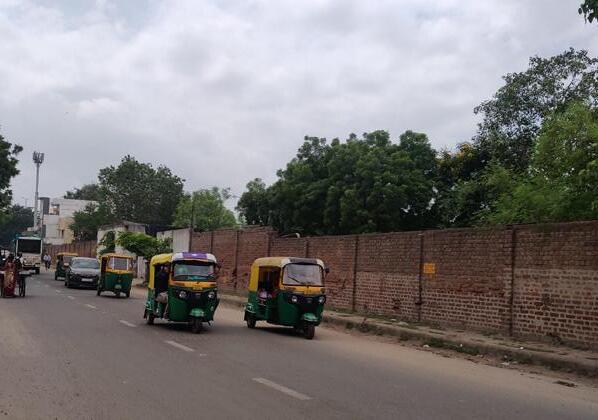
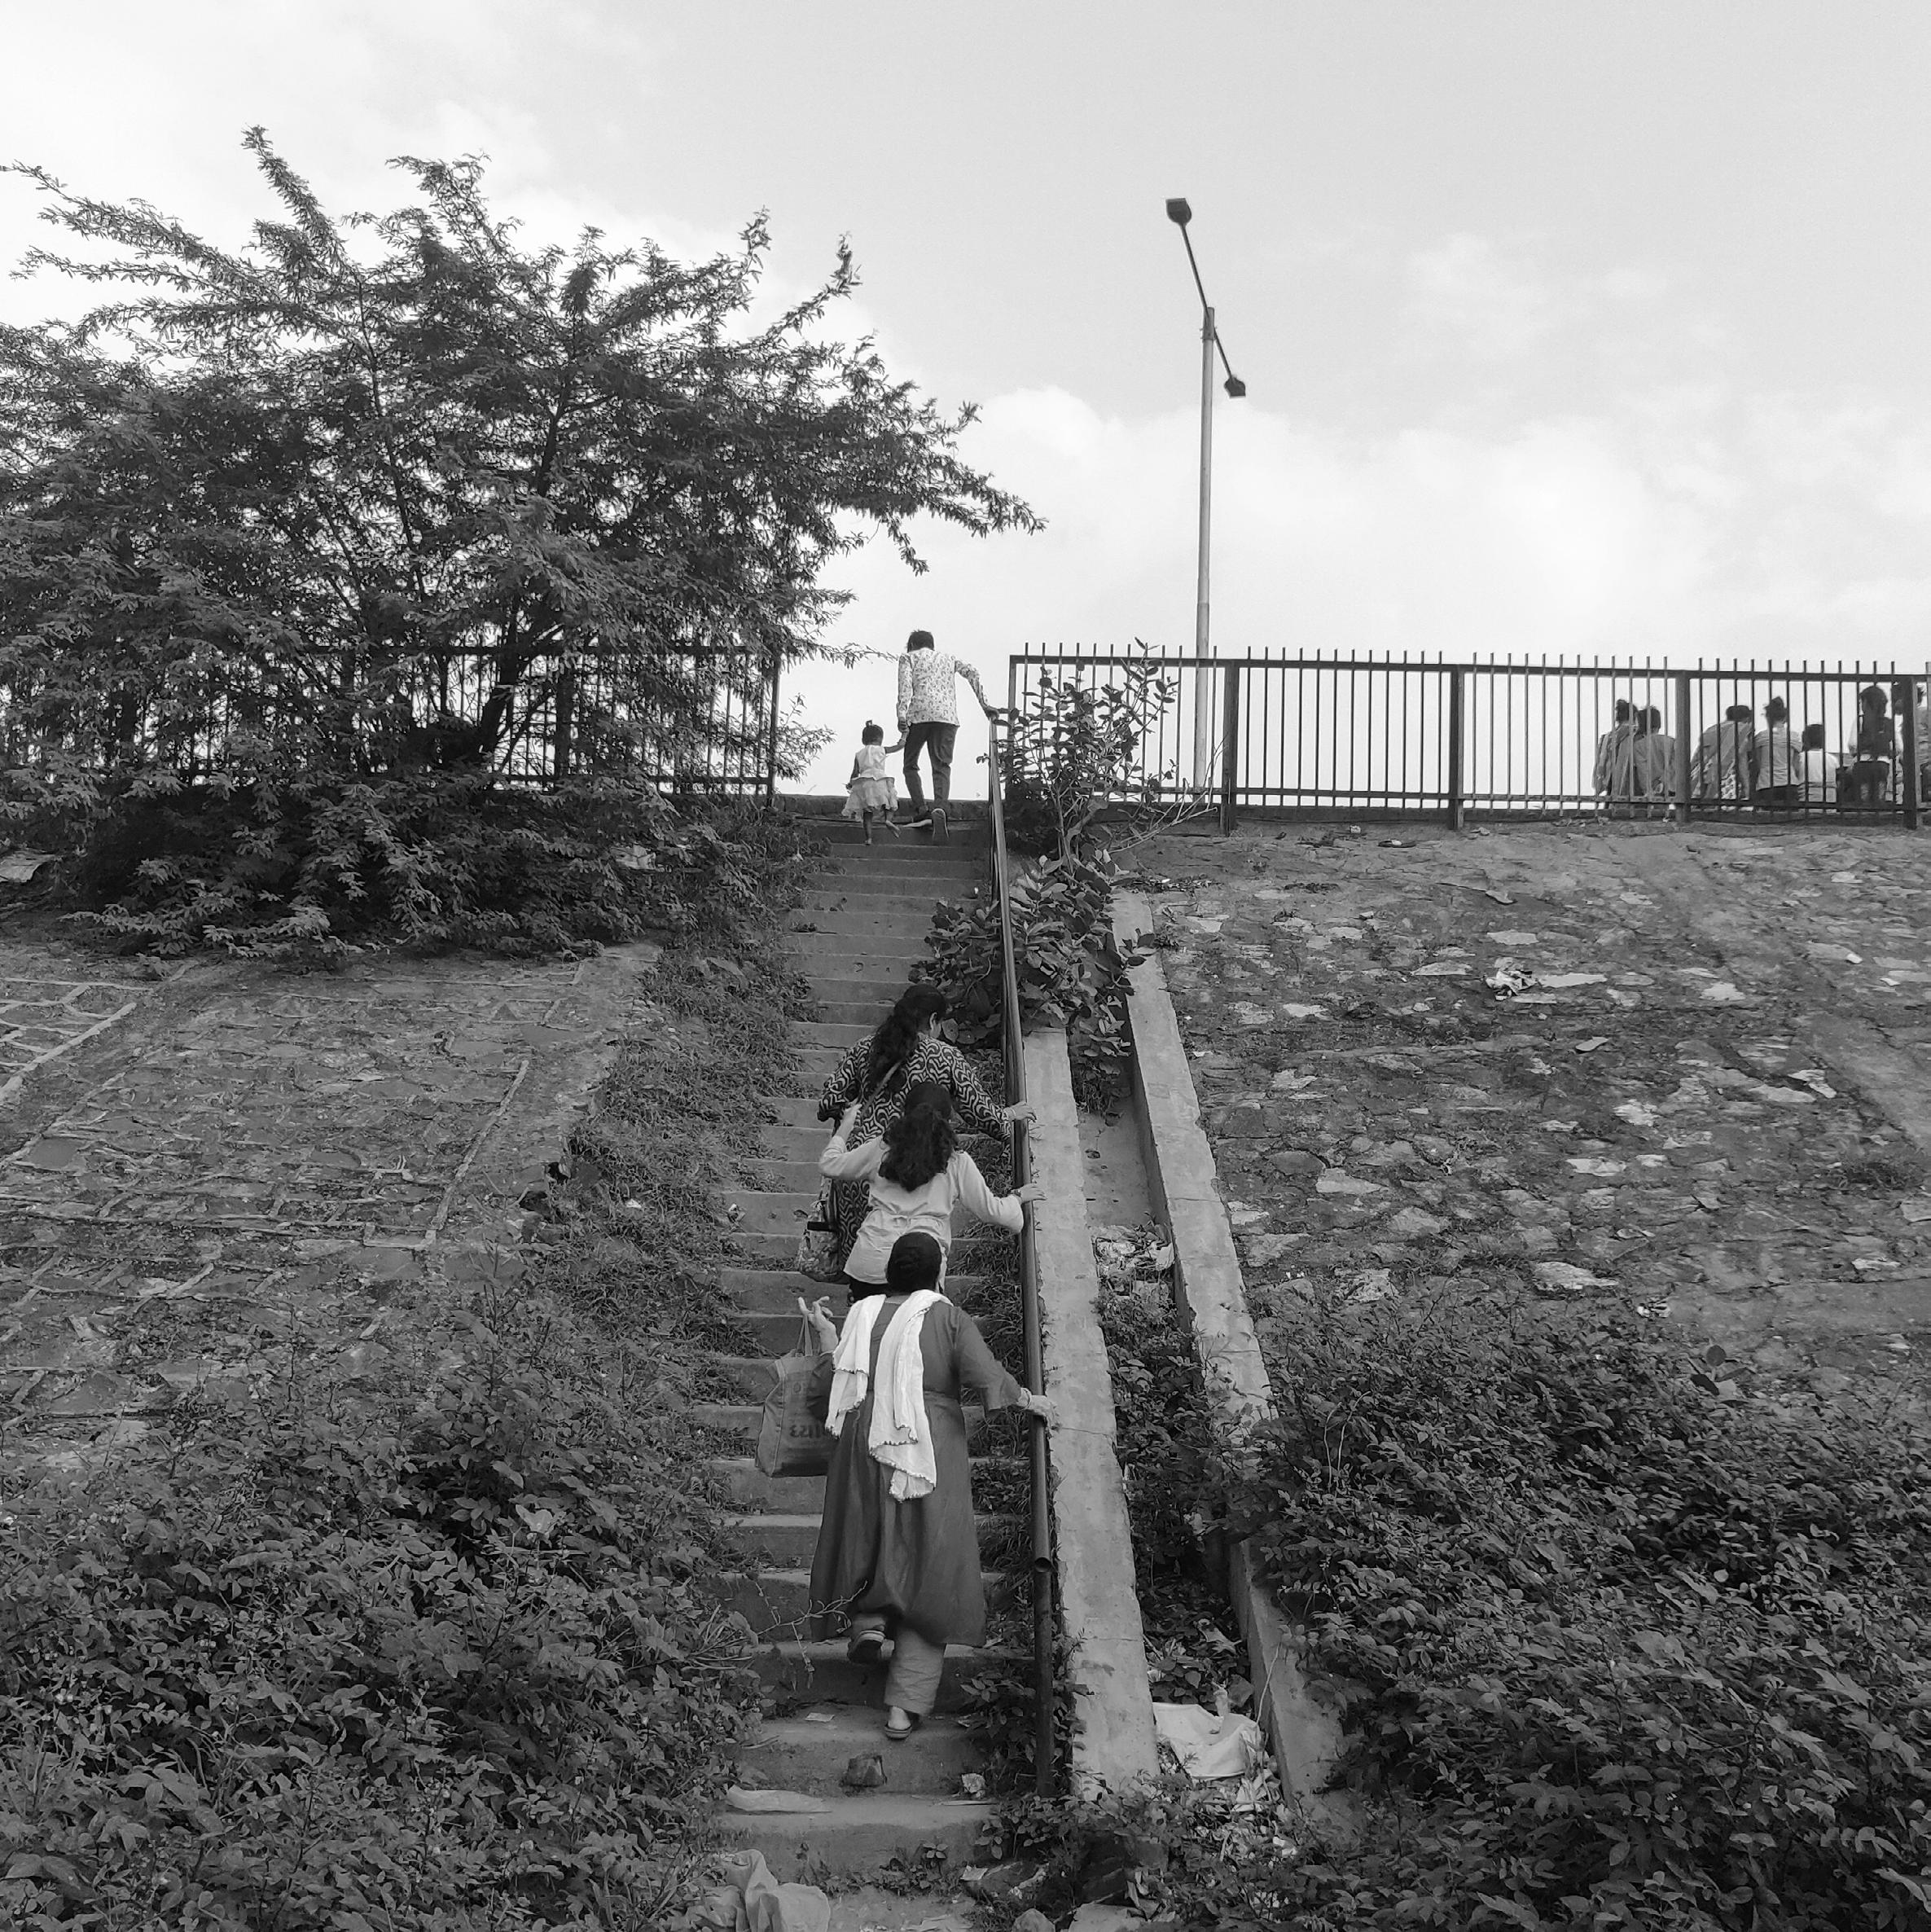
Most of the built form along this street is formed by dead boundary walls or the back of residences. Compounding this effect is the sloped elevated edge of the highway creates a sense of visual disconnect. In addition to this, the vegetation cover along the sloped edge also creates a barrier and breaks the line of sight, making the area feel unsafe.
Block sizes are larger, making it difficult to walk along the block perimeter
Not much sense of enclosure due to lack of overlooking built forms or a permeable edge
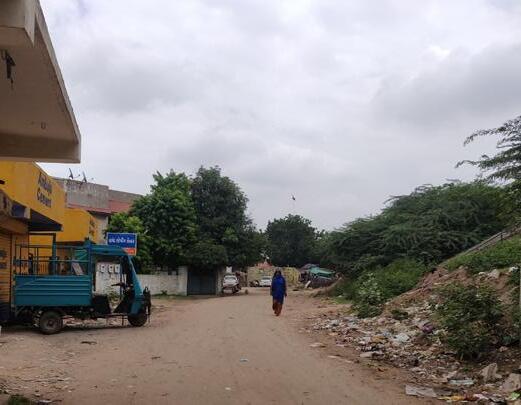
No active frontage – dead vertical planes - back of residential areas / dead boundary walls
No visual connectivity – the vegetation cover along the sloped edge also breaks the views - lack of sense of safety
Isolated and deserted streets – very limited usage by people
No metalled road, hence, not a thoroughfare. Despite lack of traffic, the street doesn’t feel safer
The neighbourhood of Ghodasar has seen periods of both sudden and stagnant developments in the last two decades (2000 - present). Several determinants, ranging from ecological, physical, infrastructural to policy decisions, have impacted the development process over the years. The implementation of BRTS along the NH8 facilitated the growing demand for more residential and commercial developments, albeit for a short period of time. The area has, since then, been in a phase of stagnation.
This chapter explores the various factors that have been affecting the pace of development in a settlement like Ghodasar - analysing the market forces, land demand, densities and developmental controls, each impacting the growth in varying degrees.
Rates
Plot wise FSI Consumed

12,18,000m2
Permissible Built - Up Area
High Land Value Abutting Arterial Road Road width
High land value Abutting arterial road Road width > 18m
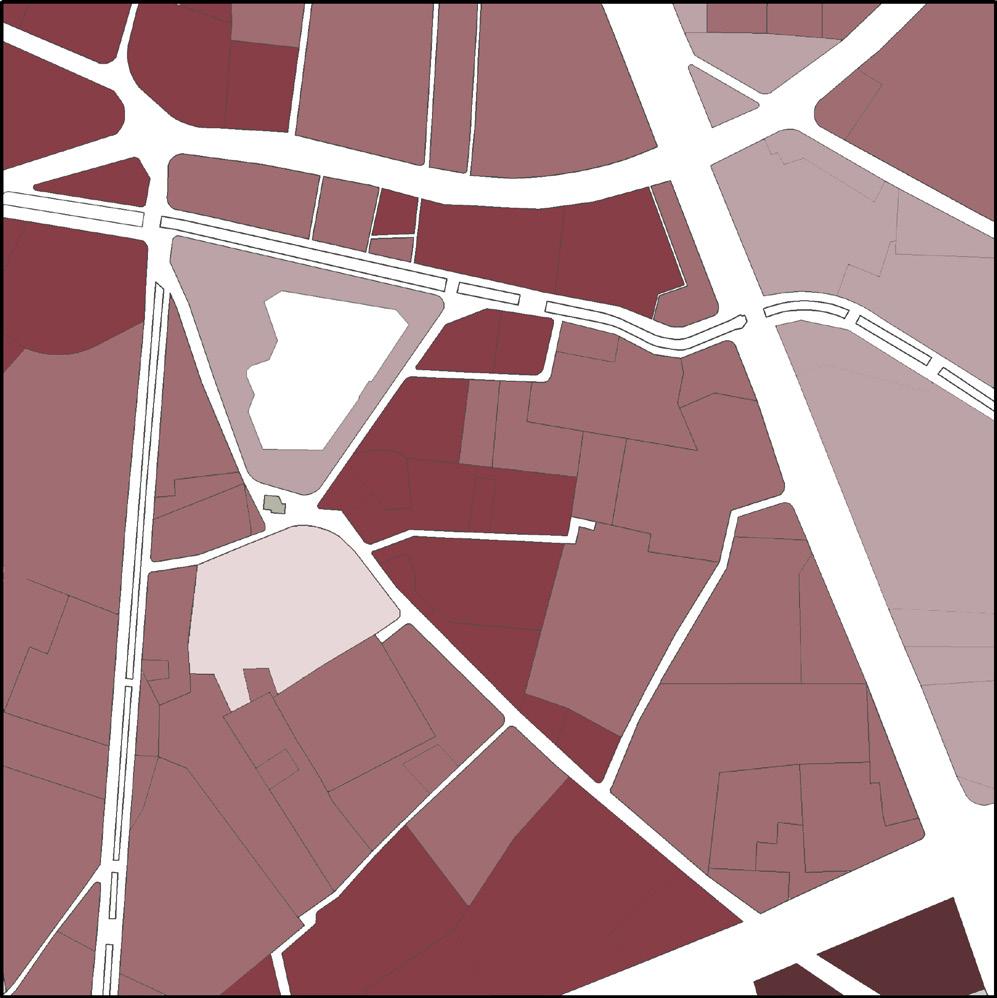
Prices are higher along the arterial roads than in the middle of the precinct. This is also an implication of the road width and the associated developmental controls.
7,75,000m2
Unutilised Built - Up Area
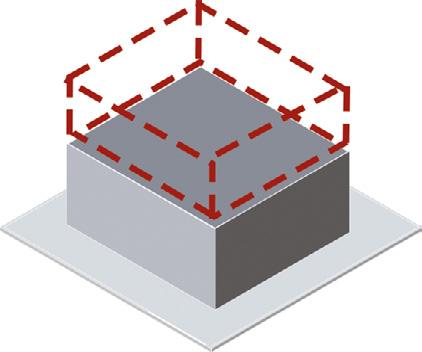
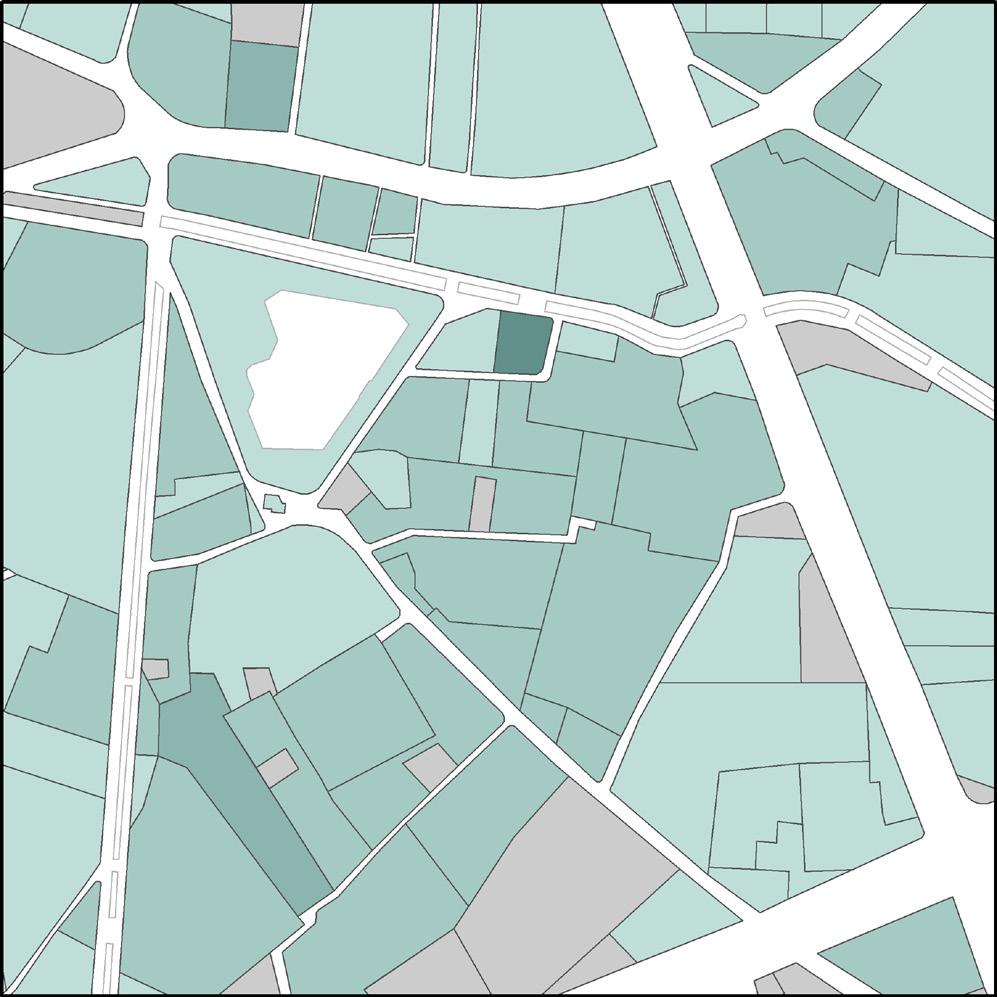
Ghodasar currently has a net consumed FSI of 1.5, which is not even utilizing the earlier sanctioned FSI of 1.8. The existing regulations from GDCR restrict the consumption of this FSI.
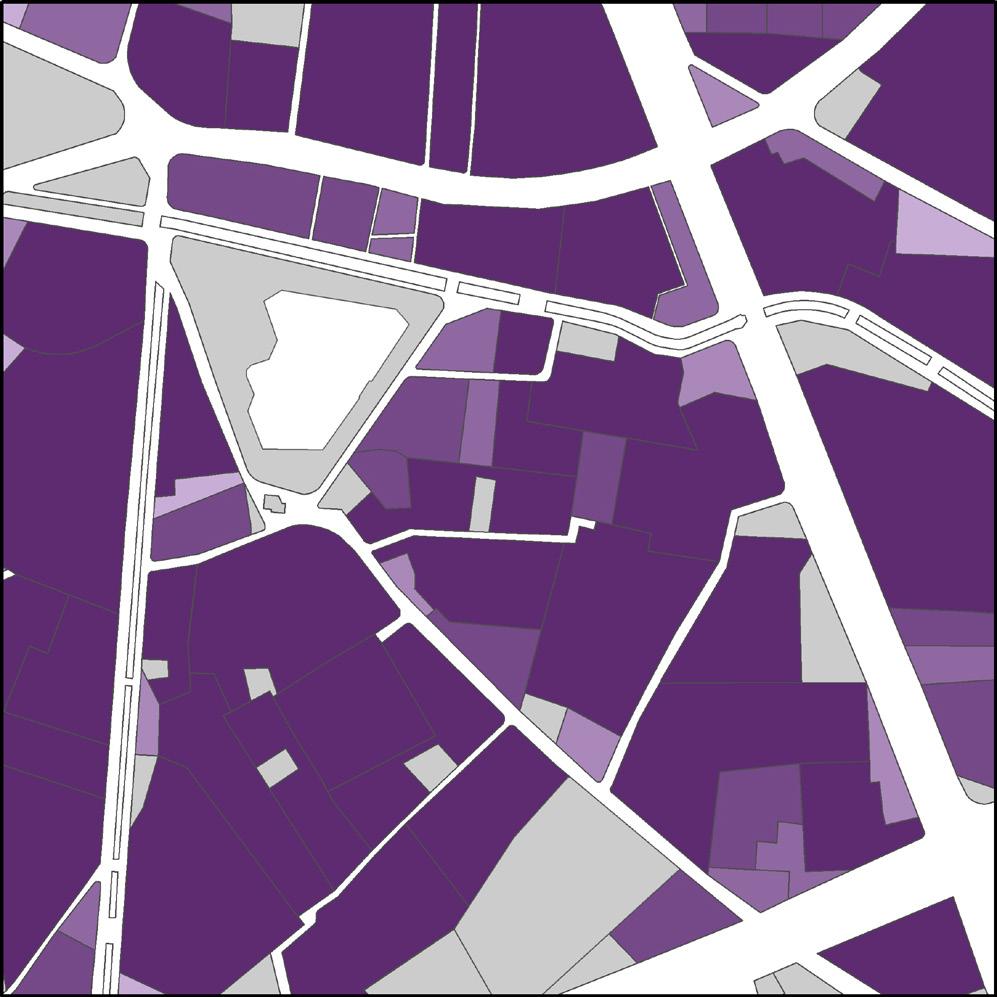
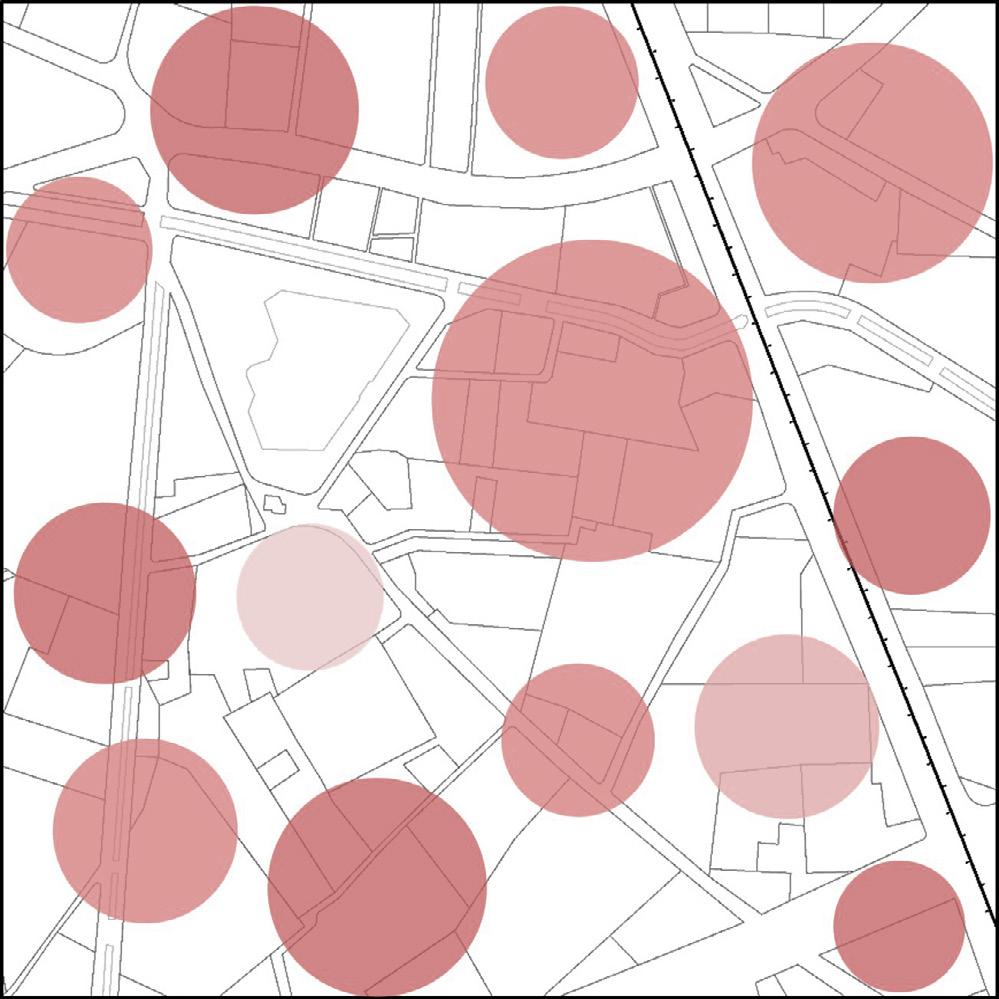
Plot wise Population Density

46 m2
Per Capita Land Consumption
218
Precinct PPH (People per hectare)
120
Ahmedabad (AMC) PPH (People per hectare)
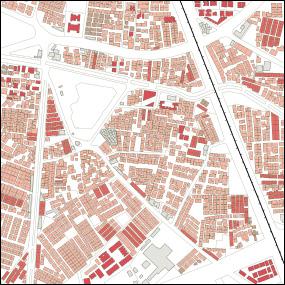
Residential Typology Distribution
4598
Total Dwelling Units
4.3
Average HH Size
The population density is connected to the land consumption. The per capita consumption of land is approximately 46 sqm which in turn implies that the per capita share of open spaces is a meagre 3.2 sqm as opposed to the recommended 12 sqm per capita (as per UDPFI guidelines). This is another indicator of the high density of the precinct.
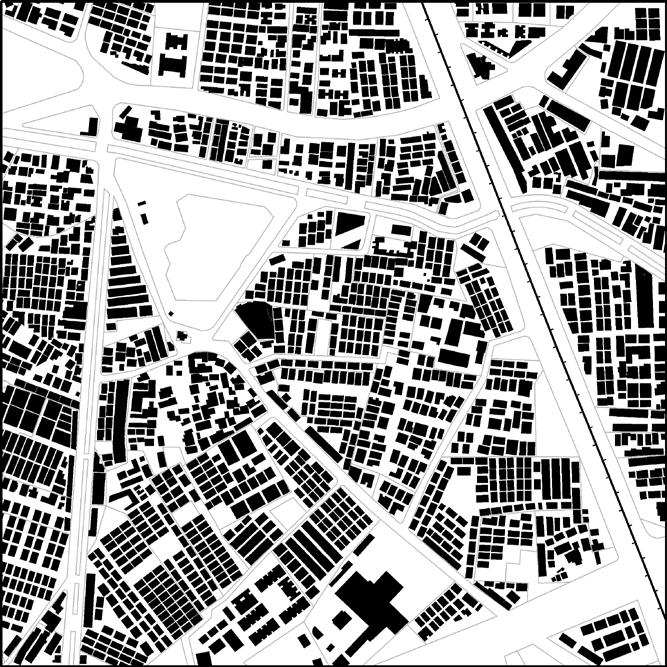
36.5% 1.8% 7.0% 18.5% Setbacks Vacant Open Space Transport
Low - Rise and High - Density Settlement
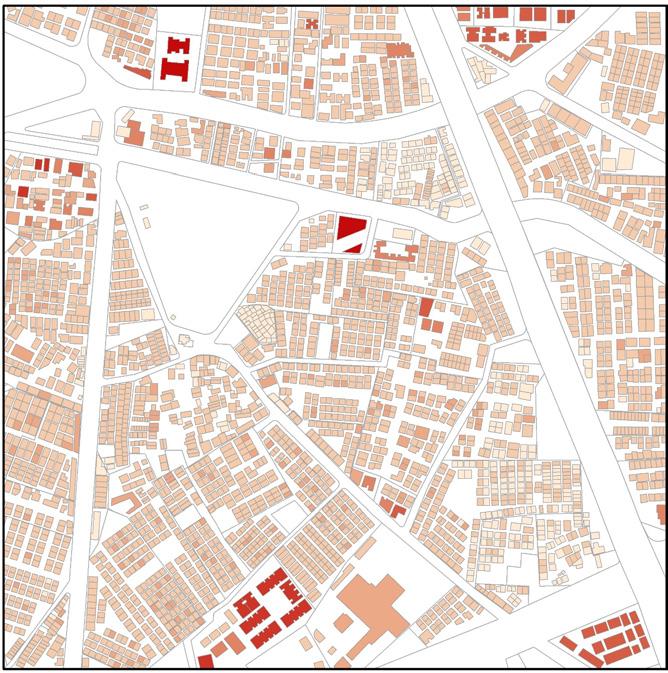
36.5% of the unbuilt space is within setbacks which implies that most of this unbuilt space is not experienced by everyone and limited to just the plot occupants. In addition, 83% of the streets have an ROW less than 9m, pointing towards the low-rise and high-density character of the precinct.
Constraints of Existing Regulations If maximum FSI 4.0 is to achieved, buildings must go higher. But as height increases, setbacks also increase. This would imply reduced footprint area or underutilization of FSI.
To achieve necessary height, smaller plots will have to be amalgamated which is a tedious and timeconsuming process.



Urban Land Ceiling & Regulation Act, 1976
Enacted to prevent concentration of land holding in urban areas in the hands of a few builders and few governmental agencies by placing upper limits on the land that could be held. The acquired surplus land is redistributed amongst the landless people. But it was repealed in 1999. However, it created certain complications that now affect the pace of further development.
A lot of residential structures had already been constructed on these excess vacant lands, before March 1999 (when the Act was repealed).


In 2016, the government passed ordinance to regularize all residential properties on ULC land. This reduces the quantum of land available to developers.
Of the land available for development, the smaller plots of land need to be combined to make larger blocks of land to enable high density, high FSI development. This is a tedious process of approvals and plot amalgamation, usually discouraging the developers.
Parking policy is an important determinant of travel behavior, regardless of proximity to transit. Car parking ratios for residents, shoppers and commuters remain generous, and private car use continues at former levels, will struggle to develop the sense of place and community to which genuine TOD aspires.
Ghodasar is a majorly residential area with semidetached housing being the prodimant typology. People of this neighborhood are increasingly dependent on two - wheelers for their daily commute and demonstrate low ridership for the BRTS.
This chapter explores the housing and transport choices that people make as a consequence of their incomes and how the idea of affordability differs among all income groups.
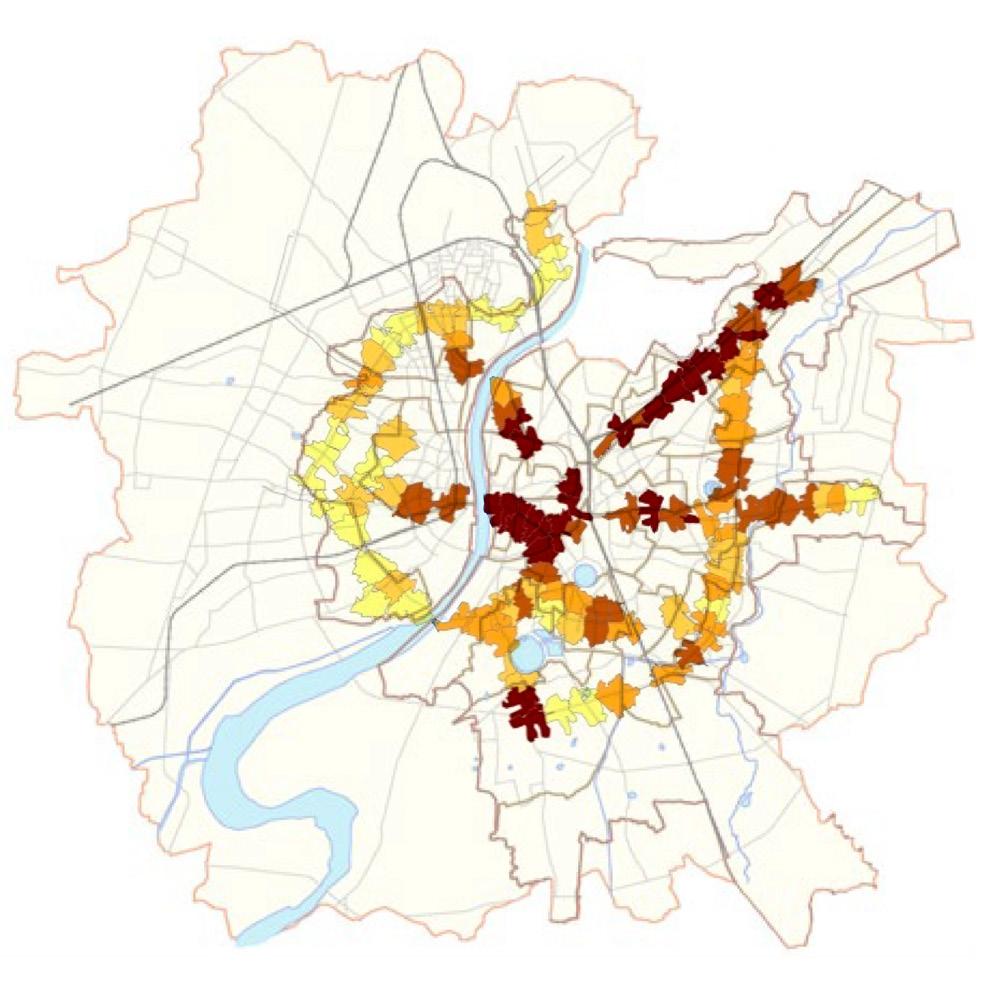
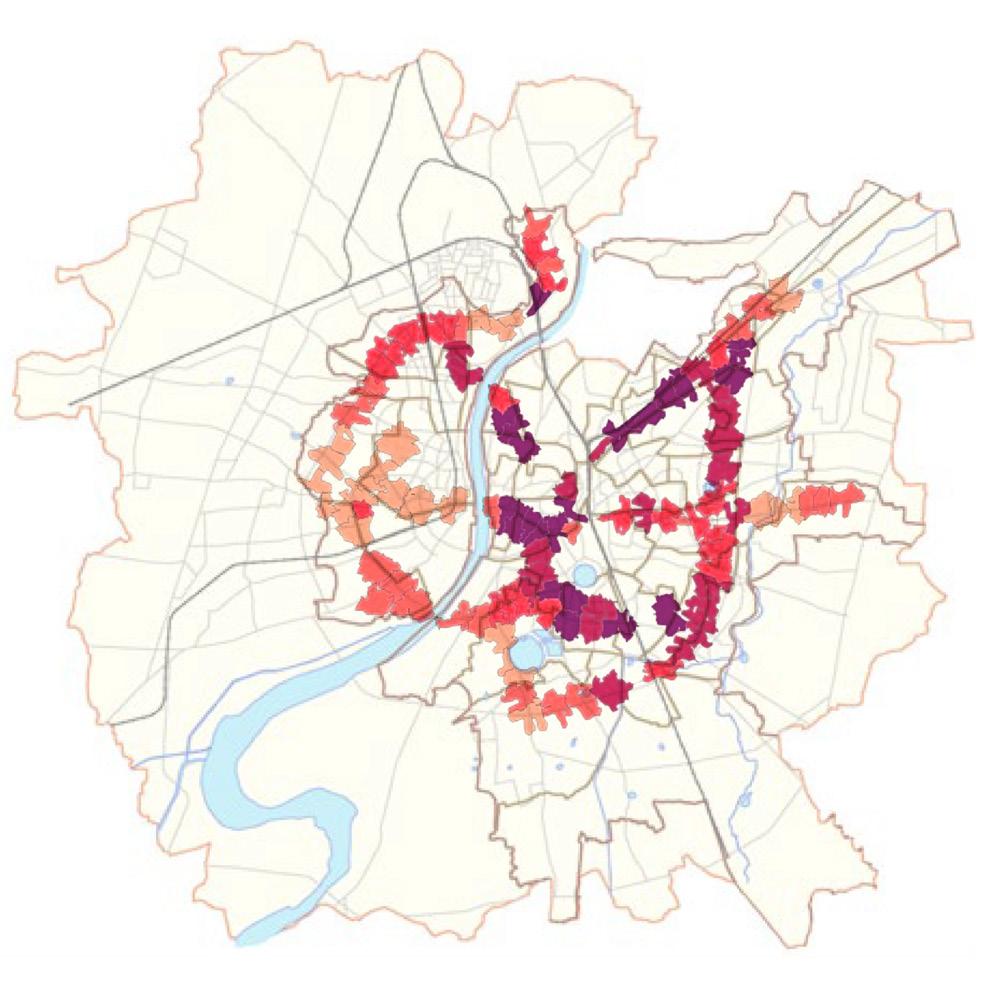
Job Density (per acre) of BRTS Station Catchments
Source:UrbanScience,2018
Monocentric Model
BRTS station
Composite Model
Before TOD, Ghodasar developed as a residential neighborhood for people working in GIDC Vatva estate. Their trip patterns were radial and converged at Vatva, the monocentric job centre.
After TOD, in addition to the industrial estates, jobs also began to be dispersed as part of the residential areas around, creating a composite model of jobs.
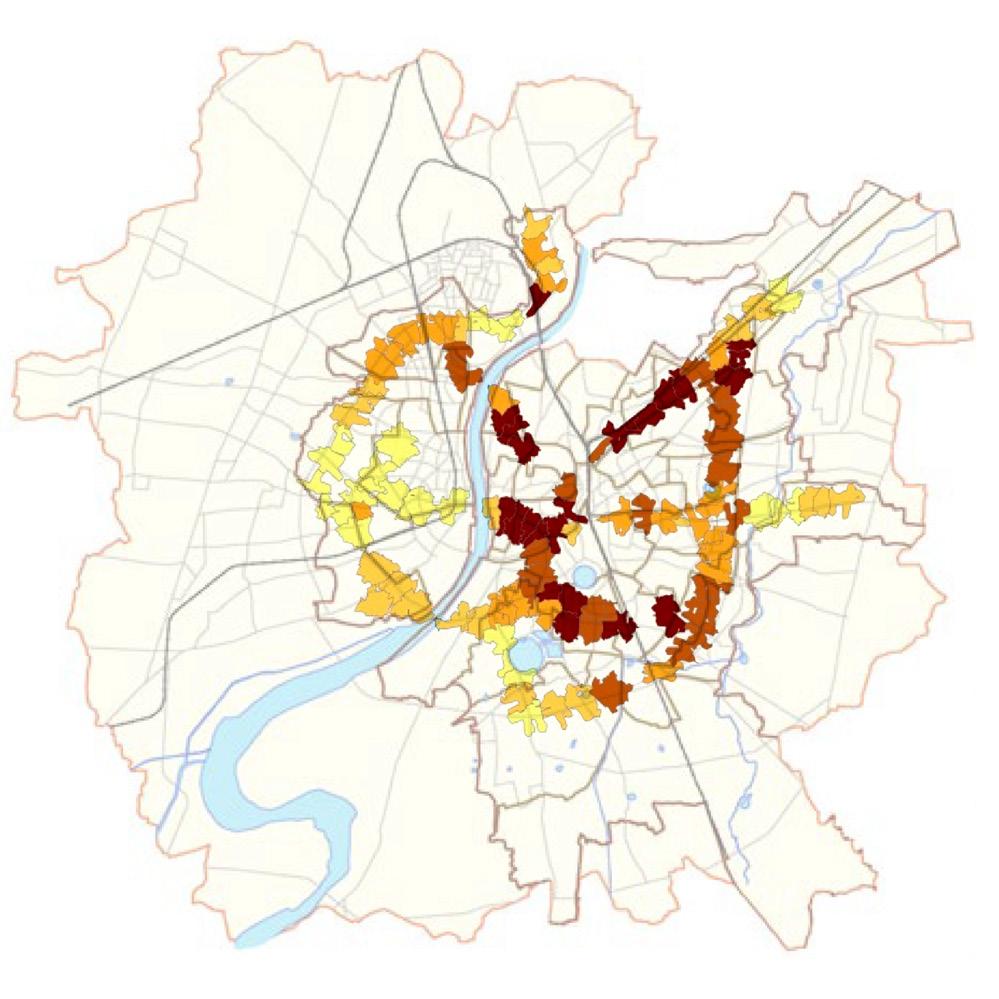
Population Density (per acre) of BRTS Station Catchments
Source:UrbanScience,2018
80% of the station catchments have a job density of less than 62 per acre while the other 20% are located predominantly in the eastern part with job densities up to 299 per acre, indicating greater job accessibility.
The population density (per acre) is higher in the eastern part of the city as compared to the western part. The locations in East Ahmedabad with the highest job accessibility also have the highest population density, indicating that most people live close to their jobs.
0.3-0.5
Prices across the Precinct
BRTS has shown impact only in certain pockets of the precinct and only under certain conditions. This has led to unequal increase in land values and property prices (as per personal accounts and property price map), thus affecting affordability.

Typology Distribution
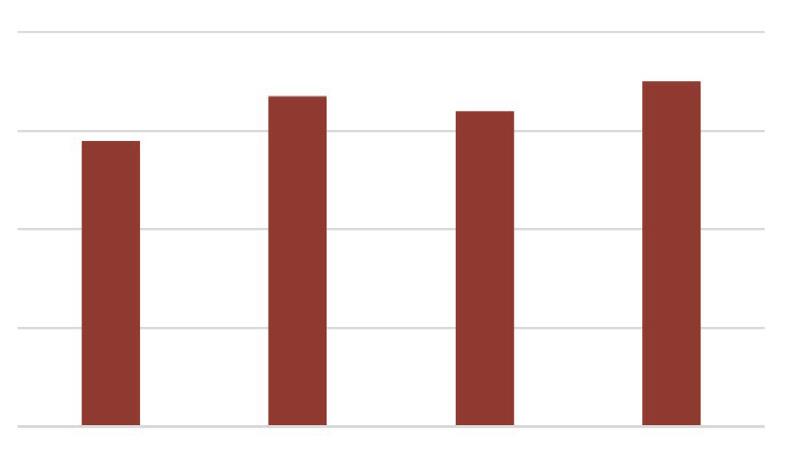
Housing typology has shifted from predominantly row houses with a few semi-detached to predominantly semi-detached and apartments. It is an indication of the MIG to HIG income group demography in the precinct.
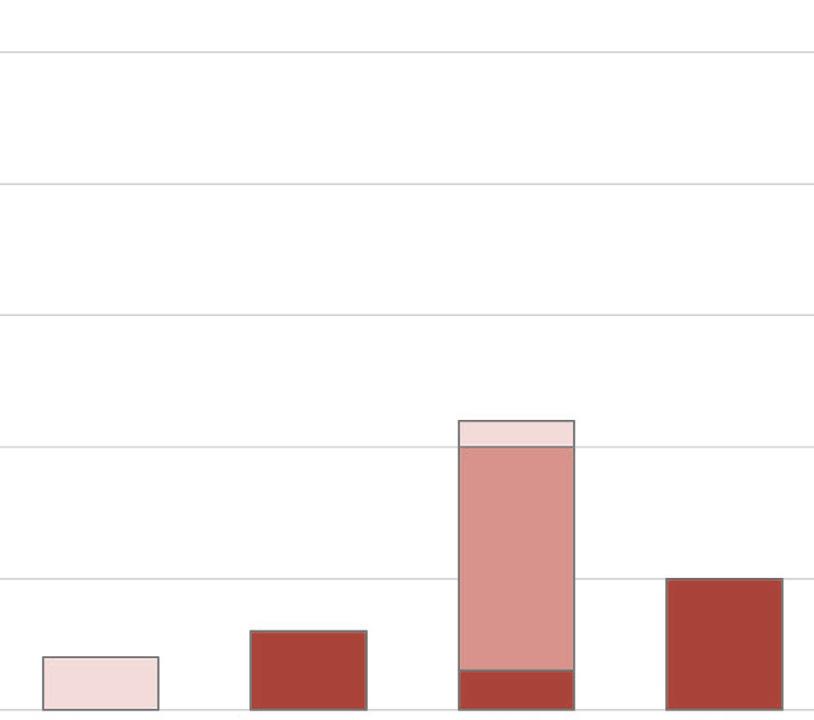
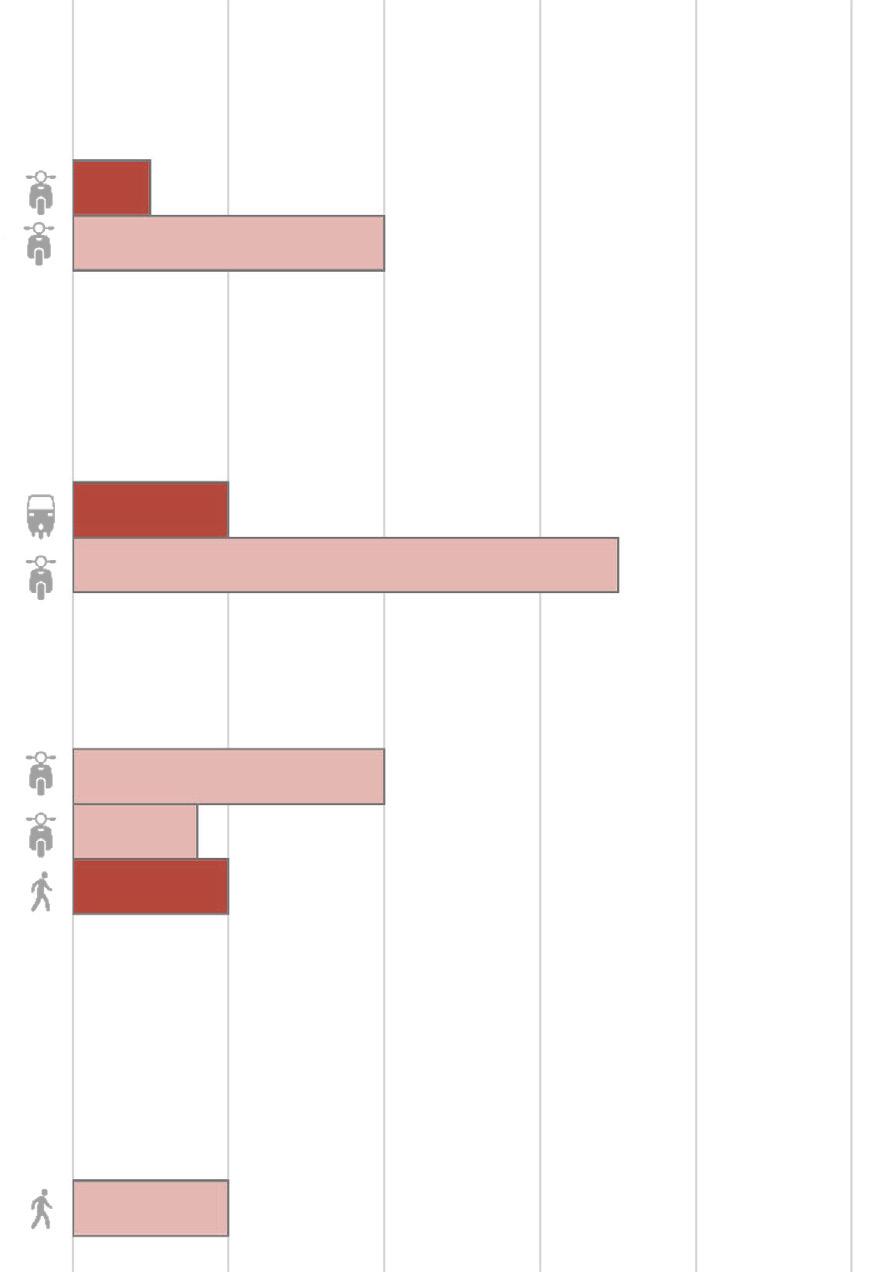
Availability of work is a crucial factor for making their choices, hence they are restricted to live close to their workplace to reduce their transportation costs.
Travel Time to Workplace
Higher disposable income indicates more capacity and more means to travel farther for work and own a private vehicle.
The disposable income available to a household for expenditure on transportation is a major determinant in their choices about travel time, travel distance and level of convenience.
Walkability Analysis
Induced Gentrification
Poor last mile connectivity from Transit stop
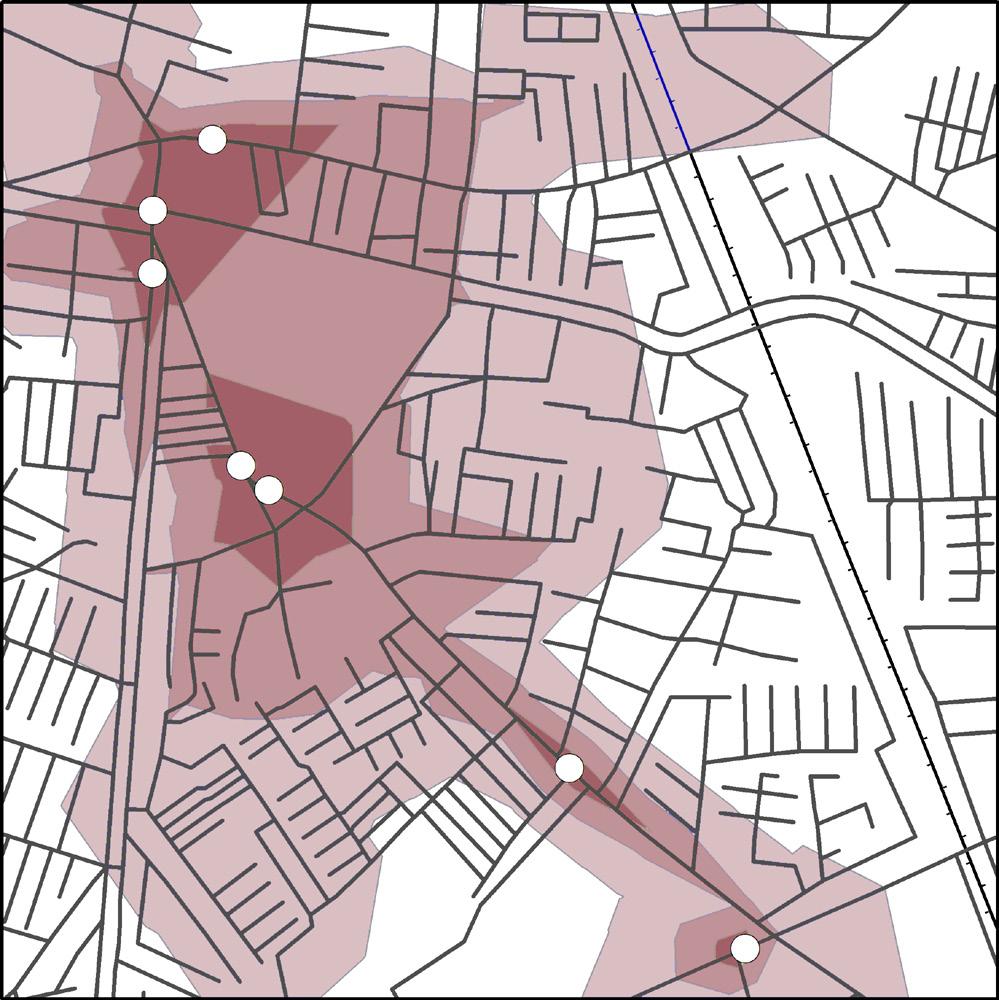
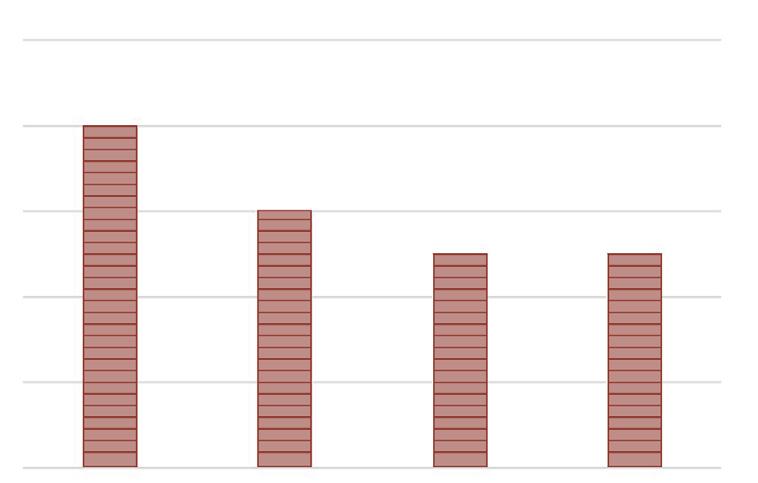
43% of the precinct area is beyond the 10min walking distance. Last mile connectivity in Ghodasar is poor and becomes expensive, especially for shorter trips. This results in a higher dependency on private vehicles, especially two - wheelers
Upto 2mins catchment
5% 1.4x 0.5x 34% 18%
Within 2-5 mins catchment
Within 5-10 mins catchment
times longer than private mode times that of private mode PT takes, on average PT costs, on average
Despite double the cost, users prefer to use private mode due to the longer travel time taken by public transport.
Housing prices near transit
10%
Housing cost exceeding
30% costlier than surrounding areas of HH income makes it unaffordable
It may result in the exclusion of the low mobility, low income groups that were located near the TOD corridor who may be considered the captive groups for public transit. They may then be replaced by middle income or high income groups that already own cars and would be reluctant to use public transit.
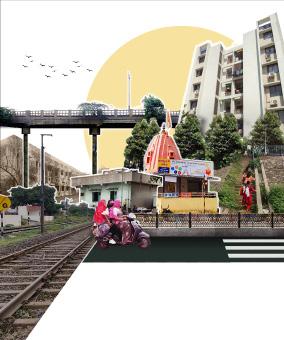
Implementing a single TOD vision as a blanket policy across Ahmedabad, without addressing the on-ground peculiarities of morphology, density and landdynamics, isresulting in misdirectedTAD, gentrification, and a stuntedpace ofdevelopment, asseeninthecaseofGhodasar.
Addressing the issues of handling existing high densities is imperitive before further development can be proposed. This chapter, thus. explores the observed conditions in the precinct of Ghodasar - understanding the various factors disincentivizing TOD and the possible methodologies that can be adopted to adjust the policy and make TOD a success on-ground.
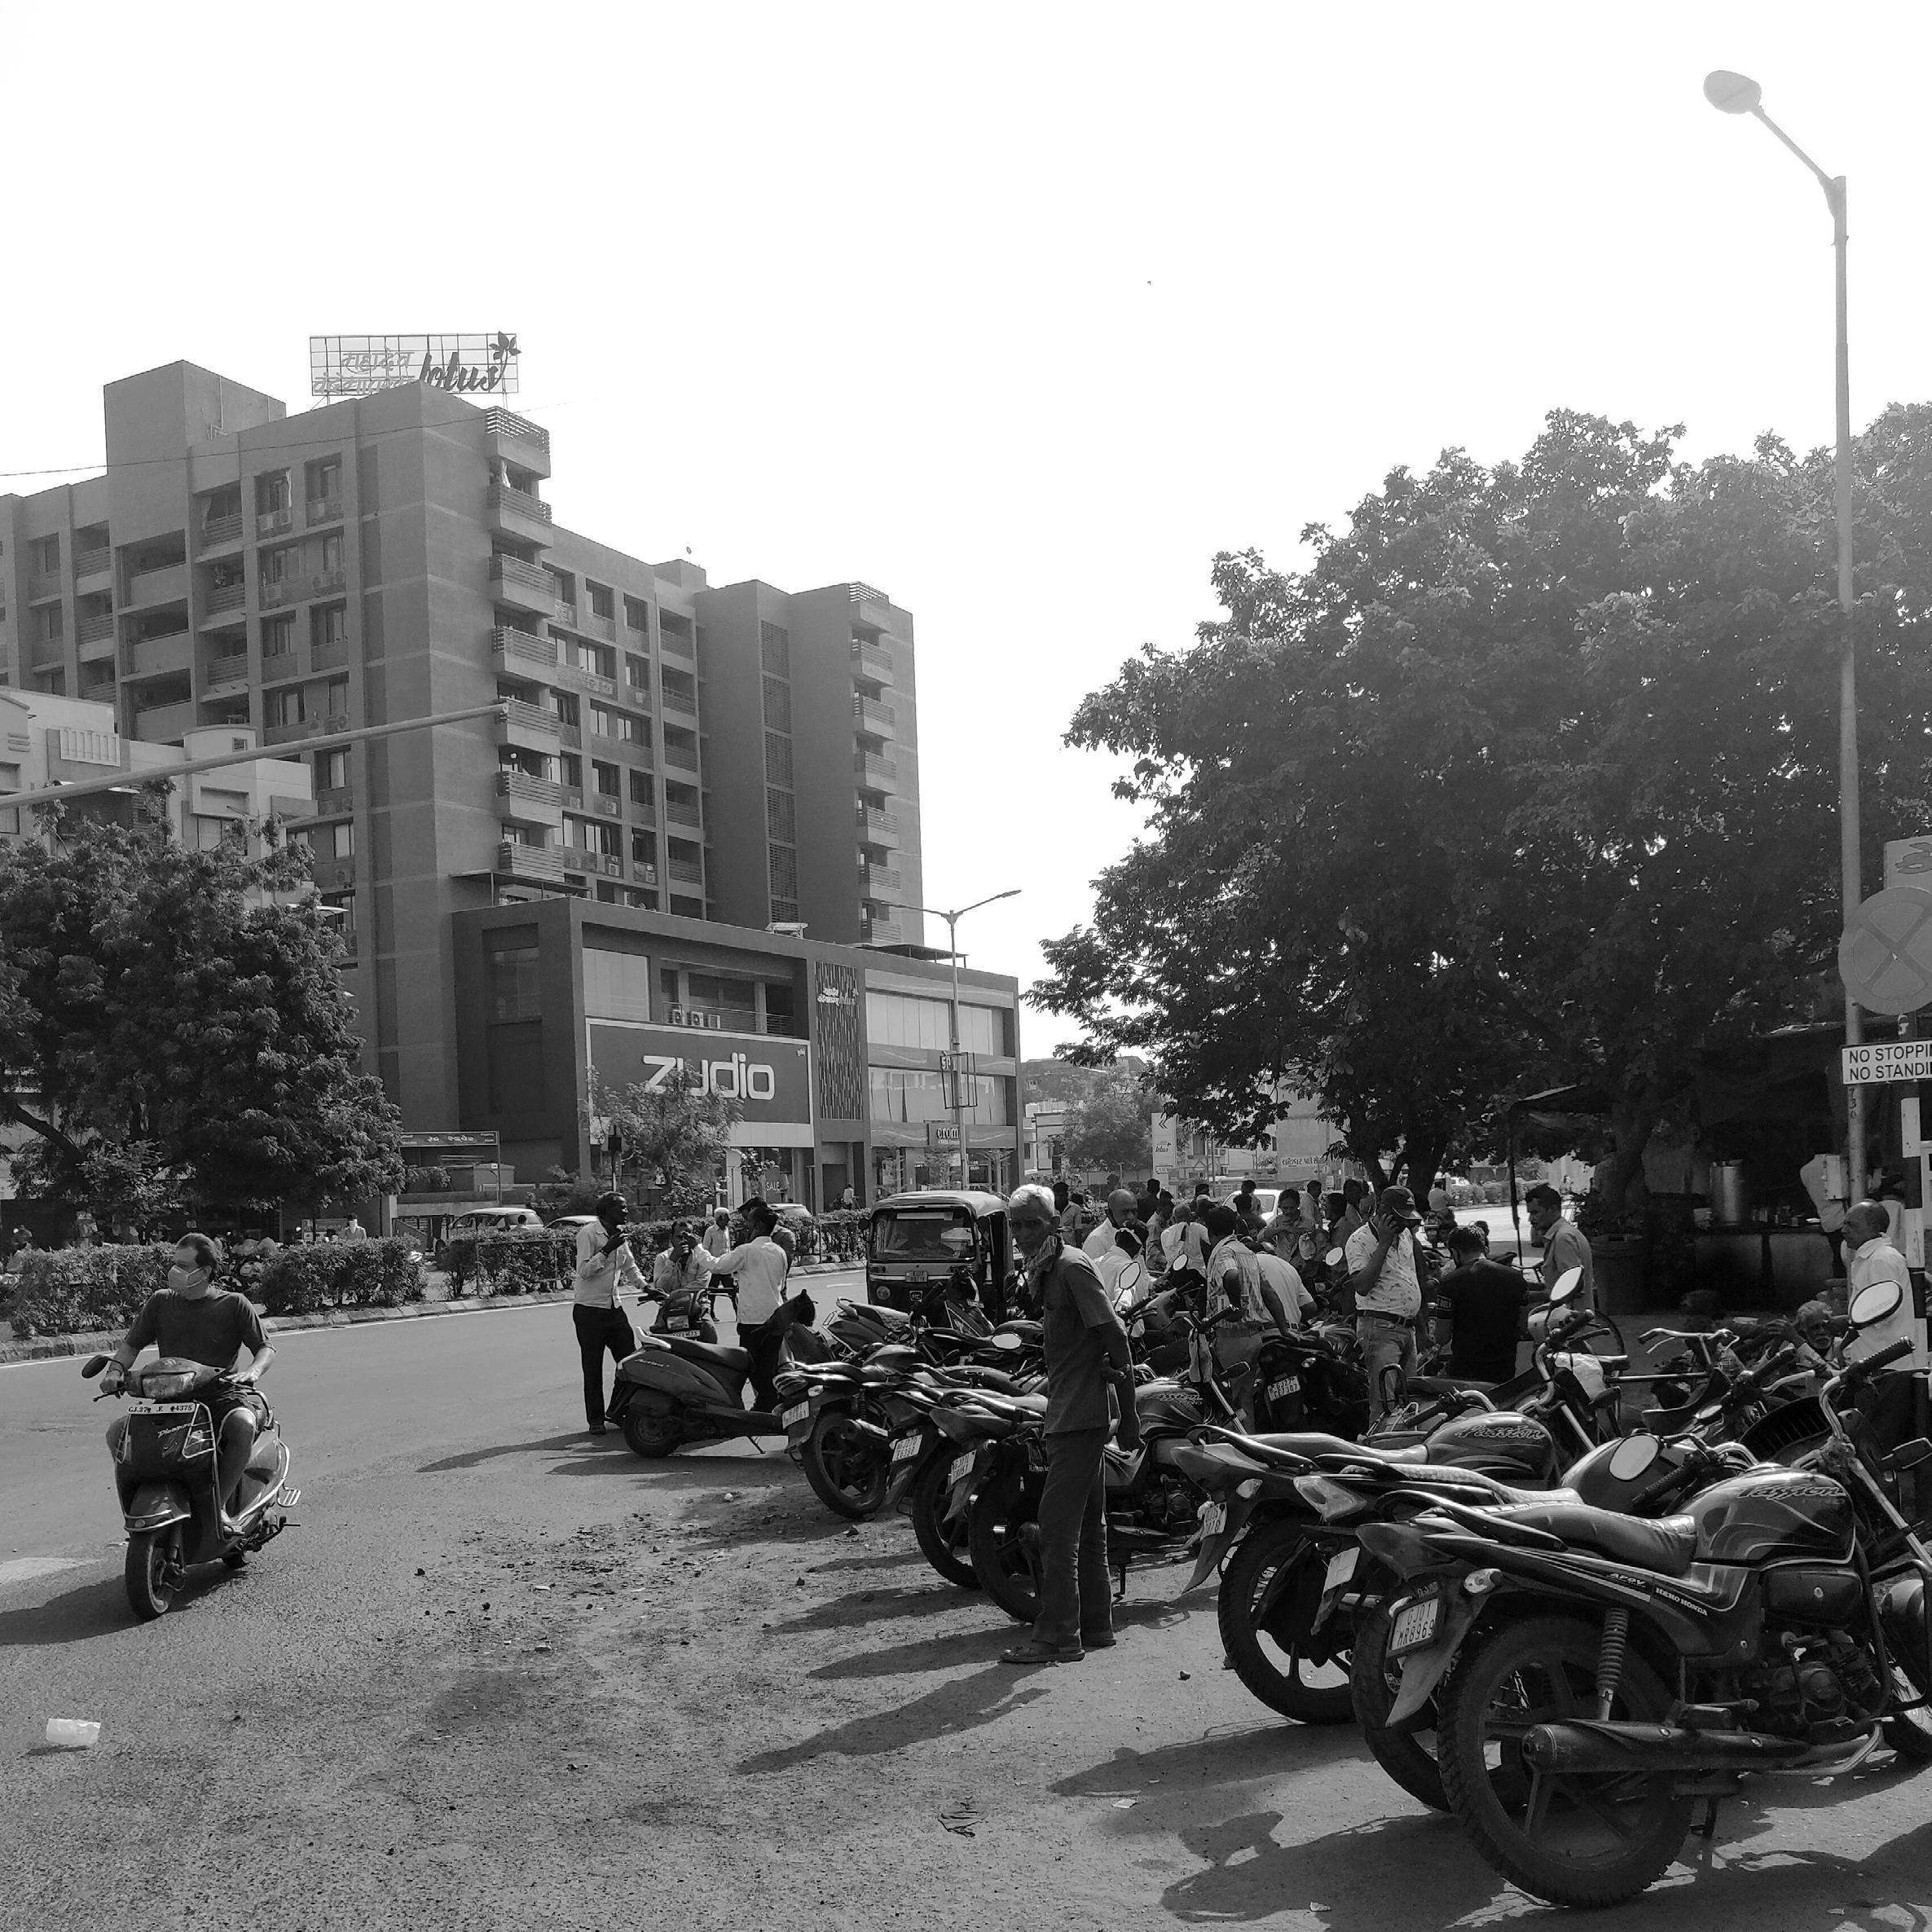
Restricted by Regulatory Frameworks
TOD is constrained by the regulatory framework of municipalities which are not supportive of TOD. The physical requirements of zoning and developmental controls – height restrictions, setbacks, FAR, ground coverage, etc prohibit the development.
Ghodasar is a predominantly high-density residential area with few commercial uses that essentially cater to the local retail needs of the neighborhood. The buildings around the transit do not have a very strong functional relationship to the station, creating a lack of diversity of uses.
Density without Design
Ghodasar is a predominantly high-density residential area with few commercial uses that essentially cater to the local retail needs of the neighborhood. The buildings around the transit do not have a very strong functional relationship to the station, creating a lack of diversity of uses.
Large block sizes and lack of NMT/pedestrian infrastructure such as safe and shaded footpaths, street furniture and amenities, hinder walkability in the area and to the transit station.
Transit Oriented Development (TOD) is gradually degenerating into Transit Adjacent Development (TAD) failing to capitalise on the transit’s proximity.
Masterplans lack the dynamism to adjust to demand, and are often disconnected from on-ground realities that obstruct democratic TOD implementation.
The TOD policy frameworks only dictate universal principles of urban design as ‘special norms’ for the influence zones.




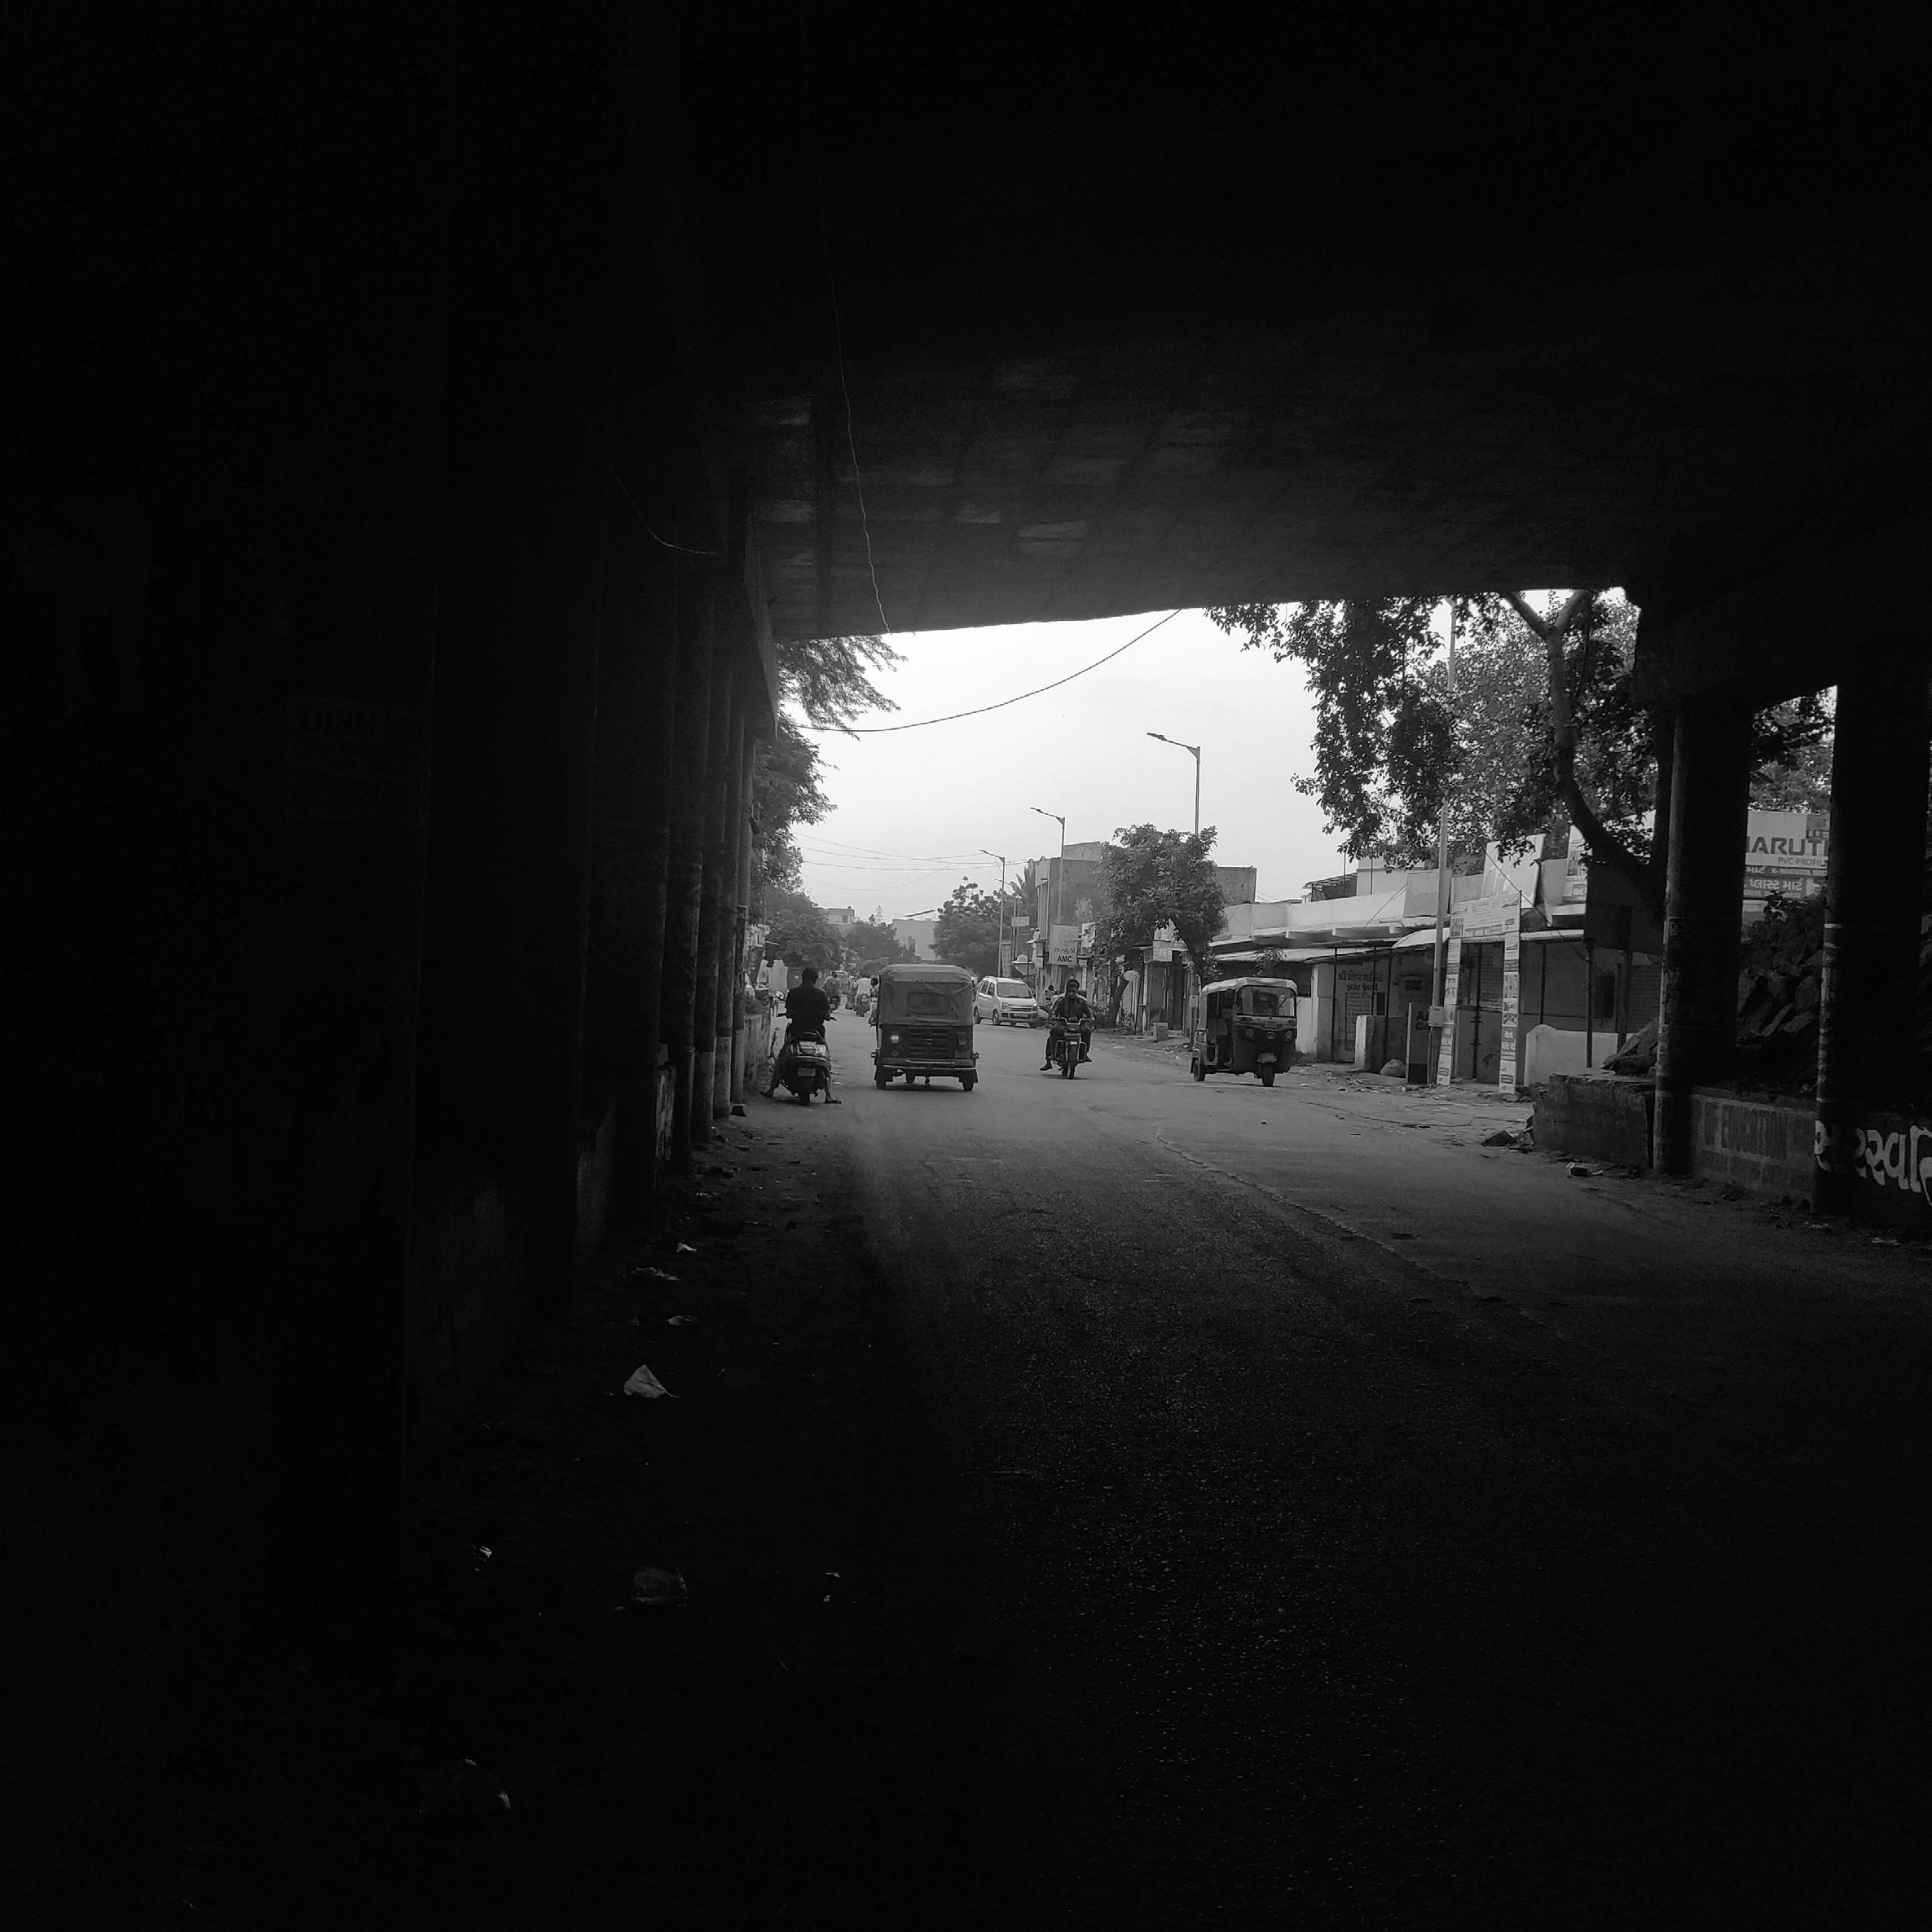
Implementation of TOD as a top-down policy without contextualisation does not help enable TOD as implementable projects.
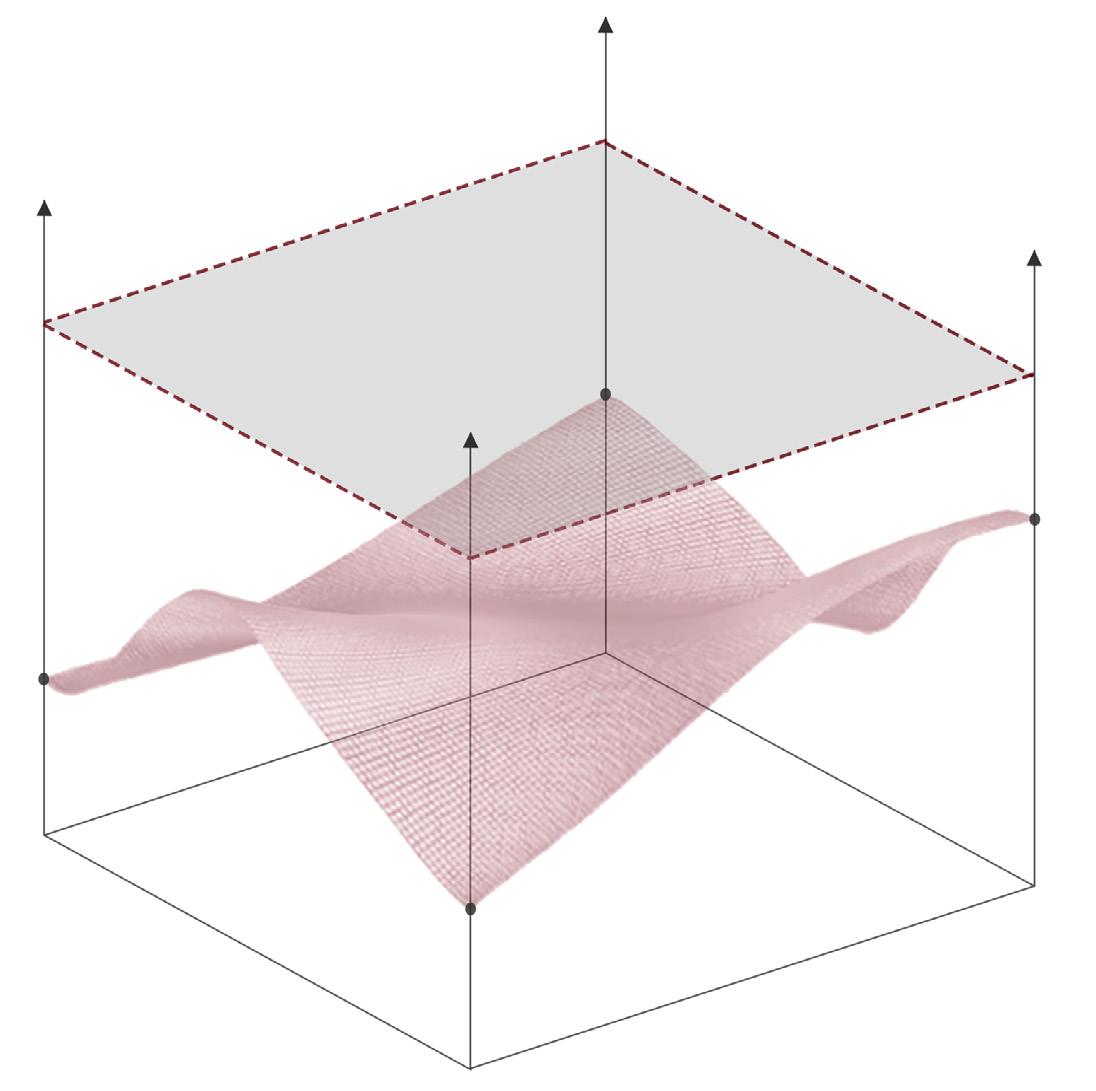
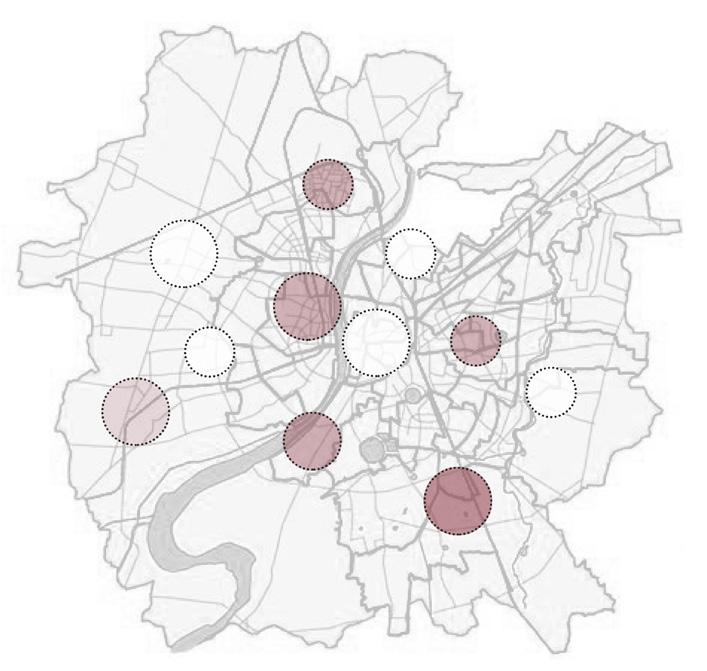
Every city has multiple nodes each of which differ greatly in form, function and impact. There is, thus, a need for contextualising these nodes to better extract their potential and incentivize development.

It describes the importance of a station in the public transit network based on passenger traffic, connections with other transport modes, and centrality within the network.
It reflects the quality of the area around the station through factors such as diversity of land use, availability of essential services such as schools and healthcare, amenities that can be accessed by walking or cycling, pedestrian accessibility, pedestrian connectivity and the size of urban blocks around the station.



It refers to the unrealized market value of station areas. It can be estimated using variables of land demand, housing densities, job accessibility.
As can be seen in the case of Ghodasar, TOD principles cannot be applied uniformly across an entire city or transit network since densities of jobs and people vary widely across the urban space. The implementation of BRTS along the NH8 facilitated the growing demand for more residential and commercial developments, albeit for a short period of time. The area of Ghodasar has, since then, been in a phase of stagnation. It is imperative to address the issues of handling existing high densities before further development can be proposed.
Certain methodologies, such as Station Area Planning and the 3V Framework, can assist in determining what level of density the area surrounding a given station can absorb, as well as determining what kind of development mix makes sense in a given area, with the goal of striking the right balance between jobs, housing, and other amenities.

Ghodasar has become a representative example of the unfortunate scenario where an area zoned for TOD is not able to behave as one, creating a redundancy. TOD in this area, thus, falls a ‘TAD’ short in promoting development and transit ridership.

Bertaud, A. (2014). OrderwithoutDesign–Howmarketsshapecities, Cambridge, Massachusetts, The MIT Press
Calthorpe, P. (1993). The Next American Metropolis: Ecology, Community, and the American Dream, New York: Princeton Architectural Press.
Islam, R., Brussel, M., Grigolon, A., Munshi, T. (2018). Ridership and the Built-Form Indicators Indicators: A Study from Ahmedabad Janmarg Bus Rapid Transit System (BRTS). UrbanScience,2, 95 https://doi.org/10.3390/urbansci2040095
Joshi, R., Joseph, Y., Patel, K., Darji, V. (2017). Transit-oriented development: Lessons from Indian experiences. Centre for Urban Equity, CEPT University.
Joshi, R., Shravani, T. (2019). Contextualizing Node in TOD - Using 3V Framework, A case of Hyderabad. Urban Mobility India Conference 2019
Transforming the urban space through transit-oriented development: The 3V approach. The World Bank https://www.worldbank.org/en/topic/transport/publication/