
American Journal of Humanities and Social Sciences Research (AJHSSR)
e-ISSN :2378-703X
Volume-07, Issue-01, pp-114-120
www.ajhssr.com
Research Paper Open Access
Technology Readiness and Technology Acceptance of Employees of Bekasi Kota Police Office in Using Information Systems For Society Service
Rorim Panday1 , YantihAlawiyah 2, Dovina Navanti3
1(Faculty Economic and Business/ Bhayangkara Jakarta Raya University, Indonesia)
2(Faculty Economic and Business/ Bhayangkara Jakarta Raya University, Indonesia)
3(Faculty Economic and Business/ Bhayangkara Jakarta Raya University, Indonesia)
Corresponding Author: RorimPanday
ABSTRACT : This study aims to determine and analyze the readiness and acceptance of technology in Polres Metro Bekasi City employees in using information system services. This type of research is quantitative. The sampling technique used is saturated sampling in which the number of questionnaires are 106 respondents. Data collection techniques by distributing questionnaires. The respondents of this study were all employees of Polres Metro Bekasi Kota. The analytical method used is a statistical analysis method, namely Path Analysis on the Technology Readiness Acceptance Model (TRAM). The results of testing the data using the validity and reliability tests show that the data obtained is valid and reliable. Of the 11 hypotheses in the TRAM, five hypotheses are supported by research results while 6 hypotheses are not supported. Based on the proof of the hypothesis, in this study sample, the TRAM (Technology Readiness Acceptance Model) model was not fully implemented in the sample studied. Behavior intention that occurs is due to its relationship with perceived usefulness; where perceived usefulness is related to optimism and innovativeness. Perception of ease of use is related to Optimism and Insecurity; however, the perceived easy of use is not positively related to the perceived usefulness and behavioral intention.
KEYWORDS : Information System Services, TRAM, technology readiness, technology acceptance
I. INTRODUCTION
Information technology has developed very rapidly both in terms of hardware and software. Information technology is a living part of almost all human activities, such as business activities, services, trade, marketing and even education. With this technology, more and more information is received and faster. In terms of services, information technology is one of the main supports for providing excellent and quality service, so that what is desired is achieved as service quality. With quality service it will give satisfaction to the service user. Some services to the public that use the information system are the Police Office which provides services including the issuance of Police Record Certificates (SKCK), Driving Licenses (SIM), Crowd Permits, Motor Vehicle Registration Certificates (STNK), Self-Report Certificates ( SKLD), Certificate of Report Loss (SKTLK), Recommendation Letter for Observation Service Business Permit, Police Report Receipt Letter (STTPLP), Notification Letter on the Progress of Investigation Results (SPPHP), Notification Receipt Letter (STTP), Police Report (LP) .[1]. To be able to provide these quality services, because it uses information technology, it will depend on the ability of the executor of service activities, which depends on how ready the implementer is in using information technology and how much the executor can accept information technology. Technology readiness is a concept developed by Parasuraman known as the Technology Readiness Index (TRI). In this concept, a person's technological readiness consists of a person's ability and perception of technology. There are four person's perceptions of technology, namely: Optimism, Innovativeness, Insecurity and Discomfort. Technological readiness has been carried out by many studies on various types of technology [2], [3], [4],[5], and the results of these studies state that the technological readiness of a group of people and using technology is not the same, that is, it varies in levels of optimism, innovativeness, insecurity and discomfort. So that it can almost certainly be said that technology readiness is unique to the use of a technology for a group of users. Thus the technology readiness index varies, depending on the user. Users here can be service providers from technology (users) or from consumers as technology users.
Technology acceptance was developed by Davis, consisting of two elements, namely perceived ease of using technology and perceived usefulness of technology. Perceived ease of use of defined technology can affect perceived useful of technology. Research on technology acceptance has also been carried out by many researchers from various countries [6],[7], [8] and [9]
The acceptance of technology by a person or group of people also varies in terms of their acceptance index. Furthermore, the TRI concept is combined with the TAM concept, so that it becomes an integrated concept into the Technology Readiness Acceptance Model concept.In this study, the TRAM concept will be applied to implementers of information technology users at police service institutions.
From the observations of researchers, the Metro Bekasi City Police officers look enthusiastic in using the information system (optimistic); in terms of innovation they always want to find out new things how to run the system easily and correctly. Metro Bekasi City Police officers feel very insecure if data is private in nature shared by other people or with their fellow friends. Bekasi city metro police officers will feel uncomfortable if there are things that significantly disturb them, such as the work environment. In the perception of usability where the Bekasi Metro Police officers really believe that using an information system can improve their performance. In the perception of ease of use, Bekasi Metro Police officers can implement and understand existing information systems easily, but there are still those who do not understand these information systems. In terms of behavioral intentions of Metro Bekasi Police officers, employees must use software in order to speed up and provide more accurate data processing than manually and all events can be traced more easily. The various conveniences or benefits obtained from this information technology, do not mean that the technology can be easily implemented, which in fact, there are many obstacles that occur in the application of information technology, which are caused by aspects of user behavior, which means that the technology user factor holds important role in the successful implementation of information technology.
Based on the problems that have been formulated, this study aims to find out that:
1. Optimism has a positive effect on perceived usefulness.
2. Optimism has a positive effect on perceived ease of use.
3. The nature of innovativeness has a positive effect on perceived usefulness.
4. The nature of innovativeness has a positive effect on perceived ease of use.
5. Insecurity has a negative effect on perceived usefulness.
6. Insecurity has a negative effect on perceived ease of use.
7. Discomfort has no effect on perceived usefulness.
8. Discomfort has a negative effect on perceived ease of use.
9. The perceived ease of use has a positive effect on perceived usefulness.
10. The perceived usefulness has a positive effect on behavioral intentions.
11. The perceived ease of use has a positive effect on behavioral intention
II. REVIEW OF LITERATURE
Technology Readiness and Technology Acceptance basically wants to see the relationship between technology usage behavior. This study also expands on previous research by investigating the impact of technology readiness and technology acceptance on police officers in using IT in public service. Technology readiness is a person's possibility to use and appreciate new technology, while technology acceptance describes a person's possibility to accept new technology in their workplace. Technology Readiness, first introduced in the field of marketing, is how consumers interact with technology-based products. Because consumers' knowledge of new technologies is limited, which may be due to a general lack of information about new technologies, information about new technologies is incomplete, not even reaching consumers. From the information obtained by consumers, consumers react whether they are okay. ready to accept new technology in the sense that every consumer can use the new technology, and whether they can accept the existence of new technology in terms of ease of use and benefits of the new technology. Basically, a person's skill in using a computer, according to Parasuraman, can be influenced by 4 character dimensions, namely Optimism, Innovativeness, Discomfort, and Insecurity.
Optimism is defined as “a positive view of technology and a belief that offers people increased control, flexibility, and efficiency in their lives”[10]. It generally captures positive feelings about technology.
Innovativeness is defined as “a tendency to be a technology pioneer and thought leader”[10]. This dimension generally measures to what degree individuals perceive themselves as the forefront.
Discomfort is defined as “a perceived lack of control over technology and a feeling of being overwhelmed by it”[10]. This dimension generally measures the fear and concerns people experience when confronted with technology.
Insecurity is defined as “distrust of technology and skepticism about its ability to work properly” [10] This dimension focuses on concerns people may have in the face of technology-based transactions.
Optimism and Innovative are the drivers of technology readiness (TR). A high score on this dimension will improve overall technology readiness. Inconvenience and Insecurity, on the other hand, are a hindrance to technology readiness. A high score on this dimension will reduce overall technology readiness [11]. All suggest that the four dimensions are independent, each making a unique contribution to individual technological readiness [10]
In the discussion of technology readiness in the field of operational management, show that TRI theory can be applied out of the field marketing. In operation management, the persons who use and applied IT are as human capital and must have personal capacity in the field of IT when working use IT system. Operational management can’t run properly if the IT person not capable in term have low technology readiness and low of technology acceptance.
III. RESEARCH METHOD
This type of research is causal survey quantitative research, namely systematic scientific research on parts and phenomena and their relationships. This study used a modified TRAM model questionnaire according to the circumstances of the research object. This research process was carried out in April 2022 until it was completed. This research is located at Polres Metro Bekasi Kota Jl. Pramuka No. 79, RT. 001/RW. 002, Marga Jaya, Kec.Bekasi Sel., Bekasi City, West Java 17141. The sample used in this study was the total population or all employees of Polres Metro Bekasi Kota, namely 106 people. The TRAM model in this research show in Figure 1.
Hypotheses
Hypothesis 1. Optimism has a positive relationship with perceived usefulness.
Hypothesis 2. Optimism is positively related to perceived ease of use.
Hypothesis 3. Innovativeness is positively related to perceived usefulness.
Hypothesis 4. Innovativeness is positively related to perceived ease of use.
Hypothesis 5. Insecurity is negatively related to perceived usefulness.
Hypothesis 6. Insecurity is negatively related to perceived ease of use.
Hypothesis 7. Discomfort is not significantly related to perceived usefulness.
Hypothesis 8. Discomfort is negatively related to perceived ease of use.
Hypothesis 9. Perceived ease of use is positively related to perceived usefulness.
Hypothesis 10. Perceived usefulness is positively related to Behavior intention
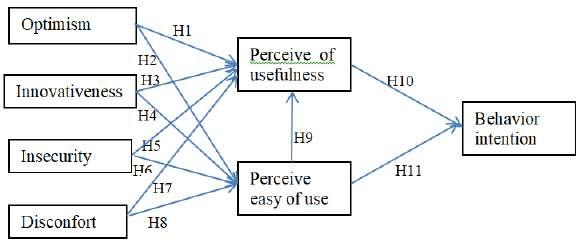
Hypothesis 11. Perceived ease of use is positively related to Behavior intention.
Hypothesis 10. Perceived usefullness is positively related to Behavior intention
Hypothesis 11. Perceived ease of use is positively related to Behavior intention
IV. RESULT AND DISCUSSIONS
After the questionnaires were collected, and the data tabulated, then the validity and reliability of the data were calculated before the data was processed using path analysis in the AMOS program. The results of all calculations and discussion in the following section.
Validity test
The results of the validity test in Table 1 and Table 2 show that all statements from the questionnaire are valid. Table1. Validity test
Source : Data compiledby SPSS versi 24 Table 2 Validity Test Perceive of easy of use (Z2) dan Perceive of usefull (Z2)
Source : Data compiledby SPSS versi 24
The reliability test in table 3 shows that all variables are reliable because the Cronbach value is greater than 0.6. Table 3
Source : Data compiled by SPSS versi 24