Italiana La Metallurgia
International Journal of the Italian Association for Metallurgy
n.05 Maggio 2026
Organo ufficiale dell’Associazione Italiana di Metallurgia. Rivista fondata nel 1909
International Journal of the Italian Association for Metallurgy
n.05 Maggio 2026
Organo ufficiale dell’Associazione Italiana di Metallurgia. Rivista fondata nel 1909
International Journal of the Italian Association for Metallurgy
Organo ufficiale dell’Associazione Italiana di Metallurgia. HouseorganofAIMItalianAssociationforMetallurgy. Rivista fondata nel 1909
Direttore responsabile/Chiefeditor: Mario Cusolito
Direttore vicario/Deputydirector: Gianangelo Camona
Comitato scientifico/Editorialpanel: Marco Actis Grande, Ettore Anelli, Silvia Barella, Enrico Baroni, Paola Bassani, Shahab Bazri, Christian Bernhard, Massimiliano Bestetti, Wolfgang Bleck, Franco Bonollo, Irene Calliari, Riccardo Carli, Mariano Enrique Castrodeza, Emanuela Cerri, Vlatislav Deev, Andrea Di Schino, Donato Firrao, Piero Frittella, Berndt Kleimt, Carlo Mapelli, Susanne Michelic, Roberto Montanari, Marco Ormellese, Mariapia Pedeferri, Massimo Pellizzari, Annalisa Pola, Ulrich Prahl, Barbara Previtali, Dario Ripamonti
Segreteria di redazione/Editorialsecretary: Flynn Russo
Comitato di redazione/Editorialcommittee: Federica Bassani, Gianangelo Camona, Mario Cusolito, Carlo Mapelli, Federico Mazzolari, Flynn Russo, Silvano Panza
Direzione e redazione/Editorialandexecutiveoffice: AIM - Via F. Turati 8 - 20121 Milano tel. 02 76 02 11 32 - fax 02 76 02 05 51 met@aimnet.it - www.aimnet.it
Reg. Trib. Milano n. 499 del 18/9/1948. Sped. in abb. Post. - D.L.353/2003 (conv. L. 27/02/2004 n. 46) art. 1, comma 1, DCB UD
Immagine in copertina: Shutterstock

Gestione editoriale e pubblicità Publisher and marketing office: siderweb spa sb Via Don Milani, 5 - 25020 Flero (BS) tel. 030 25 400 06 commerciale@siderweb.com - www.siderweb.com
La riproduzione degli articoli e delle illustrazioni è permessa solo citando la fonte e previa autorizzazione della Direzione della rivista. Reproduction in whole or in part of articles and images is permitted only upon receipt of required permission and provided that the source is cited.
siderweb spa sb è iscritta al Roc con il num. 26116
n.05 Maggio 2026
Anno 117 - ISSN 0026-0843
Memorie scientifiche / Scientific papers
Miscellanee / Miscellaneous
Materiali compositi / Composite Materials
Grain refinement and wear studies of nickel aluminide reinforced Al Composites
J. Abuthakir, G. Venkatesh ....................................................................................................................................
Intelligenza artificiale / Artificial Intelligence
Trasformazione digitale nella produzione dell’acciaio: un sistema di monitoraggio e sicurezza basato su Intelligenza Artificiale per le operazioni dei forni elettrici
V. Colla, M. Waseem Akram, A. Siddique, M. Vannucci, G. Bavestrelli, R. Girelli .........................................................
Nanoparticelle / Nanoparticles
Effects of synthesis parameters on the properties of iron nanoparticles synthesized via the borohydride method
Tien Hiep Nguyen, Ho Thanh Nghi, Nguyen Van Minh, Nguyen Manh Hung
Acciai inossidabili super-duplex / Super Duplex Stainless Steels
Microstructure and mechanical properties of Super Duplex Stainless Steel Friction stir and Electron beam welds
C. B. Sekar, S. Vijayan, S. R. Koteswara Rao .........................................................................................................................
Attualità Industriale / Industry News
Trattamenti termici / Heat treatments
Enhancing rail performances: the Danieli RH2 - Rail Head Hardening process
A. Palma, G. Urli ........................................................................................................................................................................
Atti e notizie / AIM news
Eventi AIM / AIM events ...................................................................................................................................... pag.57
Co.Science: si conclude a Milano il progetto europeo dedicato al dialogo tra ricerca e società ...............................................................................................................................................................................
Normativa / Standards ...........................................................................................................................................
Brescia 9-11 settembre 2026

Risorsa generata con l’intelligenza artificiale.


L’Associazione Italiana di Metallurgia è orgogliosa di annunciare il 41° Convegno Nazionale di Metallurgia, in programma a settembre 2026: un’edizione speciale che coincide con l’80° anniversario dalla fondazione di AIM e che intende celebrare la storia e il futuro della metallurgia italiana. Accanto ad un programma con oltre 200 memorie tecniche e scientifiche, è prevista un’area espositiva dedicata alle aziende, che permetterà ai partecipanti di esplorare le innovazioni del settore. Tutte le informazioni relative alle quote e alle modalità di partecipazione sono disponibili online sul sito www.aimnet.it/nazionaleaim
J. Abuthakir, G. Venkatesh
In the present study 1.5 wt% Ni particles were added to AA6061 alloy melt during stir casting and nickel aluminide reinforced Al Metal Matrix Composites (MMCs) were synthesized in the as cast, solutionized and T6 conditions. Base alloy was also synthesized in similar conditions. Base alloy and composite samples were characterized using X-Ray Diffraction (XRD), Scanning Electron Microscopy (SEM), Energy dispersive spectroscopy (EDAX) and Transmission Electron Microscopy (TEM). Al3Ni2 and AlNi intermetallic phases were observed during characterization. T6 composite exhibited a grain refinement of 38 µ m. Hardness of the T6 composite showed a 50% increase compared to base alloy. T6 composite showed 90% reduction in wear loss compared as cast base alloy.
KEYWORDS: AA6061; 1.5 WT% NI PARTICLES; INTERMETALLIC PHASES; GRAIN REFINEMENT; HARDNESS; WEAR LOSS.
Recent studies show that in situ intermetallic-reinforced Al MMCs—where reinforcement phases are generated internally through chemical reactions within the matrix— exhibit superior wear performance compared to MMCs reinforced with externally added (ex situ) ceramic particles, which often suffer from weaker interfacial bonding and non-uniform distribution. Intermetallics reinforced Al MMCs are being prepared through various routes such as Friction Stir Processing (FSP), Powder Metallurgy as well as various casting routes [1, 2, 3, 4]. The Synthesis of intermetallic reinforced Al MMCs through solid state reactions between metallic particle additives and Al alloy have been attracting wide research attention [5]. Literature review reveals that AlNi, Al3Ni, Al3Ni2 Ni3Al, TiAl and TiAl3 are the aluminide intermetallic compounds widely reinforced in Al MMCs [1]. Amongst these reinforcements, nickel aluminide (AlNi, Al3Ni, Al3Ni2 and Ni3Al) intermetallic reinforcements have been widely preferred because it imparts higher hardness to the matrix compared to other intermetallic reinforcements [5, 6, 7]. Intermetallic reinforced Al composites have been widely investigated for wear-based applications using various Al alloys added with Ni/Ti particles [8, 9, 10]. However, very limited attempts have been reported in the synthesis of nickel aluminide reinforced AA6061 Al MMCs for wearbased applications. Literature studies also revealed that
J. Abuthakir
Assistant Professor, Hindusthan Institute of Technology, Coimbatore, India - 641032
G. Venkatesh
Assistant Professor, PSG College of Technology, Coimbatore, India - 641004
fewer investigations were carried out on wear behavior of nickel aluminide reinforced Al MMCs containing Ni particles in the range of 0-5 wt% wherein superior wear resistance was reported [5].
Hence the aim of the present investigation is to synthesis Al composites reinforced with nickel aluminides intermetallics in the as-cast, solutionized as well as T6 conditions using AA6061 alloy containing 1.5 wt% Ni particles prepared via stir casting. The investigation also aims to compare grain refinement, hardness and wear behavior of composite with the base alloy in the as-cast, solutionized and T6 conditions.
AA6061 alloy was used as the base material and its chemical composition is shown in table 1. Ni particles of average size 50 µ (figure 1) were added to the AA6061 alloy melt in a furnace maintained at 750°C. Stirring was carried out at 200 rpm for 10 minutes. As cast composite and base alloy was solutionized at 550°C for 1 hour and further subjected to T6 treatment (550°C for 1 hour and peak aged at
165°C). XRD (Shimadzu), SEM (ZEISS), EDAX (TEAM) and TEM (JEOL) analysis were carried out to study nickel aluminides formation and distribution in the AA6061 matrix. XRD analysis was carried out in the scanning range of 10° to 90° at a scan step time of 1 second in steps of 0.0530°. Optical metallographic examination was carried out for base alloy and composite in all the conditions as per ASTM E3-01 standard and the etchant used was 10% HF solution. Vickers hardness test (Mitutoyo) was carried out at a 100g load for composite samples and base alloy in the as-cast, solutionized and T6 conditions as per ASTM E92 standard. Wear studies on the base alloy and composites were carried out using a DUCOM pin-on-disc wear tester as per ASTM G99 standard. Counter pin material used in the wear test was E11 hardened steel disc. Wear test was performed for base alloy and composite at sliding distance of 500m, load of 20N and sliding speed of 2m/s in the as-cast, solutionized and T6 conditions. Worn out surface morphology of base alloy and composite samples were analysed using SEM (ZEISS/JEOL).
Tab.1 - Chemical composition (weight %) of base alloy in the as-cast condition.
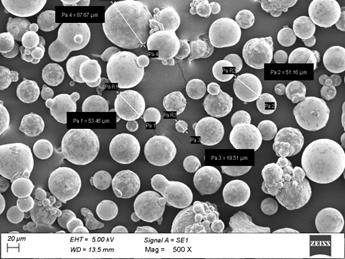
Fig.1 - Ni particles used in the investigation.
XRD results of the base alloy and composite samples are shown in figure 2. Base alloy exhibited peaks of Al, Al12Mg17 and Al-Si phases in the as-cast condition. Similar phases were shown by base alloy in the solutionized condition. Al, Al3.2Si0.47 and AlMg phases were observed in peak aged (T6) base alloy.
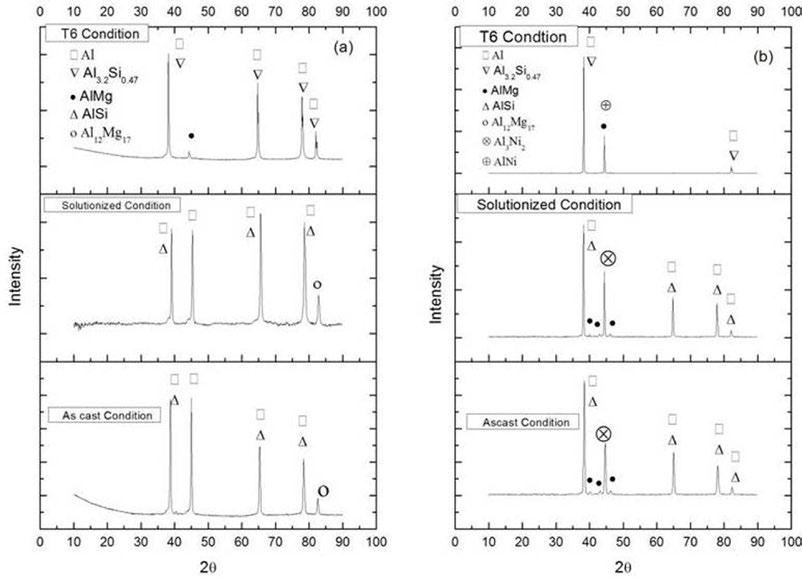
Fig.2 - XRD results of (a) base alloy and (b) AA6061-1.5 wt% Ni composite in the as-cast, solutionized and peak aged (T6) condi-tions.
AA6061-1.5 wt% Ni composite showed the presence of Al and AlMg phases in the as-cast, solutionized and T6 conditions. The composite however exhibited peaks of AlSi and Al3Ni2 phases in the as-cast and as solutionized condition whereas it showed Al3.2Si0.47 and AlNi phases in the T6 condition. Al exhibits rapid diffusion into Ni at temperatures above 600°C leading to the formation of intermetallic layers such as NiAl and NiAl₃ at the Al-Ni interface. These reactions are thermodynamically favourable and are reported to progress quickly even at relatively short holding times.
As the reaction layer grows, it progressively consumes the Ni particle, and the resulting intermetallic compound becomes brittle, breaking into fine, fragmented phases during stirring and solidification. These fine intermetallic fragments are subsequently distributed throughout the matrix leaving no discrete Ni particles in the final composite microstructure. Similar Al peaks were reported by Satishkumar et al. [11] in the investigation of ZrC re-
inforced AA6061 Al composite. Naeem et al. [5] observed nickel aluminide intermetallic phase formation in Ni particles added Al-Zn-Mg-Cu alloy at 2θ of 45° with no mapping of Al peaks due to low intensity of peak.
Formation of intermetallic phases during solutionized and T6 conditions, which consumed part of the Al matrix, reducing the relative intensity of Al peaks. Al peak near 45° overlaps with strong intermetallic peaks (Al3Ni2 and AlNi), causing apparent disappearance. Comparison of the obtained XRD results with ICDD database allowed distinguishing between the Al3Ni2 and AlNi peaks.
SEM-EDAX image of AA6061-1.5 Ni wt% composite is shown in figure 3. Presence of Al, Si, Mg and Ni elements were predominantly observed, and Ni element was found to be distributed in the matrix at the grain boundary networks. This confirmed that the AlNi intermetallic phase formed in the T6 composite was distributed in the matrix.
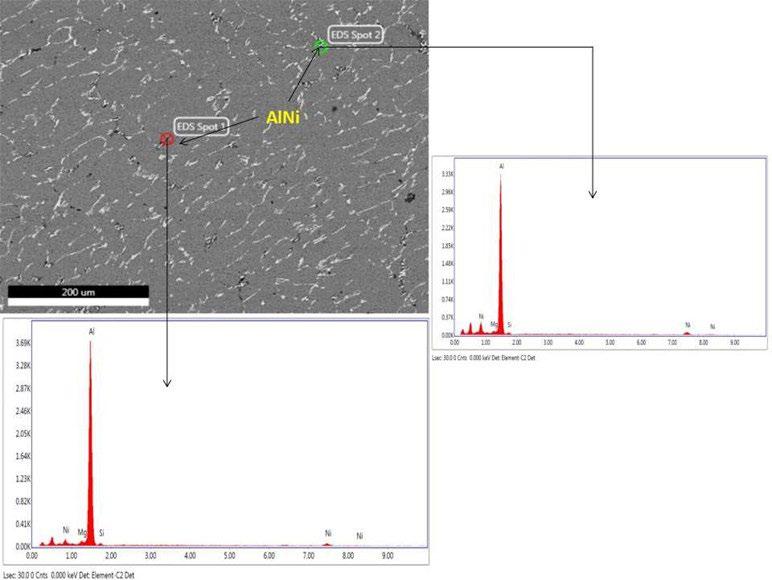
Fig.3 - EDAX (spot) analysis of AA6061 + 1.5 Wt% Ni composite in the peak aged (T6) condition.
As-cast and solutionized composites also showed the presence of similar elements and had distribution of Ni element in the matrix at the eutectic networks which confirmed the distribution of Al3Ni2 intermetallic phase in the matrix. Base alloy exhibited the presence of Al, Si and Mg elements in the as-cast, solutionized and T6 condition.
Bright field image of AA6061-1.5 wt% composite (figure 4) showed the formation of Al3Ni2 intermetallic phase in the as-cast condition. SAD pattern of the as-cast composite was revealed (110) and (10-1) planes of Al3Ni2 intermetallic phase belonging to cubic system. AlMg plane (222) was also observed in the SAD pattern. Zone axis of the SAD pattern was found to be [1-21]. Morphology of the Al3Ni2 intermetallic phase was lenticular having a size of 2µm. Solutionized composite showed (10-1) and (110) planes of Al3Ni2 intermetallic phase. Al-Mg phase was also observed
with (400) plane. Zone axis of the solutionized composite was found to be [001]. Al3Ni2 intermetallic phase formed in the solutionized composite exhibited elongated elliptical morphology having a size of 2.5µm as shown in figure 5. T6 composite showed (110) and (10-1) planes of AlNi intermetallic phase. AlMg phase was also observed in the SAD pattern of T6 composite in (211) plane. T6 composite exhibited zone axis at [1-10]. Elliptical morphology of AlNi intermetallic phase was observed in bright field image of T6 composite (figure 6). Size of the AlNi intermetallic phase in the T6 composite was calculated as 2.3µm.
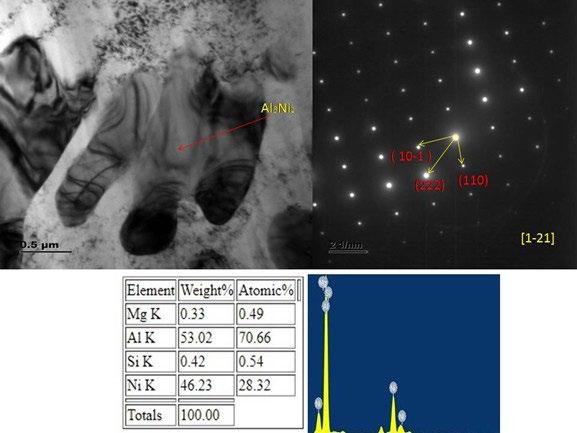
- (a) Bright field image (b) SAD pattern and (C) EDAX of the AA6061-1.5 wt% Ni composite in the as-cast condition.
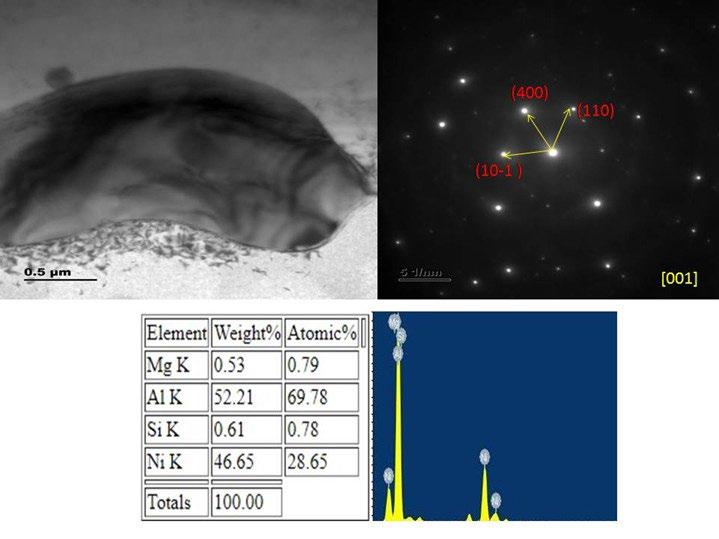
Fig.5 - (a) Bright field image (b) SAD pattern and (C) EDAX of the AA6061-1.5 wt% Ni composite in the solutionized condition.
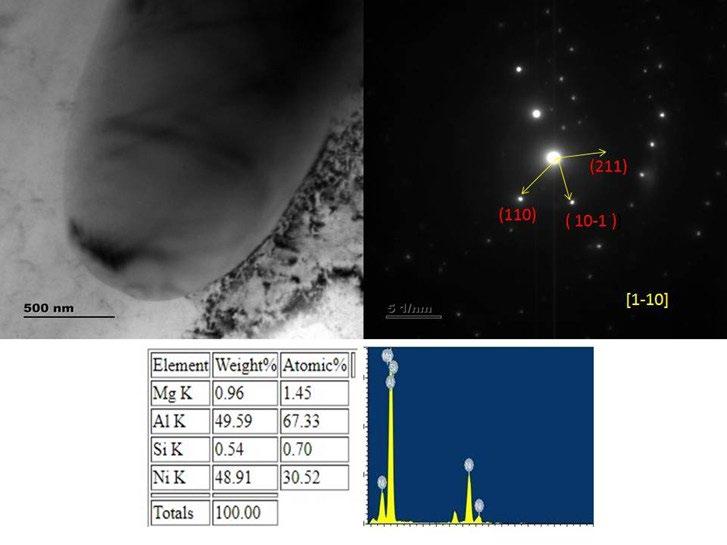
In as-cast and solutionized conditions, thermodynamics and rapid solid-state reaction favor the formation of Al₃Ni2. During T6 (solution + artificial aging), prolonged exposure at elevated temperatures promotes further diffusion and transformation of Al₃Ni2 → AlNi, a more stable phase at higher temperature/time conditions. Based on indexing of the diffraction spots, the patterns identified corresponded to the zone axes of [1-21], [001] and [1-10] in the case of as-cast, solutionized and T6 composites respectively.
Microstructure of the base alloy and composite showed α- phase in the as-cast, solutionized and T6 condition as shown in figure 7 and 8. Grain size of base alloy was found to be 84µm in the as cast condition whereas grain size was 72µm and 65µm in the solutionized and T6 condition respectively. Increase in grain refinement was observed in the base alloy in the T6 condition and solutionized condition compared to as-cast condition due to the distribution of AlMg and Al12Mg17 intermetallic phases observed in the XRD studies.
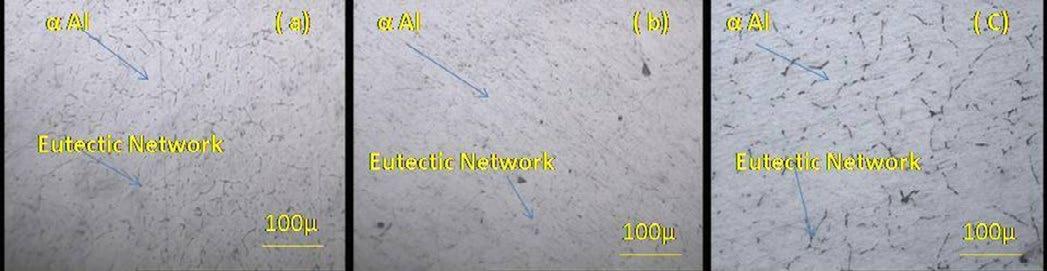
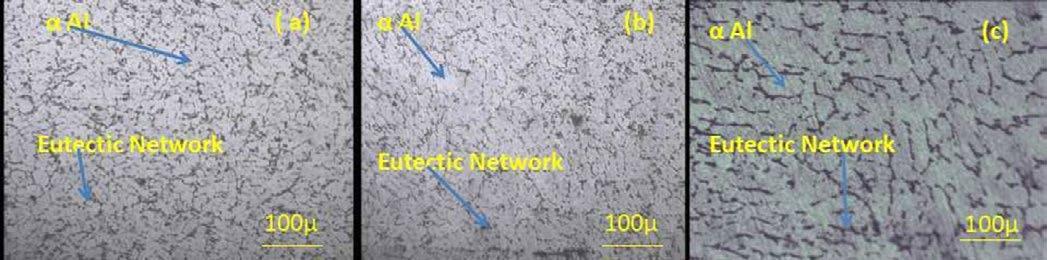
- Microstructure of AA6061-1.5 wt% Ni composite in the (a) as-cast (b) solutionized and (c) T6 condition.
Composites showed an increase in grain refinement compared to base alloy in the as-cast, solutionized and T6 condition respectively due to the heterogenous nucleation sites provided by the addition of Ni particles [5]. AA 6061-1.5 wt% composite in the T6 condition showed a significant reduction in grain size (38µm) compared to solutionized composite (47µm) and as-cast composite (56µm). This can be attributed to the distribution of equilibrium AlNi intermetallic precipitate formed of size 2300nm in the T6 composite [3].
Base alloy in the T6 condition found to give a hardness of 117 VHN compared to hardness of as-cast base alloy (93 VHN) and solutionized base alloy (101 VHN) due to precipitation hardening effect induced by AlMg equilibrium precipitate intermetallic phase formed in the T6 condition. Composite showed higher hardness than base alloy in the as-cast, solutionized and T6 condition respectively. Hardness values of base alloy and composite are shown in table 2.
Tab.2 - Hardness of base alloy and composite in different conditions.
Composite in the peak aged condition showed a higher hardness of 153 VHN compared to composite in other conditions due to the precipitation strengthening imparted by AlNi equilibrium intermetallic precipitate phase formed [5] and excellent interfacial bonding between the matrix and intermetallic reinforcement [4, 6]. Moreover, composite exhibited peak ageing at 1650C for an ageing time of 4 hours compared to one of 8 hours for base alloy. Formation of AlNi intermetallic phase had resulted in the reduction of peak ageing time. Similar peak ageing results
were observed by Chen et al. [13] while studying peak ageing behaviour of AA60661 alloy reinforced with Y2O3 and TiC at ageing temperature of 160°.
Wear loss of base alloy in T6 condition was found to be 51.5µm in the tested condition which was 75% less than wear loss of base alloy in the as-cast condition. Increase in hardness of T6 base alloy had resulted in improved behavior compared to wear loss of base alloy in other conditions. Composites exhibited lower wear loss than base
alloy due to the higher hardness imparted by nickel aluminide phase formation [9, 12]. Peak aged (T6) composite showed a wear loss of 17µm compared to wear loss of solutionized composites (53µm) and as-cast composites (82µm) respectively. Wear results are shown in table 3 as
Memorie scientifiche - Materiali
well as in figure 9. Higher hardness of T6 composite compared to other composite in as cast and solutionized conditions had led to superior wear resistance of T6 composite [8]. Worn out surface of the tested samples is shown in figure 10 and 11.
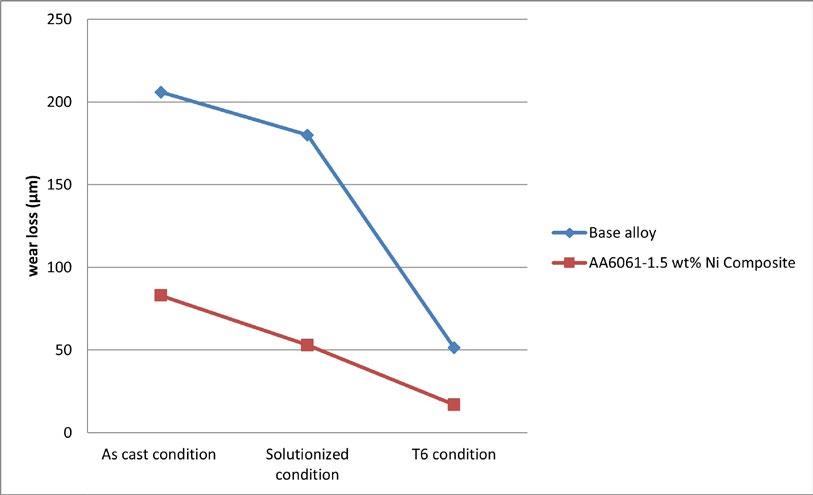
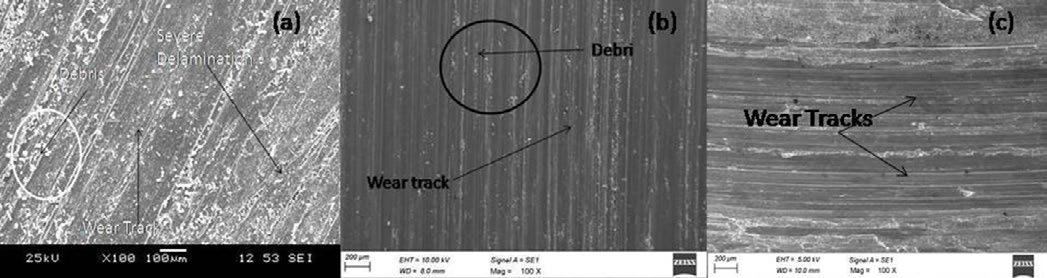
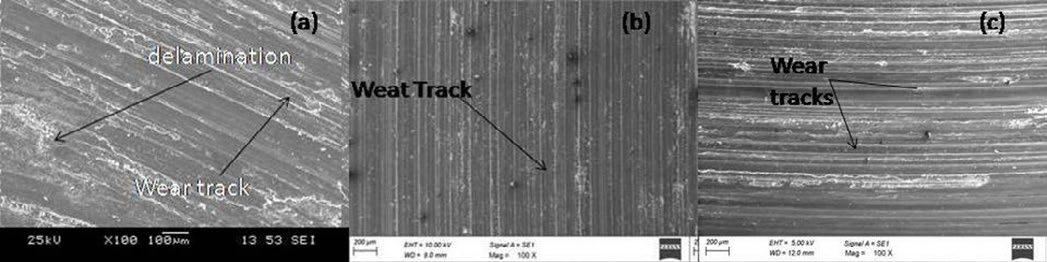
Fig.11 - Worn out surface of AA6061-1.5 wt% Ni composite in the (a) as-cast, (b) solutionized and (c) T6 condition.
Base alloy showed a transition of adhesive wear behavior from severe delamination in the as-cast condition to presence of numerous wear tracks along with debris. Wear tracks were predominantly observed in the composite samples. Mild wear tracks were observed in the T6 composite. Sreenivasan et al. [10] observed delamination wear in 5, 10 and 15 wt% TiB2 reinforced AA6061 alloy.
Al3Ni2 intermetallic phase was observed in the composite in the as-cast and solutionized conditions having a size of
2µm and 2.5µm respectively. AlNi intermetallic phase was observed in the composite in the T6 conditions having a size of 2.3µm. AlNi intermetallic phase formation and its distribution in the T6 composite had resulted in a higher grain refinement and higher hardness which led to superior wear resistance of T6 composite compared to other composites and base alloy. Composites predominantly showed wear tracks whereas base alloy exhibited severe wear tracks along with debris.
[1] K. Morsi, “Review: reaction synthesis processing of Ni-Al intermetallic materials,” Materials Sci-ence and Engineering A, 299 (2001) 1-15. https://doi.org/10.1016/S0921-5093(00)01407-6.
[2] M. Balakrishnan, I. Dinaharac, K. Kalaiselvan, R. Palanivel, “Friction stir processing of Al3Ni inter-metallic particulate reinforced cast aluminum matrix composites: Microstructure and tensile proper-ties,” J MATER RES TECHNOL, 9(3) (2020) 4356 – 4367. DOI:10.1016/j. jmrt.2020.02.060
[3] Jinwen Qian, Jinglong Li, Jiangtao Xiong, Fusheng Zhang, Xin Lin, “In situ synthesizing Al3Ni for fabrication of intermetallic-reinforced aluminum alloy composites by friction stir processing,” Ma-terial Science and Engineering A, 550 (2012) 279-285. DOI: 10.1016/j. msea.2012.04.070
[4] G. Miranda, O. Carvalho, D. Soares, F.S. Silva, “Properties assessment of nickel particulate-reinforced aluminum composites produced by hot pressing,” Journal of composite materials, 50(4) 2016 523-531. DOI:10.1177/0021998315577148
[5] Haider. T. Naeem, Kahtan S. Mohammed, Khairel R. Ahmad, Azmi Rahmat, “The influence of nickel and tin additives on the microstructural and mechanical properties of Al-Zn-Mg-Cu alloys,” Hindawi, 2014 (2014) 10 pages. DOI:10.1155/2014/686474
[6] A. Ahamed, T. Prashanth, “Mechanical property evaluation aluminium 6061 nickel coated ceno-sphere composites,” Mechanics and Mechanical Engineering, 22(4) (2018) 1381-1388. DOI:10.2478/mme-2018-0108
[7] Ali Reza Najarian, Rahmatollah Emadi, Mahdi Hamzeh, “Fabrication of as-cast Al matrix composite reinforced by Al2O3/Al3Ni hybrid particles via in-situ reaction and evaluation of its mechanical properties,” Material Science and Engineering B, 231 (2018) 57-65. DOI:10.1016/j.msenb.2018.03.041
[8] A. NidhinRaj, R. Sellamuthu, “Measurement of hardness and wear properties of Al alloy with addition of Ni,” Applied mechanics and materials, 813-814 (2015) 190-194. https://doi.org/10.4028/www.scientific.net/AMM.813-814.190
[9] Mehtap Damirel, Mehtap Muratoglu, “Influence of load and temperature on the dry sliding wear be-havior of aluminium-Ni3Al composites,” Indian Journal of Engineering and Materials science, 18(4) (2011) 268-282. DOI:10.56042/ijems.v18i4.12893.
[10] A. Sreenivasan, S. Paul Vizhian, N.D. Shivakumar, M. Muniraju, M. Raguraman, “A study of micro-structure and wear behavior of TiB2/ Al metal matrix composites,” Latin American journal of solids and structures, 8 (2011) 1-8. DOI: 10.5007/1807-0135.2011v8n1p1
[11] T. Satishkumar, S. Shalini, M. Ramu, T. Thankachan, “Characterization of ZrC reinforced AA6061 alloy composites produced through stir casting,” Journal of Mechanical Science and Technology ,34(1) 2020 143-147. DOI: 10.1007/s12206-019-1214-0
[12] Mojtaba Zadali, Mohammad Kotiyani, Khalil Ranjbar, “Wear and corrosion of in-situ formed Al3Zr aluminide reinforced Al3003 surface composite,” International Journal of Materials Research, 110(9) (2019) 874-884. DOI: 10.3139/146.111819
[13] C.-L. Chun, C.-H. Lin (2017), “A Study on the Aging Behavior of Al6061 Composites Reinforced with Y₂O₃ and TiC,” Metals,7(1) 2017 11. https://doi.org/10.3390/met7010011
V. Colla, M. Waseem Akram, A. Siddique, M. Vannucci, G. Bavestrelli, R. Girelli
Il progetto iSteel-Expert introduce un sistema innovativo di monitoraggio e sicurezza basato su intelligenza artificiale, specificamente progettato per le operazioni dei forni elettrici ad arco nelle acciaierie. Il sistema integra una rete di sensori e telecamere con una piattaforma di raccolta dati in tempo reale, utilizzando modelli avanzati di deep learning per automatizzare il rilevamento e la classificazione precisa di eventi critici e condizioni di sicurezza nell’ambiente del forno. Questo approccio innovativo migliora significativamente sia gli standard di sicurezza operativa che l’efficienza complessiva del processo. Il framework di monitoraggio si concentra su diversi aspetti operativi chiave: il rilevamento delle persone nell’area del forno per valutare l’esposizione umana e la conformità degli operatori alle procedure stabilite, il controllo dello stato della porta di scorifica per verificare la conformità dei processi di colata, il monitoraggio continuo del movimento del braccio degli elettrodi attraverso il rilevamento della posizione delle pinze per identificare anomalie che potrebbero richiedere correzioni o manutenzione, e il rilevamento di vapori, fumi e fiamme per garantire la sicurezza ambientale e operativa. Un dataset completo di circa 5000 immagini è stato raccolto per l’addestramento e la validazione dei modelli. Il sistema ha dimostrato ottime prestazioni, raggiungendo un’accuratezza superiore al 90% per il rilevamento dell’inclinazione del forno e del fumo, con elevati valori di precisione, recall e F1-score nei compiti di object detection.
CHIAVE: FORNO AD ARCO ELETTRICO; SICUREZZA; IMAGE PROCESSING; DEEP LEARNING; INTELLIGENZA ARTIFICIALE.
INTRODUZIONE
L’industria siderurgica ha implementato diverse misure di sicurezza, che comprendono programmi di formazione, strategie di manutenzione all’avanguardia e una rigorosa gestione operativa [1]. Nonostante i progressi ottenuti, sussiste l’esigenza di perfezionare i metodi di identificazione dei pericoli attraverso la transizione da procedure manuali a processi interamente automatizzati. Questa trasformazione è vitale per accrescere l’efficacia degli interventi di sicurezza all’interno degli impianti siderurgici. I sistemi automatizzati sono in grado di individuare precocemente i segnali di potenziali incidenti tramite il monitoraggio continuo dell’ambiente operativo. L’Intelligenza Artificiale (AI) può essere sfruttata per l’analisi dei dati, la rilevazione di anomalie e le attività di sorveglianza in tali contesti industriali. Inoltre, i sistemi di analisi basati su AI contribuiscono a una riduzione dei costi operativi tramite l’automatizzazione di compiti precedentemen-
Valentina Colla, Muhammad Waseem Akram, Arslan Siddique, Marco Vannucci Scuola Superiore Sant’Anna Istituto TeCIP, Pisa, Italy
Giovanni Bavestrelli, Renato Girelli
TENOVA S.p.a., Castellanza, Varese, Italy
te eseguiti manualmente. Il Deep Learning si è affermato come una tecnologia estremamente potente per svariate applicazioni di AI, come il rilevamento e il tracciamento di oggetti. In questo studio, impieghiamo il deep learning con l’obiettivo di elevare i livelli di sicurezza e l’efficienza operativa negli impianti di produzione dell’acciaio. Le operazioni condotte nei forni elettrici ad arco (EAF), sebbene essenziali per il riciclo dell’acciaio, espongono i lavoratori a seri pericoli per la sicurezza derivanti da elementi quali gli elettrodi in grafite, gli intensi archi elettrici, l’alta tensione e le emissioni di gas nocivi [2]. Per affrontare questa problematica, ci siamo concentrati sulla minimizzazione dell’esposizione umana negli ambienti EAF e sull’abilitazione di un sistema per la identificazione rapida delle situazioni pericolose attraverso l’applicazione della visione artificiale. Questo lavoro ha portato allo sviluppo di EAFvision, un sistema automatizzato per la sorveglianza di sicurezza in quasi real-time. Un sistema integrato di telecamere, microfoni e sensori aggiuntivi è stato installato in un sito EAF operativo per acquisire dataset specifici sulle criticità di sicurezza. Grazie all’addestramento e alla validazione di algoritmi di visione artificiale su questi dati, siamo ora in grado di rilevare tempestivamente i segnali premonitori di incidenti, identificando fumo, fiamme e condizioni anomale del forno. Inoltre, EAFvision monitora la presenza dei lavoratori per dare la possibilità di interrompere automaticamente le operazioni a rischio non appena viene rilevato personale all’interno delle aree critiche.
I metodi utilizzati per il rilevamento degli oggetti possono essere classificati in due categorie principali: i rilevatori a due stadi e i rilevatori a stadio singolo. I rilevatori a due stadi, come Faster R-CNN [3], Mask R-CNN [4] e Cascade R-CNN [5], procedono generando inizialmente delle proposte di regioni in cui è probabile la presenza degli oggetti, per poi classificarle e perfezionarle in una fase successiva. A differenza di questi, i rilevatori a stadio singolo eseguono entrambe le operazioni contemporaneamente, risultando quindi più rapidi ed efficaci per le applicazioni che richiedono l’elaborazione in tempo reale. Tra i numerosi rilevatori a stadio singolo, i modelli della famiglia YOLO (You Only Look Once) [6-9] hanno ottenuto notevole attenzione per le loro capacità di rilevamento in tempo reale. Abbiamo condotto esperimenti con alcuni dei modelli YOLO più recenti, per individuare le migliori
prestazioni e ottenere una comparazione dettagliata delle loro performance sui nostri dataset. Oltre ai modelli YOLO, sono stati sviluppati anche altri tipi di rilevatori a stadio singolo [10]. Negli ultimi anni, i transformer sono emersi come una potente alternativa alle tradizionali reti convoluzionali per l’elaborazione dei dati visivi, fra cui il modello DEtection TRansformer (DETR) [11]. Il modello RT-DETR [12] affronta le sfide relative alla velocità e all’efficienza introducendo meccanismi di attenzione ottimizzati e una strategia di addestramento migliorata per accelerare il processo di rilevamento pur mantenendo un’elevata accuratezza. Dato il successo di RT-DETR, ne abbiamo eseguito l’addestramento e il testing con il nostro dataset, realizzando un confronto approfondito delle prestazioni con altri rilevatori sia a stadio singolo che a due stadi.
Questo lavoro di ricerca colma un’importante lacuna nell’applicazione delle tecniche di visione artificiale per il miglioramento della sicurezza e dell’efficienza operativa nell’ambito della produzione di acciaio, con un focus specifico sugli ambienti EAF. Contrariamente agli studi precedenti che spesso si concentravano su compiti singoli o un numero ristretto di modelli, la nostra ricerca valuta un’ampia gamma di modelli di rilevamento oggetti all’avanguardia, incluse le versioni recenti di YOLO e i rilevatori basati su transformer, per compiti di sicurezza essenziali quali la rilevazione del personale, il monitoraggio delle pinze per gli elettrodi e l’identificazione del fumo. Questo studio fornisce un’analisi comparativa approfondita dell’accuratezza dei modelli, della velocità di inferenza e della fattibilità della loro implementazione su dispositivi edge. Evidenziando le performance di modelli con requisiti computazionali ridotti come YOLOv9s, che combinano alta precisione con bassa latenza, offriamo linee guida concrete per lo sviluppo di sistemi di monitoraggio in quasi real-time e che ottimizzino la sicurezza e i flussi di produzione nei contesti industriali.
MATERIALE E METODI
Il presente lavoro di ricerca analizza l’impiego delle tecniche di deep learning e di visione artificiale con l’obiettivo di migliorare i livelli di sicurezza e ottimizzare l’efficienza operativa nel settore siderurgico, con particolare attenzione al contesto altamente critico degli EAF. A tal fine, è stata condotta un’attività sistematica di ottimizzazione
e valutazione di diversi algoritmi di object detection allo stato dell’arte, con l’obiettivo di analizzarne le prestazioni e l’efficacia in una serie di compiti di rilevamento ritenuti critici. Tali attività sono state progettate specificamente per rafforzare la sicurezza e migliorare l’efficienza dei processi operativi negli ambienti EAF.
Task selezionati
Sono state individuate tre attività fondamentali per rafforzare le misure di sicurezza e garantire un monitoraggio efficace dei processi operativi più critici all’interno dell’ambiente EAF. La loro selezione, tra diverse possibili alternative, è stata guidata dalla rilevanza e dalla criticità rispetto alle principali problematiche di sicurezza di un impianto EAF in esercizio. Le attività considerate sono le seguenti:
1. Rilevamento del personale: Uno degli obiettivi principali nello sviluppo di sistemi di visione artificiale per l’ambiente EAF è l’incremento della sicurezza dei lavoratori. A tal fine, i sistemi proposti sono in grado di attivare automaticamente un allarme sonoro o visivo quando un operatore viene rilevato all’interno di un’area operativa critica, segnalando tempestivamente una potenziale situazione di rischio. Questo compito di rilevamento, focalizzato su una singola classe identificata come persona, consente il monitoraggio continuo della presenza del personale. La Figura 1 mostra alcuni esempi rappresentativi dell’attività di rilevamento del personale in impianti EAF.
2. Monitoraggio delle pinze dell’elettrodo: Questa attività è finalizzata all’individuazione e al tracciamento della posizione delle pinze degli elettrodi, al fine di
garantire che il loro movimento all’interno del forno elettrico ad arco avvenga correttamente. Deviazioni o anomalie nel comportamento degli elettrodi possono infatti indicare guasti meccanici o malfunzionamenti operativi. Il sistema è progettato per segnalare tali irregolarità agli operatori in modo tempestivo, consentendo un intervento immediato. Anche in questo caso si tratta di un compito di rilevamento a singola classe, etichettata come pinza. La figura 2 riporta esempi del rilevamento delle pinze.
3. Identificazione del fumo nelle vicinanze degli elettrodi: La terza attività prevede il monitoraggio continuo delle emissioni nelle aree adiacenti agli elettrodi, con l’obiettivo di rilevare la presenza di fumo e individuare eventuali concentrazioni anomale. Un’identificazione precoce di tali condizioni è cruciale per riconoscere irregolarità o criticità nel processo EAF. Al superamento di soglie considerate pericolose, il sistema genera avvisi che permettono agli operatori di intervenire rapidamente, riducendo il rischio di escalation. Questa funzione è formulata come un compito di classificazione binaria, volto a distinguere tra la presenza e l’assenza di fumo. La Figura 3 presenta alcuni esempi visivi dell’attività di rilevamento del fumo. A differenza dei task precedenti, questo è formulato come classificazione binaria a livello di immagine, per la quale è stata sfruttata la modalità di classificazione nativa del framework Ultralytics, che supporta YOLO anche come classificatore puro (senza bounding box). Questa scelta garantisce uniformità tecnologica con gli altri task e semplifica il deployment sul dispositivo edge.
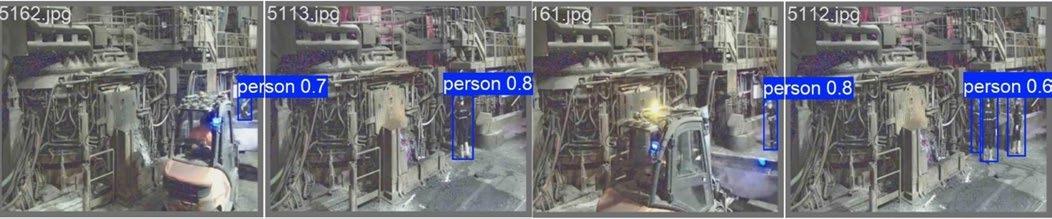
Fig.1 -Esempio di immagini inerenti al task di rilevamento delle persone in prossimità dell’EAF. La bounding box identifica l’oggetto della ricerca e fornisce una stima della probabilità di accuratezza della classificazione (nel range [0;1]) / Example images related to the task of detecting personnel in proximity to the EAF. The bounding box identifies the target object and provides an estimate of the classification confidence score (in the range [0, 1]).
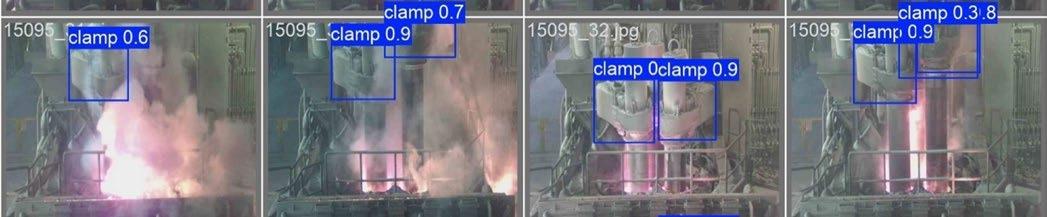
Fig.2 - Esempio di immagini inerenti al task di rilevamento della pinza degli elettrodi / Example images related to the task of detecting the electrode clamp.
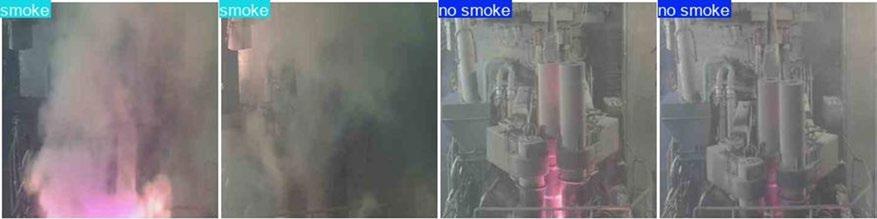
Fig.3 - Esempio di immagini inerenti il task di classificazione riguardo alla presenza di fumo in prossimità degli elettrodi. La label nell’immagine indica l’esito della classificazione / Example images related to the classification task concerning the presence of smoke in proximity to the electrodes. The label in the image indicates the classification outcome.
Per lo svolgimento di questo studio è stato utilizzato un dataset acquisito direttamente da un impianto EAF operativo. All’interno dell’impianto sono stati installati sistemi di monitoraggio comprendenti telecamere, microfoni e sensori aggiuntivi, impiegati per il controllo di diversi parametri di processo. ’’ Il dataset è stato acquisito nell’arco di circa un anno di funzionamento ordinario dell’impianto, coprendo in modo naturale le diverse condizioni operative tipicamente incontrate durante la produzione. Le immagini sono state annotate da un esperto operante all’interno dell’impianto siderurgico, con competenza diretta sui processi EAF; le annotazioni sono state successivamente revisionate da ulteriori esperti di impianto al fine di garantirne la qualità e la coerenza. Le condizioni ambientali riflettono fedelmente quelle di un impianto industriale reale: il posizionamento delle telecamere è stato determinato dai vincoli fisici e operativi del sito, e il dataset include inevitabilmente condizioni di variabilità ambientale quali presenza di polvere, vapore e variazioni di illuminazione, che possono influenzare la qualità delle
immagini. Queste condizioni, pur rappresentando una sfida per i modelli, costituiscono al contempo una garanzia di rappresentatività rispetto agli scenari operativi reali. Il numero di immagini disponibili per ciascuna attività è riportato in Tabella 1.
Al fine di garantire un addestramento accurato e una valutazione oggettiva e priva di bias dei modelli, il dataset è stato suddiviso casualmente, per ciascun task, in tre sottoinsiemi distinti: training, validazione e test. Le annotazioni finali così ottenute sono state quindi elaborate e rese disponibili per le successive fasi di addestramento e valutazione dei modelli.
Tab.1 - Numero di immagini disponibili per i diversi task / Number of available images for the different tasks.
Task
rilevamento
La figura 4 mostra la pipeline per l’addestramento e il testing dei modelli di visione artificiale utilizzati in questo lavoro. Il processo inizia con le immagini raccolte dalle telecamere presenti sull’impianto, che vengono annotate utilizzando uno strumento open-source. Il dataset annotato viene suddiviso in set di addestramento, validazione e test, con le suddivisioni di addestramento e validazione
utilizzate per l’addestramento del modello. Durante l’addestramento, un algoritmo di apprendimento identifica pattern nei dati, mentre il set di validazione aiuta a ottimizzare gli iperparametri e ad evitare l’overfitting, garantendo la generalizzazione su nuovi dati. Dopo l’addestramento, il modello viene sottoposto a ottimizzazione dei parametri per ridurre il tempo di inferenza.
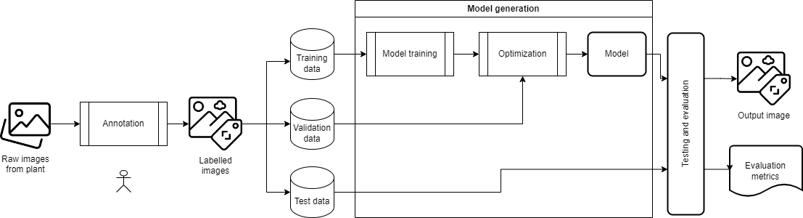
Fig.4 - Pipeline per l’addestramento e la valutazione dei modelli / Pipeline for the training and evaluation of the models.
CAMPAGNA SPERIMENTALE
Per l’attività sperimentale, si è proceduto con l’addestramento di diverse varianti del modello YOLO (dalle versioni 8 alla 11) e di RT-DETR, sfruttando il framework Ultralytics. Contemporaneamente, sono stati addestrati RetinaNet, Mask R-CNN, Faster R-CNN e Cascade R-CNN, utilizzando il framework Detectron2 [13]. Per il task riguardante la detezione del fumo si è utilizzata la modalità classify anziché detect resa disponibile dal framework utilizzato. Tali modelli sono stati poi sottoposti a valutazione su un dataset personalizzato.
I modelli YOLO sono stati addestrati per un totale di 20 epochs, adottando una learning rate iniziale di 0.01. Per gli altri modelli, che comprendono Faster R-CNN, Mask R-CNN, RetinaNet e Cascade R-CNN, è stato impiegato l’ottimizzatore AdamW [14] con una learning rate fissata a 0.002. L’addestramento di questi modelli è stato esteso per 1500 epochs, garantendo un numero sufficiente di cicli per apprendere le strutture complesse presenti nei dati. Durante la fase di addestramento sono state applicate tecniche di aumento dei dati (data augmentation), come ResizeShortestEdge, per accrescere la robustezza
dei modelli. È importante sottolineare che il numero di epochs non è direttamente confrontabile tra i due framework: i modelli YOLO, addestrati tramite Ultralytics, beneficiano di tecniche di data augmentation integrate e di una strategia di apprendimento ottimizzata che favorisce una convergenza rapida. L’analisi delle curve di loss ha confermato che 20 epochs erano sufficienti per raggiungere la convergenza sui dataset utilizzati. Per i modelli Detectron2 (Faster R-CNN, Mask R-CNN, RetinaNet e Cascade R-CNN), il numero maggiore di epochs riflette le differenze intrinseche nell’architettura di training del framework. Gli esperimenti sono stati eseguiti su un sistema di calcolo ad alte prestazioni, operativo su ambiente Ubuntu e dotato di una GPU NVIDIA GeForce RTX 3090 e 24 GB di RAM. Ciò ha assicurato un addestramento efficiente e la possibilità di effettuare l’inferenza in tempo reale per le attività di deep learning. Per lo sviluppo dei modelli YOLO sono stati utilizzati Python 3.10.5 e PyTorch 2.5.1, mentre l’implementazione dei modelli Detectron2 è avvenuta con Python 3.9.21 e PyTorch 2.5.1 con supporto CUDA, necessario per gestire le esigenze computazionali di dataset estesi e architetture complesse. In conformità con il protocollo di valutazione adottato da Lan in [2] e che è ormai uno standard, si è fatto ricorso alla mean Average Precision (mAP), alla precisione, al recall e all’F1 score come metriche di valutazione principali [15].
RISULTATI
In questa sezione, vengono presentati i risultati conseguiti per i tre task che sono stati trattati. L’analisi condotta considera sia l’accuratezza delle prestazioni ottenute dai modelli, sia la loro effettiva applicabilità all’interno di un contesto industriale. Nel quadro generale delle valutazioni, si è osservato che i modelli appartenenti alla famiglia YOLO hanno fornito performance di alta qualità se confrontati con altre architetture di deep learning. Di conseguenza, si è proceduto alla valutazione sia della rapidità di esecuzione dei modelli sia della loro accuratezza.
Test dei modelli in quasi real-time
La tabella 2 riporta i tempi necessari per l’inferenza, misurati direttamente sul sistema destinato all’utilizzo dei modelli nell’ambiente industriale.
A seguito di un processo di ottimizzazione, il modello
YOLOv9s è stato convertito nel formato TensorFlow Lite (TFLite), rendendolo idoneo per un’implementazione efficiente su dispositivi edge. Per consentire la previsione in quasi real-time, è stata creata un’applicazione in Python che sfrutta RabbitMQ RPC ed è stata inclusa in un container Docker per facilitarne la scalabilità. Il modello è stato quindi installato su un dispositivo Tenova EDGE con un processore Intel® Celeron® J3455, 8 GB di RAM e sistema operativo AdvLinuxTU, configurando l’ambiente ideale per il monitoraggio della sicurezza. I tempi di inferenza riportati in Tabella 2 sono stati misurati direttamente sul dispositivo Tenova EDGE (Intel® Celeron® J3455, 8 GB di RAM), con i modelli convertiti in formato TensorFlow Lite (TFLite) per ottimizzarne l’esecuzione su hardware privo di GPU dedicata. Le differenze nei tempi di inferenza tra modelli della stessa famiglia riflettono le specifiche scelte architetturali: ad esempio, YOLOv9s presenta tempi superiori a YOLOv8s in ragione dell’introduzione dei meccanismi PGI (Programmable Gradient Information) e GELAN (Generalized Efficient Layer Aggregation Network), che aumentano la capacità rappresentativa del modello a fronte di un moderato incremento del costo computazionale. I tempi includono la fase di inferenza sul singolo frame; preprocessing e postprocessing sono gestiti dall’applicazione Python containerizzata tramite RabbitMQ RPC.
La sinergia tra l’architettura leggera del modello e la sua implementazione ottimizzata su hardware edge fa sì che YOLOv9s possa garantire sia un’inferenza ad alta velocità che prestazioni affidabili per le funzioni di sicurezza critiche in contesti produttivi. Questa specifica configurazione offre una soluzione concreta per l’identificazione automatizzata dei pericoli e la risposta immediata, aspetti vitali per minimizzare i rischi in ambienti come i forni elettrici ad arco, dove la rapidità nel prendere decisioni è essenziale. La possibilità di estendere il sistema a molteplici dispositivi assicura flessibilità nelle operazioni industriali, garantendo la sorveglianza continua dei principali parametri di sicurezza.
Tab.2 -Tempi di inferenza ottenuti nei task di object detection / Inference times for the object detection tasks.
RISULTATI DI RICONOSCIMENTO E DETEZIONE
Oltre alla velocità di inferenza, è stata valutata l’accuratezza dei modelli, verificando che le prestazioni di rilevamento fossero adeguate ai requisiti di sicurezza operativa in quasi real-time tipici dell’industria siderurgica. Nel complesso, i modelli analizzati hanno mostrato risultati molto soddisfacenti, come sintetizzato di seguito.
1. Rilevamento delle Persone: Per questa attività, finalizzata alla tutela dei lavoratori nelle aree ad alto rischio dell’EAF, YOLOv9s si è distinto come il modello più efficace. Esso ha raggiunto un mAP50–95 pari a 0.6174, con valori elevati di mAP50 (0.9610), precision (0.9375) e recall (0.8906), garantendo al contempo un tempo di inferenza di soli 9.8 ms per immagine. Que-
sto equilibrio tra accuratezza e rapidità lo rende particolarmente adatto ad applicazioni di sicurezza industriale. Altri modelli, come RT-DETR-l e RT-DETR-x, hanno mostrato buone prestazioni in termini di accuratezza, ma con tempi di risposta più elevati, meno compatibili con scenari operativi urgenti. I rilevatori a due stadi, caratterizzati da inferenza più lenta e minore precisione, risultano invece meno idonei per contesti industriali critici.
2. Risultati del Rilevamento della posizione delle pinze degli elettrodi: Nel monitoraggio delle pinze degli elettrodi, essenziale per il corretto e sicuro funzionamento dell’EAF, YOLOv9s ha nuovamente ottenuto le migliori prestazioni. Il modello ha registrato un
mAP50–95 di 0.8616, con valori prossimi all’unità per mAP50, mAP75, precision e recall, e un tempo di inferenza di 9.8 ms. Tali risultati evidenziano un’elevata affidabilità nel localizzare le pinze con un numero minimo di falsi positivi. Sebbene altri modelli abbiano mostrato prestazioni competitive, YOLOv9s ha garantito il miglior compromesso tra accuratezza e velocità, risultando la scelta più adatta per il monitoraggio in quasi real-time.
3. Rilevamento del fumo: Per il rilevamento del fumo è stato adottato un approccio di classificazione, utilizzando YOLO11s. Il modello ha raggiunto un’accura-
tezza del 92.55% e un punteggio di fitness (un indice globale in [0;1] utilizzato dai modelli YOLO per quantificare la bontà delle prestazioni di un modello) pari a 0.96 con precision di 0.98, recall di 0.97 e F1-score di 0.98, confermando un’elevata capacità di identificare correttamente la presenza di fumo con un numero contenuto di falsi negativi.. Sebbene le prestazioni siano complessivamente soddisfacenti, rimane un margine di miglioramento, particolarmente rilevante in contesti industriali critici in cui l’individuazione precoce delle anomalie è fondamentale per la sicurezza.
Tab.3 -Risultati ottenuti nel task di rilevamento delle persone / Results achieved on the person detection task.
Tab.4 - Risultati ottenuti nel task di rilevamento delle pinze gli elettrodi / Results obtained on the electrodes clamp detection task.
In questo lavoro è stata presentata EAFvision, una pipeline progettata per la valutazione e l’ottimizzazione di modelli di visione artificiale allo stato dell’arte applicati a compiti di rilevamento critici per la sicurezza nei forni elettrici ad arco. I risultati sperimentali hanno evidenziato come le architetture della famiglia YOLO, e in particolare YOLOv9s, si collochino tra le soluzioni più efficaci in termini di accuratezza, robustezza e velocità di inferenza, requisiti fondamentali per applicazioni industriali in tempo reale. Tuttavia, questa versione di EAFVision che sfrutta il framework Ultralytics non è stata ancora integrata nella linea di produzione e ulteriori valutazioni sul funzionamento
dovranno essere fatte in tale frangente.
YOLOv9s si è affermato come una delle soluzioni più efficaci per attività chiave quali il rilevamento del personale, il monitoraggio delle pinze degli elettrodi e l’identificazione del fumo, raggiungendo risultati comparabili o superiori agli altri modelli testati e garantendo un eccellente compromesso tra precisione e tempi di risposta.’Il confronto con modelli concorrenti, tra cui YOLOv8, RT-DETR e i rilevatori a due stadi (Faster R-CNN, Mask R-CNN e Cascade R-CNN), ha confermato che le architetture YOLO risultano particolarmente adatte a contesti operativi critici, dove l’elaborazione rapida delle informazioni è determinante per prevenire situazioni di rischio. In particolare, le pre-
stazioni di YOLOv9s nel rilevamento del personale in aree pericolose evidenziano il suo potenziale nel supportare interventi tempestivi e nel ridurre il rischio di incidenti. Il presente studio presenta alcune limitazioni che è opportuno riconoscere. Il dataset relativo al task di identificazione del fumo, composto da 429 immagini di training, è il più ridotto tra quelli considerati e potrebbe limitare la capacità di generalizzazione del modello a condizioni non rappresentate. Inoltre, tutti i dati sono stati acquisiti presso un singolo impianto EAF: la trasferibilità dei modelli ad altri contesti produttivi con caratteristiche impiantistiche o operative diverse rimane da verificare. Dal punto di vista della valutazione, i modelli sono stati testati su immagini statiche; la consistenza temporale delle predizioni su flussi video continui, rilevante per un sistema di monitoraggio in quasi real-time, non è stata oggetto di analisi sistematica.
Nel complesso, questo studio sperimentale dimostra il forte potenziale delle tecnologie di intelligenza artificiale e visione artificiale nel migliorare sia la sicurezza sia l’efficienza operativa nel settore siderurgico. Le prospettive future includono l’ulteriore ottimizzazione della pipeline
EAFvision, l’integrazione di nuove fonti sensoriali e l’estensione a ulteriori task critici per la sicurezza e il controllo di processo. Tali sviluppi mirano alla realizzazione di sistemi di monitoraggio intelligenti e pienamente automatizzati, capaci di supportare in modo affidabile la produzione dell’acciaio in ambienti industriali complessi e ad alto rischio.
Il lavoro descritto nel presente articolo è stato sviluppato nell’ambito del progetto dal titolo “Remote expert virtual system enhancing human management capabilities that favors preservation, transfer, and continuous evolution of knowledge for steelmaking operations” (Ref. ISteel-Expert, Grant Agreement No. 101112102), finanziato dall’Unione Europea tramite il “Research Fund for Coal and Steel (RFCS)”, che gli Autori ringraziano. La responsabilità esclusiva delle questioni trattate nel presente lavoro è degli autori; l’Unione Europea non è responsabile per l’uso che può essere fatto delle informazioni ivi contenute.
[1] H NORDLOF, B. WIITAVAARA, U. WINBLAD, K. WIJK, R. WESTERLING Safety culture and reasons for risk-taking at a large steelmanufacturing company: Investigating the worker perspective, Safety Science, vol. 73, pp. 126–135, 2015.
[2] R. LAN, I. AWOLUSI, J. CAI Computer vision for safety management in the steel industry, AI, vol. 5, no. 3, pp. 1192–1215, 2024
[3] S. REN, K. HE, R. GIRSHICK, J. SUN Faster r-cnn: Towards real-time object detection with region proposal networks, IEEE transactions on pattern analysis and machine intelligence, vol. 39, no. 6, pp. 1137–1149, 2016.
[4] K. HE, G. GKIOXARI, P. DOLLAR, R. GIRSHICK Mask r-cnn, Proceedings of the IEEE international conference on computer vision, 2017, pp. 2961–2969.
[5] Z. CAI, N. VASCONCELOS Cascade r-cnn: Delving into high quality object detection,” in Proceedings of the IEEE conference on computer vision and pattern recognition, 2018, pp. 6154–6162.
[6] G. JOCHER, A. CHAURASIA, J. QIU Ultralytics yolov8, 2023 .[Online]. Available: https://github.com/ultralytics/ultralytics
[7] C.-Y. WANG AND H.-Y. M. LIAO Yolov9: Learning what you want to learn using programmable gradient information, European conference on computer vision. Springer Nature Switzerland, 2024.
[8] L. L. AO WANG, HUI CHEN Yolov10: Real-time end-to-end object detection, arXiv preprint arXiv:2405.14458, 2024
[9] G. JOCHER, J. QIU Ultralytics yolo11, 2024. [Online]. Available: https://github.com/ultralytics/ultralytics
[10] T.-Y. LIN, P. GOYAL, R. GIRSHICK, K. HE, P. DOLLAR Focal loss for dense object detection, Proceedings of the IEEE international conference on computer vision, 2017, pp. 2980–2988.
[11] N. CARION, F. MASSA, G. SYNNAEVE, N. USUNIER, A. KIRILLOV, S. ZAGORUYKO End-to-end object detection with transformers, European conference on computer vision. Springer, 2020, pp. 213-229.
[12] Y. ZHAO, W. LV, S. XU, J. WEI, G. WANG, Q. DANG, Y. LIU, J. CHEN Detrs beat yolos on real-time object detection, Proceedings of the IEEE/CVF conference on computer vision and pattern recognition, 2024, pp. 16 965–16 974
[13] Y. WU, A. KIRILLOV, F. MASSA, W.-Y. LO, R. GIRSHICK Detectron2, https://github.com/facebookresearch/detectron2, 2019.
[14] I. LOSHCHILOV, F. HUTTER Decoupled weight decay regularization, in International Conference on Learning Representations, arXiv preprint arXiv:1711.05101, 2017.
[15] R. PADILLA, S. NETTO, E. DA SILVA, A survey on performance metrics for object-detection algorithms. In: 2020 international conference on systems, signals and image processing (IWSSIP). IEEE, 2020. p. 237-242.
The iSteel-Expert project introduces an innovative AI-based monitoring and safety system specifically designed for Electric Arc Furnace operations in steel plants. The system integrates a network of sensors and cameras with a real-time data collection platform, utilizing advanced deep learning models to automate the precise detection and classification of critical events and safety conditions within the furnace environment. This innovative approach significantly enhances both operational safety standards and overall process efficiency.
The monitoring framework focuses on several key operational aspects: person detection in the furnace area to assess human exposure and operator compliance with established procedures, slag door status monitoring to verify process compliance during the heat, continuous tracking of electrode arm movement through clamp position detection to identify anomalies that may require corrections or maintenance interventions, and detection of vapor, fumes, and flames to ensure environmental and operational safety.
A comprehensive dataset of approximately 5000 images was collected for model training and validation. The system demonstrated excellent performance, achieving accuracy exceeding 90% for furnace tilt and smoke detection, with high precision, recall, and F1-scores in object detection tasks.
KEYWORDS: EAF; SAFETY IMAGE PROCESSING; DEEP LEARNING; ARTIFICIAL INTELLIGENCE.
As an integral element of the event, the Conference will feature an exhibition, that will enable excellent exposure for products, technologies, innovative solutions or services. At this opportunity the Organizers will set an area strategically located as regards the main Conference rooms. More information will be soon available at the Conference website. For any further information please contact Siderweb - The Italian Steel Community: commerciale@siderweb.com . tel. +39 030 2540006
Organised by

With the support of
This study investigates the influence of solution pumping speed and ultrasonic wave amplitude on the properties of iron nanoparticles synthesized via the borohydride reduction method of iron (II) sulfate (FeSO4) and iron (III) chloride (FeCl3) precursor solutions. The results indicate that combining a high-amplitude ultrasonic wave with a high NaBH4 solution pumping speed yields nanoparticles with an optimal size distribution and improved dispersion in both cases. Iron nanoparticles synthesized from iron (II) sulfate (FeSO4) exhibited better size uniformity and dispersion compared to those synthesized from iron (III) chloride (FeCl3). In both cases, the iron nanoparticles obtained from the borohydride reactions formed relatively dense, irregularly shaped clusters with sizes ranging from 53 to 72 nm.
KEYWORDS: NANOPARTICLE; IRON; ULTRASONIC CAVITATION; SOLUTION PUMPING SPEED; BOROHYDRIDE METHOD.
The significant interest of the scientific and technical community in nanostructured systems stems from their unique properties, structural diversity, and practical applications. Among various nanopowders, iron (Fe) nanoparticles have been widely utilized in science, engineering, and technology. For instance, they serve as effective magnetic adsorbents for soil remediation and wastewater treatment, efficiently removing toxic pollutants [1-10]. Due to their large specific surface area, high adsorption capacity, low cost, environmental safety, and rapid reactivity, Fe nanoparticles are particularly suitable for purifying contaminated water [11]. Additionally, they are used as nano-modifiers in powder metallurgy to produce bulk materials (Fe-based) or as raw materials for 3D metal printing and are applied in many different fields of science and technology [12-16].
Metallurgia.
Fe nanopowders are typically synthesized using either physical or chemical methods. While physical approaches require expensive equipment, chemical methods often suffer from low productivity and high energy consumption [11, 12]. For example, the chemical-metallurgical method employed by the authors to synthesize
iron-group nanoparticles offers advantages such as scalability at the laboratory level and relatively clean products. However, its efficiency is limited by the slow reduction rate in hydrogen gas during the heat-holding stage. Moreover, excessive reduction temperatures can lead to severe nanoparticle agglomeration, resulting in particles exceeding the nanoscale. Additionally, the multi-step process requires substantial energy input [17-18]. Alternatively, studies have demonstrated that transition metal nanoparticles can be synthesized via the borohydride method. Although fundamentally a chemical approach, this technique offers distinct advantages: it is simple, involves fewer steps, and reduces energy costs by directly converting metal salt solutions into nanoparticles using borohydride (BH4 ), without the need for high-temperature pyrolysis or multi-stage reduction [19, 20].
Given these findings, the borohydride method is a viable route for synthesizing Fe nanopowders. Although this method has been used, current studies have mostly focused on selecting precursors for the chemical reaction without systematically investigating the simultaneous influence of the pumping speed of the solution and ultrasonic wave amplitude on the size and dispersion of the iron nanoparticles. The novelty of this study resides in the combination of high-amplitude ultrasonic and a
high pumping speed of the solution for the synthesis of iron nanoparticles, irrespective of whether the precursor salt is Fe2+(FeSO4) or Fe3+(FeCl3). The optimal parameters established in this study allow the method to be scaled up for the preparation of iron nanoparticles beyond the laboratory scale, with fewer intermediate synthesis steps.
Iron nanoparticles were synthesized via borohydride reduction using two precursor salts: iron (II) sulfate heptahydrate (FeSO4·7H2O) and iron (III) chloride hexahydrate (FeCl3·6H2O). Sodium borohydride (NaBH4) was used as the reducing agent. Prior to the reduction reactions, aqueous solutions of both iron salts (5 wt.%) were freshly prepared.
The experimental setup included a Hielscher UIP1000hd ultrasonic disperser, a pumping system comprising a KNF N 816.3 KT.18 vacuum diaphragm pump and a Heidolph PD 5201 peristaltic pump, together with standard laboratory glassware. A schematic diagram of the synthesis apparatus is presented in figure 1.
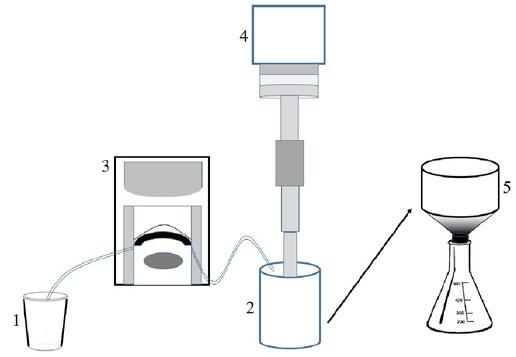
(1) NaBH4 solution;(2)ReactorcontainingFeSO4/FeCl3 solutions;(3)Pumpingsystem; (4)Ultrasonicdisperser;(5)Büchnerfunnelandflask
Fig.1 -Schematic of iron nanoparticle synthesis by borohydride method.
To optimize the synthesis parameters for iron nanoparticles via the borohydride method, the effects of two process variables were investigated: the pumping speed of the NaBH4 solution - V(NaBH4) and ultrasonic wave amplitude - AU. The experimental parameters are summarized in table 1.
Tab.1 - Experimental parameters.
Sample
The borohydride reduction reactions proceed according to the following equations:
FeSO4 + 2·NaBH4 + 6·H2O → Fe↓ + Na2SO4 + 2·B(OH)3 + 7·H2↑, (1)
2·FeCl3 + 6·NaBH4 + 18·H2O → 2·Fe↓ + 6NaCl + 6·B(OH)3 + 21·H2↑, (2)
During the synthesis process, ultrasonic mixing was employed to homogenize the reactant solution, as well as to disperse the aggregates of the forming Fe nanoparticles. The resulting precipitate (Fe nanoparticles) was washed with distilled water via the Büchner funnel and flask. Subsequently, the powders were ground using a Fritsch Pulverisette 2 grinder (Germany).
Particle size distributions were determined using dynamic light scattering (Malvern Zetasizer Nano ZS, UK). Specific surface areas were measured via nitrogen adsorption isotherms using the BET method (Nova 1200e analyzer, USA). The average particle diameter (Dₐ) was calculated from surface area measurements using the formula:
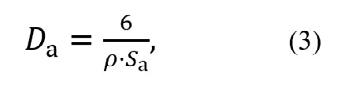
where ρ represents the theoretical density of iron (7870 kg/m³) and Sₐ denotes the specific surface area (m²/kg).
Phase composition was analyzed by X-ray diffraction (XRD) using a Difrey-401 diffractometer (Russia) with Cu-Kα radiation. Morphological characterization was performed using scanning electron microscopy (SEM) on a Tescan Vega 3B instrument (Czech Republic).
After preparing six Fe nanoparticle samples (both Series 1 and 2) according to the experimental procedure outlined in table 1, the particle size distribution of these samples was analyzed using dynamic light scattering (DLS). The
results are presented in figures 2 and 3.
Analysis of the Fe nanoparticle size distribution diagrams (figures 2 and 3) revealed some important findings, namely: The widest particle distribution was observed in samples №3 (1.3 and 2.3 - with lower solution pumping speed value: V(NaBH4) = 1.9 ml/min), while samples №2 (1.2 and 2.2 - with higher solution pumping speed value: V(NaBH4) = 3.8 ml/min and larger ultrasonic wave amplitude AU = 80 μ) showed the smallest maximum particle size. For both sample series, decreasing the solution pumping speed tended to broaden the particle distribution, while increasing the ultrasonic wave amplitude resulted in smaller maximum particle sizes.
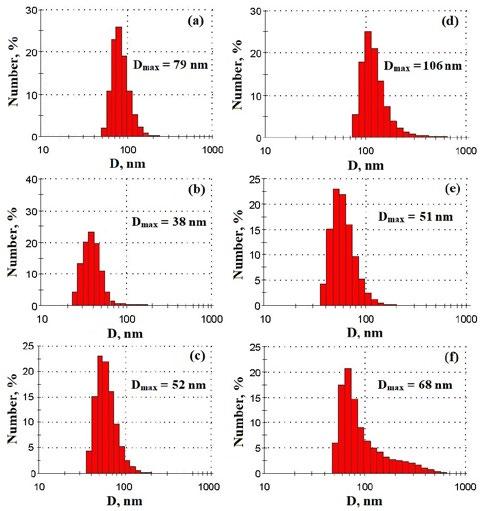
- Plot of the maximum particle size distribution depending on the concentration of NaBH4 samples: 1.1 (a); 1.2 (b); 1.3 (c); 2.1 (d); 2.2 (e); 2.3 (f).
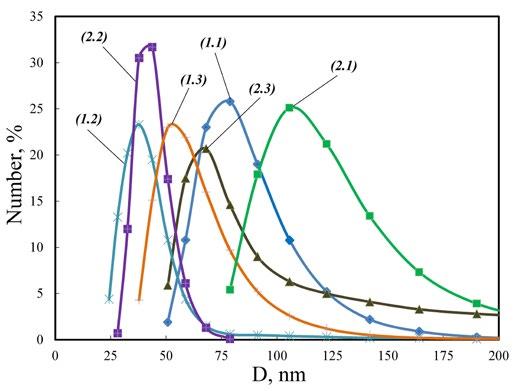
- Particle size distribution graph of the jointly studied samples.
This phenomenon can be attributed to the fact that a high NaBH4 solution pumping speed, when reacting with iron (II) and iron (III) salts, increases the nucleation rate. As a result, more nucleation centers are formed, leading to a larger number of nascent nanoparticles and consequently limiting their growth space, which results in smaller nanoparticles. In the case of high-amplitude ultrasonic waves, the increased energy input likely disrupts crystalline clusters, thereby promoting the formation of smaller particles and enhancing their dispersion.
Moreover, several studies have shown that low-concentra-
tion iron salt precursors (5-10 wt.%) are effective for producing metal nanoparticles. However, in borohydride reduction, although a high NaBH4 pumping speed improves reaction kinetics, an excessive amount may lead to an overabundance of NaBH4—an active foaming agent—which increases the viscosity of the solution and impedes crystal nucleation.
Furthermore, the results clearly demonstrate that combining a high-amplitude ultrasonic wave with a high NaBH4 solution pumping speed (samples №2, i.e., 1.2 and 2.2) yields nanoparticles with the most favorable size and disper-
sion in both precursor cases. A comparison between samples №1 (1.1 and 2.1), №2 (1.2 and 2.2) and №3 (1.3 and 2.3) indicates that variations in ultrasonic wave amplitude have a more pronounced impact on particle size than changes in solution pumping speed.
When comparing Series 1 samples (1.1, 1.2, 1.3), synthesized using FeSO4, with Series 2 samples (2.1, 2.2, 2.3), synthesized using FeCl3 as the precursor, it is evident that Series 1 exhibits better nanoparticle size and dispersion. This can be attributed to the fact that the reduction of Fe2+ ions (from FeSO4) to metallic iron nanocrystals is more straightforward than the reduction of Fe3+ ions (from FeCl3). The reduction of Fe3+ to Fe typically proceeds in two steps: the initial forma-
tion of Fe2+, followed by the reduction to Fe, as illustrated in the reactions below:
Fe3+ + e → Fe2+ (4)
Fe2+ + 2e → Fe (5)
Based on the evaluation of the particle size distribution graphs of the synthesized nanoparticles, samples №2 (1.2 and 2.2), representing both iron (II) and iron (III) salt precursors, were selected for further characterization studies, as they exhibited the best dispersion and particle size distribution. The XRD results of these two samples, along with elemental analysis by EDX from SEM images, are presented in figure 4.
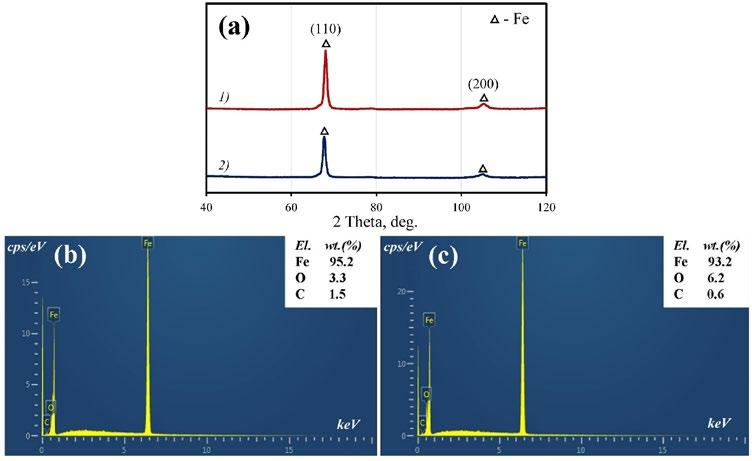
Results from the XRD analysis (figure 4a) show diffraction peaks corresponding to the (110) and (200) planes of the pure α-Fe metallic phase, in accordance with JCPDS file no. 65-4899. No additional phases or impurities were detected in the XRD patterns.
Elemental analysis by the EDX from SEM image data (figures 4b, 4c) reveals a small amount of carbon in the samples, which is attributed to the carbon substrate used during sample preparation. A detectable amount of oxygen (ranging from 3.3% to 6.2%) is also present. This is expected, as a small portion of Fe nanoparticles can oxidize during the borohydride synthesis process when no inert gas environment is maintained.
The presence of oxygen detected by the EDX, coupled with its absence in the XRD analysis, suggests that the oxide layer formed during synthesis is either amorphous or present as an extremely thin crystalline layer. Consequently, this layer lacks sufficient structural order to generate detectable diffraction peaks in the XRD pattern [21-23].
SEM images of the two nanoparticle samples (1.2 and 2.2), synthesized via the borohydride method from iron (II) and iron (III) salt solutions, respectively, along with their particle size distributions (derived from SEM image data), are presented in figure 5. In addition, the specific surface area analysis and the corresponding calculated particle sizes (based on these measurements) are summarized in table 2.
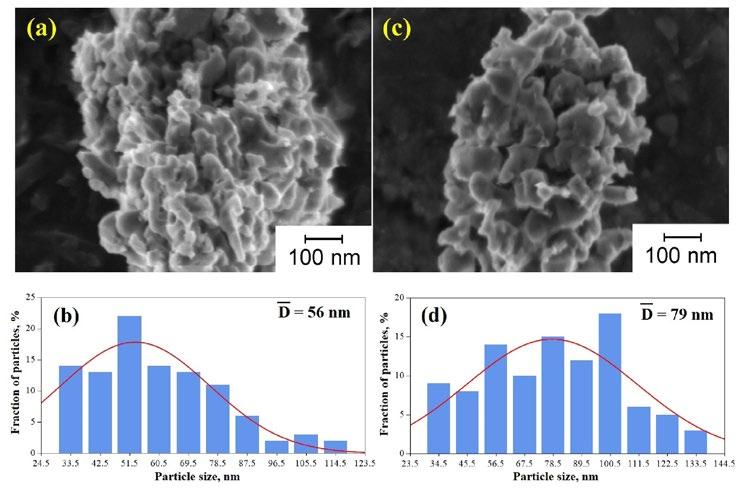
b) Sample 1.2; (c, d) Sample 2.2
Fig.5 - SEM-images and Particle size distribution of the samples.
Tab.2 - Specific surface area and particle size calculation results.
Sample Sa, m2/g Da, nm DSEM, nm |D|, nm Dmax(DLS), nm № 1.2 (FeSO4 + NaBH4)
In both cases, the obtained Fe nanoparticles form relatively dense clusters with undefined shapes. When reducing the iron (II) salt solution (FeSO 4) using the borohydride method, the resulting nanoparticles have a smaller average size (53 nm) compared to those obtained from the reduction of the iron (III) salt solution (FeCl 3), which average around 72 nm.
Although DLS typically measures larger hydrodynamic diameters due to the inclusion of the solvation layer, the observed differences between Dmax(DLS) and DBET/DSEM in this study can be rationalized as follows. DLS is conducted on suspensions prepared by dispersing the powder in a liquid using high-intensity ultrasound, which breaks down clusters into individual particles or small agglomerates, leading to smaller recorded sizes. Conversely, BET and SEM are performed on dry powder samples, where drying and grinding promote aggregation into larger, dense clusters, resulting in larger measured diameters. Hence, the results are fully consistent with one another.
Six iron nanoparticle samples, divided into two series, were synthesized via the borohydride method using two different precursors (FeSO4 and FeCl3), with variations in solution pumping speed and ultrasonic wave amplitude. It was found that the combination of a high-amplitude ultrasonic wave and a high NaBH4 solution pumping speed yielded nanoparticles with optimal size and dispersion in both cases.
When iron (II) sulfate (FeSO4) was used as the precursor, the resulting nanoparticles exhibited better size and dispersion compared to those synthesized from iron (III) chloride (FeCl3).
In both cases, the Fe nanoparticles obtained via the borohydride reduction formed relatively dense clusters with irregular shapes, and their sizes ranged from 53 to 72 nm.
[1] B. Bhushan, Springer Handbook of Nanotechnology, 4th edition. Springer Berlin Heidelberg, Germany, 1500 p., 2017.
[2] D. I. Ryzhonkov, V. V. Levina, E. L. Dzidziguri, Nanomaterialy: Uchebnoe posobie (Nanomaterials: Textbook), Moscow: BINOM, Laboratoriya Znanii, Russia, 365 p., 2008.
[3] V. Tavallali, M. Kiani, S. Hojati, “Iron nano-complexes and iron chelate improve biological activities of sweet basil (Ocimum basilicum L.),” Plant Physiology and Biochemistry, 2019, vol. 144, p. 445. https://doi.org/10.1016/j.plaphy.2019.10.021
[4] Ł. Nagi, A. Płużek, “Electrical Strength of Natural Esters Doped by Iron Nanopowder in a Hydrophobic Carbon Shell,” Materials, 2020, vol. 13, art. 1956. https://doi.org/10.3390/ma13081956
[5] Y. P. Sun, X. Li, J. Cao, W. X. Zhang, H. P. Wang, “Characterization of zero-valent iron nanoparticles,” Advances in Colloid and Interface Science, 2006, vol. 120 (1-3), p. 47. https://doi.org/10.1016/j.cis.2006.03.001
[6] Q. J. Rasheed, K. Pandian, K. Muthukumar, “Treatment of petroleum refinery wastewater by ultrasounddispersed nanoscale zerovalent iron particles,” Ultrasonics Sonochemistry, 2011, vol. 18(5), p. 1138. https://doi.org/10.1016/j.ultsonch.2011.03.015
[7] S. S. Chen, D. H. Hong, C. W. Li, “A new method to produce nanoscale iron for nitrate removal,” Journal of Nanoparticle Research, 2005, vol. 6, p. 639. https://doi.org/10.1007/s11051-004-6672-2
[8] J. Noma, H. Abe, T. Kikuchi, J. Furusho, M. Naito, “Magnetorheology of colloidal dispersion containing Fe nanoparticles synthesized by arc-plasma method,” Journal of Magnetism and Magnetic Materials, 2010, no. 322, p. 1868. https://doi.org/10.1016/j. jmmm.2009.12.043
[9] S. Veintemillas-Verdaguer, O. Bomati, M. P. Morales, P. E. Di Nunzio, S. Martelli, “Iron ultrafine nanoparticles prepared by aerosol laser pyrolysis,” Materials Letters, 2003, vol. 57(5-6), p. 1184. https://doi.org/10.1016/S0167-577X(02)00953-9
[10] M. Bystrzejewski, “Synthesis of carbon-encapsulated iron nanoparticles via solid state reduction of iron oxide nanoparticles,” Journal of Solid State Chemistry, 2011, vol. 184(6), p. 1492. https://doi.org/10.1016/j.jssc.2011.04.018
[11] T. H. Nguyen, V. M. Nguyen, “Kinetics of synthesizing process for obtaining iron nanopowder by chemical-metallurgical method under isothermal conditions,” Chernye Metally, 2021, no. 1, p. 72. https://doi.org/10.17580/chm.2021.01.11
[12] T. H. Nguyen, V. M. Nguyen, M. H. Nguyen, V. N. Danchuk, “Preparation procedure to obtain iron nanopowder under non-isothermal conditions,” Journal of the Belarusian State University Chemistry, 2021, no. 1, p. 28. https://doi.org/10.33581/2520-257X-2021-1-28-35
[13] W. X. Zhang, “Nanoscale Iron Particles for Environmental Remediation: An Overview,” Journal of Nanoparticle Research, 2003, vol. 5, p. 323. https://doi.org/10.1023/A:1025520116015
[14] V. M. Nguyen, G. Karunakaran, T. H. Nguyen, E. A. Kolesnikov, M. I. Alymov, V. V. Levina, Y. V. Konyukhov, “Enhancement of structural and mechanical properties of Fe+0.5 %C steel powder alloy via incorporation of Ni and Co nanoparticles,” Letters on Materials, 2020, vol. 10, no. 2, p. 174. https://doi.org/10.22226/2410-3535-2020-2-174-178
[15] T. H. Nguyen, V. M. Nguyen “The effect of surfactants on the particle size of iron, cobalt and nickel nanopowders,” Powder Metallurgy аnd Functional Coatings, 2020, no. 1, p. 22. https://doi.org/10.17073/1997-308X-2020-22-28
[16] A. Koshanova, G. Partizan, B. Мansurov, B. Мedyanova, M. Mansurova, B. Aliev, X. Jiang, “Synthesis of carbon nanostructures on iron nanopowders,” Journal of Physics: Conference Series, 2016, vol. 741, no. 012017. https://doi.org/10.1088/1742-6596/741/1/012017
[17] V. M. Nguyen, T. H. Nguyen, “Investigation of the Process of Synthesizing Nanosized Nickel Powders by Hydrogen Reduction under Nonisothermal Conditions,” Metallurgist, 2021, vol. 65(1-2), p. 206. https://doi.org/10.1007/s11015-021-01149-2
[18] T. H. Nguyen, N. V. Minh, V. N. Danchuk, M. H. Nguyen, H. V. Nguyen, X. D. Tang, “Kinetic Characteristics of the Process of Synthesis of Nickel Nanopowder by the Chemical Metallurgy Method,” Nanotechnologies in Russia, 2020, vol. 15(2), p. 146. https://doi. org/10.1134/S1995078020020160
[19] Y. V. Konyukhov, “Heavy-Metal Extraction from Wastewater by Means of Iron Nanopowder,” Steel in Translation, 2018, 48(2), p. 135. https://doi.org/10.3103/S0967091218020080
[20] A. A. Kuzharov, A. A. Milov, Y. S. Gerasina, I. Yu. Neverov, M. S. Lipkin, V. M. Lipkin, A. S. Kolomiitsev, A. A. Fedotov, M. A. Soldatov, A. V. Soldatov, “The Influence of Stabilizer on the Formation and Tribotechnical Properties of Cu Nanoparticles,” Protection of Metals and Physical Chemistry of Surfaces, 2019, vol. 55, p. 283. https://doi.org/10.1134/S2070205119020151
[21] L. M. Moreau, D. H. Ha, H. Zhang, R. Hovden, D. A. Muller, R. D. Robinson, “Defining Crystalline/Amorphous Phases of Nanoparticles through X-ray Absorption Spectroscopy and X-ray Diffraction: The Case of Nickel Phosphide,” Chemistry of Materials, 2013, vol. 25 (12), p. 2394. https://doi.org/10.1021/cm303490
[22] E. V. Zakharova, E. L. Dzidziguri, E. N. Sidorova, A. A. Vasiliev, I. A. Pelevin, D. Y. Ozherelkov, A. Y. Nalivaiko, A. A. Gromov, “Characterization of Multiphase Oxide Layer Formation on Micro and Nanoscale Iron Particles,” Metals, 2021, vol. 11(1), art. 12, https://doi.org/10.3390/met11010012
[23] S. Muthukrishnan, S. Bhakya, V. Ramalingam, “Metal nanoparticles synthesis: an overview of different synthesis methods, mode of action and their biomedical application,” Discover Applied Sciences, 2025, vol. 7, art. 1079. https://doi.org/10.1007/s42452-02507210-y
In this investigation the mechanical and microstructural properties of Electron Beam Welded (EBW) and Friction Stir Welded (FSW) 2507 Super Duplex Stainless Steel (SDSS) welds were studied. The Super Duplex Stainless Steel has an equal proportion of the ferrite and austenite phases and the change in the proportion will lead to the changes in the microstructure which in turn affects the weldment properties. Thus, it is motivating to try to analyze, compare, and investigate the mechanical properties and microstructural aspects of the fusion (EBW) and solid state (FSW) welded SDSS2507. Both approaches have potential for high-performance applications, the findings provide insights into the suitability of EBW and FSW for SDSS 2507 applications, highlighting their potential to meet the demanding conditions in oil, gas, and marine industries. Mechanical testing, including tensile, micro hardness, impact toughness, and bend tests were used to evaluate the welded joints. The microstructural investigation of phase distribution and grain structure was carried out using optical microscope and scanning electron microscopy (SEM). Ferrite measurement revealed that the percentage of ferrite is more than the austenite phase at the center of both the welds, with EB weld metal having higher ferrite content (about 65%). The tensile test specimens failed in the weld nugget in case of friction stir welds and in the base metal in case of EB welds as can be predicted from the high hardness values exhibited by the EB weld metal. Both types of welded joints exhibited high joint efficiencies above 90%. Results indicate that both EBW and FSW produce robust joints with distinct microstructures and both can be employed for structural applications requiring high joint strength.
Super duplex stainless steel 2507 (SDSS) is widely used for its dual-phase microstructure, combining approximately equal parts of ferrite and austenite, resulting in high strength and corrosion resistance. This unique composition grants it superior corrosion resistance and mechanical strength, ideal for high-stress environments in industries such as offshore oil and gas, petrochemical, and chemical processing. The alloy’s balanced microstructure also provides excellent resistance to pitting, stress corrosion cracking, and general corrosion in chloride-rich environments, making it particularly valuable in harsh operational conditions [1-2]. However, due to its complex phase structure, welding SDSS 2507 is challenging, as improper heat input or processing can disrupt
C. B. Sekar
Department of Mechanical Engineering, Meenakshi College of Engineering, Chennai, India.
S. Vijayan, S. R. Koteswara Rao
Department of Mechanical Engineering, Sri Sivasubramaniya Nadar College of Engineering, Chennai, India.
the delicate ferrite-austenite balance, leading to reduced mechanical performance and increased corrosion susceptibility. V. A. Hosseini et al [3] studied the impact of multiple thermal cycles during TIG welding on SDSS. The study focuses on the formation of secondary phases, such as sigma phase and nitrides, and how these phases influence both microstructure and corrosion resistance. Key findings include the identification of different thermal zones within the welded area, each exhibiting varying degrees of ferrite and secondary phase content depending on heat input. The study highlights that higher heat inputs reduce the formation of detrimental phases like nitrides by slowing the cooling rate, while multiple passes promote their formation, negatively affecting mechanical and corrosion properties [3].
Electron beam welding (EBW) and friction stir welding (FSW) have emerged as prominent methods for joining SDSS 2507, each with unique characteristics. EBW is a fusion welding process that uses a high-energy electron beam to penetrate deep into the material, enabling high welding speeds and minimal distortion due to its narrow, focused heat affected zone (HAZ). This characteristic is advantageous for SDSS, as the rapid cooling and narrow HAZ help maintain phase balance in SDSS 2507, thus preserving its mechanical properties and corrosion resistance [4-5]. EBW’s ability to create precise, deep welds makes it well-suited for thick sections and high-stress components, yet some research suggests that the extreme heat of EBW may risk introducing embrittlement if not carefully controlled [6]. Z. Zhang et al investigates the impact of heat input on the microstructure and mechanical properties of duplex stainless steel (DSS) EBW welds. The study highlights how varying heat inputs influence the formation of ferrite and austenite, Cr2N precipitation, and mechanical properties like hardness and toughness. Recommended heat input is 0.46 kJ/mm for optimal properties [7].
FSW, on the other hand, is a solid-state process that joins materials without melting. By using frictional heat and mechanical stirring, FSW allows SDSS 2507 to retain its original microstructure, which is beneficial for maintaining both phase balance and material toughness. Studies have shown that FSW can improve joint integrity and extend fatigue life in duplex stainless steels, a result of its
lower-temperature processing and minimized thermal stresses [8-9]. Because it limits the formation of harmful intermetallic phases, FSW is increasingly favoured for applications where corrosion resistance and mechanical strength are paramount [10]. R.A. Giorjão et al. studied the influence of FSW process parameters (spindle speed, welding speed) on SDSS 2507 welds, using tensile and bend tests for mechanical evaluation [11]. M. M. Seleman et al. investigated on the focus on various FSW tool geometries and their impact on weld quality, emphasizing tensile and hardness testing [12].
This study presents a comparative analysis of the mechanical and microstructural properties of SDSS 2507 when welded using EBW and FSW. By evaluating the hardness, tensile strength, corrosion resistance, and microstructural characteristics of each weld, we aim to offer insights in comparison of these welding processes for industry applications, contributing to the reliable and efficient use of SDSS 2507 in critical environments.
SDSS 2507 of 6 mm thick was employed for this investigation. Vacuum arc emission spectrometric analysis was used to determine the base metal chemical composition and the weight % of the elements present in the base metal, as displayed in table 1. The base metal tensile samples, impact toughness and bend test were made according to ATM E8-04 (ASTM, 2004), ASTM E23-07 (ASTM, 2007) and E190-92 (ASTM, 2008) standards. The mechanical properties of the base metal such as Yield strength, Tensile strength, Elongation (%), Vickers Micro-hardness and Charpy Impact Toughness are shown in table 2. For macro-structural analysis, the transverse sides of weld joints were cut, polished up to 2500 grit emery sheets and etched using 10% NaOH electrolyte etching technique. The macrographs of the welded joints were captured using a stereo zoom microscope to analyse the presence of micro or macro voids or cracks by studying the following parameters (i) penetration depth (ii) maximum width of the joints (iii) weld area produced by joints and (iv) weld zones.
Tab.1 - Chemical composition of 2507 SDSS.
Weight % of elements
Material
Tab.2 - Mechanical properties of the base metal (measured values).
Mechanical
Elongation (%) in 25mm gauge length
Vickers Micro-hardness (HV0.5@15sec)
Charpy Impact Toughness @RT (J)
± 2
The base plate, of 100 mm long, 75 mm wide, and 6 mm thick, was machined to fabricate the EBW and FSW welds. Prior to welding, the base plate was cleaned with acetone in order to remove all the grease and debris. Square butt joints of EBW and FSW were fabricated using the optimum process parameters obtained from the trials and listed in the literature [13-14] and are shown in table 3.
Tab.3 - Welding techniques and process parameters.
Welding Process Process Parameters
Voltage =100 Kv
Beam current = 27 mA
Travel speed = 600 mm/min
Tool rotation speed - 600 rpm
Tool Traverse Speed - 25 mm/min
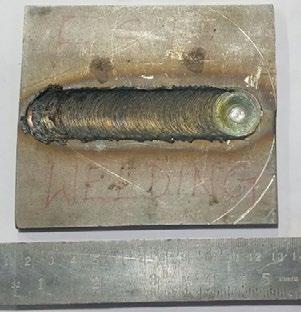
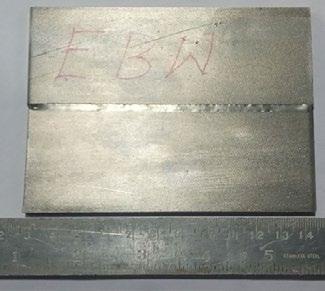
- Fabricated weld joints.
Micro and macro structural characterization
SEM and optical microscopy were used to examine the microstructural properties of the welded joints and base metal. Using optical microscopy, the impact of the EBW and FSW welding procedures on microstructural morphologies was thoroughly examined. In the meantime, scanning electron microscopy was used to evaluate the average grain size and grain size distribution for the EBW
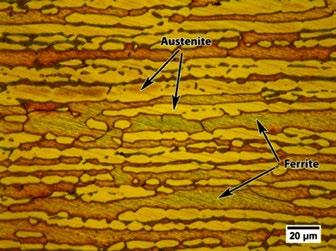
- Optical micrograph of 2507 SDSS (ferrite and austenite).
and FSW joints. The base metal microstructural features are shown in figure 2. Austenite (γ) and ferrite (α), two phases (dual phase), were seen in the optical microscope image [15]. The austenite and ferrite phases are denoted by the white and dark phases of the stripe type, respectively. In the dual phases, the grain thickness ranged from 12 to 20 µm, with an average of approximately 15.2 µm.
Figures 3 and 4 show the grain thickness indicator and the grain thickness size distribution, respectively.
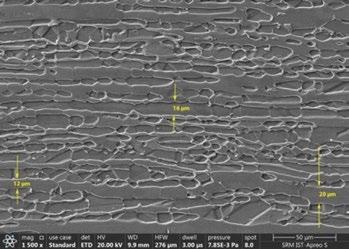
- Indication of grain thickness of the base metal.
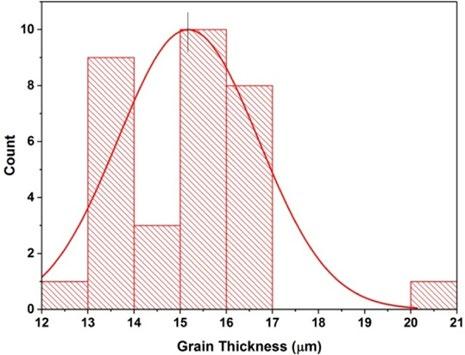
The EBW joint macrostructure is shown in figure 5a. The fusion zone was found to have two separate zones: (i) a narrow fusion zone at the root side, and (ii) a wide fusion zone at the face side. The keyhole welding causing significant variation in cooling rates at the face and root sides of the EBW joint during solidification is responsible for this shape of fusion zone. The face side of the fusion zone has a bead width of 5.8 mm, whereas the root side has a low
bead width of 1.5 mm. For the EBW joint, the measured weld area was 14.7 mm². The fusion zone microstructure at the EBW joint face side is seen in figure 5b. It has columnar grains growing from the top surface of the weld and the base metal (epitaxial growth). Additionally, intragranular austenite was observed at the face side of the fusion zone which has also been observed by other investigators [16]. The morphology of the root side of the fusion zone contained large number of finer equiaxed grains. Howe-
ver, the absence of Widmannstätten austenite was noted, and the ferrite grains are tiny. The grain size distribution and the enlarged image of the face side of the fusion zone are shown in figures 6a and 6b, respectively. Figure 6b
shows that the average grain size at the face side of the fusion zone is 108 µm. The root side of the fusion zone is shown in magnified view in figures 6c and 6d.
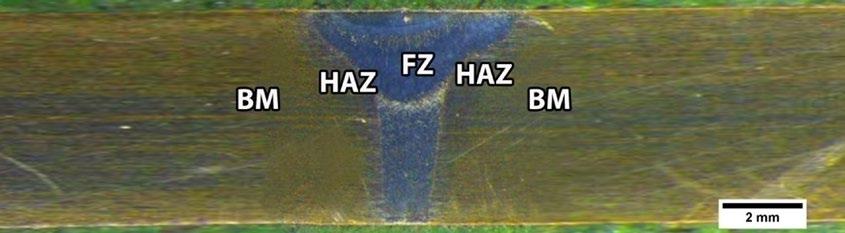
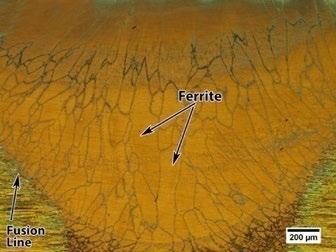
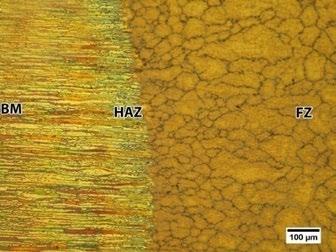
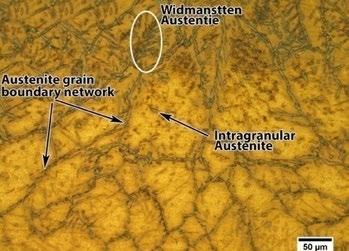
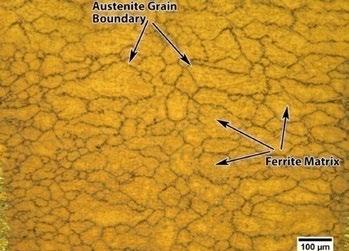
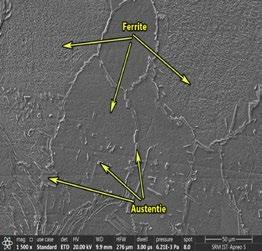
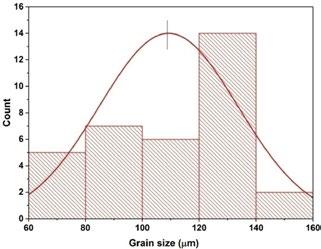
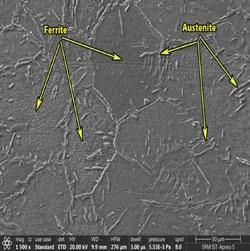
(c) Root side of the fusion zone
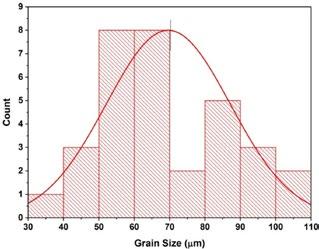
(d) Distribution of grain size (root side)
Fig.6 - Microstructural morphologies of the EBW fusion zone.
The macrostructural characteristics of the FSW joint are displayed in figure 7a. The macrostructure of the FSW joint showed three unique zones: the thermomechanical affected zone at retreating side (TMAZ-RS), the thermomechanical affected zone at advancing (TMAZ-AS), and the stir zone (SZ). Because stainless steel has a limited heat conductivity, the heat affected zone (HAZ) is not readily visible in this instance. As a significant large volume of the base metal is mixed by the FSW tool during the joining process, the FSW weld zone produced greater bead width (27.1 mm) and weld area (111.4 mm2) compared to the EBW joint.
The SZ microstructure of the FSW joint is depicted in figure 7b. Here the SZ microstructure is more significant as compared to the base metal due to the dynamic recrystallization mechanism (DRX). The grain size of the austenite and ferrite phases at the SZ is reduced as compared to the base metal grain thickness due to the severe plastic deformation during the DRX mechanism [17]. The nucleation and growth of the well-refined strain-free grains occurred
during the FSW process [18]. Figures 7c and 7d depict the microstructural features of the TMAZ-AS and TMAZ-RS respectively. The distorted grain structure was observed at the TMAZ due to the mechanical deformations due to the heat effect created by the high-speed rotation FSW tool.
The stir zone is magnified in figures 8a and 8b, and the grain size distribution at the stir zone is displayed in figure 8c. Most of the grain size in the stir zone is varying from 5 µm to 14 µm and the average grain size is found as 9 µm. The higher magnification (15000 X, figure 8b) SEM image revealed a distribution of the refined equiaxed ferrite and austenite grains at the center of the stir zone. The formation of the sub grains at the austenite phase indicating that the continuous dynamic recrystallization (CDRX, progressive transformation) occurred at the stir zone [19]. Figures 9a and 9b show magnified views of TMAZ-AS and TMAZ-RS respectively. The presence of the equiaxed grains at the SZ and deformed grains at the TMAZ indicating that the severe plastic deformation occurred at the FS weld zones by the FSW tool [20].
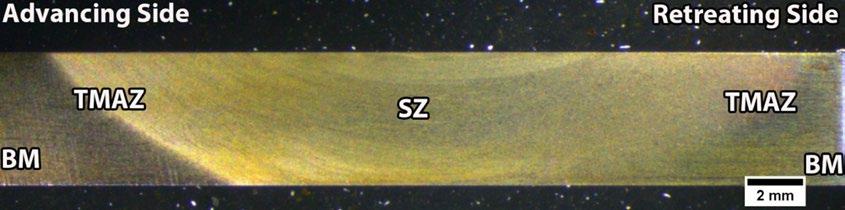
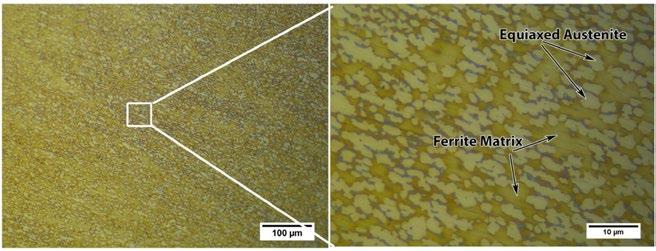
(b) Stir zone
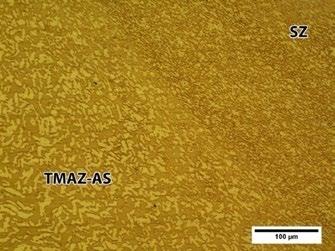
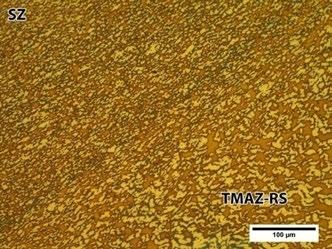
(c) TMAZ-AS (d) TMAZ-RS
Fig.7 - Microstructure of the FSW Joint (a) Stir Zone (b) TMAZ-AS (b) TMAZ-RS.
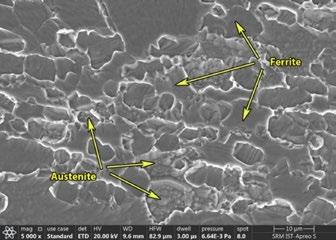
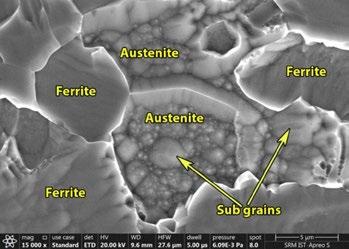
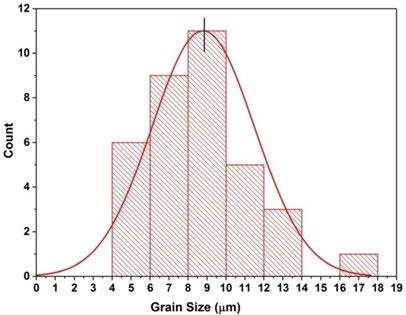
(c) Distribution of the grain size
Fig.8 - Microstructural morphology at the stir zone.
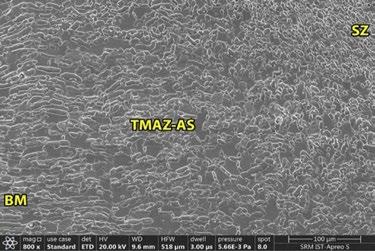
(a) Advancing side
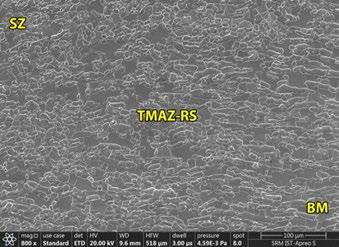
(b) Retreating side
Fig.9 - Microstructural morphology at the TMAZ of FSW joint.
Evaluation of the percentage of ferrite phase present in the base metal and weld zones of the different weld joints was done using feritescope. For ferrite measurement, the transverse side of the weld joint was first polished up to 2500 grit emery sheet and then polished using 1 µm diamond paste. Further, the electrolytic etching process was
accomplished to reveal the weld zones. A total of four readings were taken at each weld zone (FZ, HAZ) for EBW joints. Similarly, for FSW joint a total of four readings were taken at each zone (SZ, TMAZ-AS and TMAZ-RS) and the average value was calculated. The average percentage of ferrite in the base metal and weld zones were measured using ferrite scope and evaluated values are given in table 4.
- Percentage of ferrite in different weld zones.
Microstructural morphologies of the base metal, EBW and FSW joints show the balance between the austenite and ferrite phase with the aid of ferrite measurement. The phase balance is disturbed at the fusion zone of the EBW joint due to the rapid cooling nature. The rapid cooling due to the higher welding speed and narrow fusion zone of the EBW process influenced the formation of the highest amount of the ferrite content in the zone compared to FSW weld zones. The base metal microstructure showed highly elongated austenite and ferrite phases. The EBW fusion zone exhibited two different zones (coarse ferrite grains at the face side and smaller ferrite grains at the root side). The stir zone of the FSW joint showed well-refined strain-free equiaxed grain morphologies of the austenite and ferrite phases due to severe plastic deformation of the dynamic recrystallization phenomenon.
The FSW joint exhibited considerably low ferrite content than EBW joints. In the case of the FSW joint, the formation of the higher ferrite content is usually not possible since the joining processes are done without melting and solidification. The fusion zone of the EBW joint has shown the formation of the highest ferrite content compared to the nugget zone of the FSW joint.
Mechanical properties of the duplex stainless steel (DSS) joints are majorly affected by grain morphology and the percentage of ferrite present in the weld zones [21]. The deterioration of the mechanical properties of the DSS and SDSS weld joints is caused by the phase imbalance between ferrite and austenite [22]. A detailed comparison of the primary mechanical properties such as tensile strength,
impact toughness, microhardness and bend properties of the welded joints (EBW and FSW) is presented in this investigation.
To evaluate transverse tensile properties, three samples of the welded specimens were tested as per the ASTM E8-04 (ASTM 2004). The sub size tensile specimens were prepared and tested in a 100 kN capacity universal testing machine made by MTS (model name MTS Insight). The average values were taken for comparison of the tensile properties. During tensile test for all samples, the crosshead speed of 1 mm/min was maintained. Figure 10 shows the tensile samples of the welded joints after the experiment. The figure depicts the failure locations of the welded joints after the transverse tensile experiment. The failure location was observed at the fusion zone of the EBW joints. Moreover, failure occurred at SZ and very
near to the TMAZ-AS of the FSW joint. Figures 11a and 11b depict the comparison of the stress vs strain curves and evaluated tensile values for the base metal and welded joints. The base metal exhibited yield strength (YS), ultimate tensile strength (UTS) and percentage of elongation of 690 MPa, 825 MPa and 43 % respectively. The superior tensile properties of the FSW joint over EBW joint is due to the following reasons: (1.) formation of the refined equiaxed grains around 9 µm at the stir zone; (2.) formation of the low ferrite content by the action of the solid-state welding phenomenon. The base metal has shown the highest percentage of elongation as compared to all welded joints due to the perfect phase balance between the austenite-ferrite grain morphology. The EBW joint shows the lowest percentage of elongation than the base metal and FSW joints due to the highest ferrite at the fusion zone of the EBW joint [16].
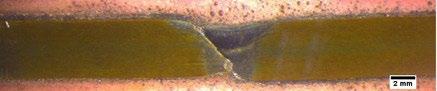
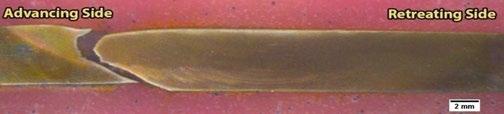
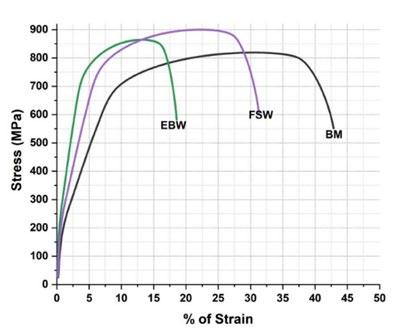
(a) Stress vs strain curve
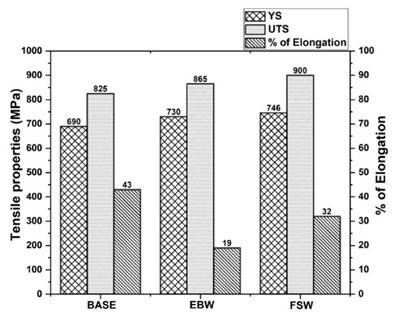
(b) Stress vs strain curve
The fractography study on the tensile fracture surface was done using a Scanning Electron Microscope (SEM). Figure 12 depicts the tensile fractography of the base metal and welded joints. The presence of dimples and fibrous surfac-
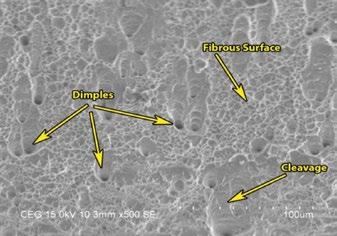
es in the fracture surface of the base metal indicating the ductile mode fracture (figure 12a). The presence of a few cleavage surfaces indicating a reduction in the ductility of the base metal.
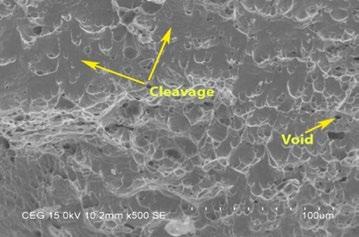
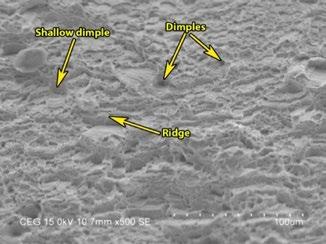
Fig.12 - Tensile Fractography of the Base metal, EBW and FSW joints.
The major portion of the EBW fracture surface is covered by large cleavage and flat surfaces with considerable voids (figure 12b). This indicates the deterioration of the ductility of the EBW joint as compared to the base metal. In the EBW fusion zone, the austenite-ferrite phase balance is highly affected by the rapid cooling nature due to the narrow electron beam source and higher welding speed. The fracture surface of the FSW joint shows the distribution of fine dimples and microvoids shown in figure 12c. This indicates a higher ductile property of the weld zone at the FSW joint.
A Vickers microhardness made by Innova Tester (Model 423D) was used to evaluate the microhardness properties of the weld zones. The transverse side of the weld joints was polished up to 2000 grit emery sheet and then the etching was done to reveal the weld zones. A load value of 0.5 Kg and a standard dwell time of 15 sec was used for microhardness measurement study across the transverse side of the weld joints. Throughout the hardness measu-
rement for all weld joints, the distance between the two indentations was maintained as 0.5 mm. Figure 13 depicts the hardness distribution of the transverse side of the EBW joint. The hardness measurement was taken across the face side and root side of the fusion zone. The root side of the fusion zone exhibited a hardness of 315 ± 4 HV and the face side of the fusion zone exhibited a hardness of 300 ± 8. The higher hardness of the root side is attributed to the formation of the smaller ferrite grains as compared to the face side of the fusion zone. Figure 14 shows the distribution of hardness across the FSW weld zone. The hardness of the stir zone varies from 320 HV to 352 HV. This range is quite a bit higher than the base metal and EBW joints. The very fine grain refinement around 9 µm at the stir zone resulted in the highest hardness of the FSW weld zone. However, unsteady microhardness is attributed to the distribution of equiaxed ferrite and austenite morphologies at the stir zone. Because the BCC structure ferrite grains comprise more hardness over FCC structured austenite grains. The TMAZ of the FSW joint showed a hardness range between the base metal and the stir zone.
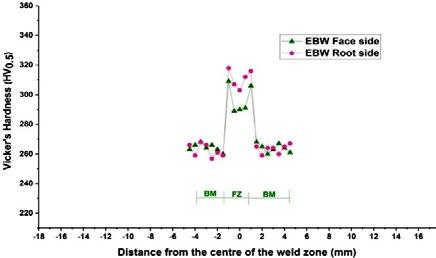
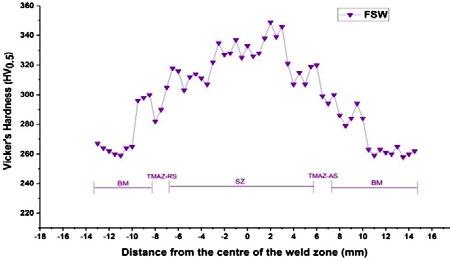
Fig.13 - Distribution of the microhardness of EBW joint. Fig.14 - Distribution of the microhardness of FSW joint.
The Charpy impact testing machine made by SANS (Model: ZBC2452-C) was used to assess the toughness of the weld joints. The test was performed at room temperature with a 450 J capacity machine. The Charpy impact test samples before and after the test are shown in figure 15. Figure 16
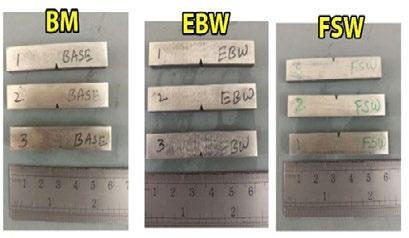
(a) Impact test sample (before the test)
shows a comparison of the impact toughness values of the base metal and welded joints. The FSW joint showed little reduction in the impact toughness compared to the base metal. The EBW joint showed the lowest impact toughness value due to the formation of high ferrite content (64.7 %).
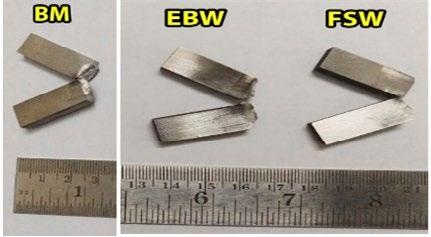
(b) Impact test sample (after test)
Fig.15 - Impact toughness test samples before and after the test.
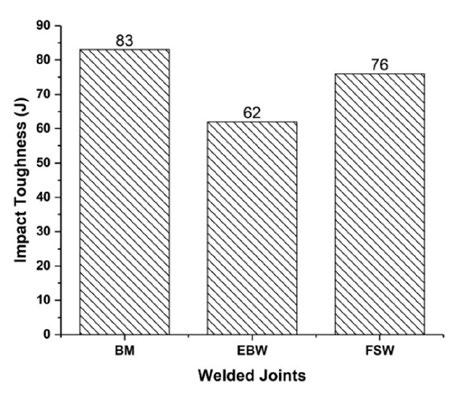
Fig.16 - Impact toughness of base metal and welded joints.
A 100 kN capacity Universal testing machine made by MTS (model name MTS insight) was used for performing the standard guided 2T bend test for the base metal and weld joints. For the welded joints both face bend and root bend were performed to check the ductility. The bend test samples of different welded joints before and after the experiment are shown in figure 17a and b. The peak load of the base metal and welded joints during the bend test is given in table 5. The bend test results revealed that the base
metal and all weld joints are free from cracks, tearings and fissures [23]. The peak load during the face and root bend test for the base metal was observed as 11.74 kN and 10.52 kN respectively. The highest peak load of 13.06 kN was observed for the FSW joint during the face bend experiment. This is attributed to the large portion of the stir zone with well refine austenite and ferrite grains. The lowest peak load of the EBW joint is attributed to the narrow fusion zone with the highest ferrite phase (BCC structured).
Peak load for the base metal = 15.32 kN
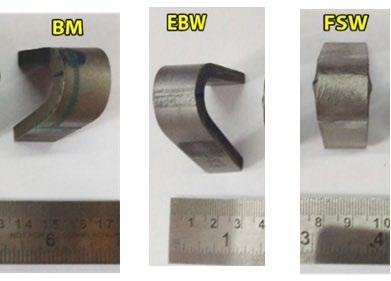
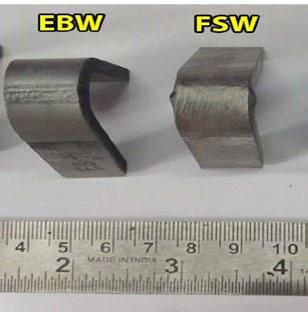
1. Defect free single pass full penetration welds were successfully made on 6mm thick super duplex stainless steel 2507 plates, using Electron Beam and Friction stir welding processes.
2. The ferrite and austenite phase balance changed significantly in EB welds and heat affected zones. The EB weld metal exhibited the highest ferrite content of 64.7 % resulting in higher strength and lower ductility. FS welds showed slightly higher ferrite content compared to the base metal in the nugget zone and TMAZ.
3. The fusion zone of the EBW joint exhibited two different types of grain morphology namely smaller ferrite grains at the root side and coarse ferrite grains at the face side. The different cooling rate at different places is the main reason for the two distinct zones at the EBW fusion zone.
4. The formation of the highest ferrite content (64.7%) at the EBW fusion zone deteriorated the impact toughness property of the EB weld metal.
5. The FSW joints have shown higher yield strength, ultimate tensile strength and percentage of elongation, compared to the EBW joints mainly due to the fine
equiaxed grains in the nugget region of the FS welds, which were caused by dynamic recrystallization.
6. FSW demonstrates superior performance in the bend test than the EB welds, maintaining a higher degree of structural integrity under stress.
7. The FS welds exhibited better ferrite to austenite phase balance at about 55:45, while EB weld metal exhibited a 65:35, which could adversely affect the corrosion resistance of the weld metals.
[1] J. Anderson, K. Lee, T. Kim, “Corrosion resistance of SDSS 2507 SDSS in marine environments,” Journal of Materials Science and Engineering, vol. 56, pp. 254-262, 2017.
[2] A. Vignal, S. Kumar, M. Brown, “Stress and corrosion resistance of duplex stainless steels,” Corrosion Science, vol. 130, pp. 112-121, 2018.
[3] V. A. Hosseini, K. Hurtig, L. Karlsson, “Effect of multipass TIG welding on the corrosion resistance and microstructure of a super duplex stainless steel,” Materials and Corrosion, vol. 68, no. 4, pp. 405-415, 2017.
[4] M. Sato, Y. Takeda, T. Nakamura, “Electron beam welding and microstructure control in duplex steels,” Journal of Manufacturing Processes, vol. 24, pp. 345-354, 2016.
[5] R. Singh, P. Gupta, “Effect of welding techniques on phase balance in duplex stainless steels,” Welding Journal, vol. 98, pp. 45-53, 2019.
[6] P., Almeida, L. Silva, R. Costa, “Embrittlement control in SDSS 2507 welded joints,” Materials Science and Engineering: A, vol. 783, pp. 116-124, 2021.
[7] Z. Zhang, H. Jing, L. Xu et al., “Influence of heat input in electron beam process on microstructure and properties of duplex stainless steel welded interface,” Applied Surface Science, vol. 435, 2018, pp. 352-366.
[8] D. Thomas, H. Kumar, L. Wilson, “Improved joint integrity of duplex steels via FSW,” International Journal of Advanced Manufacturing Technology, vol. 105, pp. 3331-3342, 2020.
[9] R. Mishra, Z. Ma, “Overview of friction stir welding for stainless steels,” Progress in Materials Science, vol. 92, pp. 234-260, 2019.
[10] L. Chen, M. Zhao, Z. Wang, “Corrosion resistance in FSW duplex stainless steels,” Journal of Materials Processing Technology, vol. 293, pp. 117065, 2022.
[11] R. A. Giorjão et al., “Microstructure and mechanical properties of friction stir welded 8mm pipe sdss 2507 super duplex stainless steel,” Journal of Materials Research and Technology, vol. 7, Issue 4, 2018, pp. 551-558.
[12] M. M. Seleman et al., “Experimental investigations on mechanical and metallurgical properties of SDSS 2507 welded joints using FSW,” International Journal of Integrated Engineering, vol. 14, No. 1, 2022, pp. 1-12.
[13] C. B. Sekar, S. R. Boopathy, S. Vijayan, S. K. Rao, “Effect of GTA welding parameters on bead geometry of SDSS 2507 super duplex stainless steel,” La Metallurgia Italiana, n. 9 September, pp. 18-28, 2020, ISSN 0026-0843.
[14] R. Sasidharan, S. R. Boopathy, S. Vijayan, S. K. Rao, “Optimization of bead geometry for duplex stainless steel GTA welds using the Taguchi approach,” Mater. Test., vol. 58, no. 4, pp. 312-318, 2016. https://doi.org/10.3139/120.110854
[15] L. Wang, P. Zhao, J. Pan, L. Tan, K. Zhu, “Investigation on microstructure and mechanical properties of double-sided synchronous TIP TIG arc butt welded duplex stainless steel,” The International Journal of Advanced Manufacturing Technology, 112:303-312, 2021.
[16] J. Singh, A. S. Shahi, “Metallurgical and corrosion characterization of electron beam welded duplex stainless steel joints,” Journal of Manufacturing Processes, vol. 50, pp. 581-595, 2020.
[17] M. K. Mishra, G. Gunasekaran, A. G. Rao, B. P. Kashyap, N. Prabhu, “Effect of multipass friction stir processing on mechanical and corrosion behavior of 2507 super duplex stainless steel,” Journal of Materials Engineering and Performance, vol. 26, no. 2, pp. 849860, 2017.
[18] H. Sarlak, M. Atapour, M. Esmailzadeh, “Corrosion behavior of friction stir welded lean duplex stainless steel,” Materials & Design (1980-2015), 66, 209-216, 2015.
[19] V. A. Hosseini, S. Wessman, K. Hurtig, L. Karlsson, “Nitrogen loss and effects on microstructure in multipass TIG welding of a super duplex stainless steel,” Materials & design, vol. 98, pp. 88-97, 2016.
[20] R. S. Mishra, Z. Y. Ma, “Friction stir welding and processing,” Materials Science and Engineering R: Reports, vol. 50, issues 1-2, pp. 1-78, 2005.
[21] J. Verma, R. V. Taiwade, “Effect of welding processes and conditions on the microstructure, mechanical properties and corrosion resistance of duplex stainless steel weldments - A review,” Journal of Manufacturing Processes, vol. 25, pp. 134-152, 2017.
[22] B. Varbai, T. Pickle, K. Mellinger, “Effect of heat input and role of nitrogen on the phase evolution of 2205 duplex stainless steel weldment,” International Journal of Pressure Vessels and Piping, vol. 176, 103952, 2019.
[23] S. Cui, Y. Shi, Y. Cui, T. Zhu, “The impact toughness of novel keyhole TIG welded duplex stainless steel joints,” Engineering Failure Analysis, vol. 94, pp. 226-231, 2018.
In recent decades, the rail transportation sector has undergone continuous progress. To meet market demands, rail producers are improving rail strength to develop high-performance products, particularly in terms of wear resistance. Head-hardened rails offer greater resistance to wear caused by faster, more frequent trains carrying heavier loads. Building on this need, the innovative Danieli RH 2 - Rail Head Hardening process has been specifically designed and optimized since 2008. The RH2 process involves immersing the rail head in a tank filled with a water-based polymer solution immediately after rolling. This quenchant enables a wide range of cooling rates - from those typical of oil to those of water - allowing the process to be tailored to each specific rail grade, from pearlitic to bainitic. High-quality rails produced using the Danieli RH2 system feature the lowest possible transformation costs and minimal environmental impact in terms of CO2 footprint.
Over the past five years of industrial production, extensive measurements of metallurgical and mechanical properties have been conducted on RH²-treated rails. Results demonstrate the RH2 system’s ability to exceed the most demanding global requirements. The foot residual stress is half the European limit. A high level of hardness uniformity is achieved at the rail head. As a result, the mechanical properties are more uniform, and the fatigue resistance is twice the minimum required by European standards.
KEYWORDS: INLINE RAIL HEAD HARDENING; PEARLITIC STEEL; FATIGUE RESISTANCE; FRACTURE TOUGHNESS; RESIDUAL STRESSES; HARDNESS; AQUEOUS SOLUTION.
Rails account for only 1.3% of European hot-rolled steel production, amounting to 1.903 million tons in absolute terms (based on 2021 data) (1). Compared to other rolled products, the rail market is atypical due to its lower exposure to price volatility. Its customers are primarily large entities—often state-owned—that tend to favor local suppliers, provided they can meet the required quality standards. These customers typically secure multi-year purchase contracts with clearly defined quantities and prices, which are relatively insulated from the macroeconomic cycles that influence other products, such as reinforcing bars for concrete. Further highlighting this uniqueness, it's worth noting that there is no official market quotation for rail products, unlike other categories like sheets or structural profiles. However, this should not be interpreted as a lack of competition. On the contrary, the rail market is highly competitive, both technologically and commercially.
The growing volume of passenger traffic has led to a substantial and steady increase in high-speed passenger transportation in Europe (figure 1) (2). High-speed railways
Danieli & C. Officine Meccaniche S.p.A., Italy
Danieli & C. Officine Meccaniche S.p.A., Italy
must ensure safety, and therefore require rails with consistent geometrical tolerances throughout their service life. More frequent convoys have led to increase rail damage such as wear and Rolling Contact Fatigue (RCF) defects (3).
RCF defects can appear on the rail surface or just beneath it in the form of shelling, squats and gauge corner cracks resulting from the repeated wheel-rail contact cycles. The costs to eliminate RCF defects represent a significant portion of the overall track costs due to railroad downtimes. Therefore, any improvement of rail quality contributes to reduced maintenance costs. Rails with high hardness, not only have better properties against wear but also RCF. For instance, the performance of the European head-hardened
grade R350HT compared to the standard grade R260 is approximately three times better in terms of wear resistance and twice as effective against RCF (4).
Nowadays there are two main ways to improve mechanical properties in rails, the metallurgical route (primarily through chemical composition) and the thermo-mechanical route (primarily through process control). Until 2000, rail manufacturers focused on the metallurgical route with relatively good results. More recently, thermo-mechanical methods have been investigated to further enhance the mechanical characteristics of commercial rails. One of such method is the inline heat treatment of the rail.
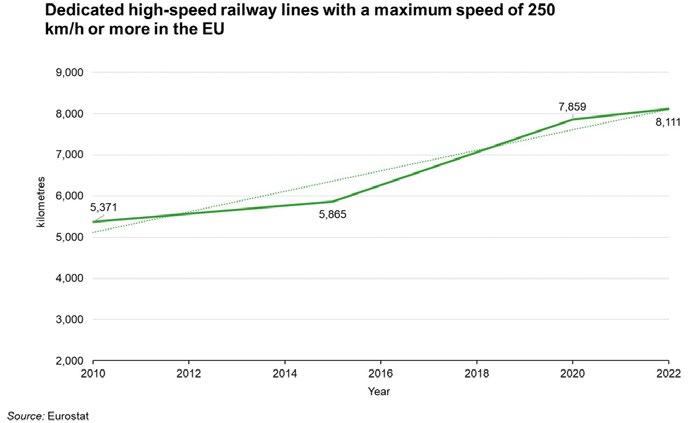
Traditional rail steels contain approximately 0.7–0.8% carbon, making them nearly eutectoid. The cooling rate from the stable austenitic phase to the end of transformation de-
termines the final microstructure. The desired microstructure for this type of steel is fully pearlitic, as it minimizes wear while maintaining the same hardness (figure 2) (5).
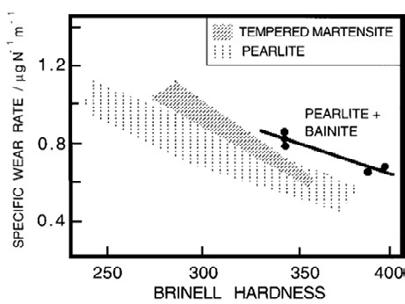
- Relationship between wear rate and hardness considering the microstructure (5).
The Danieli Rail Head Hardening project started in early 2008 with the aim of developing a stable and efficient technology. At the time, several rail head hardening methods were commercially available, mainly based on immersion methods (in oil or water/polymer mixture) or run-through spray systems (using compressed air, air mist or water as cooling media). A preliminary evaluation of these methods, supported by initial trials, led Danieli to select the immersion type technology using a water-based polymer solution.
A detailed study of the cooling tank’s fluid dynamics was conducted to ensure a uniform cooling rate along the rail head. Various tank configurations were analyzed using CFD code Fluent® software, and the most promising solutions were tested at the Danieli Research Center (6).
In early 2010, Danieli started its experimental studies using a flexible prototype able to treat rails with different quenching media and process parameters. After careful selection an optimal polymer quenchant was identified, offering high stability throughout the cooling process. The first industrial plant was commissioned in 2013. The key point of the heat treatment strategy is to understand and control the microstructural mechanism involved in the pearlitic transformation. The optimal process involves cooling the rail to a temperature slightly above the bainite start temperature, remaining within the pearlitic transformation range until completion, as illustrated by red line in figure 3. This process results in a fully pearlitic and fine microstructure.
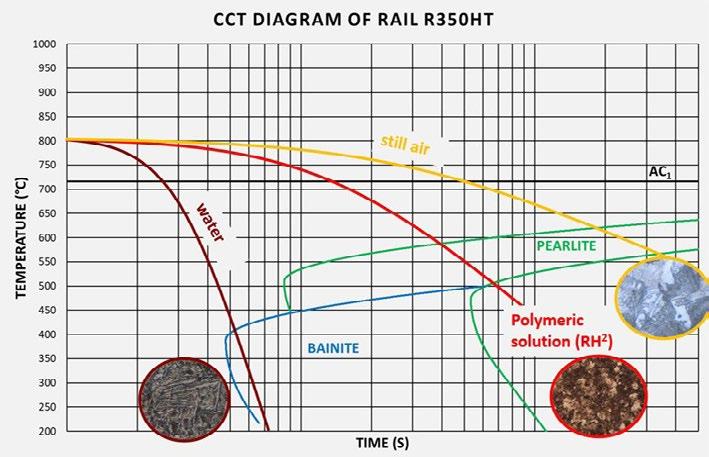
The heat treatment is performed by immersing the rail head into a tank containing a water-based polymer solution. To ensure optimal and repeatable conditions, some auxiliary systems are required to control the temperature, flow rate, and polymer concentration. These systems are divided into the following main areas:
1. Recirculation circuit: Supplies the cooling fluid to the treatment tanks at the appropriate temperature and polymer concentration.
2. Regeneration circuit: Maintains the cleanliness of the solution by preventing the formation of mold and bacteria.
Nowadays, there is a growing concern about reducing CO2 emissions. As a result, increasing attention is being paid to minimizing both emissions and production costs in the manufacturing of heat-treated rails. Figure 4 illustrates the energy cost (left) (7) and CO2 emissions per kilowatt-hour (right) (8) across several European countries.
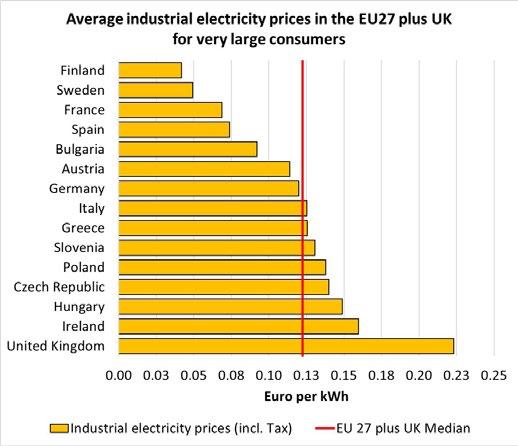
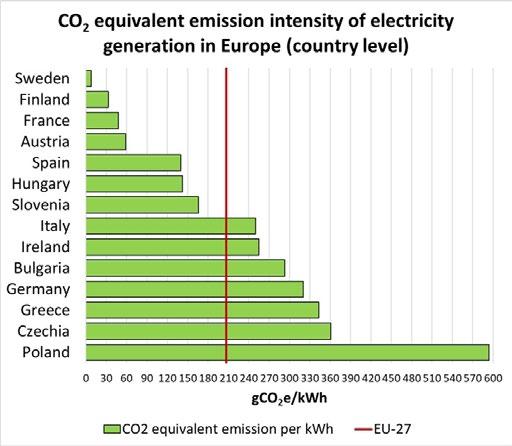
Fig.4 - Industrial electricity prices (left) (7) and CO2 emission intensity of electricity generation (right) (8) in several countries.
Based on the data presented in figure 4 and average data from plants, a simulation was carried out to assess the production costs and gas emissions associated with the RH2 process, in comparison with an alternative rail treatment technology.
The results are shown in figure 5 and figure 6. The graphs highlight that both costs and emissions depend on the specific electricity prices and emission intensity of each country. Therefore, the European average (represented by the dashed black line) was used for the simulation.
The results demonstrates that the RH² process can reduce head hardening costs by 32% and CO2 equivalent emissions by 74% compared to an alternative technology that uses forced air as a quenchant media. Although some uncertainty remains due to assumptions and data variability, the simulation is sufficiently accurate to confirm that the RH2 technology enables the production of rails that are both more cost-effective and environmentally friendly in the European context.
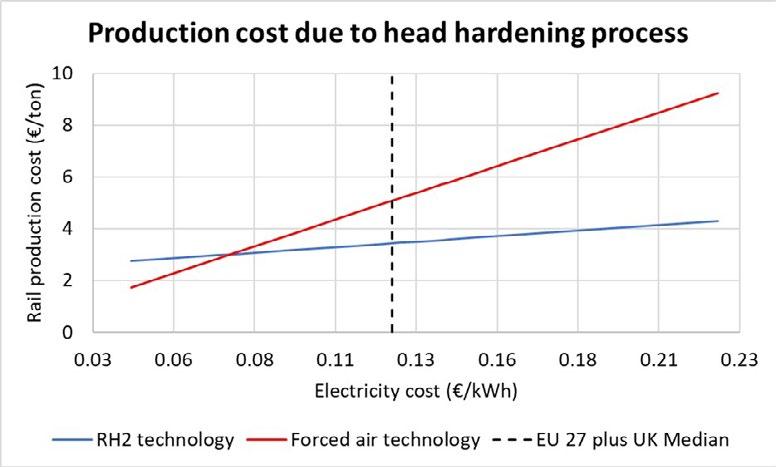
Fig.5 - Production costs of rail head hardening processes.
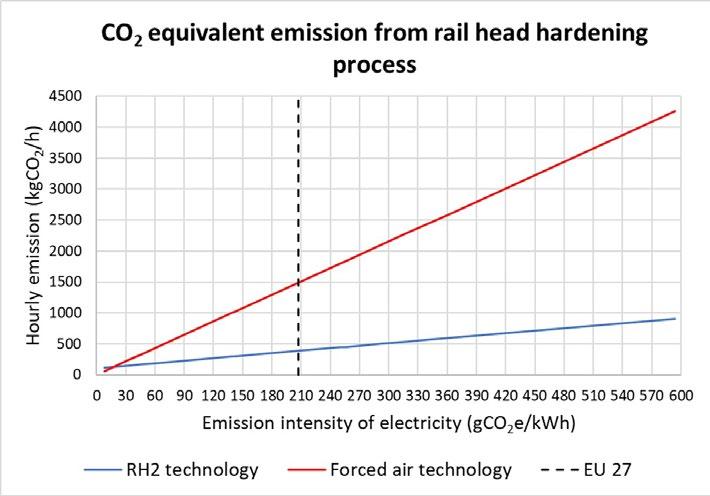
- CO2 equivalent emission of rail head hardening processes.
Hardness profile and mechanical properties
Several rail profiles were treated over the last five years of industrial production. The technological parameters of the process were optimized to ensure mechanical properties in compliance with major International Standards. Thanks to RH² technology, hardness remains uniform within the rail head. Figure 7 shows the hardness mea-
sured in the points specified by EN 13674-1:2017 (9) for three different European rails profiles. The values exceed requirements with a good safety margin. Hardness was still found to be above 360 HB at a depth of 20 mm from the running surface, where the minimum requirement by EN is 321 HB. The average standard deviation of hardness on the running surface was less than 8 HB, confirming the repeatability of system.
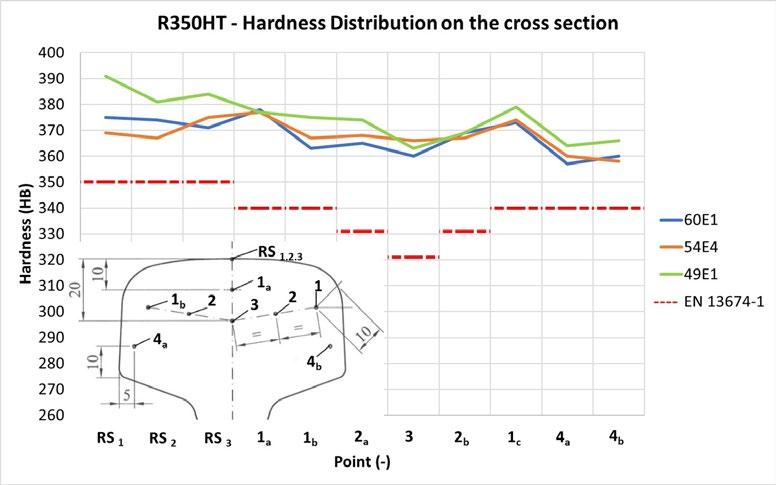
- Hardness distribution along section (steel grade R350HT).
An example of mechanical properties achieved on various rail profiles treated with the RH2 system in industrial plant is shown below (table 1). The specimen position and testing condition are in accordance with EN 136741:2017 (9). An appropriate process set-up combined with a careful choice of chemical composition enabled optimal microstructural refinement, reducing the pearlite interlamellar distance. This is clearly reflected in the tensile strength value which significantly exceeds the 1175 MPa threshold.
Tab.1 - CO2 equivalent emission of rail head hardening processes.
Generally, increasing hardness -associated with strength - tends to reduce both toughness and fatigue life. This means that, while improved hardness can extend the rail's wear life, it may simultaneously decrease its fatigue life. However, contrary to this common assumption, the toughness test results shown in figure 8 indicate a mean fracture toughness of 38.8 MPa , well above the Euro-

pean requirement.
Similarly, fatigue resistance tests conducted in accordance with EN 13674-1:2017 (9) showed that all samples withstood 107 cycles without failure - twice the minimum required by the European standard.
These results confirm that the RH² process positively affects fatigue life and, in fact, enables performance that exceeds standard expectations.
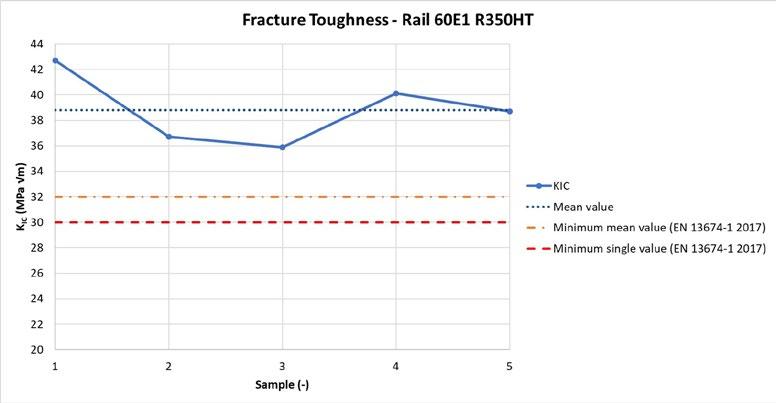
- Fracture toughness.
Pearlite forms nodules composed of multiple colonies, each with parallel lamellae oriented differently from neighboring colonies. These colonies nucleate at the grain
boundaries and grow into the grain interior. New colonies form adjacent to existing ones or randomly within the grains.
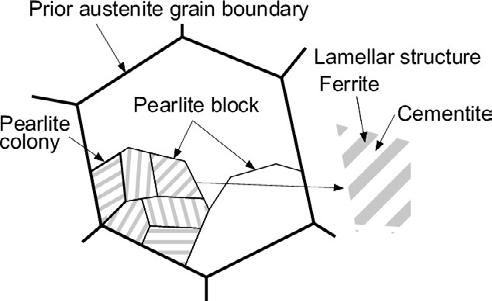
- Sketch of pearlite formation.
The key microstructural parameter controlling the strength of pearlitic steel is the interlamellar spacing. Finer pearlite results in higher hardness, as the cementite-ferrite interfaces act as barriers to dislocation motion. Reducing the spacing increases the density of these barriers, enhancing mechanical strength.
Interlamellar spacing was measured on the treated rail
head and foot using the procedure recommended by Vander Voort (10). The results shown in Fig. 10, indicate that the interlamellar spacing is smaller and more consistent in the head than in the foot. This outcome is expected, as the head was cooled in a polymer solution and the average hardness was 367 HB, while the foot was cooled in air and the average hardness was 330 HB.
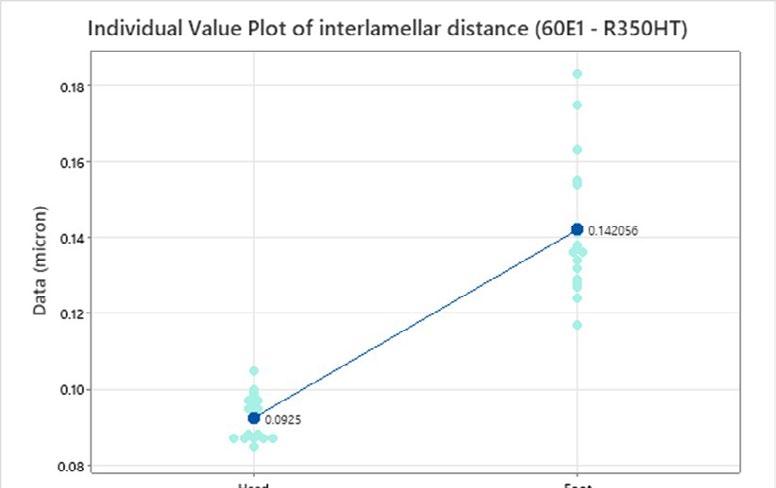
- Interlamellar distance of rail head and foot for heat treated rail.
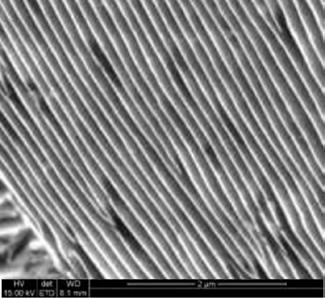
SEM Image of microstructure in the area of the corner of the head (10 mm below the surface) – 60E1 – R350HT grade steel
The rail profile is unsymmetrical; in fact, the head has a greater linear weight than the foot. As a result, cooling is non-uniform and phase transformations occur at different times. Uneven temperature distribution during cooling onto the cooling bed leads to thermal stresses, that can exceed the material’s yield strength at high temperatures, causing the rail to bend upon exiting the cooling bed. The bending direction depends on the rolling process: non-treated rails tend to bend toward the head, while heat-treated rails— where the head is cooler—bend toward the foot. Since heat treatment is applied to the head to achieve desired mechanical properties, controlling deformation requires
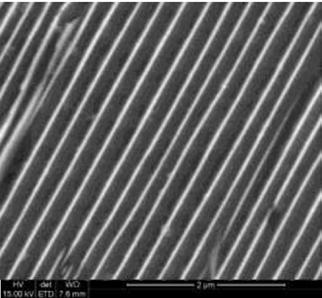
SEM Image of microstructure in the area of the center of the foot (5mm below the surface) – 60E1 –R350HT grade steel
managing foot cooling. This is achieved using a series of nozzles positioned above the foot and supplied with water. However, straightness at cooling bed exit is not sufficient to meet the tolerances required by European standard. Therefore, a straightening process is necessary. Straightening introduces the highest residual stresses in rail production. If excessive, these stresses can compromise the rail quality and reduce fatigue resistance (11). Cooling the foot helps to reduce residual stresses by limiting rail bending and plastic deformation during the straightening process. Figure 12 shows results obtained from industrial practice: the average residual stress in the foot is 100 MPa - half the European limit.
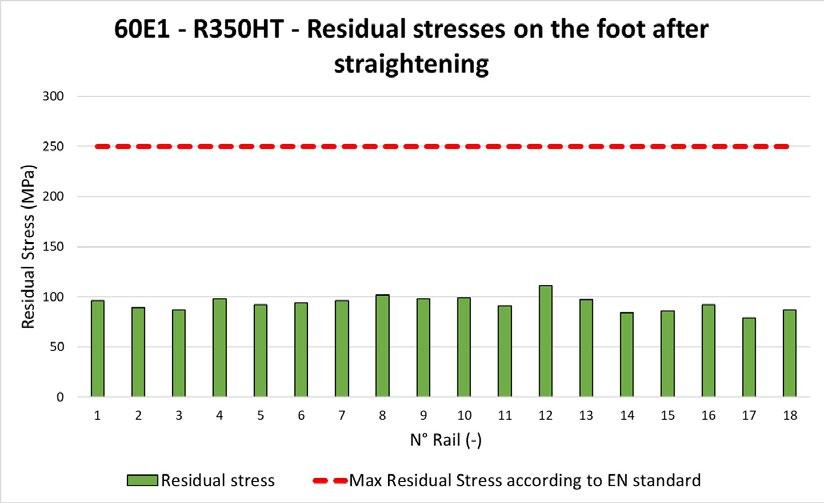
Fig.12 - Residual Stress.
The Danieli rail head hardening system (RH 2) involves dipping the rail head in an aqueous polymer solution to enhance mechanical properties and wear resistance. The resulting values exceed European requirements with a good safety margin. Hardness remains above 360 HB at a depth of 20 mm from the running surface and tensile strength surpasses the 1175 MPa threshold by almost 100 MPa.
The primary microstructural parameter governing the strength of pearlitic microstructures is confirmed to be the pearlite interlamellar spacing. The finer pearlite, the higher hardness. After heat treatment, the average interla-
mellar spacing is less than 100 nm. The RH² process significantly improves not only hardness and strength, but also fatigue life and toughness. Toughness results from industrial practice indicate a mean fracture toughness of 38.8 MPa√m, well above the European requirement. Similarly, fatigue resistance tests show that all samples withstood 107 cycles without failure - twice the minimum required by the European standard. These results are made possible by the low level of residual stresses. The average residual stress in the rail foot is 100 MPa - half the European limit.
[1] Steel Statistical Yearbook 2022. https://worldsteel.org/. [Online].
[2] Characteristics of the railway network in Europe. Eurostat. [Online].; 2022.
[3] INNOTRACK Project report D4.1.4. Rail degradation. 2009.
[4] E.Taleff, J. Lewandowski and B. Pourladian. Microstructure-Property Relationships in Pearlitic Eutectoid and Hypereutectoid Carbon Steels. JOM. 2002.
[5] Bhadeshia HKDH. Bainite in steels. 2001;: p. 383.
[6] Gori, Luca; Andreatta, Daniele; Luvarà, Gianbruno; Saccoman, Umberto. Danieli & C. Officine Meccaniche S.p.A.. Operating achievements of in-line Danieli Rail Head Hardening (RH2) system on 100 m long rails. In METEC and 2nd ESTAD; 2015; Düsseldorf.
[7] Department for Energy Security and Net Zero, Industrial electricity prices in the EU. https://www.gov.uk/. [Online].; 23/06/2025.
[8] European Environment Agency, Greenhouse gas emission intensity of electricity generation in Europe. https://www.eea.europa.eu. [Online].; 27/06/2025.
[9] EN 13674-1:2017. Railway applications - Track - Rail - Part 1: Vignole railway rails 46 kg/m and above. European Committee for Standardization.
[10] Vander Voort GF. Measurement of interlamellar spacing of pearlite. 1984.
[11] Pallarés-Santasmartas L, Albizuri J, Avilés A, Avilés R. Mean Stress Effect on the Axial Fatigue Strength of DIN 34CrNiMo6 Quenched and Tempered Steel. Metals. 2018; 8(213).
L’Associazione Italiana di Metallurgia, per onorare la memoria del prof. Felice De Carli, ex Presidente dell’AIM, istituì nel 1968 un premio da assegnare ad un giovane ricercatore di cittadinanza italiana, che non avesse superato il 32° anno di età al momento della data di presentazione della domanda di concorso al premio e che avesse dimostrato di possedere un’adeguata maturità nel settore della ricerca metallurgica fondamentale e applicata.
L’Associazione ha deciso di bandire nuovamente il concorso per l’assegnazione del premio, consistente in una somma dell’importo di 1500 Euro e in una medaglia di ricordo recante l’effige del prof. Felice De Carli.
Per concorrere al premio occorre presentare domanda, anche a mezzo e-mail, con il testo di uno o più articoli originali del concorrente oltre che il curriculum vitae e l’elenco dei lavori già pubblicati o in corso di stampa.
La domanda va inviata, entro il 30 giugno 2026, alla Segreteria AIM, e-mail: info@aimnet.it.
La Commissione Giudicatrice, nominata dal Consiglio Direttivo
AIM, a suo insindacabile giudizio, sceglierà l’Autore meritevole del premio, sia in base all’esame del lavoro inedito che dei titoli presentati.
La consegna del premio avverrà il 9 settembre 2026 a Brescia, in occasione del 41° Convegno Nazionale AIM.
Milano, 12 febbraio 2026

Per informazioni e candidature:
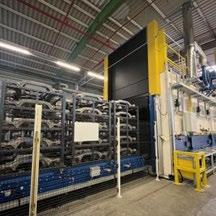

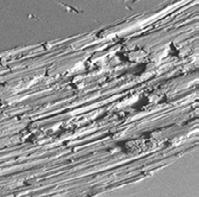
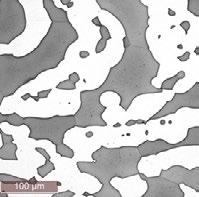
Giornata di Studio
Trattamenti termici delle leghe di alluminio
Dal fornitore al cliente
Provaglio d’Iseo (BS) c/o Gefran - 10 giugno 2026
>> SCOPRI DI PIÙ
Giornata di Studio
Celebrazione 70° Centro Daccò
Ferrara – 12 Giugno 2026
>> SCOPRI DI PIÙ
Giornata di Studio
ECNDT 2026 | Failure Analysis & NDT
Verona - 18 giugno 2026
>> SCOPRI DI PIÙ
Tribologia
c/o Laboratorio Te.Si. dell'Università degli Studi di Padova
Rovigo - 24-25 giugno 2026
>> SCOPRI DI PIÙ
Giornata di Studio
Acciai Inossidabili Superduplex Metallurgia di fabbricazione e deformazione plastica a caldo Brescia c/o Università degli Studi di Brescia - 23 giugno 2026
>> SCOPRI DI PIÙ



Corso Fonderia per non fonditori Capire la fonderia per scegliere meglio (Webinar Zoom) - 25-26 giugno, 2-3-7-8-9 luglio 2026
>> SCOPRI DI PIÙ
Summer School Digitalization & AI in Metallurgy Udine – 28-29-30 giugno – 1 luglio 2026
>> MORE INFO
Giornata di Studio Evoluzione e aggiornamenti normativi nei trattamenti termici dei metalli
Webinar FaReTra - 30 giugno 2026
>> SCOPRI DI PIÙ
Giornata di Studio Superleghe di nichel
Reggio Emilia - 7 luglio 2026
>> SCOPRI DI PIÙ
Summer school “Environmental Assisted Cracking” Milazzo (ME) - 5-9 July 2026
>> MORE INFO





WCCM 2026
The 4th World Congress on Condition Monitoring Milano, Italy - 25-27 August 2026
>> MORE INFO
41° Convegno Nazionale AIM
Progettiamo il futuro tra ricerca e innovazione Brescia - 9-11 settembre 2026
>> SCOPRI DI PIÙ
5th International Conference on INGOT CASTING, ROLLING & FORGING
Bardolino, Verona - 13-15 October 2026
>> MORE INFO
Tinplated Steels and Metals Packaging & Recycling - IFTSR 2026 IFTSR - International Forum Bergamo - 3-4 December 2026
>> SCOPRI DI PIÙ
ECHT 2027 & 32nd IFHTSE World Congress
The Industry meeting point for the international heat treatment and materials science network Milano (Italia) - 14-16 April 2027
>> SCOPRI DI PIÙ www.aimnet.it
Si è concluso lo scorso 31 marzo 2026, nella cornice dell’Auditorium Stefano Cerri di Milano, il progetto europeo Co.Science - Meet Research to Connect Science and Society. La giornata conclusiva, intitolata “Spazi di dialogo tra Scienza e Società”, ha rappresentato l’atto finale di un percorso biennale volto a costruire ponti solidi tra il mondo della ricerca e la cittadinanza, con un focus privilegiato sulle scuole.

Finanziato dall’Unione Europea, Co. Science ha visto nel biennio 2024-2026
l’organizzazione della Notte Europea delle Ricercatrici e dei Ricercatori in sei città lombarde (Milano, Varese, Como, Busto Arsizio, Lodi e Lecco) e la realizzazione di numerosi eventi per e con le scuole della Regione Lombardia. Il successo dell’iniziativa è stato garantito da una sinergia strategica tra partner d’eccellenza: Consiglio Nazionale delle Ricerche CNR, Università dell’Insubria, Federazione delle Associazioni Scientifiche e Tecniche FAST, consorzio Italbiotec, Museo Nazionale Scienza e Tecnologia "Leonardo da Vinci" di Milano. Grazie al lavoro di quasi 600 persone tra ricercatrici, ricercatori, esperte ed esperti a vario titolo, è stato possibile organizzare gli eventi in uno dei territori dalla più alta
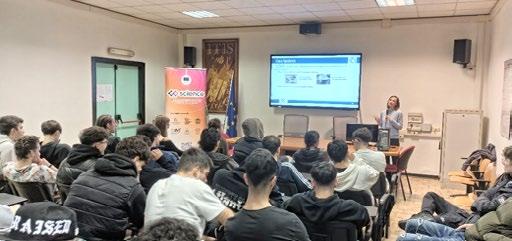

densità di popolazione del paese e raggiungere ogni anno circa settanta istituti scolastici lombardi e oltre 5000 studenti, aprendo alla cittadinanza un ventaglio di argomenti scientifici tra i più disparati: dalla scienza pura all’ingegneria, passando per la chimica, la fisica, la biologia, le scienze alimentari e quelle umanistiche.
La Notte Europea si è articolata, in contemporanea, nelle città di Milano (in due sedi, presso il Museo Nazionale Scienza e Tecnologia "Leonardo da Vinci" e nel cuore della città), Como, Varese, Busto Arsizio e, per l’edizione 2025, anche a Verbania. Lo svolgimento inoltre di eventi satellite presso le città di Lodi e Lecco ha permesso di garantire una reale capillarità della divulgazione, creando una rete di cittadinanza scientifica attiva in tutta la regione. Il CNR, con il patrocinio del Comune, ha organizzato gli eventi gratuiti “La Ricerca fa centro!” nelle strade centrali di Milano portando la ricerca nel 2024 presso l’Arengario di piazza del Duomo e nel 2025 presso la Loggia dei Mercanti: l’iniziativa è stata un importante momento di condivisione di esperienze, strategie e modelli capaci di raffigurare anche le visioni scientifiche più moderne ed attuali, rendendo possibile raggiungere un vasto e diversificato pubblico, stimato nei due anni in più di 10.000 persone. Risultato ottenuto grazie ai
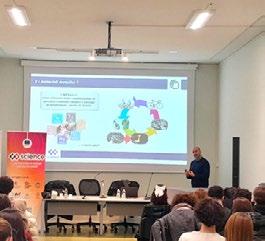

contributi di chi ha animato la piazza, come l’Associazione Italiana di Metallurgia (AIM) sponsor e supporter attivo, in nome della diffusione della cultura tecnica e scientifica legata ai materiali.
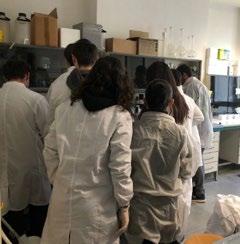
Cuore pulsante del progetto ha riguardato l’ampio programma dedicato alle scuole di Milano e della Lombardia. Attraverso eventi tematici, laboratori interattivi e dialoghi diretti con le ricercatrici e i ricercatori, l’attività didattica si è trasformata in un’esperienza capace di coinvolgere migliaia di studentesse e studenti, dalla scuola dell’infanzia alla secondaria, rendendoli protagonisti attivi della ricerca scientifica e permettendo loro di apprendere principi, necessità e criticità del mondo scientifico.
Oltre al coinvolgimento del pubblico, Co.Science ha investito nella formazione di ricercatrici e ricercatori offrendo loro percorsi didattici e di confronto volti a migliorarne le competenze comunicative e le abilità relazionali. In questo ambito, all’insegna dell’inclusività e dell’accessibilità,
di particolare valore sono stati ad esempio gli incontri con l’Associazione Nazionale Subvedenti.
Il progetto quindi non è stato solo un’opportunità di divulgazione scientifica tradizionale, ma un vero e proprio esperimento di scienza partecipata basato sul dialogo bidirezionale con la società civile. Coinvolgendo attivamente le cittadine e i cittadini, insegnanti e, soprattutto, le giovani studentesse e giovani studenti, l’iniziativa ha trasformato la cittadinanza in protagonista del processo di scoperta. Portando esperte ed esperti fuori dai laboratori per rispondere ai bisogni e alle curiosità della comunità, Co.Science ha inoltre valorizzato il contributo di chi fa ricerca per ispirare le carriere STEM delle nuove generazioni, rendendo la scienza un patrimonio condiviso e accessibile.

L’evento all’Auditorium Cerri non è stato solo un traguardo ed un’occasione di resoconto finale, ma anche un momento di confronto in cui sono stati coinvolti rappresentanti di istituzioni, enti e organismi di ricerca, nonché personalità esperte del settore (non a caso la sessione pomeridiana è stata aperta da Massimo Polidoro, giornalista, scrittore e divulgatore scientifico). Il tutto a testimonianza di come la scienza possa diventare un linguaggio comune, capace di riunire ricerca e cittadinanza attiva in un unico spazio di crescita.

Norme pubblicate e progetti in inchiesta (aggiornamento al 30 aprile 2026)
Norme UNSIDER pubblicate da UNI nel mese di aprile 2026
UNI EN ISO 10059-1:2026
UNI EN 14917:2026
Compensatori di dilatazione a soffietto metallico per impieghi a pressione
UNI EN ISO 14720-2:2026
Prove su materie ceramiche - Determinazione dello zolfo nelle materie prime ceramiche e nelle materie ceramiche non ossidiche - Parte 2: Emissione ottica spettrometrica induttiva al plasma (ICP/OES) o cromatografia a ioni dopo bruciatura nel flusso di ossigeno
UNI EN ISO 14720-1:2026
Prove su materie ceramiche - Determinazione dello zolfo nelle materie prime ceramiche e nelle materie ceramiche non ossidicheParte 1: Metodi di misurazione a infrarossi
Norme UNSIDER ritirate con sostituzione da UNI nel mese di aprile 2026
UNI EN 14917:2021
Compensatori di dilatazione a soffietto metallico per impieghi a pressione
UNI EN ISO 14720-2:2013
Prove su materie prime ceramiche e materiali di base - Determinazione dello zolfo in polveri e granuli di materie prime ceramiche non-ossidanti e di materiali di base - Parte 2: Emissione ottica spettrometrica induttiva al plasma (ICP/OES) o cromatografia a ioni dopo bruciatura in un flusso di ossigeno
UNI EN ISO 14720-1:2013
Prove su materie prime ceramiche e materiali di base - Determinazione dello zolfo in polveri e granuli di materie prime ceramiche non-ossidanti e di materiali di base - Parte 1: Metodi di misura a infrarosso
Norme UNSIDER pubblicate da CEN e ISO nel mese di aprile 2026
EN 14917:2021+A1:2026
Metal Bellows expansion joints for pressure applications
ISO 13503-9:2026
Oil and gas industries including lower carbon energy — Completion fluids and materials — Part 9: Methods for evaluating performance of acidizing fluids
ISO 11951:2026
Cold-reduced tinmill products — Blackplate
ISO 11950:2026
Cold-reduced tinmill products — Electrolytic chromium/chromium oxide-coated steel
ISO 11949:2026
Cold-reduced tinmill products — Electrolytic tinplate
ISO 657-1:2026
Hot-rolled steel sections — Dimensions, sectional properties and tolerances — Part 1: Angles, sloping flange channels and sloping flange beams
ISO 148-4:2026
Metallic materials — Charpy pendulum impact test — Part 4: Testing of miniature Charpy-type V-notch test pieces
Progetti UNSIDER messi allo studio dal CEN (Stage 10.99) – maggio 2026
EN ISO 683-3:2022/prA1
Heat-treatable steels, alloy steels and free-cutting steels ” Part 3: Case-hardening steels ” Amendment 1
prEN 10088-1 rev
Stainless steels - Part 1: List of stainless steels
prEN 10088-3 rev
Stainless steels - Part 3: Technical delivery conditions for semi-finished products, bars, rods, wire, sections and bright products of corrosion resistant steels for general purposes
prEN 10088-2 rev
Stainless steels - Part 2: Technical delivery conditions for sheet/plate and strip of corrosion resistant steels for general purposes
Progetti UNSIDER in inchiesta prEN e ISO/DIS – maggio 2026
prEN – progetti di norma europei
prEN ISO 10426-1
Oil and gas industries including lower carbon energy - Cements and materials for well cementing - Part 1: Specification (ISO/DIS 10426-1:2026)
prEN ISO 7799
Metallic materials - Sheet and strip 3 mm thick or less - Reverse bend test (ISO/DIS 7799:2026)
prEN 10382
Metallic materials - Tensile testing - Tensile test on foils and strips of metals with a nominal thickness less than 0,200 mm by using
computer-controlled testing machines
ISO/DIS – progetti di norma internazionali
ISO/DIS 13470
Trenchless applications of ductile iron pipes systems — Product design and installation
ISO/DIS 10426-1
Oil and gas industries including lower carbon energy — Cements and materials for well cementing — Part 1: Specification
ISO/DIS 9328-1
Steel flat products for pressure purposes — Technical delivery conditions — Part 1: General requirements
ISO/DIS 9328-2
Steel flat products for pressure purposes — Technical delivery conditions — Part 2: Non-alloy and alloy steels with specified elevated temperature properties
ISO/DIS 9328-4
Steel flat products for pressure purposes — Technical delivery conditions — Part 4: Nickel-alloy steels with specified low temperature properties
ISO/DIS 9328-7
Steel flat products for pressure purposes — Technical delivery conditions — Part 7: Stainless steels
ISO/DIS 9327-1
Steel forgings and rolled or forged bars for pressure purposes — Technical delivery conditions — Part 1: General requirements
ISO/DIS 9327-2
Steel forgings and rolled or forged bars for pressure purposes — Technical delivery conditions — Part 2: Non-alloy and alloy (Mo, Cr and CrMo) steels with specified elevated temperature properties
ISO/DIS 9327-3
Steel forgings and rolled or forged bars for pressure purposes — Technical delivery conditions — Part 3: Nickel steels with specified low temperature properties
ISO/DIS 9327-4
Steel forgings and rolled or forged bars for pressure purposes — Technical delivery conditions — Part 4: Weldable fine grain steels with high proof strength
ISO/DIS 9327-5
Steel forgings and rolled or forged bars for pressure purposes — Technical delivery conditions — Part 5: Stainless steels
ISO/DIS 7799
Metallic materials — Sheet and strip 3 mm thick or less — Reverse bend test
Progetti UNSIDER al voto FprEN e ISO/ FDIS – maggio 2026
FprEN – progetti di norma europei
FprEN ISO 19901-1
Oil and gas industries including lower carbon energy - Specific requirements for offshore structures - Part 1: Metocean design and operating considerations (ISO/FDIS 199011:2026)
FprEN ISO 17078-2
Oil and gas industries including lower carbon energy - Drilling, production and injection equipment - Part 2: Flow-control devices for side-pocket mandrels (ISO/FDIS 170782:2026)
ISO/FDIS – progetti di norma internazionali
ISO/FDIS 19901-1
Oil and gas industries including lower carbon energy — Specific requirements for offshore structures — Part 1: Metocean design and operating considerations
ISO/FDIS 17078-2
Oil and gas industries including lower carbon energy — Drilling, production and injection equipment — Part 2: Flow-control devices for side-pocket mandrels
ISO/DTS 9516-2
Iron ores — Determination of various elements by X-ray fluorescence spectrometry — Part 2: Single element calibration procedure
1st announcement save the date
12th european conference



Milan - Italy
26-28 October
2027