Italiana La Metallurgia
International Journal of the Italian Association for Metallurgy
n.03 Marzo 2026
Organo ufficiale dell’Associazione Italiana di Metallurgia. Rivista fondata nel 1909
International Journal of the Italian Association for Metallurgy
n.03 Marzo 2026
Organo ufficiale dell’Associazione Italiana di Metallurgia. Rivista fondata nel 1909
International Journal of the Italian Association for Metallurgy
Organo ufficiale dell’Associazione Italiana di Metallurgia. HouseorganofAIMItalianAssociationforMetallurgy. Rivista fondata nel 1909
Direttore responsabile/Chiefeditor: Mario Cusolito
Direttore vicario/Deputydirector: Gianangelo Camona
Comitato scientifico/Editorialpanel: Marco Actis Grande, Silvia Barella, Paola Bassani, Christian Bernhard, Massimiliano Bestetti, Wolfgang Bleck, Franco Bonollo, Irene Calliari, Mariano Enrique Castrodeza, Emanuela Cerri, Vlatislav Deev, Andrea Di Schino, Donato Firrao, Bernd Kleimt, Carlo Mapelli, Denis Jean Mithieux, Roberto Montanari, Marco Ormellese, Mariapia Pedeferri, Massimo Pellizzari, Barbara Previtali, Evgeny S. Prusov, Dario Ripamonti, Dieter Senk
Segreteria di redazione/Editorialsecretary: Flynn Russo
Comitato di redazione/Editorialcommittee: Federica Bassani, Gianangelo Camona, Mario Cusolito, Carlo Mapelli, Federico Mazzolari, Flynn Russo, Silvano Panza
Direzione e redazione/Editorialandexecutiveoffice: AIM - Via F. Turati 8 - 20121 Milano tel. 02 76 02 11 32 - fax 02 76 02 05 51 met@aimnet.it - www.aimnet.it
Reg. Trib. Milano n. 499 del 18/9/1948. Sped. in abb. Post. - D.L.353/2003 (conv. L. 27/02/2004 n. 46) art. 1, comma 1, DCB UD
Immagine in copertina: Shutterstock

Gestione editoriale e pubblicità Publisher and marketing office: siderweb spa sb Via Don Milani, 5 - 25020 Flero (BS) tel. 030 25 400 06 commerciale@siderweb.com - www.siderweb.com
La riproduzione degli articoli e delle illustrazioni è permessa solo citando la fonte e previa autorizzazione della Direzione della rivista. Reproduction in whole or in part of articles and images is permitted only upon receipt of required permission and provided that the source is cited.
siderweb spa sb è iscritta al Roc con il num. 26116
n.03 Marzo 2026
Anno 117 - ISSN 0026-0843
Editoriale / Editorial
a cura Christian Bernhard Technical University of Leoben, Austria ................................................................... pag.05
Memorie scientifiche / Scientific papers Acciaieria / Steelmaking
Analysis of center segregation induced by density changes and shrinkage cavities using a moving-slice model in continuous casting
J. Lee, S. Seo, W. Cho, E. Lee, J. Jo, K. Kim ................................................................................................... pag.06
Problem solving with modeling support: evaluation with a numerical fluid dynamic model of the different configurations of the slag-cutting deflector for oxygen jet lance tips in the BOF
D. Ressegotti, A. Dell’Uomo, A. Cristallini, M. De Santis, E. Cassone, D. Esposito .............................................. pag.16
Direct feed to enhance power quality and EAF KPI
M. Sanchez, C. Bavière, P. Garmier, T. Aujoulat, D. Djerbal, K. Delsol, L. Fahrner . pag.22
A comparative CFD study in tundish flow with particle tracking
B. Philippe . pag.36
The effect of continuous casting conditions on the mechanical properties of low-carbon steel wire rods
F. Baldussi, A. Chugaeva, A. Milan, A. Parimbelli, F. Guerra, L. Angelini, M. G. Gelfi, A. Pola . pag.45
Inline intermix detection by laser spectroscopy, increasing the metallurgical output in continuous casting strands
M. Sprunk, A. Ahsan, A. John . pag.54
Highly efficient technologies for increased yields in steelmaking processes and reduced environmental impact - HIYIELD project
B. Glaser, S. Kuthe, I. Vaitsis, A. Chasiotis, M. Chini, D. Gaspardo, D. Olivieri, M. Schäfer, U. Faltings, P. Döhr, K. Rudolf, T. Lamp, M. Hölscher, H. G. Leonidas, F. Katsanevakis, H. Köchner ................................................................... pag.58
Modeling of steel continuous casting: overview of European knowledge and its global standing
M. De Santis, E. D’Amanzo, D. Capobianco, N. E. Perez, D. Mier Vasallo, C. Gruber, A. Atf, K. Marx, M. Koester, P. Ramirez Lopez, A. Gotti .................................................................................................................................. pag.65
Use of renewable and alternative carbon-bearing materials and hydrogen in the Electric Arc Furnace: simulations and pilot trials
V. Colla, I. Matino, O. Toscanelli, A. Soto Larzabal, A. Zubero Lombardia, T. Rodriguez Duran, J. Orre, E. Sandberg, M. Lundgren, M. Magnelov, D. Muren, P. Kwaschny, A. Zaccara ........................................................................ pag.71
New techniques for improvement of the monitoring and conditioning of slag in EAF steelmaking for the optimization of steel treatment and slag recovery
L. Angelini, P. Frittella, M. Bersani, V. Duro, C. Di Cecca, G. Badina, F. Fredi ....................................................... pag.81
Atti e notizie / AIM news
Eventi AIM / AIM events ....................................................................................................... pag.92
Terzo classificato “La Metallurgia a Fumetti” .............................................................. pag.95
Normativa / Standards .......................... pag.96

11-13 May 2026 - Milan, Italy
EEC 2026 & EMECR 2026 will be jointly held by AIM, Italian Association for Metallurgy, in Milan on 11-13 May 2026, together with siderweb FORUM!
The EEC 2026 (14th European Electric Steelmaking conference) will cover a wide range of topics related to the production of steel using electric arc furnaces (EAFs) and other electric-based processes. The EMECR (International Conference on Energy and Material Efficiency and CO2 Reduction in the Steel Industry) has become a recognized forum for high level discussions on environmental related topics such as CO2 reduction, materials efficiency and product life cycles in the steel industry worldwide.
EEC 2026 & EMECR 2026 will provide opportunities for networking with industry leaders, researchers, and policymakers, discussing collaborative projects and partnerships. Registration fees and participation details are available at www.aimnet.it/eec2026/register/ siderweb FORUM is the 2nd edition of the biennial event organised by siderweb to discuss the present and future of Italian and European steel.
Co-organised by
The Conferences will be enriched with an exhibition, where sponsors will be able to display new technologies and equipment. The detailed exhibiting and sponsorship packages are available at www.aimnet.it/eec2026/exhibition-sponsorship/ ® www.aimnet.it/eec2026

"ESTAD 2025 became a powerfulanduniquesign ofvitalityinresearchand innovation within Europe’s steelindustry.."
Christian Bernhard Technical University of Leoben, Austria

Spotlight on the future of steelmaking at ESTAD 2025
Organized by Associazione Italiana di Metallurgia, the 7th European Steel Technology and Application Days (ESTAD 2025) took place from 7th to 9th of October 2025 in Verona, Italy. ESTAD brought together experts and researchers from academia and industry to discuss the latest research findings and innovations in Ironmaking, Steelmaking, Continuous Casting, Rolling, Steel Applications, and Digital Transformation. With more than 800 participants, ESTAD has firmly established itself as the most important steelmaking conference in Europe in its 7th edition. ESTAD 2025 became a powerful and unique sign of vitality in research and innovation within Europe’s steel industry. In their plenary lectures, Giacomo Mareschi Danieli, Ronald Ashburn, and Zhiling Tian guided the audience through
the state of the steel industry across all continents. During the technical sessions, a large number of internationally renowned keynote speakers and speakers delivered 380 presentations, which were discussed. Thirty-eight exhibitors also encouraged visitors to stop by and check out their new products and developments.
The accompanying issue of Metallurgia Italiana features articles selected by the Scientific Committee for their quality and novelty. Enjoy this overview of the topics at ESTAD 2025!

J. Lee, S. Seo, W. Cho, E. Lee, J. Jo, K. Kim
A simple yet effective method has been developed to simulate macro-segregation during continuous casting. The model focuses on a thin slice moving at the casting speed, incorporating temperature and solid/liquid fraction profiles. The model incorporates micro-segregation and two key flow mechanisms: density-driven flow, governed by mass balance, and cavity-driven flow, which occurs as liquid and equiaxed crystals fill the solidification cavity forming at the center during solidification. Density-driven flow leads to positive macro-segregation near the center in both slabs and blooms, but the effect is significantly stronger in blooms. This is attributed to their higher Flow Contribution Ratio (FCR), which quantifies the relative contribution of Y-axis flow to overall flow. The higher FCR is likely influenced by greater solidification shrinkage. The cavity-driven flow model successfully explains the observed positive segregation peak at the center and the negative segregation peak at the total shrinkage location. The model’s predictions closely match experimental data and provide valuable insights for optimizing casting parameters and soft reduction patterns to minimize center-segregation. With its fast computation speed, the model is well-suited for both offline analysis and real-time implementation, making it a valuable tool for research and industrial applications.
KEYWORDS: CONTINUOUS CASTING, MACRO-SEGREGATION, SHRINKAGE, CENTER-SEGREGATION, SOFT REDUCTION, DENSITY-DRIVEN FLOW, CAVITY-DRIVEN FLOW;
Center segregation in continuous casting is influenced by several factors, including density variations [1, 2], bulging [1-4], shrinkage cavities, and liquid feeding [6, 7]. Bulging has been reported to significantly increase positive peak segregation at the center of cast products. However, its effect may be overestimated when considering the actual extent of bulging [2-4]. While previous studies have investigated macro-segregation, the specific contributions of density-driven flow and cavity-driven flow remain unclear. Additionally, inconsistencies exist in prior research regarding the relationship between density differences and segregation [2, 4, 5]. The role of shrinkage cavities as driving forces for center segregation is qualitatively well understood, but there is a lack of quantitative modeling to assess the impact of cavity-driven flow. Furthermore, the interactions among shrinkage cavities, shrinkage pores [8], and limited liquid feeding need to be verified to fully evaluate their effects on center segregation. To address these challenges, this study introduces a
Hyundai steel, South Korea
moving-slice model that incorporates both density-driven and cavity-driven flow to analyze macro-segregation. In the density-driven flow model, macro-segregation is calculated using Y-axis velocity, which is derived from mass balance equations. In the cavity-driven flow model, the study proposes a shrinkage pore distribution approach to quantitatively evaluate center-segregation. Additionally, this study introduces the concept of the Flow Contribution Ratio (FCR), a parameter that measures the relative contribution of Y-axis flow to overall flow. By incorporating FCR, the model provides a clearer understanding of how flow dynamics influence segregation intensity. To ensure reliability, the model’s predictions are validated against experimental measurements, demonstrating a strong match with observed data. This validation confirms the model’s ability to accurately simulate mac-
ro-segregation behavior. By offering a comprehensive framework for analyzing segregation, this study provides valuable insights for optimizing casting processes, particularly in controlling center segregation and improving product quality.
Heat and solidification
The heat transfer and solidification are governed by the two-dimensional transient heat equation. The material properties depend on temperature, and the analysis considers a moving slice with a heat flux boundary condition that changes with time. Detailed discussions are provided in a separate paper by the author [9].
Macro-segregation due to density change
The liquid fraction, liquid and solid concentrations, and temperature for each element are calculated, incorporating the Clyne and Kurz micro-segregation model [10], as it was found to fit best with experimental results from the continuous casting simulator at Hyundai
Steel [11]. For macro-segregation analysis, a thin slice is assumed to move at the casting speed, experiencing the liquid flow caused by density change. The flow along the thickness direction contributes to macro-segregation, which can be calculated using equation 2. [3, 4]
Here, is volume fraction liquid, is solidification shrinkage, is the component of flow in the y direction, and is the solid/liquid interface velocity. For cases involving soft reduction, can be replaced by the relative velocity, , where is soft reduction velocity, and


represents the efficiency of soft reduction. At each time step, the concentration of elements evolves and accumulates as they traverse the mushy zone, ultimately determining the final concentration at the end of solidification. The flow velocity, , responsible for macro-segregation is obtained by solving the following equation 3.
Here, is the average density of liquid and solid. The left-hand side can be transformed as follows:
Here, is the casting speed, is the solidification rate. The right-hand side can be transformed by [5] to [7].

Therefore, equation 8 can be derived, where: is defined by equation 9.
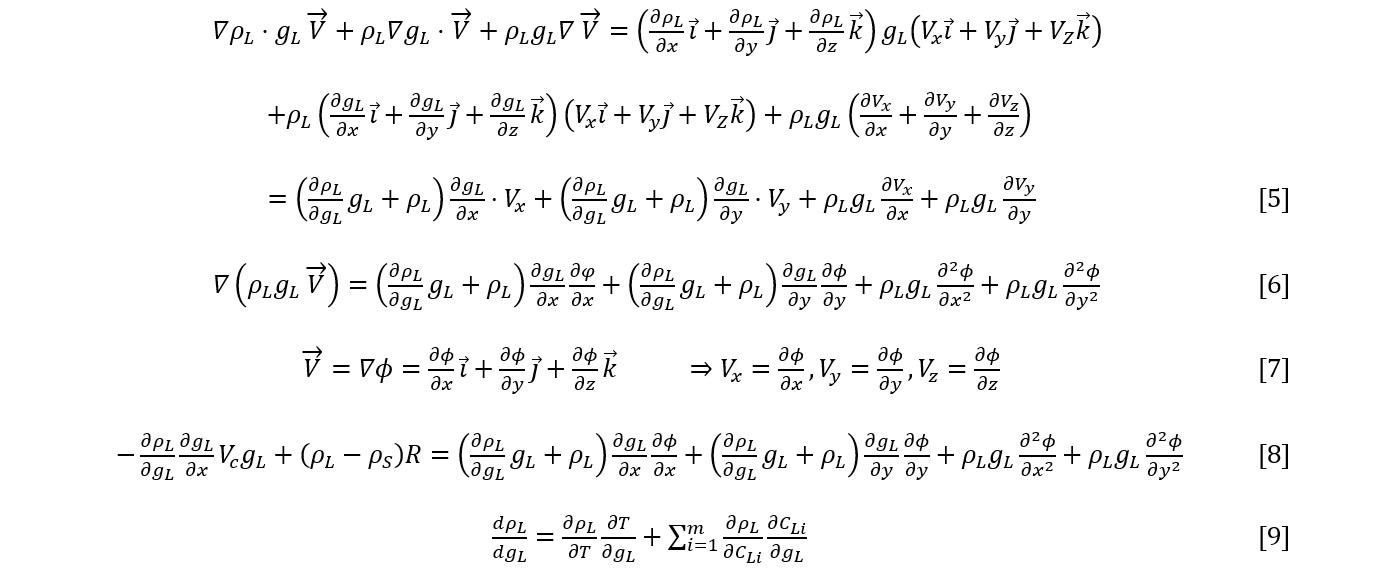


Where, , is obtained from the literature [12, 13]. is derived from the macro-segregation model explained in equation 2. The liquid velocity, , is calculated by solving equation 8.
Center-segregation by cavity-driven flow due to solidification shrinkage
Shrinkage during solidification can result in the formation of a cavity at the slab center. When this occurs, liquid tends to flow into the cavity, causing the observed positive center-segregation. This mechanism is supported by the presence of V-segregation [4, 8]. To estimate center-segregation, the liquid filling of the central cavity is modeled, assuming the slice moves at the casting speed. The key assumptions are as follows: (1) Shrinkage cavity formation: The model assumes cavities form at the center due to shrinkage. (2) Filling by liquid or equiaxed
crystals: Shrinkage cavities are filled by the flow of liquid and equiaxed crystals within the slice. (3) Shrinkage pore formation: Restricted liquid feeding within the mushy zone leads to the shrinkage pore formation. (4) Initial cavity size: The size of initial cavities in the central region is affected by the solidification rate, soft reduction, and bulging. Soft reduction decreases the central cavity, with its reduction quantified by both the soft reduction rate and reduction efficiency. Conversely, bulging results in an increase in the central cavity; thus, the bulging amount is included as indicated in equation 15. In this study, the individual contributions of soft reduction and bulging to center-segregation have not been assessed. Instead, the accuracy of current models in predicting the center-segregation profile has been verified. The influence of solidification rate on solidification shrinkage cavity is presented below. The shrinkage at each time step and the total shrinkage are described as:
Here, represents the element thickness. The positions of y=0, y=ys, and x=0, x=xE are illustrated in figure 1. The

density is determined by the following equation 11.

Here, represents the density of phase , and are the coefficient and concentration of element in phase , respectively. These values are obtained from the literature
[12, 13]. A shrinkage cavity element is added to the top (center of the slab) of the thin slice at each time step. It is assumed that liquid flows upward from beneath the cavity,
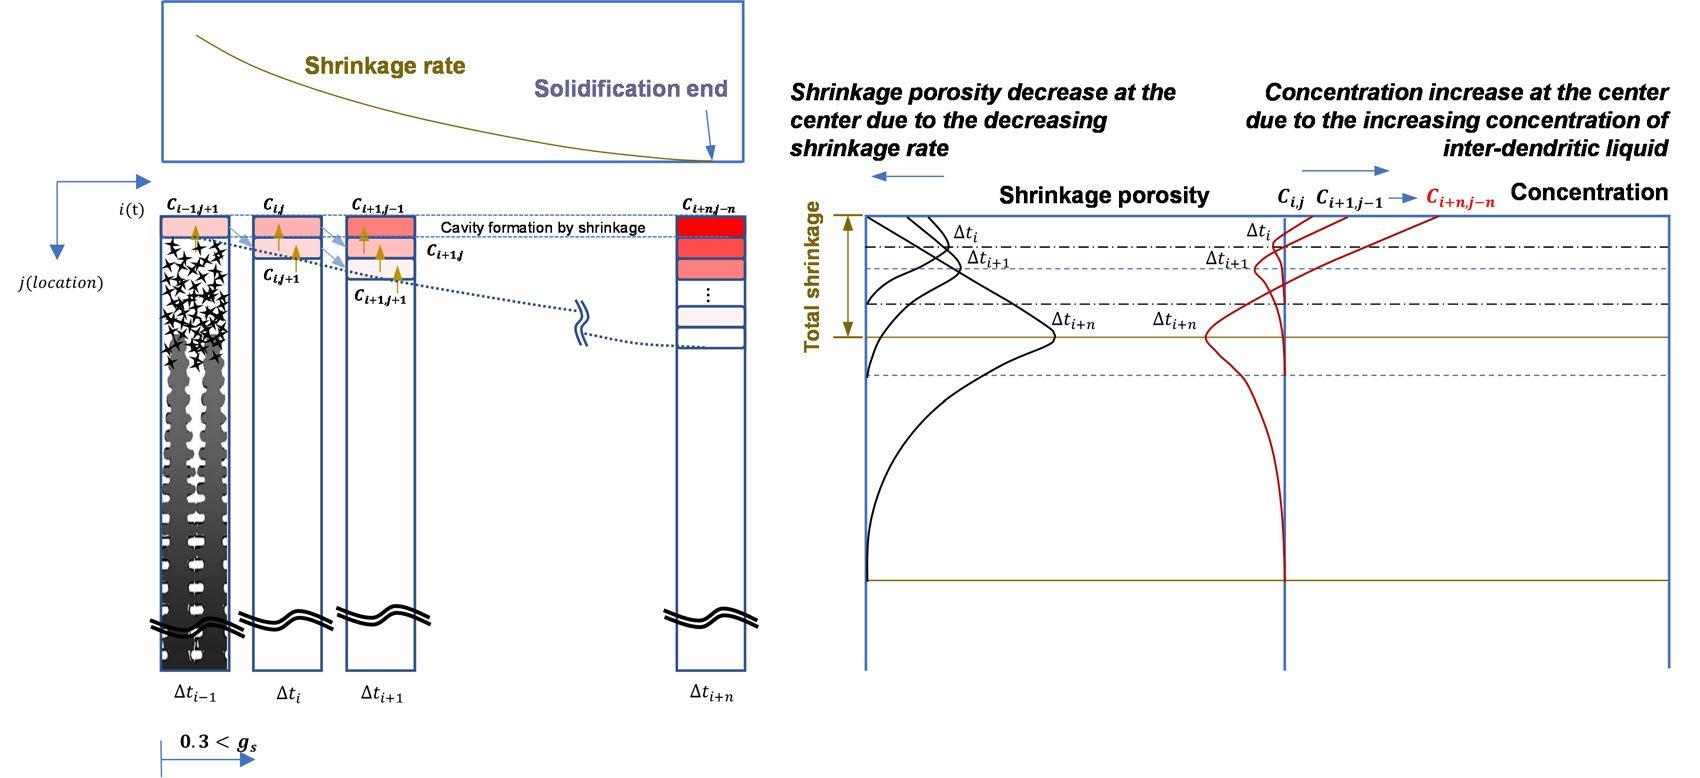
filling it. This solute-rich liquid increases the concentration in the cavity relative to the bulk composition. As the slice moves, this process repeats, progressively enhancing center-segregation. The final center-segregation is achieved at the end of solidification. This concept of the cavity-driven flow mechanism is illustrated schematically
in figure 1. In real scenarios, however, flow along the X-axis also plays a role in macro-segregation. To quantify the influence of X-axis flow, we introduce the Flow Contribution Ratio (FCR), which is defined by . FCR quantifies the relative contribution of Y-axis flow ( ) to the overall flow.

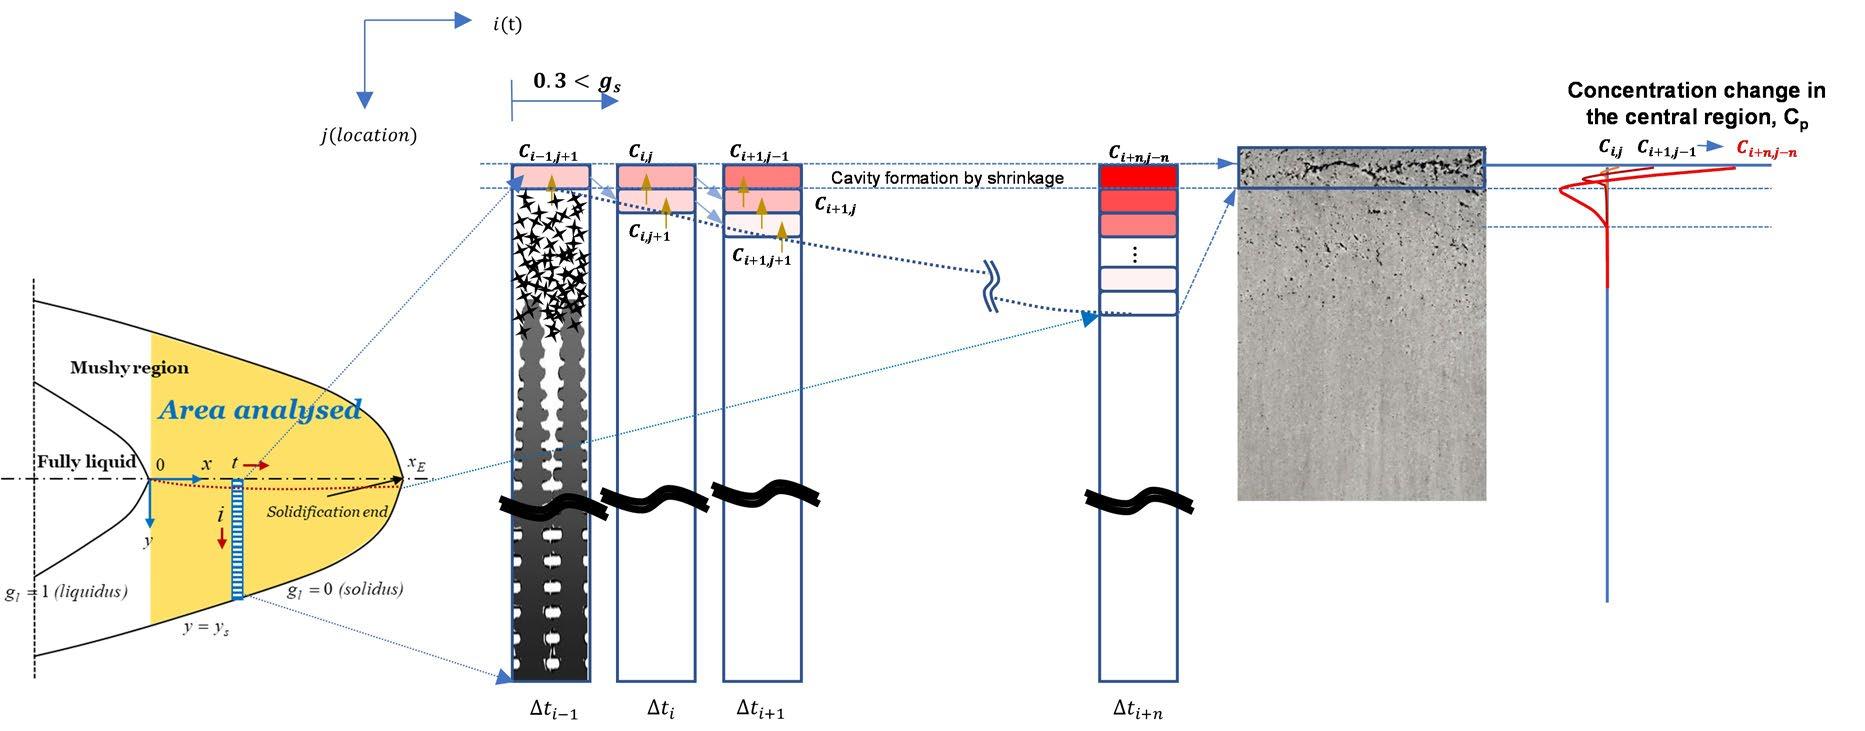
Fig.1 - Center-segregation formation by shrinkage cavity-driven flow.
While macro-segregation is directly caused by , can influence its intensity through a dilution effect. Physically, FCR represents the extent to which mitigates macro-segregation induced by . When FCR approaches 1, the influence of is minimal, leading to stronger macro-segregation. Conversely, when FCR approaches 0, the dilution effect of becomes dominant, significantly reducing macro-segregation. To account for this effect, FCR is multiplied by the concentration of the filling mixture at each time, as shown in Equation 15 and 16. The value of FCR can be determined by the angle of the feeding flow, which can be inferred from the V-shaped segregation observed in the slab or bloom. As the solute-rich


inter-dendritic liquid fills the cavity, shrinkage pores may form at points where the liquid flow begins. While some pores are filled with liquid, others remain unfilled due to restricted liquid feeding caused by the increasing solid fraction. To validate this proposed mechanism, it is essential to measure the pore distribution in future studies. The center concentration can be calculated as following: As described by equation 12, the overall concentration of the filling mixture is represented by . The specific concentrations of filling liquid and solid are denoted by and , respectively. indicates the concentration at the center from the previous time step (equation 13).





The fractions of the filling liquid and solid are represented by and , respectively.


Here, represents the ratio of the filling liquid amount to the original liquid amount, while represents the corresponding ratio for the solid phase. and depends on the mobility of equiaxed-crystal phase, which is affected by factors such as solid fraction and the size of equiaxed-crystals [4]. In this study, only the liquid enters the cavity by assuming =1 and =0. The concentration at the center location within the measured area, M, is denoted by , as described in equation 15 and 16. This area consists of four distinct parts: (1) the initial


cavity filled with solute-rich liquid and equiaxed crystal (first term of equation 16), (2) the region outside the initial cavity (second term in equation 16), (3) the initial cavity not filled (the pores or remained cavities within the initial cavity, , and (4) the pores located outside the initial cavity, . These four distinct parts are represented in figure 2. The initial cavity size without soft reduction is described by , while represents the ratio of soft reduction to the cavity size. Additionally, denotes the bulging amount. The concentration at the center is given by:
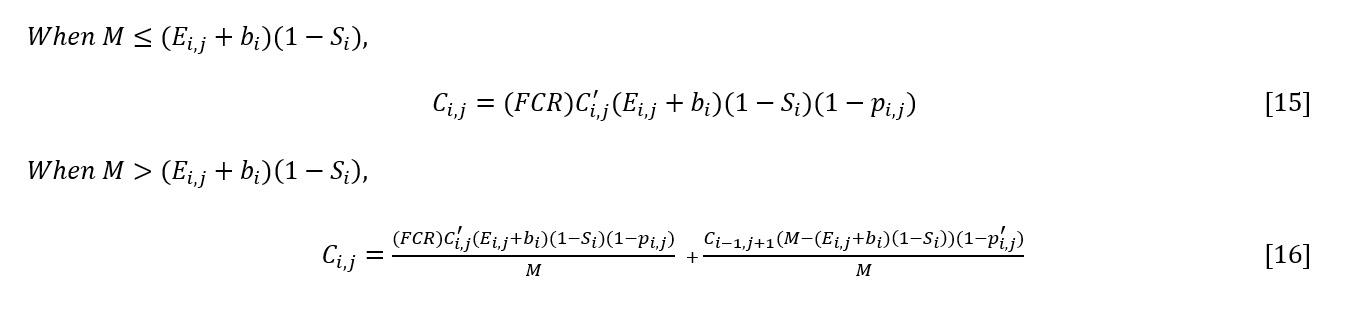
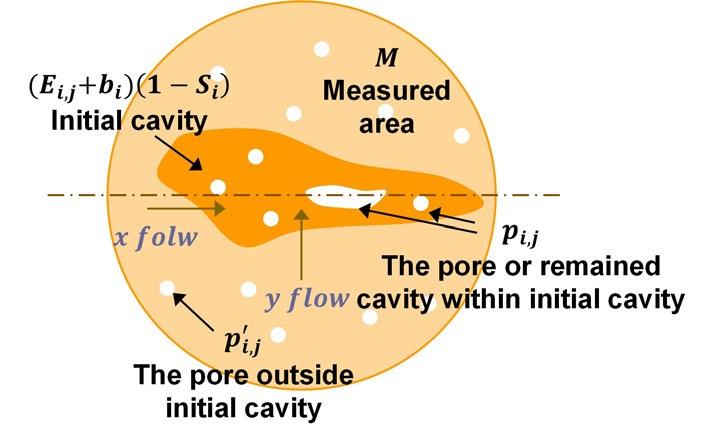
Fig.2 - Center-segregation area with four different parts.
RESULTS AND DISCUSSION
Temperature and Solidification
Figure 3 presents the results of the analysis of temperature distribution and solidification shell thickness for two casting conditions. In the first case, Steel A (slab), with a composition of 0.0594 wt% carbon and 1.179 wt% man-
ganese, was cast at a speed of 1.1 m/min. The slab had a width of 2200 mm and a thickness of 250 mm. In the second case, Steel B (bloom), characterized by a composition of 0.2271 wt% carbon and 0.821 wt% manganese, was cast at a speed of 0.55 m/min, and had a width of 530 mm and a thickness of 390 mm
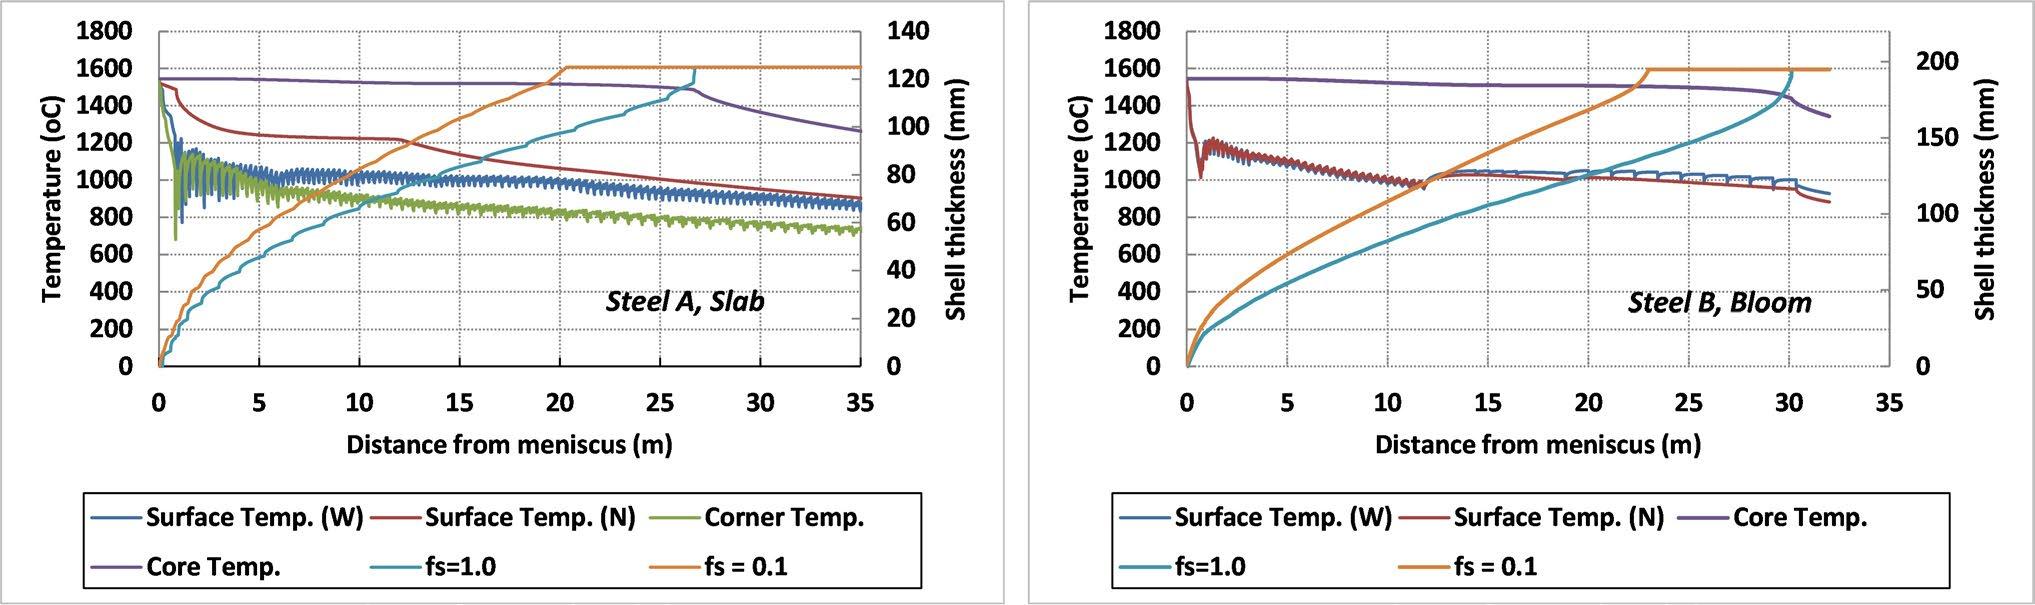
Fig.3 - Temperature and shell thickness along the distance from meniscus (Steel A: Slab, Steel B: Bloom).
The direction of liquid flow is depicted in figure 4, with the X-axis representing the casting direction and the Y-axis representing the thickness from the slab center to the surface. In section A (9.87mm from the center), the X flow moves toward the solidification end. This flow increases but rapidly decreases as it approaches the end of solidification in figure 4(c). The Y flow is directed toward the surface in the upper part of the caster. However, as
it progresses, the flow reverses direction toward the slab center, increases in magnitude, and then diminishes near the solidification end, as depicted in figure 4(d). The maximum velocity toward the slab center develops between the center and the solidus (figure 4(e)). In the model, only the Y velocity is considered for macro-segregation calculations. In the solid/liquid region, the Y flow tends toward the center, which leads to positive macro-segregation.
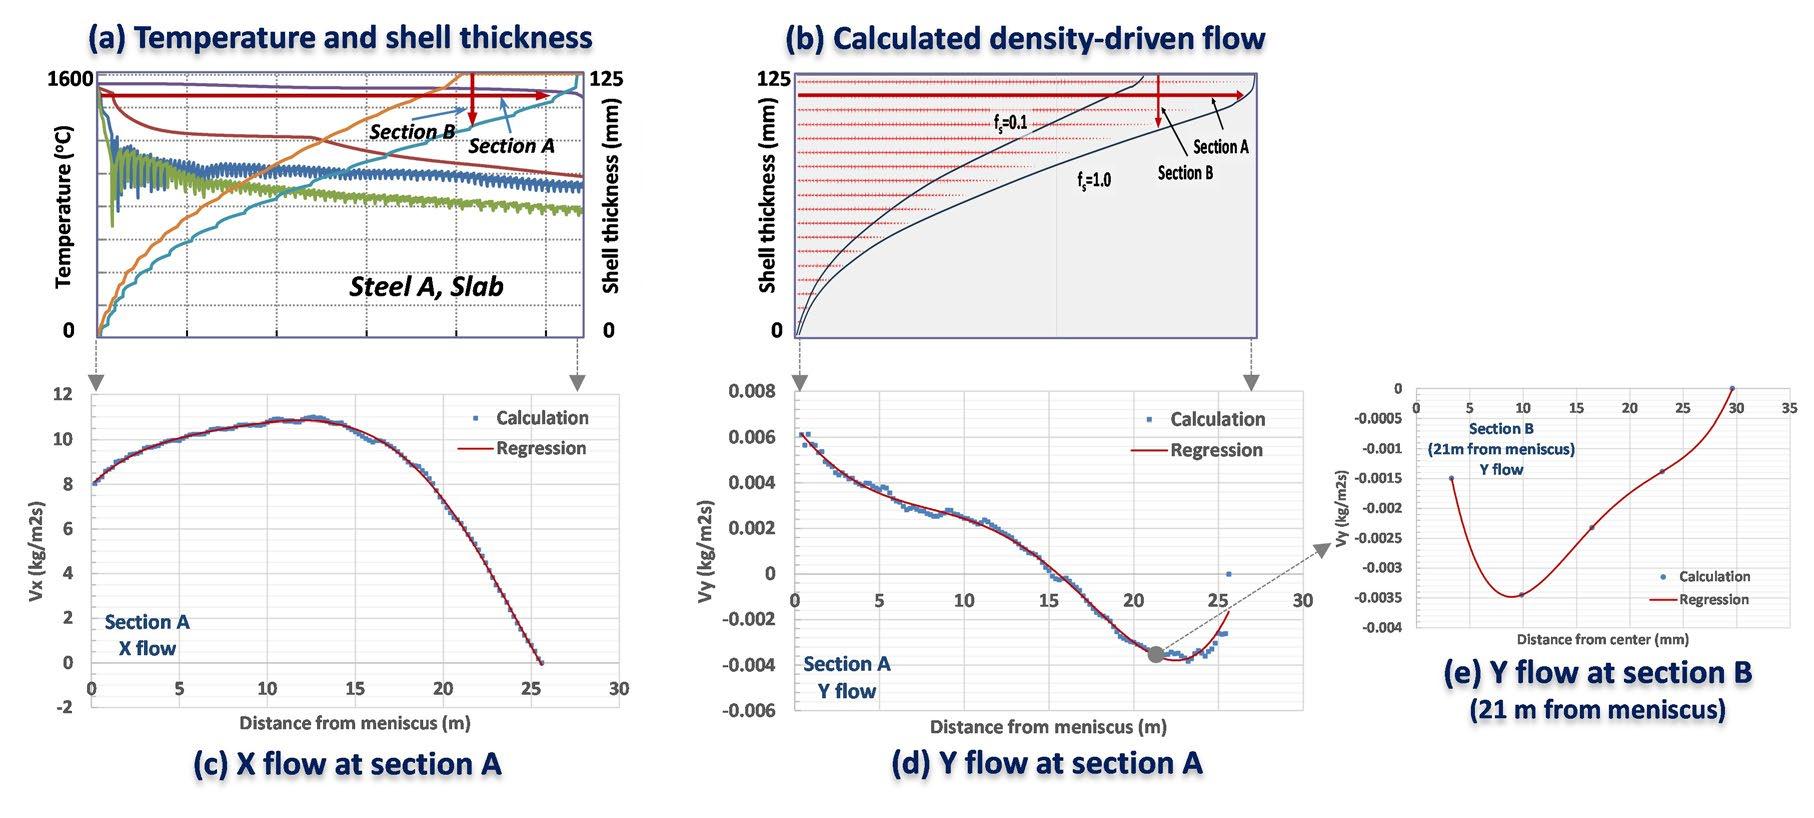
Fig.4 - The calculated results illustrate density-driven liquid flow along the casting direction (x) and thickness direction (y). Positive macro-segregation occurs only when the Y-flow’s negative value moves toward the slab center, specifically between 16m and 26m (the end of solidification) from the meniscus at section A, as depicted in (d).
In real scenarios, X flow mitigates the macro- segregation effects of Y flow. To account for this, FCR is applied, as described in Section 1.3. Since FCR varies with distance in figure 5, the calculated element concentration is multiplied by FCR at each time step during macro-segregation analysis to reflect its influence. Figure 5 provides a comparative analysis of the FCR for both the slab and bloom at equivalent normalized thickness measured from their
respective centers, which are 0.079 based on slab thickness and 0.086 based on bloom thickness. The bloom has a higher absolute FCR within macro-segregation region than the slab, which means that the bloom has higher relative contribution of Y flow to the overall flow than the slab, enhancing more macro-segregation. It is explained in detail in following section 2.3.
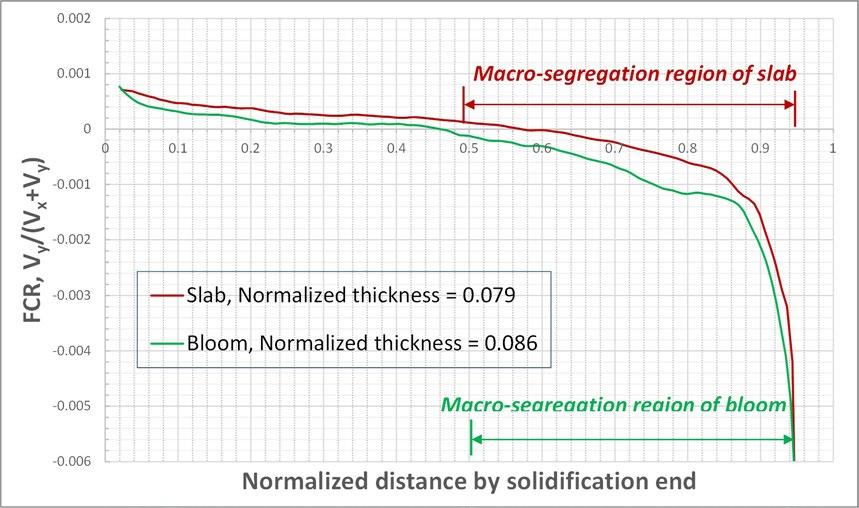
Fig.5 - Flow Contribution Ratio (FCR). Normalized thickness refers to the dimensionless measurement of thickness, calculated from the center of a slab or bloom relative to its overall thickness.
Macro-segregation due to density-driven flow
Figure 6 compares the calculated macro-segregation resulting from density changes with EPMA for the slab, and CS analysis for the bloom, respectively. The results show that slab experiences a slight increase in segregation near the center, extending up to approximately 40 mm, whereas bloom exhibits both a significantly higher level of segregation and a broader affected range, reaching up to 110 mm. This difference is likely due to variations in the length of the mushy zone. As shown in figure 3, the maximum mushy zone length (fs = 0.1 to fs = 1.0) is 27.1 mm for the slab and 57.2 mm for the bloom. This leads to significantly greater solidification shrinkage in bloom (12.2 mm) com-
pared to the slab (4.26 mm), as indicated in figure 7. Although the bloom has a lower flow velocity due to its lower casting speed, figure 5 shows that it has higher absolute FCR values, likely due to greater solidification shrinkage, indicating weaker dilution by X-axis flow. Consequently, the higher FCR in the bloom leads to more pronounced macro-segregation near the center (figure 6). However, the density-driven flow alone cannot account for the positive center-segregation peak observed at the slab (or bloom) center. To address this, we estimate the center-segregation by modeling the filling of liquid into the center cavity.
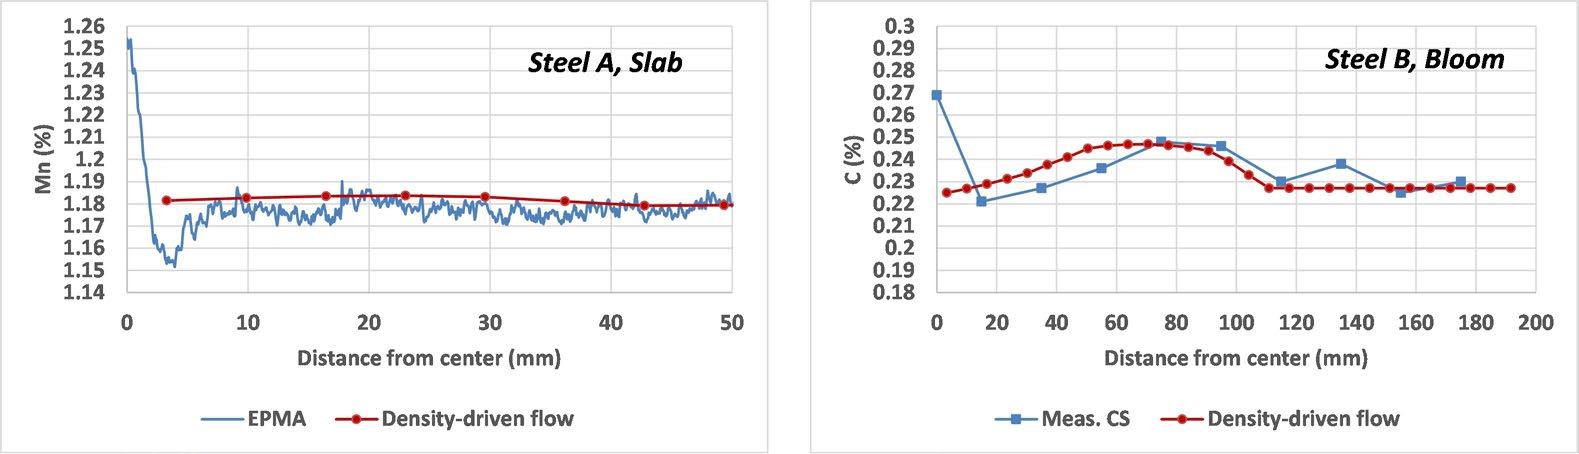
Fig.6 - Comparison of predictions based solely on density-driven flow with EPMA results for slab and CS analysis for bloom.
Center-segregation due to cavity-driven flow
Figure 7 shows the calculated concentration at the center of the slab and bloom, compared with measurements obtained using EPMA and CS analysis respectively. The first three points of calculation represent concentrations evaluated based on cavity-driven flow, while the remaining points are derived from density- driven flow analysis. The second and third points are specifically calculated using solute conservation principles as liquid fills the
central cavity. Cavity-driven and density-driven flows are analyzed separately, with results combined since cavity-driven flow is central and other areas are dominated by density-driven flow. Interaction between these flows likely occurs in the transition region. Coupling both flows is necessary for improved accuracy in future analysis. Notably, the location of the lowest concentration, as measured by EPMA and CS analysis, aligns closely with the extent of shrinkage predicted by the current model.
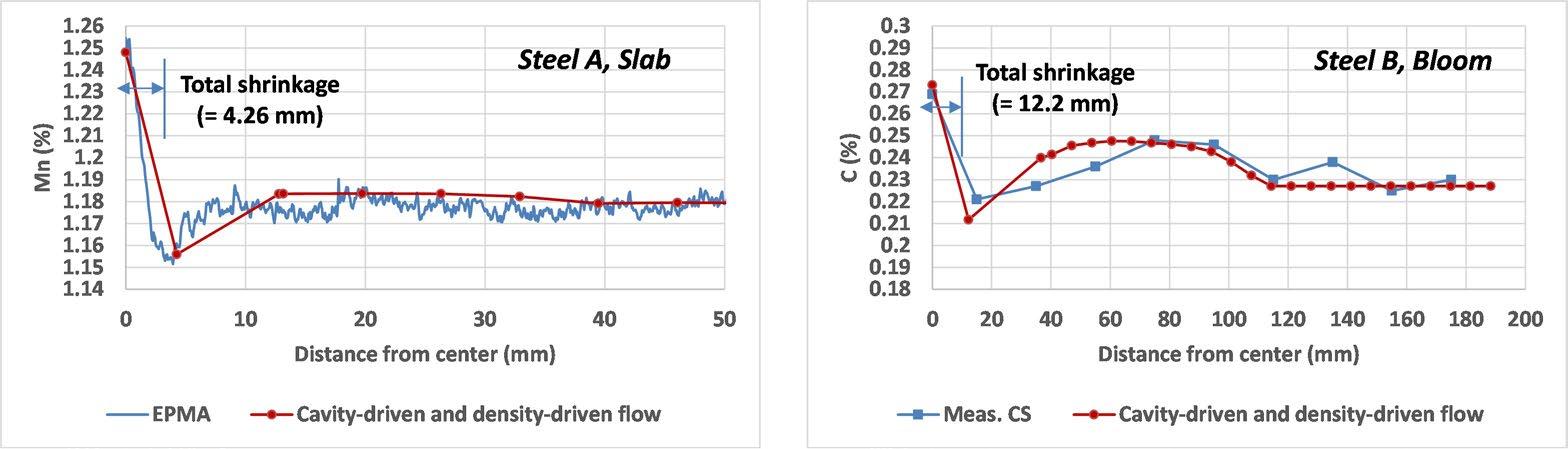
Fig.7 - Comparison of predictions based on density-driven and cavity-driven flow with measured data (EPMA for slab and CS analysis for bloom).
Negative segregation seems strongly associated with how shrinkage pores are distributed through the material’s thickness. This relationship can be theoretically explained by the shrinkage behavior illustrated in figure 8. To begin with, the highest concentration of pores is expected to occur where a shrinkage cavity first develops, as this spot aligns with the greatest rate of shrinkage. As solidification advances, this point moves away from the center, accompanied by a gradual reduction in the shrinkage rate at the center, as shown in the top-left panel of figure 8. This decline in shrinkage rate may lead to a corresponding decrease in pore concentration at the central region. Ultimately, the area representing the total shrinkage thickness displays the greatest degree of negative segregation,
which is attributed to the peak pore concentration. Figure 7 illustrates that the proposed cavity-driven flow model provides an effective explanation for segregation phenomena, particularly with respect to the pronounced positive peak segregation at the center and the negative peak observed at the location of total shrinkage. It is especially notable that the position of the negative segregation peak coincides with the calculated thickness of total shrinkage in the model. The findings provide substantial evidence supporting the hypothesis that negative segregation is correlated with the distribution of shrinkage pores. Additional research is required to deepen our understanding of the mechanisms governing shrinkage pore distribution and its impact on macro-segregation behavior.
The proposed moving-slice model effectively predicts macro-segregation, including center-segregation, in continuous casting by incorporating: (1) Density-driven flow, which explains the positive segregation near the center of cast products. (2) Cavity-driven flow, which accounts for both the positive segregation peak at the center and the negative segregation peak at the total shrinkage location. The model’s predictions are validated against experimental data, confirming its reliability in capturing segregation behavior. Since both density-driven and cavity-driven flow are primarily influenced by mushy zone length and
solidification shrinkage, which vary based on alloy composition, the model can theoretically be extended to other alloy systems beyond those studied. Future research will explore how pore distribution and permeability in liquid feeding affect center- segregation dynamics, further enhancing the model’s applicability.
[1] Donbin Jiang, Weiling Wang, Sen Luo, Cheng Ji, Miaoyong Zhu, “Mechanism of Macro segregation Formation in Continuous Casting Slab: A Numerical Simulation Study,” Metall. Mater. Trans. B, vol. 48B, pp. 3120-3131, 2017
[2] F. Mayer, M. Wu, A. Ludwig. Steel Research Int, vol. 81 n. 8, pp. 660-667, 2010
[3] C. Beckermann, “Modelling of Macro segregation: Applications and future needs,” Int. Materials Reviews, vol. 47, n. 5, pp. 243-261, 2002
[4] M. C. Flemings, “Our Understanding of Macro segregation: Past and Present,” ISIJ International, vol. 40, n. 9, pp. 833-841, 2000
[5] Takemasa Murao, Toshiyuki Kajitani, Hideaki Yamamura, Koichi Anzai, Katsunari Oikawa, Tomoki Sawada, “Simulation of the CenterLine Segregation Generated by the Formation of Bridging,” ISIJ International, vol. 54, n. 2, pp. 359-365, 2014
[6] Tadayoshi Takahashi, Masayuki Kudoh, and Kiyoshi Ichikawa, “Fluidity of the Liquid in the Solid-Liquid Coexisting Zone,” Trans. Japan Inst. Metals, vol. 21, n. 8, pp. 531-538, 1980
[7] Yukinobu Natsume, Daiki Takahashi, Kasumi Kawashima, Eiji Tanigawa, Kenichi Ohsasa, “Evaluation of Permeability for Columnar Dendritic Structures by Three-dimensional Numerical Flow Analysis,” ISIJ International, vol. 54, n. 2, pp. 366-373, 2014
[8] Masayuki Nakada, Kentaro Mori, Shin’ichi Nishioka, Koichi Tsutsumi, Hiroshi Murakami, Yutaka Tsuchida, “Reduction of Macro segregation by Applying a DC Magnetic Field at the Final Stage of Solidification,” ISIJ International, vol. 37, n. 4, pp. 358-364, 1997
[9] Joodong Lee, Seok Seo, “Analysis of Surface Crack Initiation and Growth During Continuous Casting,” AISTech 2018, May 7-10, Philadelphia, USA, 2018
[10] Young-mok Won, Brian G. Thomas, “Simple Model of Micro segregation during Solidification of Steels,” Metall. Mater. Trans. A, vol. 32A, pp. 1755-1767, 2001
[11] Hyundai Steel, Experimental data provided via private communication, 2017
[12] Zarko Radovic, Milisav Lalovic, Milivoje Tripkovic, Branislav Jakic, “Forming of Positive Macro segregations during Steel Ingot Solidification,” ISIJ International, vol. 39, n. 4, pp. 329-334, 1999
[13] J. Miettinen, “Calculation of Solidification-Related Thermophysical Properties for Steels,” Met. Trans. B, vol. 28B, pp. 281-297, 1997
L’Associazione Italiana di Metallurgia è lieta di indire il bando del prestigioso Premio Aldo Daccò - XLV edizione (anno 2026), con l’obiettivo di stimolare i tecnici del settore e contribuire allo sviluppo e al progresso delle tecniche di fonderia e di solidificazione con memorie e studi originali.
L’Associazione invita tutti gli interessati a concorrere al Premio, inviando a mezzo email il testo di memorie inerenti le tematiche fonderia e solidificazione, unitamente al curriculum vitae dell’autore concorrente, entro il 3O giugno 2026
Saranno presi in considerazione e valutati i lavori riguardanti le varie tematiche di fonderia e di solidificazione, sia nel campo delle leghe ferrose che in quello delle leghe e dei metalli non ferrosi.
Il premio, pari a Euro 5000 lordi, è offerto dalla Fondazione Aldo e Cele Daccò, istituita dalla signora Cele Daccò, per onorare la memoria del marito Aldo Daccò, uno dei soci fondatori dell’AIM e suo encomiabile Presidente per molti anni.
Le memorie verranno esaminate da una Commissione giudicatrice designata dal Consiglio Direttivo, il cui giudizio sarà insindacabile. Nel giudicare, la Commissione terrà conto, in particolar modo, dell’originalità del lavoro e dell’argomento in relazione alla reale applicabilità dei risultati. Non sono ammesse candidature da chi abbia già ottenuto riconoscimenti, anche per lavori diversi, dalla Fondazione Aldo e Cele Daccò.
Per informazioni e candidature:
Filippo Turati
Le memorie premiate e quelle considerate meritevoli di segnalazione, potranno essere pubblicate sulla rivista La Metallurgia Italiana.
La cerimonia di premiazione con la consegna della medaglia avrà luogo il 9 settembre 2026, in occasione del 41° Convegno Nazionale AIM.
In the primary steel production, hot metal produced in the blast furnace (BF) is fed via a ladle to the Basic Oxygen Furnace (BOF), where it is converted to liquid steel. During the metallurgical operations, slag can form and solidify on the refractory walls during tapping. These oxide deposits must be periodically removed, to ensure the regularity of BOF operations over time. Cleaning operations slow the process, as they require dedicated plant operations. For this reason, a collaboration between RINA-CSM and ADI was set up to find a solution to shorten the BOF “cleaning times”, by managing the injected o8xygen flow.
The investigated solution (slag-cutting baffle) is based on two countermeasures: an operational one, jet “upstream” flow management, and one “downstream”, thanks to an appropriately designed baffle, adaptable to the heads of the oxygen lances, to properly guide the jet. To comply with the required effects without impacting on internal lining safety, the oxygen jet blown must meet certain requirements. First, it must be oriented and concentrated within a “blade” shape, for a “compact” stream. Furthermore, the jet in the BOF must be fast enough to provide for slag melting, but without local velocity “hot spots”, harmful to internal lining integrity. Therefore, different configurations were designed for the deflecting system (walls, slits), based on the geometric characteristics of the oxygen lances tips. The study presented hereinafter shows the approach to the problem, the configurations designed, the evaluation criteria of the expected performance, and the results of the computational fluid dynamics (CFD) simulations carried out to verify jet performance. This study made it possible to identify critical issues in the initial configurations, and then to fix them, with solutions considered reliable and industrially applied.
KEYWORDS: STEEL; CONVERTER; CFD; MODELLING; NOZZLES; LANCES; METALLURGY;
In primary route steel production, hot metal produced in the blast furnace is charged into the Basic Oxygen Furnace (BOF), where it is refined into liquid steel. During BOF operation, slag is formed and progressively solidifies on the refractory lining in the BOF upper cone section, leading to the well-known skulling formation. These deposits, typically rich in iron oxides, must be periodically removed to ensure safe and efficient furnace operation. Conventional de-skulling practices are mainly mechanical and require dedicated procedures and extended furnace downtime, which can last several hours and significantly affect plant productivity [1-3].
RINA Consulting, Centro Sviluppo Materiali S.p.A, Dalmine, Italy
Alessandro Dell’Uomo, Alessandro Cristallini, Michele De Santis
RINA Consulting, Centro Sviluppo Materiali S.p.A, Rome, Italy
Egidio Cassone, Domenico Esposito
Acciaierie d’Italia S.p.A. in A.S., Italy
Skulling formation and adhesion are influenced by local thermal conditions, slag composition and process parameters. For this reason, increasing attention has been devoted to operational strategies aimed at mitigating slag build-up without negatively impacting the efficiency of converter operations. Among these, to remove skull by means of oxygen blowing directed onto the affected refractory walls zone represents a practical solution. Indeed, as oxygen blowing directly affects both thermal conditions and local flow dynamics near the refractory walls. So, the lance jet management is a key factor to ensure the success of this countermeasure. In this context, the post-combustion technique has gained increasing interest also for skull mitigation. However, drawbacks like increased refractory wear or reduced lance lifetime are also reported [4, 5]. In order to reduce idle times to restore the furnace and in order to avoid huge plant modifications, a different approach, i.e. an oxygen deflector, is here presented.
Therefore, the present study applies CFD simulations to evaluate different configurations of the oxygen jet deflector, assessing their impact on jet homogeneity, velocity distribution and wall impingement characteristics. The numerical results are used to identify critical design features and to support geometry optimization, with validation provided through comparison with industrial observations. This integrated numerical-industrial approach aims to bridge the gap between modeling and practical applications, offering a reliable methodology for the design of oxygen jet management solutions for BOF deskulling operations.
In primary steel production, steel conversion occurs in the Basic Oxygen Furnace (BOF). During the metallurgical operations, slag forms and solidifies on the upper cone inner refractory walls, requiring periodic material removal and in turn affecting productivity. To eliminate slag deposits on the converter, the technical solution identified at ADI steelworks, considering the existing plant layout, was to install a deflector, hooked with tie rods, and placed downstream with respect to the lance tip, to deflect the O2 jet onto the walls. The idea called
for a suitable deflection system design to manage the flow from the lance, promoting slag melting and removal through oxygen-assisted action, while maintaining a homogeneous flow distribution and preserving lining safety.
The next step consisted of checking the reliability of different deflectors’ geometry and positions to identify the most efficient configuration for the purpose. The activity was developed within a collaboration between RINA-CSM and Acciaierie d’Italia and was based on CFD (Computational Fluid Dynamics) simulations by RINA-CSM, with vast expertise in the matter (e.g., [1]). In particular, the CFD approach relies on the description of the behavior of supersonic oxygen jets in BOF steelmaking. This issue has been extensively investigated in the literature, with particular emphasis on jet coherence, penetration depth and momentum transfer as a function of lance height, nozzle geometry and operating pressure [6, 7]. Nowadays, CFD represents a consolidated tool for analyzing oxygen jet behavior, enabling detailed characterization of velocity fields, jet interactions and impingement patterns. CFDbased approaches have proven effective in supporting lance design and operational optimization, reducing the need for costly trial-and-error plant testing [8-10].
However, most existing studies focus on upstream jet generation and lance tip geometry, while comparatively limited attention has been paid to downstream flow manipulation solutions. Only a few contributions address auxiliary or geometric devices designed to modify jet direction or energy distribution after its formation, and these are generally not conceived for de-skulling purposes [11, 12]. In particular, systematic CFD-based evaluations of dedicated jet-deflecting systems aimed at achieving effective slag removal while avoiding localized velocity hot spots that could compromise refractory lining integrity remain scarcely documented in open literature. The CFD code used for this study is ANSYS Fluent (version 2023-R2) to solve conservation of mass, momentum and energy equations. Turbulence is described via SSTk ω with compressibility effects and curvature correction. Energy equation is activated, and an ideal gas is used to model the compressibility of the O2 gas. A flow rate of 200 Nm3/min was imposed, (as “mass flow inlet”) under oper-
ating conditions of 1600°C surrounding temperature. The domain represented is long 2,5 m and meshed with about 2,5 million of cells (prismatic layer on the lance walls and polyhedral core mesh).
Under the mentioned conditions, the different layout options were the only options for the different cases simulated.
A schematic of the system lance-deflector is shown in figure 1. The plate below the lance is drilled centrally to
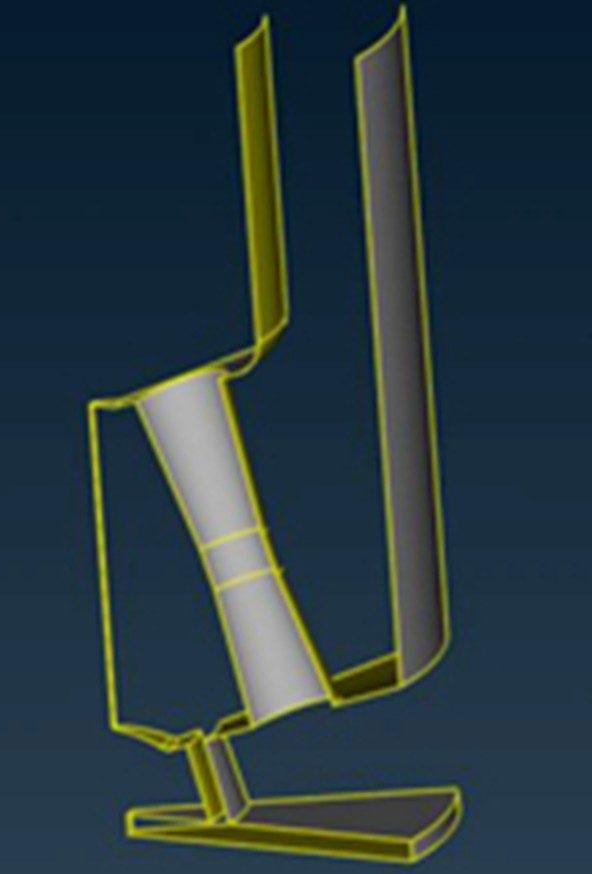
reduce the mechanical load on the plate for stability. The proposed deflector is mechanically connected to the oxygen lance head and incorporates slit based outlets and guiding walls. Its purpose is to transform the primary jet into a thin, blade like flow capable of:
• distributing the jet over a nearly 360° pattern;
• maintaining adequate kinetic energy for slag removal;
• avoiding localized high velocity zones that risk damaging the refractory lining.
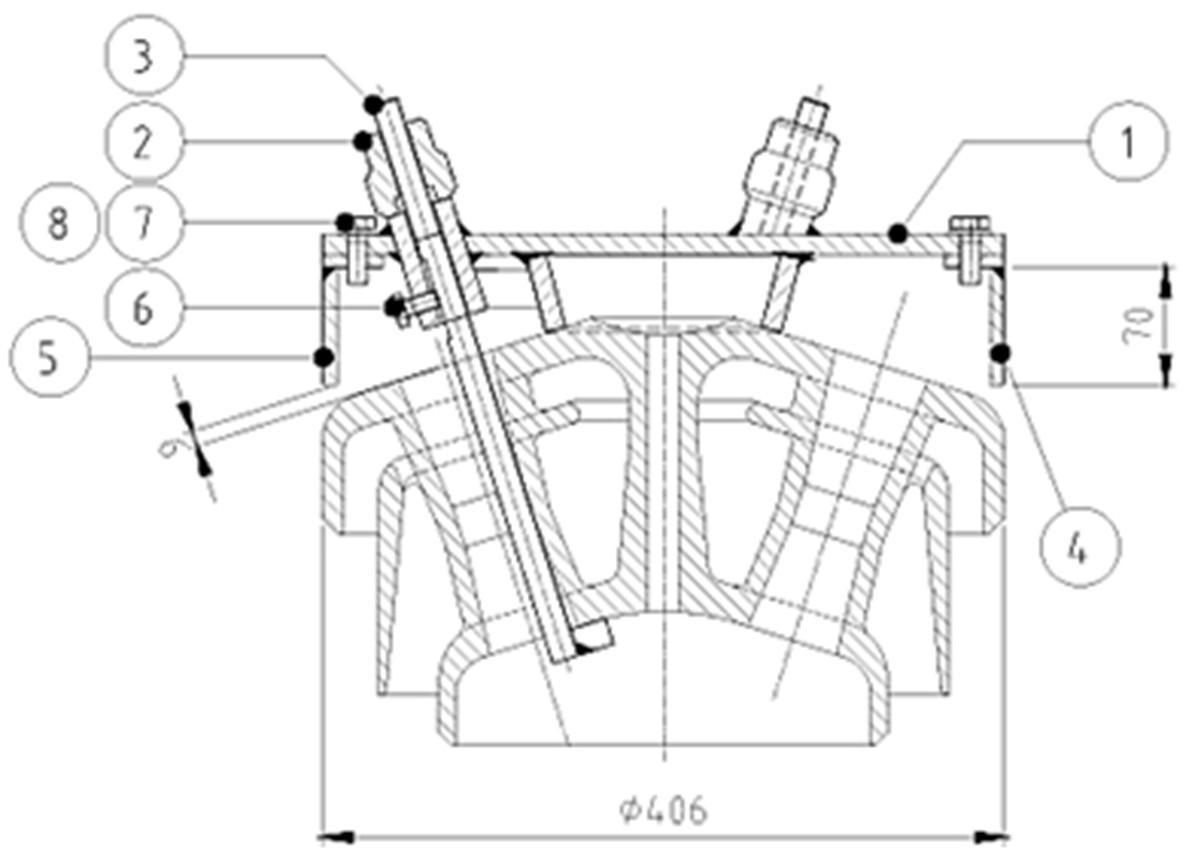
The purposes of the new configurations were, on the one hand, to make uniform the jet over 360° in the lance-walls space, on the other hand to let the distributed flow have kinetic energy enough to perform the desired removal action.
CFD simulations indicate that the reference geometry produces a compact and strongly directional jet, with limited lateral dispersion. Modified configurations yielded varying degrees of jet widening, upward deviation, and interaction with leakage streams.
An example of a velocity field from the lance is shown in figure 2, for a reference configuration (top-left) and sever-
al modified ones (top-right and bottom row). The results of the fluid velocity analyses are com-prehensively shown in figure 3, showing the configurations tested and the related flow field on a plane at 2500 mm from the center of the head.
Some configurations exhibited strong interference between the primary jet and leakage flows exiting secondary slits. These interactions resulted in non-uniform circumferential velocity distributions and undesired vertical deviations. The velocity field is not perfectly uniform, since the jets can have mutual interactions, thus the velocity can locally increase and decrease, see figure 4, showing the nozzle position in correspondence with velocity peaks on the 2500 mm-distance plane.
Part of the design was aimed at reducing such inhomogeneity. In other cases, the jet is deflected upwards. In short: - from configuration 0 (reference), highly sectorial flow and poor uniformity results;
- for configuration 1-2, improved circumferential distribution but still local peaks;
- for configuration 3, strong upward deviation because of main-secondary flow interaction;
- for configuration 4-5, with geometry adjustments, improved flow uniformity result show non uniformities;
- for configuration 5, the best overall uniformity and acceptable peak velocities are achieved.
Overall, a comparison between nozzle positions and velocity peaks indicates that non uniformities can often be traced to geometric asymmetries or unintended leakage paths.
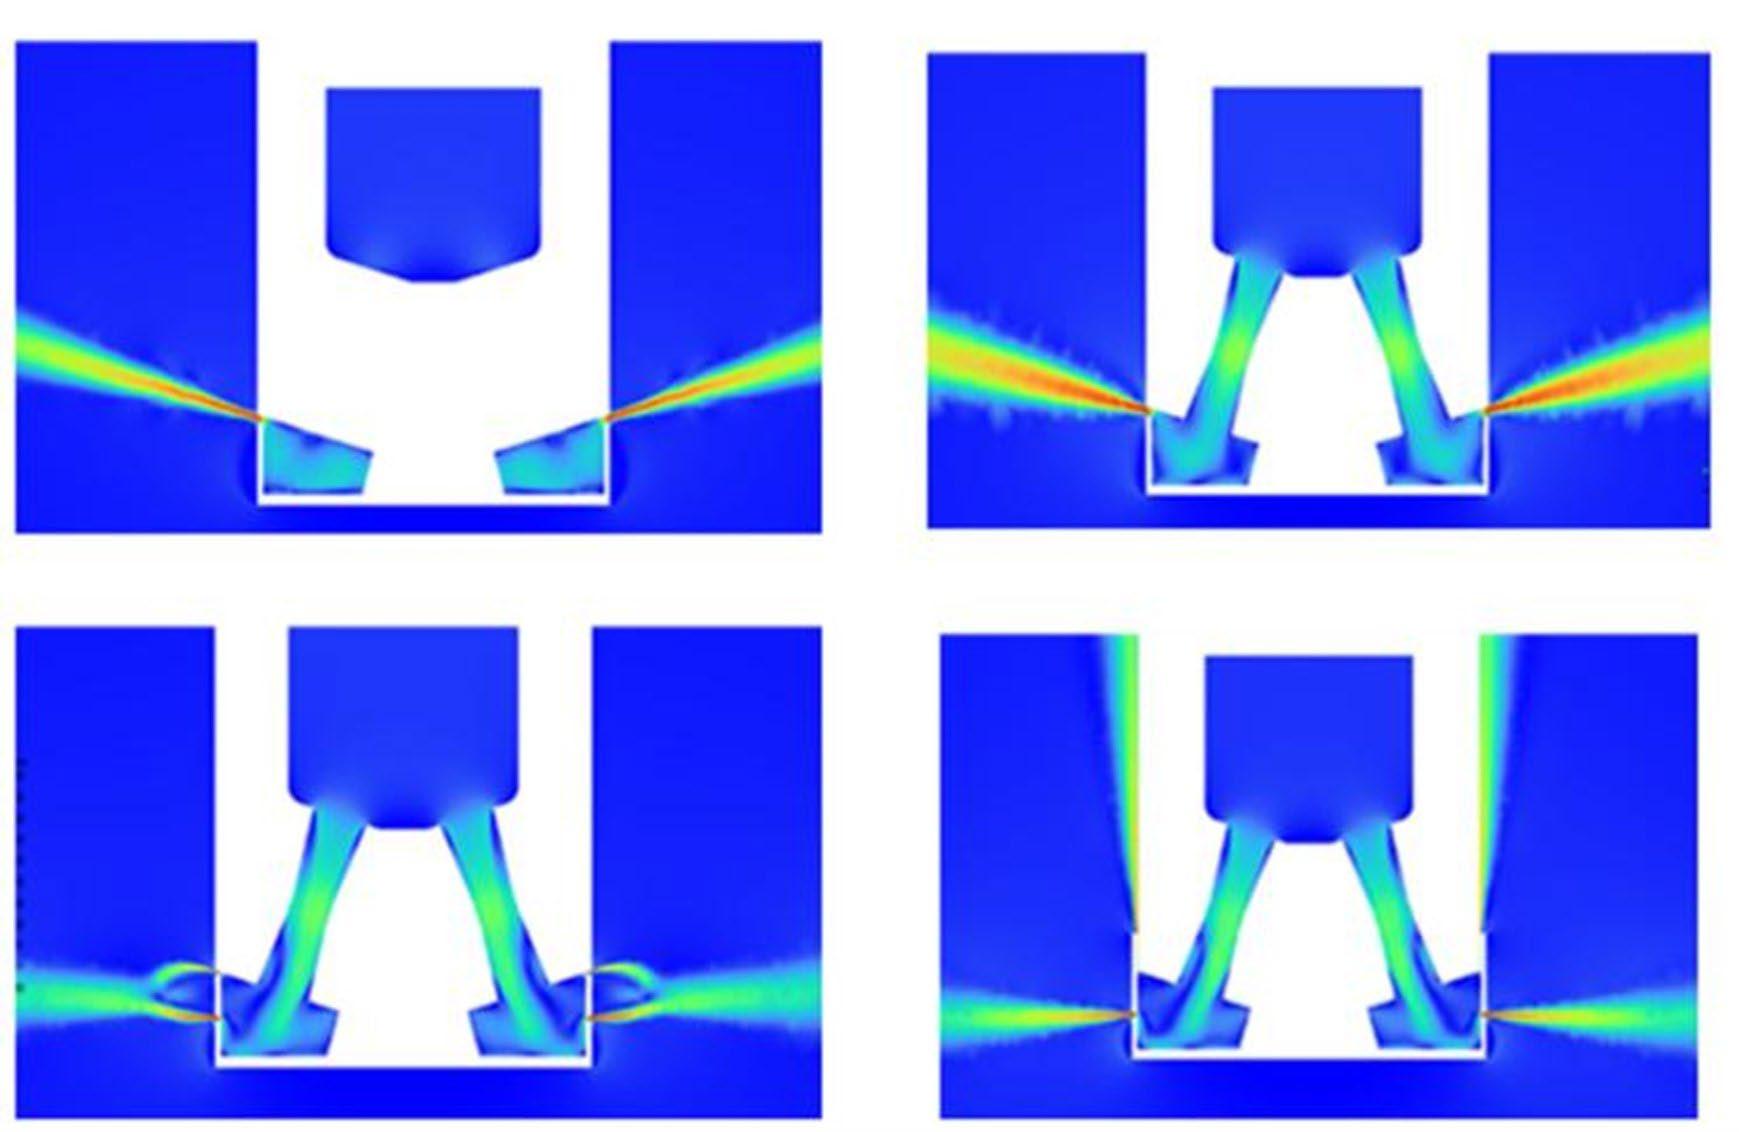
The simulations highlight that even small leakage flows can substantially distort the final jet pattern. Man-aging these interactions through careful control of slit geometry, wall inclination, and deflector thickness is essential to achieving a homogeneous circumferential field.
The improvements observed in configuration 5 demonstrate that downstream jet manipulation can be effectively engineered without compromising jet coherence or refractory safety. This supports the value of CFD guided design for BOF oxygen lance accessories.
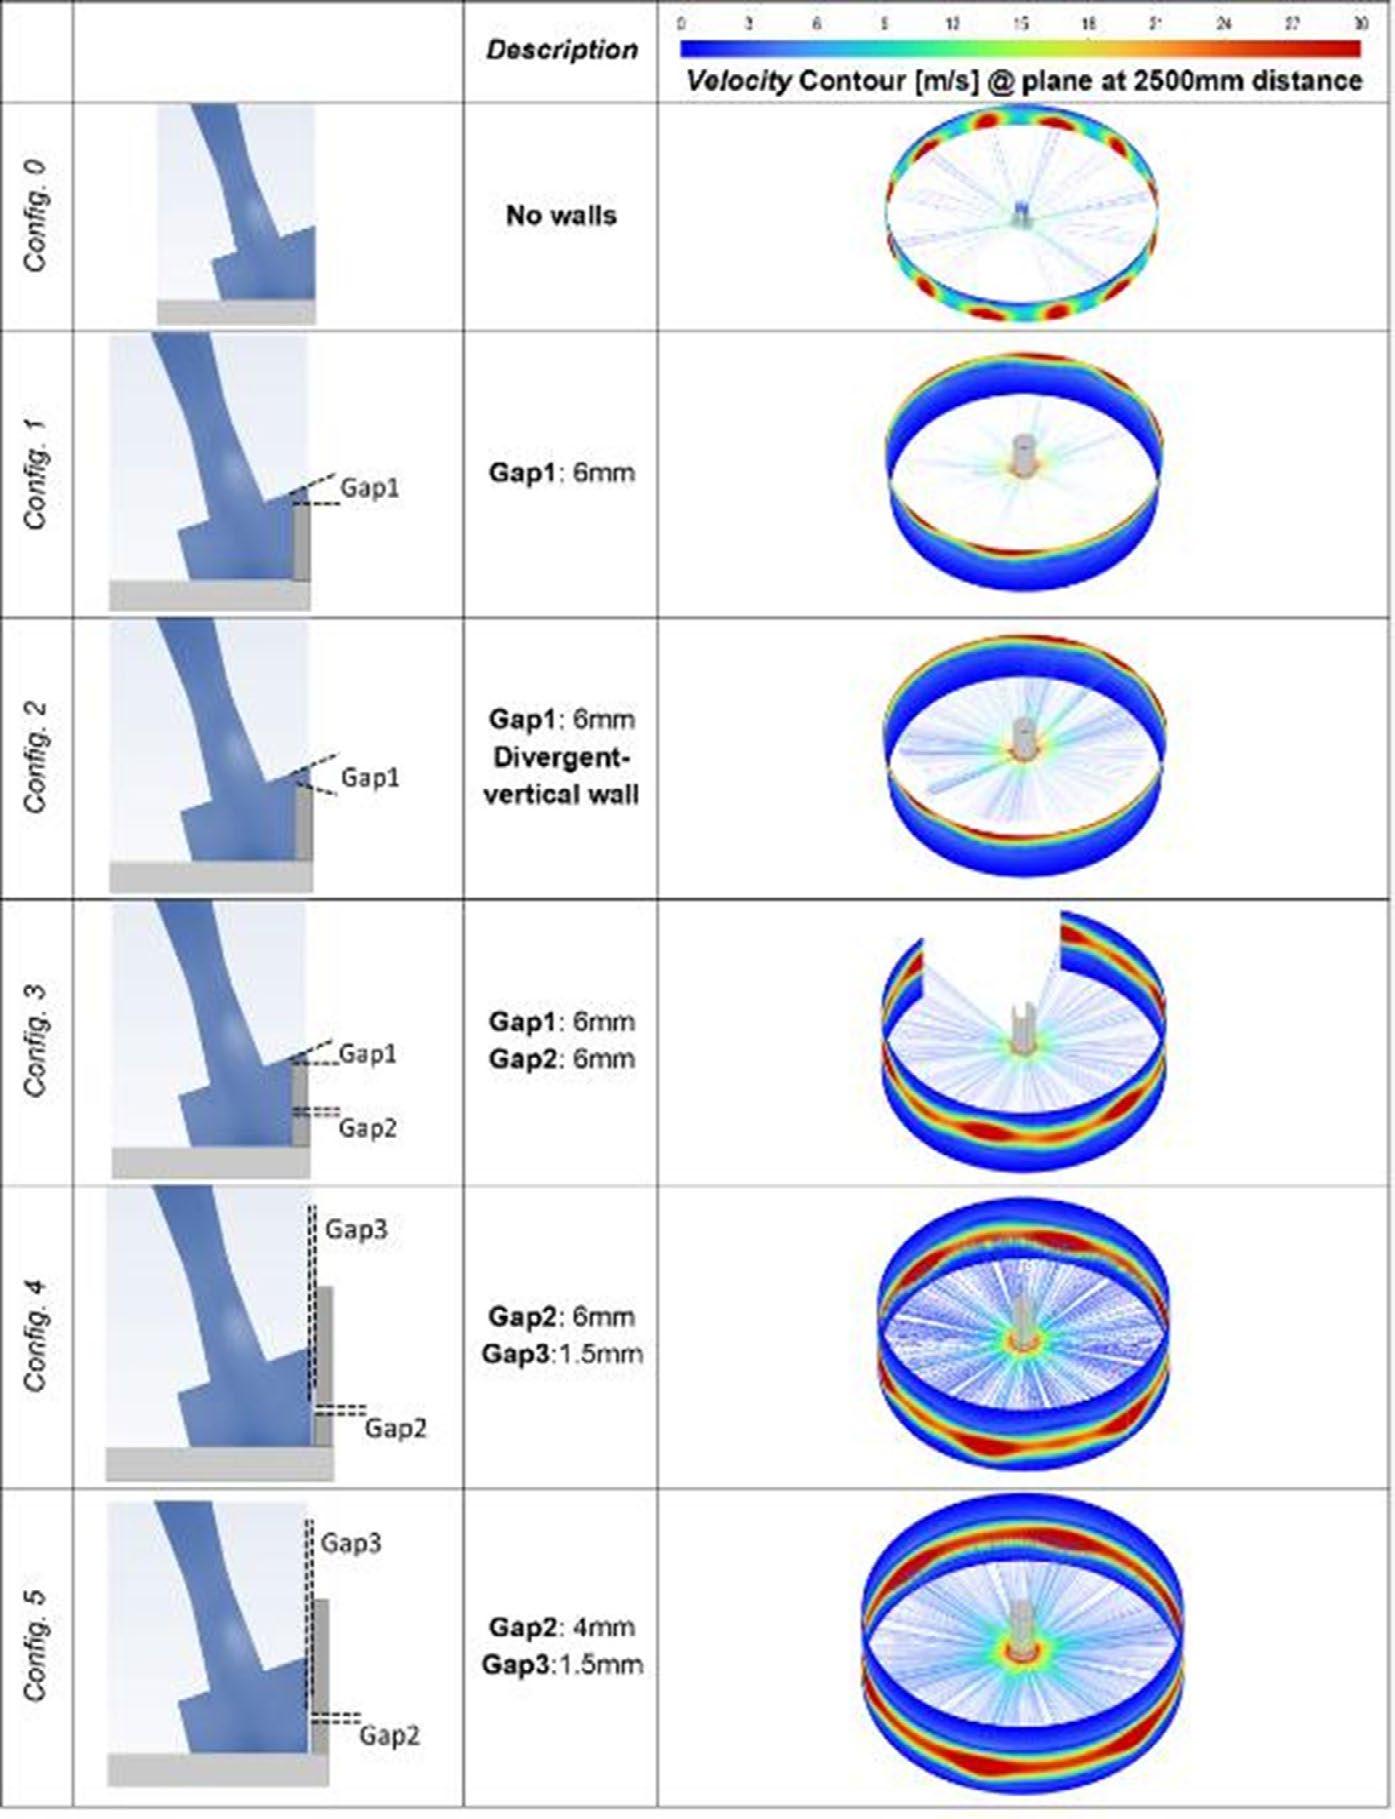
Fig.3 - Overview of the configurations identified for the CFD simulations and velocity field along the reference wall.
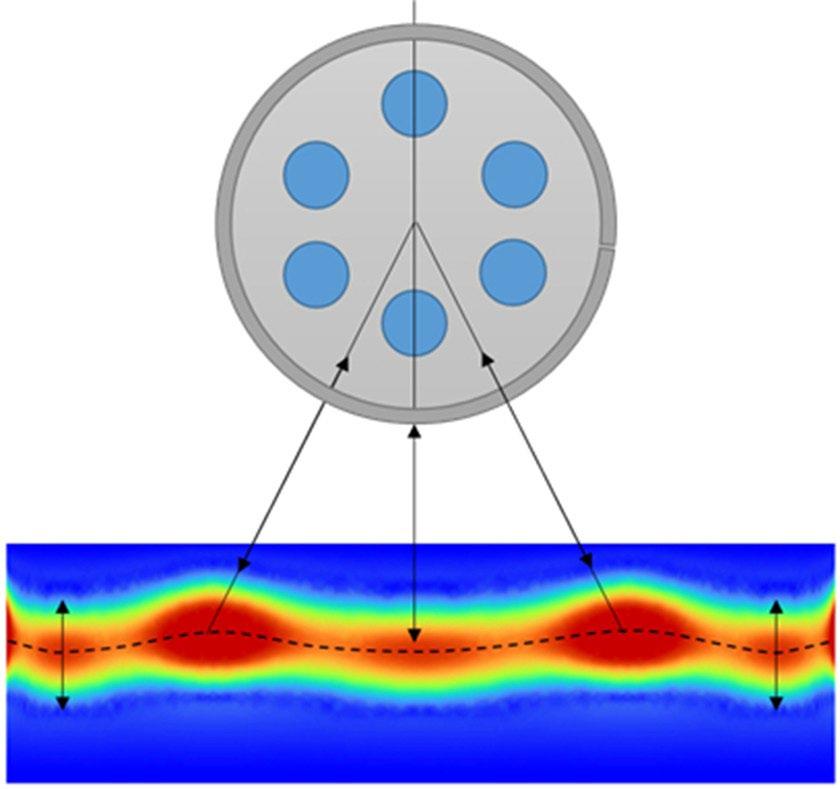
Fig.4 - Nozzle position correspondence with velocity peaks on the 2500 mm-distance plane.
Configuration 5 was tested successfully on-field, with:
• proper jet redirection toward slag impact regions;
• stable flow behaviour without lining over erosion;
• reduced cleaning time (qualitative);
• consistent performance across multiple heats.
To the scope, a comparison between the predicted flowfield and its effects during the industrial test is shown in figure 5 and an impressive matching can be noticed, showing the reliability of the solution pro-posed.
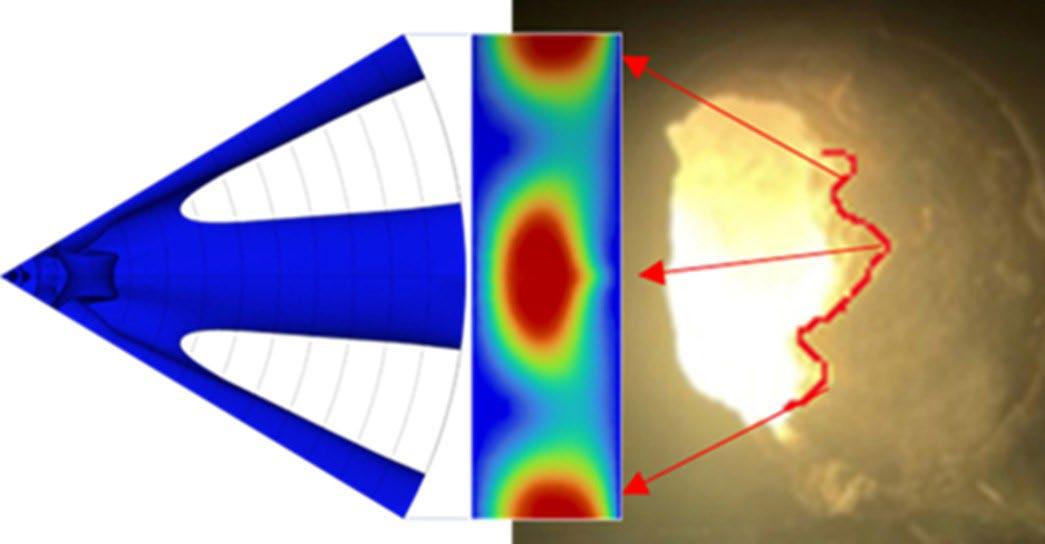
- Comparison between predicted flow field from CFD and image from industrial testing.
A collaboration between RINA-CSM and Acciaierie d’Italia S.p.A. in A.S. allowed this project to achieve a successful problem-solving action based on a strong synergy between operational insights and modelling tools. In particular, a downstream deflector system was designed to improve BOF slag removal by redistributing the oxygen jet
over the converter walls. The CFD simulations identified key flow interactions affecting jet uniformity and guided the geometry optimisation, and the final configuration achieved near-uniform circumferential distribution the BOF wall without harmful velocity peaks.
Plant validation confirmed the reliability and operational benefits of the optimized deflector.
[1] V. Battaglia, E. Malfa, M. Fantuzzi, E. Filippini, “Operational issues and solutions in BOF steelmaking,” Metall. Ital., No. 9, pp. 37-44, 2011.
[2] J. Doggen, J. Van den Berg, D. Sichen, “Slag-refractory interactions in basic oxygen furnaces,” Ironmak. Steelmak., 36, pp. 123-130, 2009.
[3] S. M. Jung, R. J. Fruehan, “Mechanisms of slag adhesion and skull formation in BOF operations,” ISIJ Int., 54, pp. 178-186, 2014.
[4] O. Haile, H. Lauri, “Post combustion in converter steelmaking,” 1997.
[5] J. Lehner, M. W. Egger, H. Panhofer, M. J. Strelbisky, “First operating experiences with post-combustion lances at BPOF shop ld3”, 48th Steelmaking, Casting and Non-Ferrous Metallurgy Seminar — Vol. 48, num. 48 (2017).
[6] S. C. Koria, K. W. Lange, “Characteristics of supersonic oxygen jets used in BOF steelmaking,” Steel Res., 58, pp. 421-427, 1987.
[7] J. Szekely, N. J. Themelis, Rate Phenomena in Process Metallurgy. New York, 1989.
[8] B. Li and F. Tsukihashi, “Three-dimensional CFD analysis of oxygen jet behavior in BOF steelmaking,” Metall. Mater. Trans. B, 41, pp. 123-132, 2010.
[9] K. Gu, L. Zhang, M. Wang, “Numerical simulation of multi-jet interactions in BOF operations,” ISIJ Int., 56, pp. 541-550, 2016.
[10] K. Chattopadhyay, D. Mazumdar, “CFD modeling of turbulent supersonic jets in steelmaking reactors,” Ironmak. Steelmak., 45, pp. 541-550, 2018.
[11] Y. Zhang, C. Liu, J. He, “Effect of lance geometry on oxygen jet distribution in BOF,” J. Mater. Process. Technol., 244, pp. 1-9, 2017.
[12] J. Wu, J. Li, Q. Chen, “Directional control of oxygen jets for non-standard BOF applications,” Metall. Mater. Trans. B, 50, pp. 21502160, 2019.
10.36146/2026_03_22
M. Sanchez, C. Bavière, P. Garmier, D, Basic, C. Sihler, T. Aujoulat, D. Djerbal, L. Fahrner, K. Delsol
Decarbonizing steelmaking is one of the greatest challenges facing the steel industry today. Electrifying steel production is a pivotal step in reducing CO 2 emissions. Over the coming years, the installed base of high-power EAF is expected to grow significantly, which will affect power quality but also EAF performances. To address these challenges, GE Vernova has developed an innovative solution.
The Direct Feed system connects directly to the grid, enabling precise and highly stable electrode current regulation.
Design of the Direct Feed system will be presented with performance results derived from simulations and on-site measurements. Key outcomes, including improvements in EAF flicker reduction and operational performance, are highlighted.
KEYWORDS: STEELMAKING; EAF; POWER SUPPLY; DECARBONIZATION; ELECTRIFICATION;
INTRODUCTION
BF Blast Furnace
BOF Basic Oxygen Furnace
EAF Electric Arc Furnace
ESF Electrical Smelting Furnace
OSBF Open Bath Furnace
DRI Direct Reduced Iron
HMMR Hybrid Modular Multilevel Rectifier
MMC Modular Multilevel Converter
HVDC High Voltage Direct Current
IGBT Insulated-Gate Bipolar Transistor
THD Total Harmonic Distortion
PCC Point of Common Coupling
ΔU Voltage variation
ΔI Current variation
AC Alternating Current
DC Direct Current
KPI Key Performance Indicator
FFT Fast Fourier Transform
P Active power
Q Reactive power
I Current
U Voltage
δ Depth of penetration
σ electrical conductivity
f frequency
X Inductive reactance
Mathieu Sanchez, Cyrille Bavière, Pierre-Louis Garmier, Duro Basic, Christof Sihler, Thierry Aujoulat, Djafer Djerbal, Laurent Fahrner, Kevin Delsol
GE Vernova, France
L Inductance
D Diameter
J Current Density
With around 2t CO2/t of steel, the iron and steel industry is responsible for around 7-8% of the total CO2 emissions in the world (figure 1).
These high carbon emissions are mainly due to the BFBOF route: 71% of the global steel production with 2.33 t CO2/t of crude steel. On the contrary, the EAF route produces less than 1 t CO2/t of crude steel (for scrap based) but represents only 29% of the world production (including DRI based) [2].
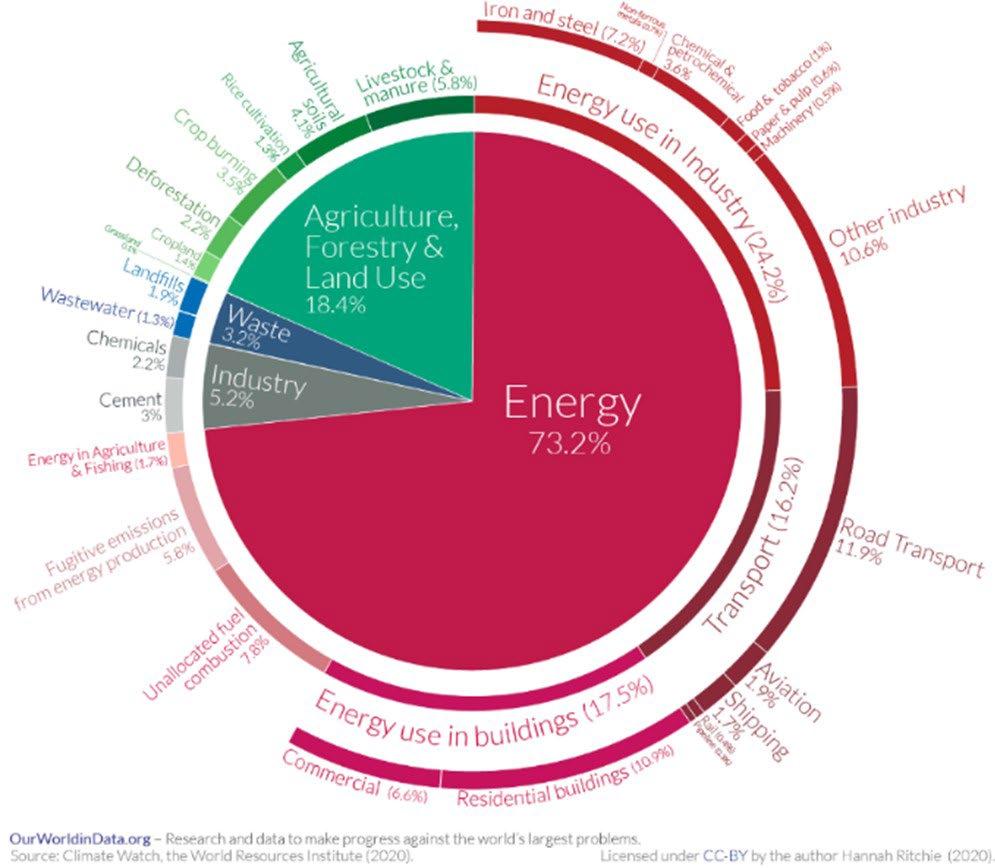
Fig.1 - Global greenhouse gas emissions by sector – Our World in Data [1].
Through 2030, OECD is expecting an increase of the world steel demand around 0.9% and emerging markets, excepted China, are planned to have a rebound in the steel consumption [3].
To decarbonize the industry, all the Net Zero scenarios are based on the energy production from renewable energy associated to the electrification of the industry [5].
In the ironmaking and steelmaking industries, electrification is also one of the pillars of decarbonization. All the future routes that are in development are based on process using electricity:
- iron ore electrolysis for direct production of iron from iron ore;
- water electrolysis to produce hydrogen for H-DRI production;
- smelters (ESF/OSBF) to produce hot metal from DRI;
- EAF for melting and refining.
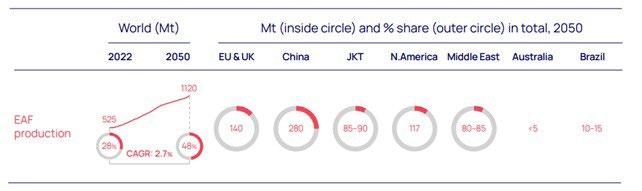
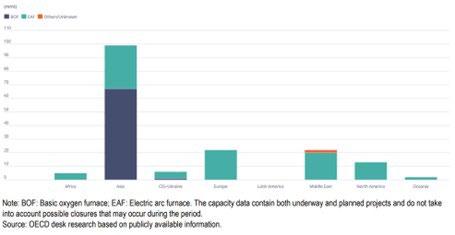
The EAF process has the advantage of being already in operation with DRI and scrap with low CO2 emissions. It will be used to melt solid iron produced by electrolysis or H-DRI and to replace the existing BF-BOF routes. In consequence a high increase of steel production through EAF is planned (figure 2). Wood Mackenzie is expecting an increase up to 48 % of the world production in 2050. The EAF deployment has already started. Today, most of the investments to increase steel capacity are done for EAF as presented by OCDE in figure 3.
This steelmaking revolution will be associated with several challenges:
- steel quality: to produce steel with low P, S, N, C content in EAF requires high quality materials leading to tensions on high quality scraps and DRI produced from DR grade iron ore;
- productivity: to match with BF-BOF productivity the tap-to-tap time of EAF needs to be optimized;
- furnace size: to match with BF-BOF capacity, the size of furnaces must be increased significantly leading to issues on power supply and power quality.
In parallel, the International Energy agency is expecting a high increase in renewable energy as described in figure 4. The simultaneous growth of renewable energy penetration and EAFs operation poses a complex challenge to power system stability and power quality. Renewable energy leads to inertia and short-circuits reduction, limiting the grid’s ability to withstand disturbances. In parallel, EAFs introduce large and non-linear loads that generate severe flicker and harmonic distortions and rapid voltage and active/reactive power fluctuations.
In other words, the future of steelmaking, driven by increased EAF production and higher renewable energy penetration, will face important power system challenges in addition to process related issues like availability, productivity and quality of raw materials.
To deal with these challenges, GE Vernova developed a power supply solution called Direct Feed [8]. Unlike conventional EAF installations relying on passive compensation with SVC and Statcom [9], the proposed approach leverages high-power power-electronics converters directly connected to the grid. This architecture enables active impedance control and precise electrode current regulation, significantly improving arc stability and furnace operational KPIs. In addition, the Direct Feed configuration contributes to improved grid power quality by reducing disturbances such as flicker and harmonic distortion. This work therefore demonstrates a new paradigm for grid-friendly large-scale EAF electrification based on power electronics.
[3].
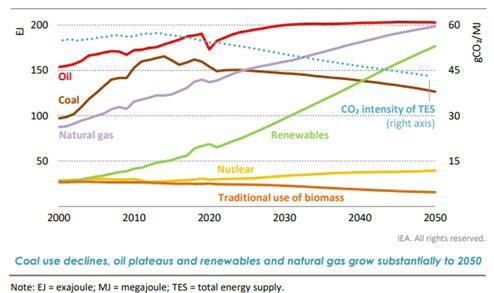
Fig.4 - Evolution and estimation of energy production by sources between 2000 and 2050 [5].
Direct Feed is a Medium Voltage (MV) Multilevel Modular Converter (MMC) based on a patented solution made of an MMC active front end rectifier (Grid converter) and a MMC Inverter (EAF Converter), more frequently referred to as back-to-back (B2B) converter (figure 5).
The MMC technology has been trusted by the Grid industry for more than a decade. It has been widely used in HVDC in the 300-500 MW range all around the world and more recently up to 1GW [6].
The same technology has also been used very efficiently in EAF and Grid Utility Statcom to address flicker issue. Building on a decade of experience and technology maturity, the Direct Feed for EAF is intended to bring Grid and EAF performances together towards a more efficient and more sustainable steel industry.
Direct Feed allows complete control of energy transfer from the grid to the EAF by controlling:
• current;
• voltage;
• impedance;
• frequency.
The standard MMC back-to-back converter used in HVDC application is designed to provide a bidirectional power flow unlike in EAF where the power only flows from the grid to the furnace. To this end, GE Vernova developed a patented solution to optimize the design of new converter for EAF.
By combining actively switched MMC submodule (IGBT) to diode rectifier building blocks, the hybrid solution provides both AC and DC current controls to the input grid converter while reducing the converter overall volume its volume, weight as well as increasing its efficiency.
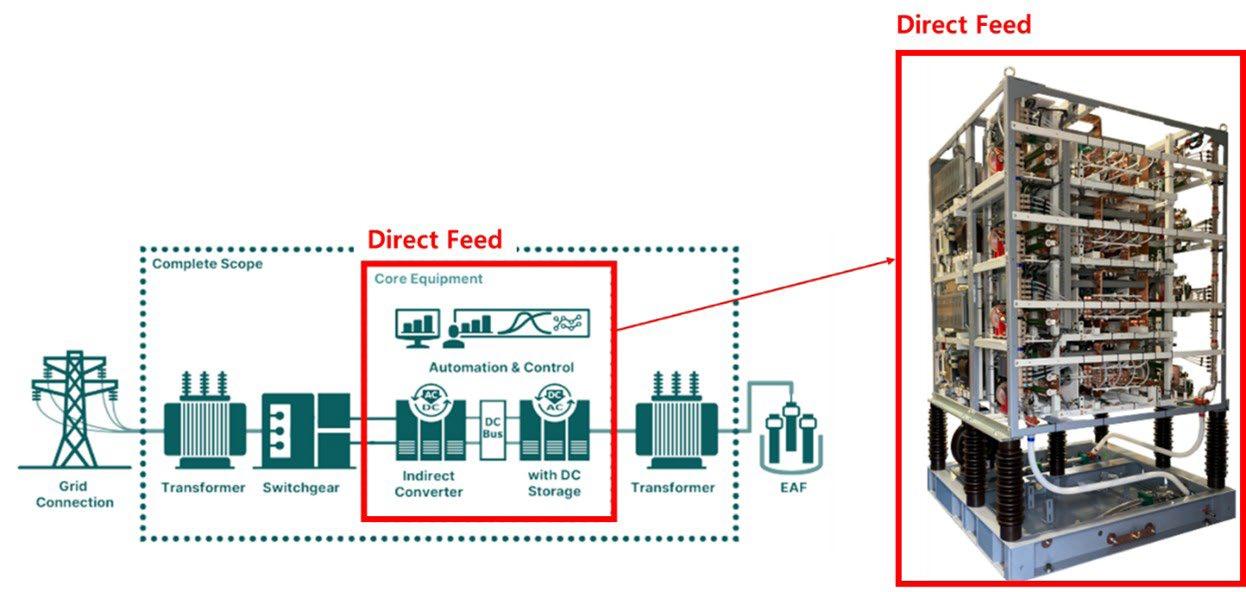
The Grid converter of the Direct Feed and the dedicated DC bus (figure 5) allow for the decoupling of the EAF operation from the grid supply, increased flicker reduction level far above standard Statcom, while maintaining a unity power factor on the grid supply.
The use of MMC topology also features total compliance with IEEE 519 and very high reliability with built-in redundancy.
The EAF converter provides very fast dynamic response thanks to the MMC topology coupled to powerful functions to accurately control voltage, current and frequency.
To decouple the EAF from the grid, the EAF Power Supply must be connected in series with the EAF [7] and use a DC link to store energy and act as a buffer. The EAF will draw reactive power from the DC link capacitor effectively avoiding the AC grid to provide for it. Similarly, the DC Link will also provide buffering for the active power drawn by the EAF. The buffering effect is the primary benefit towards reducing the flicker produced by an EAF when it is conventionally AC coupled to the grid.
The EAF Power Supply can either be connected to the primary side of the EAF transformer (Medium Voltage) or on the secondary of the EAF Transformer (Low voltage) (figure 6).
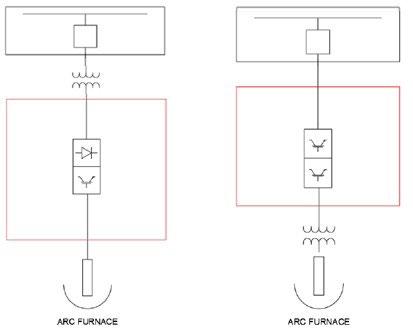
The simplest way to form a DC link is to use a Diode Front End (DFE) rectifier which can be made of several groups of 3-phase 6-pulse rectifiers (6, 12, 18 up to 36 pulses). This technology is well-known and robust for AC/DC applications. Typically, multi-pulse rectifiers are used to reduce harmonic distortion created by the rectifier. Contrary to Direct Feed technology, A DFE has a lim-
ited maximum power factor and typically requires a multi-winding transformer (12 pulses and above), with the proper shifting phase.
The power factor depends on the winding impedance and can be calculated by using the transformer short circuit voltage Uk%.

Table 1 provides a reference based on common Uk% values. Although the power factor remains high, the reactive
power consumption may vary between 30 and 40%.

The transformer impedance will also create a voltage drop on the DC link that is not actively controlled.

The DC link voltage magnitude will vary along with the EAF load profile, translating into grid voltage magnitude variation and impacting the input current harmonic magnitude as well.
In some instances, a reactive power compensation system (RPC) or an active filter may be needed to address the remaining flicker and diode rectifier harmonics. That is not necessary for Direct Feed technology.
Replacing a DFE with a Hybrid MMC grid-controlled Rectifier (HMMR) allows to address the power factor and ensures an accurate control of the DC link regardless of the EAF load status. The HMMR topology also reduces the number of MMC submodules by 33% versus a standard MMC rectifier used in B2B converter. The power delivery from grid to the EAF is smoother and the grid will only provide active megawatts. MMC harmonics level are minimum and pushed far into the high frequency range thanks to the switching strategy and interleaving of the PWM carriers.
An MMC EAF Power Supply connects in series with the EAF on the primary side of the EAF Transformer and connects to AC bus commonly called “dirty bus”. Additional energy storage within the grid side rectifier submodule can be used to provide partial var compensation for the Ladle Furnace.
MMC topology is meant to connect transformerless to a grid supply.
Direct Feed does not require any proximity with the EAF which simplifies green field plant layout. Equally, retrofitting an EAF with such solution is also possible. The existing EAF furnace can be reused as it is without any modification while the MMC Converter can be installed near the HV/MV switchyard.
Installation of a MV equipment also presents some advantages in plant design due to the lower current requirement. Direct Feed doesn’t need to be close to the furnace and can be installed up to 1.5 km of the furnace. EAF will also benefit from the embedded redundancy within the MMC designs allowing them to reach >99%
availability as successfully demonstrated in other industries.
As it is a technology proven and proposed by GE Vernova for decades in other industries, the development of the steel industry and the EAF has been very fast between the development in 2021 and the first installation in 2024 when the commissioning started.
Today Direct Feed is in operation with 100% of the heats running with Direct Feed. Some results can be shared and show an impressive improvement of power quality when Direct Feed is turned on.
Figure 7 shows high flicker reduction above 9 (last assessment shows Flicker reduction between 10 and 11) and low Total Harmonic Distortion, below 1.5% which results from the decoupling between Direct Feed and EAF. An example of voltage spectrum is given on figure 8.
These results are very important for power quality requirements but also for EAF performances. Thanks to Direct Feed, the EAF is no longer constrained by the grid side. In lot of plants, EAF current set points are limited by flickers impact; with Direct Feed, it is now possible to work at the maximum current set point without any negative impact on Flickers and the grid.
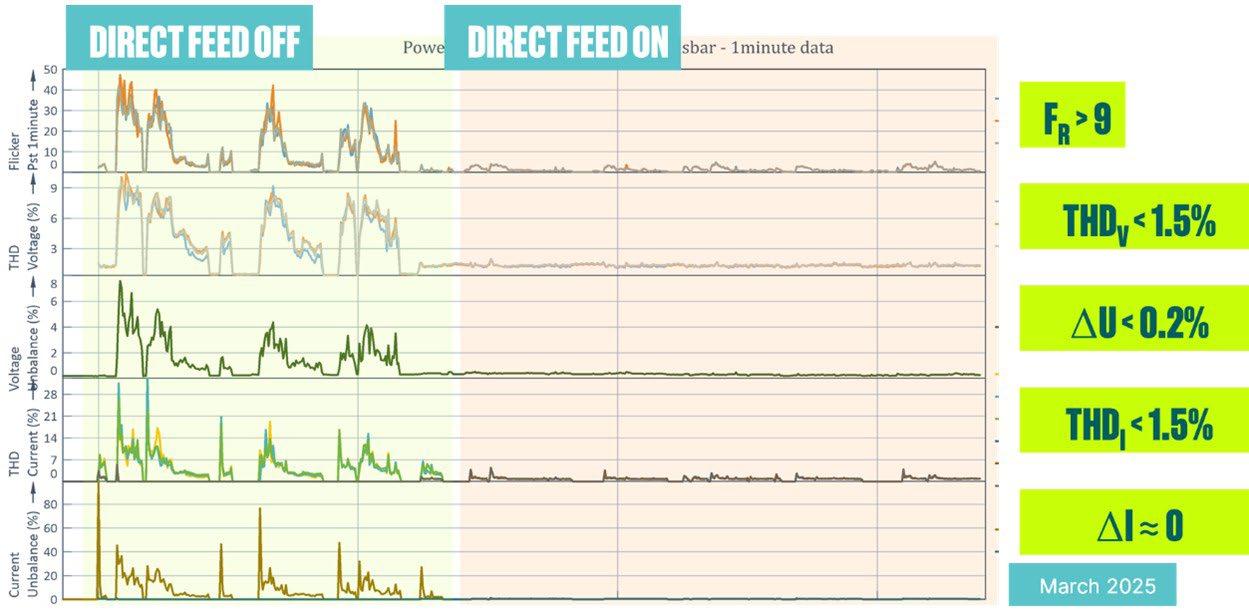

Actively controlling the grid power factor to unity remove the risk of the grid voltage drop due to reactive power consumption, unlike a DFE rectifier, as mentioned before. When Direct Feed is OFF, the grid voltage
drops by 6kV whereas when the Direct Feed is ON, the grid voltage remains stable (figure 8).
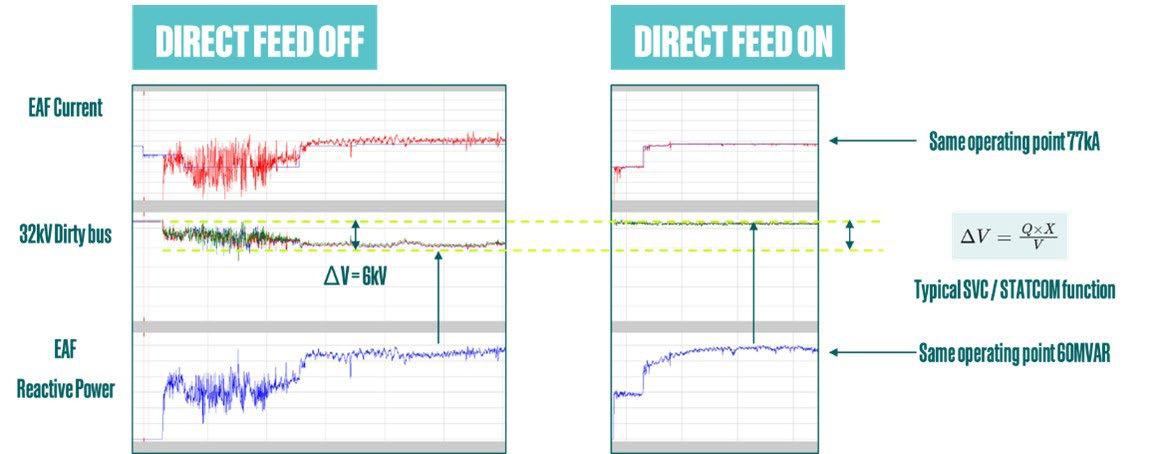
Direct Feed is not only designed to improve power quality but also to improve EAF performance. The main drivers to enhance EAF KPI are:
• improvements of arc stability;
• frequency control;
• direct control of electrical parameters without transformer taps.
Considering all the benefits provided by Direct Feed that are presented in the next pages, the main EAF KPIs can be improved.
• Productivity has improved thanks to a reduction in Power-on time around 10%.
• Energy consumption has decreased around 5%.
• Electrode consumption is around 10%.
Of course, these values can vary from one plant to another, and specific assessments have to be made.
Improvement of arc stability
Arc is stable when the dissipated power is sufficient to maintain it by ensuring the ionization of the gas and the current to pass. The cause and consequence are significant changes in voltage, current, power and grid. Several causes can be responsible for arc instability such as scrap quality, electrode position, cold furnace, gas composition, melting process, and electrical parameters.
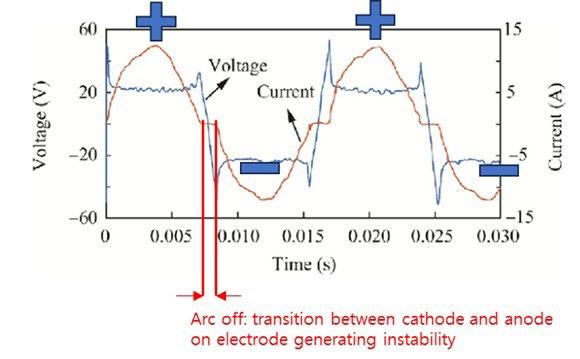
During AC EAF operation the electrode behaves alternatively as cathode and anode. During one half wave, the current is negative, and electrode is anode, and the arc is stable forming a continuous plasma jet between the elec-
trode and the steel bath. During the next half wave, the current becomes positive, and the electrode becomes cathode (figure 9). At this stage the plasma jet is less stable.
Instability is also due to the transition between anode and cathode when current is crossing zero. The transition is not instantaneous and is accompanied by arc extinction and arc reignition (figure 9). The more the delay between extinction and reignition, the more the instability. Even if the delay is short (a few ms), as the current is crossing zero several times by second (depending on frequency), for an entire heat the impact can be high.
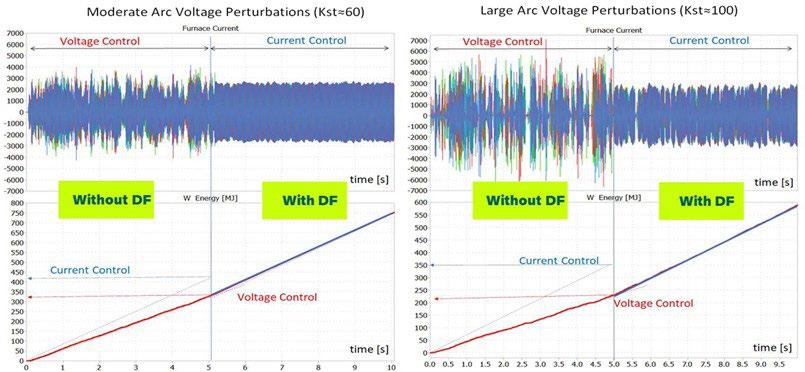
Thanks to Direct Feed, this delay is minimized by controlling directly the current and by adapting the voltage waveform to fit to the non-linear behavior of the arc and by maximizing the arc voltage when the current is crossing zero.
Simulation results for two kinds of furnaces, moderate and large perturbations, are presented in figure 10. With Direct Feed (current control), the current fluctuations and extinctions are much lower compared to conventionnel operation (without Direct Feed) leading to higher energy input for the same duration due to higher power. The more unstable the furnace is, the higher the gain.
Thanks to current stabilization, Direct Feed offers a power margin that can be used to:
• reduce power on time and increase productivity;
• target lower current set point to decrease electrode consumption and electrical losses;
• target lower voltage set point to decrease arc length and arc radiation.
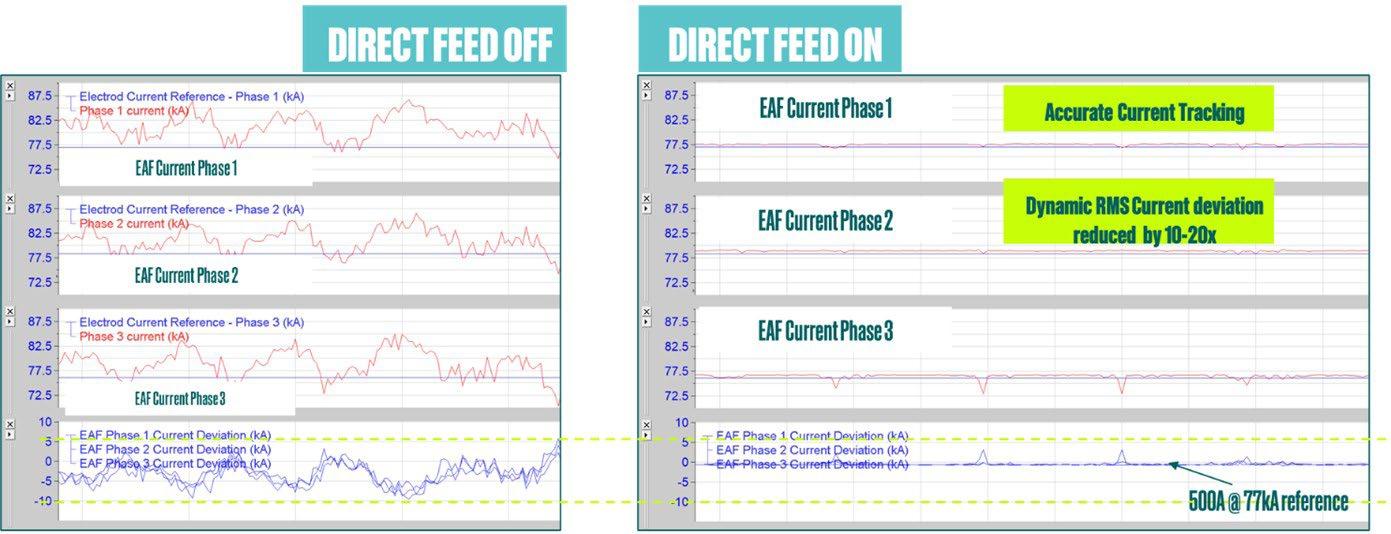
Impact of Direct Feed on 150 t industrial furnace is described in figure 11. When Direct Feed is turned ON, the current deviation around the reference becomes close to zero whereas when Direct Feed is turned OFF, deviations are between -10 and + 5 kA.
Additional increase in arc stability can be performed by increasing frequency.
According to the capacity of the transformers, Direct Feed allows frequency control. Thanks to frequency variation it is possible to adapt the strategy of the EAF to the desired KPI.
The equation 3 shows that frequency influences the reactance and consequently the arc stability because when reactance increases the arc stability increases. Increasing reactance leads to increase phase shift and so decreases power factor.

In addition, frequency influence EAF performances through the skin effect. When frequency decreases the skin depth increases leading to lower resistance and low-
er current density (equation 4). Equations 5 and 6 show the relationship between skin depth, resistance and current density.


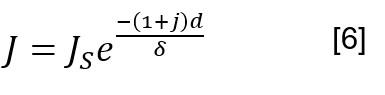
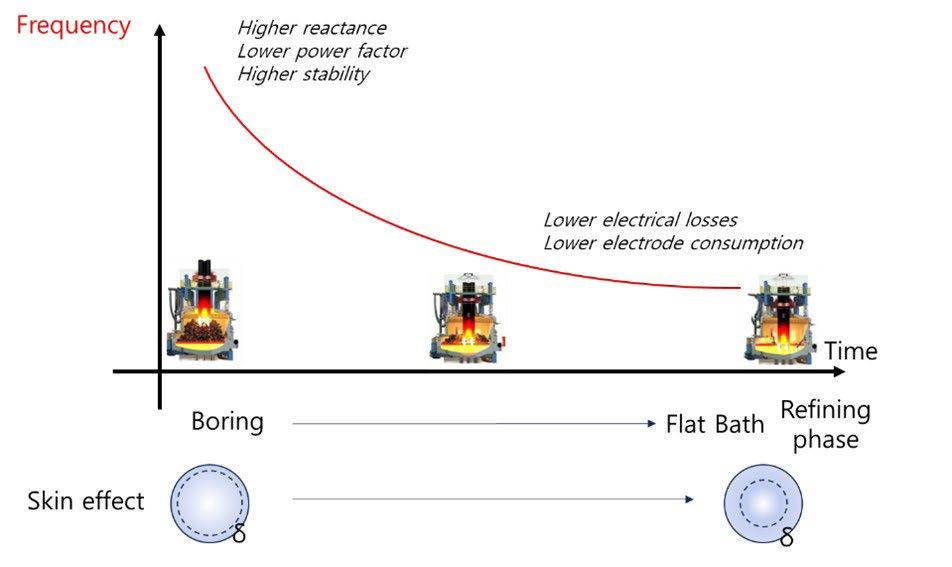
Consequently, for the process, the best practice will be (figure 12):
• in the first minutes of the heat, during boring, to start at high frequency to increase reactance and decrease power factor to increase arc stability;
• then, decrease frequency to reach minimum frequen-
cy in flat bath/refining phase in order to minimize electrical losses and electrode consumption. In this way, thanks to frequency variation, the EAF process can be optimized according to the different steps and needs of the melting process.
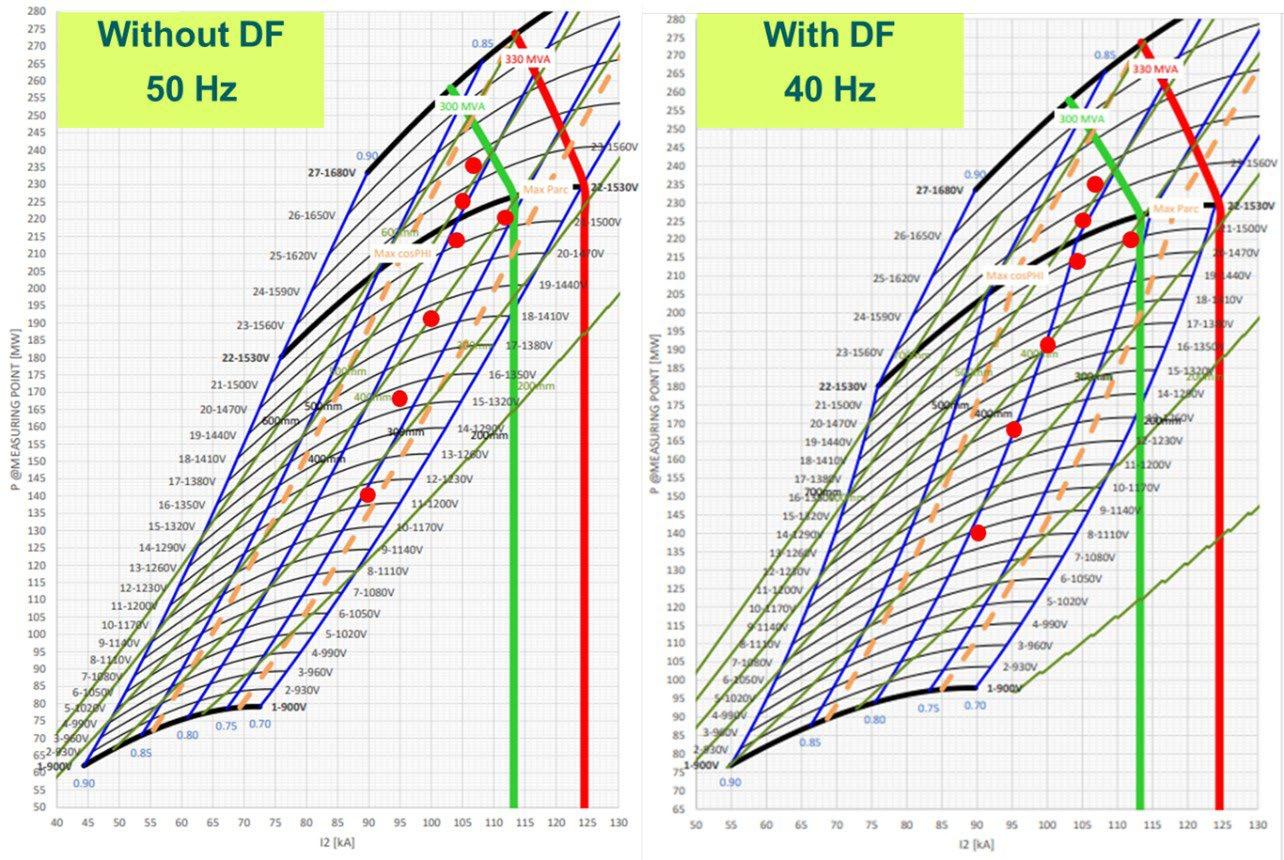
Thanks to Direct Feed capabilities, new operating set points are possible according to the frequency. As presented in figure 13, decreasing frequency leads to an increase of power factor at constant power and current set points. So, it is possible to operate the furnace at the same power and current but with different power factors. In the same idea it is possible to operate at constant power factor and arc length to target higher power.
It offers to the steelmakers the possibility to redefine the current, voltage and power set points in order to target a specific objective of performance—such as energy consumption, productivity, electrode consumption, refractory wear, etc.—and consequently the flexibility to adapt the EAF practice to the specific constraints of the EAF.
Additional benefits: flexibility of EAF practice thanks to Direct Feed
With Direct Feed, transformer tap changes are not necessary. Direct Feed can run with tap changer but is not necessary because now with Direct Feed current, voltage, power, and frequency are directly controlled, very quickly and very precisely. Consequently, the EAF can be operated in a much smoother way without abrupt change of tap, current, voltage and power.
In addition, with Direct Feed, voltage and current on each electrode can be controlled independently leading to several benefits for the process. For instance, it is possible to adjust the electrical parameters of one electrode to decrease its arc length and prevent high arc radiation to decrease refractory wear close to this electrode without impacting stability or power input. The power margin created by Direct Feed also allows to charge lower quality materials that require higher energy to be melted. Arc length can be lowered in order decrease slag height and save fluxes, at constant power factor. For continuous furnace, like Consteel furnace (provided by Tenova), Direct Feed allows optimization of power ramp-up to promote fast slag formation to prevent arc radiation and refractory wear.
In other words, Direct Feed allows for improved control of the furnace and extends the operational performance limits. Given that each plant or furnace has its own specificities, the flexibility of Direct Feed represents a key advantage in reaching the objectives.
The electrification of the steel industry is a key lever for reducing global CO ₂ emissions and enabling the transition toward low-carbon steel production. However, the increasing deployment of high-power EAF installations introduces significant challenges in terms of grid stability and power quality.
This paper presented the Direct Feed concept developed by GE Vernova, which replaces the traditional transformer-based EAF supply architecture with a power-electronics-based solution directly connected to the grid. The
proposed approach enables precise and highly stable electrode current regulation while significantly reducing disturbances such as flicker and harmonic distortion. Simulation and industrial measurements show that the Direct Feed system improves both grid power quality and furnace operational performance. The capability of power electronics to actively control impedance and regulate electrode current provides a new paradigm for large-scale EAF power supply systems.
Direct Feed is a true game changer for EAF production, delivering significant improvements in both power quality and EAF performance. This technological breakthrough represents a major step forward, redefining the way EAFs are operated while minimizing their impact on the grid. By decoupling EAF from grid, very high Flicker reduction and very low THD can be achieved. By controlling directly the electrical parameter, significant key EAF performance indicators can be enhanced.
Direct Feed opens the way to a new standard in EAF operation, combining flexibility, efficiency, stability and sustainability.
In the next years Direct Feed will be installed in several steel plants including ultra-high-power EAF. The world’s largest AC EAF at 360 MVA will be equipped with Direct Feed. As steel plants continue to increase furnace power and productivity, the capability of power-electronics-based supply systems to maintain stable electrode current control while minimizing grid disturbances will become increasingly important.
In addition, the next step will be the integration of Battery Energy Storage (BESS) directly connected to the DC bus of the Direct Feed systems. The addition of battery storage will provide several advantages like load shifting, power shaving, and will add additional flexibility by buffering fast power fluctuations generated by the EAF process. Such an approach would further improve grid stability by smoothing transient power variations and reducing peak power demand from the grid.
[1] H. Ritchie, “Sector by sector: where do global greenhouse gas emissions come from?”, 2020. Published online at OurWorldinData. org https://ourworldindata.org/ghg-emissions-by-sector
[2] World Steel in Figures 2025. https://worldsteel.org/data/world-steel-in-figures/world-steel-in-figures-2025/
[3] OECD (2025), OECD Steel Outlook 2025, OECD Publishing, Paris, https://doi.org/10.1787/28b61a5e-en.
[4] woodmac.com | Pedal to the metal: Iron and steel’s US$1.4 trillion shot at decarbonisation; https://www.woodmac.com/horizons/ pedal-to-the-metal-iron-and-steels-one-point-four-trillion-usd-shot-at-decarbonisation/
[5] International Energy Agency. Net Zero by 2050 A Roadmap for the Global Energy Sector. https://www.iea.org/reports/net-zeroby-2050
[6] CIGRE Ref B4-10523-2024 “±525 kV 2 GW Bipole VSC-HVDC Offshore Transmission (TenneT Projects) - Key Design Aspects”
[7] Y. Elksnis, L. Kadar, “Next Generation Power Supply Options for Electric Arc Furnaces and Electric Smelting Furnaces”, 13th Europ. Electric Steelmaking Conf., Essen, Germany, June 2024
[8] K. Delsol et al., “New Multi-Level Converter System for Electric Arc Furnace Applications”, AISTech 2024 — Proceedings of the Iron & Steel Technology Conference, 6–9 May 2024, Columbus, Ohio., USA, DOI: 10.33313/388/046
n. 6 giugno 2020 Organo ufficiale dell’Associazione Italiana di Metallurgia. Rivista fondata nel 1909
[9] M. Morati et al., “Industrial 100-MVA EAF Voltage Flicker Mitigation Using VSC-Based STATCOM with Improved Performance” in IEEE Trans. on Power Delivery, vol. 31, no. 6, pp. 2494-2501, 2016
International Journal of the Italian Association for Metallurgy
As an integral element of the event, the Conference will feature an exhibition, that will enable excellent exposure for products, technologies, innovative solutions or services. At this opportunity the Organizers will set an area strategically located as regards the main Conference rooms. Companies will be able to reinforce their participation and enhance their corporate identification by taking advantage of benefits offered to them as Contributing Sponsors of the Conference. More information will be soon available at the Conference website. For any further information please contact Siderweb - The Italian Steel Community: commerciale@siderweb.com tel. +39 030 2540006 Organised by


P. Brunier
Continuous casting machine (CCO) is fundamental to produce steel at reasonable costs. The tundish represents the main source of steel for this kind of facility, acting as a buffer between the ladle and the nozzles feeding casting profiles. This component significantly influences the quality and yield of continuous casting operations. Our study focuses on leveraging Computational Fluid Dynamics (CFD) to track particle behaviour within the tundish. By simulating the flow patterns, we aim to optimize tundish design in terms of steel cleanliness. We defined two main scenarios that have different impact on molten steel flow and inclusion transport, with the intention to minimize defects and enhance overall efficiency.
Our approach involves tracking individual particles—both in terms of trajectory and residence time—allowing us to understand their impact on product quality. Intense postprocessing has been done with python to perform analysis on a structured framework, making comparison between the two cases much easier. Finally, the head reason is to reveal by simulations how inclusions move and could accumulate within the steel flow. This kind of knowledge prompt strategies to reduce inclusions in the final product.
This study aims to investigate the behavior of inclusions within the tundish by leveraging Computational Fluid Dynamics (CFD) simulations. Two different configurations are examined: one featuring a wall with angled holes, called dam, and the other employing a box designed to dampen the momentum of the incoming flow. These configurations are evaluated in terms of how they influence the molten steel flow and the transport of inclusions by tracking individual particles and analyzing their release time and trajectories to assess how each design performs in terms of inclusion removal at a steady state. The analysis leans on a post-processing algorithm developed in Python, which enables a detailed and structured comparison of the two setups, introducing innovative tools such as Kernel Density Estimation (KDE) to better understand inclusion distribution and dynamics. The goal of this work is to deepen the understanding of inclusion transport phenomena in the tundish and to identify effective design strategies that minimize defects and improve overall casting quality.
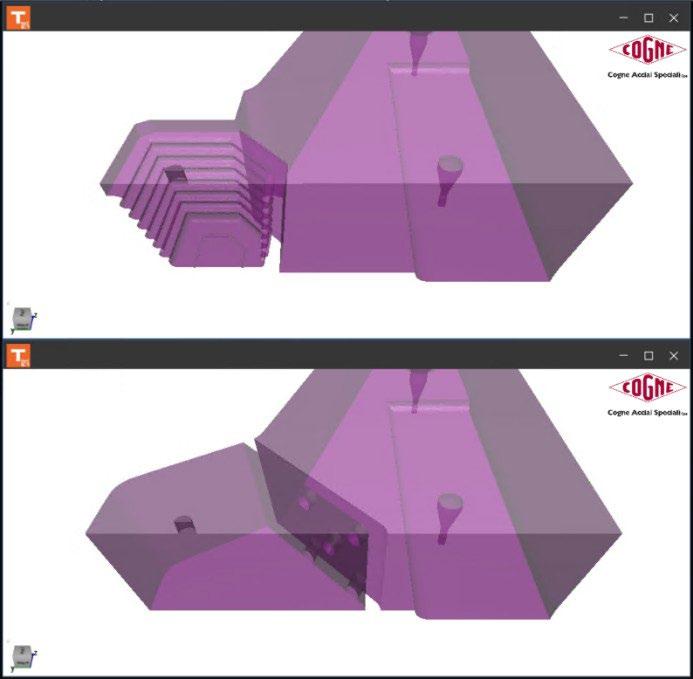
The two configurations of interest involve a different approach in fluid transport behavior: in the first configuration there is a refractory wall with five holes that allow the steel to feed the tundish pool. These holes possess a certain inclination that force the flux to the top region of the liquid bath: this promote a better inclusion removal since it will be more likely for an inclusion to interact with and
subsequently to be trapped by the slag. The second case involves a so-called box in which the flow is dumped, in terms of momentum, before being released. This is particularly useful in the initial transient, preventing unwanted splashing of liquid steel, potentially dangerous. The details of these two components rely on industrial secret and cannot be shared.
The continuous casting inlet pipe has been modelled as well considering its slide valve, regulating the flow into the strain casting mold. During steady-state operations, its position is assumed to be quasi-static, so the liquid steel channel can be assumed as a fixed geometry.
The Finite Element Method (FEM) is a numerical technique for solving partial differential equations (PDEs) over complex geometries, discretizing the domain into smaller elements which takes the name of a mesh. In computational fluid dynamics (CFD), FEM is employed to approximate solutions to the Navier–Stokes equations and
related transport phenomena. This method is particularly advantageous in problems involving multi-physics coupling or flow-structure interactions. For this work, THERCAST [1] is used to perform CFD simulations while Python drives the postprocessing operations. The solver affords on Large Eddy Simulation (Variational multiscale method) as approach to model turbulence in the liquid steel, considering elasto-viscoplastic behavior for the mushy zone as well as solidification shrinkage for solidified domain. Since this is a steady state (no change of volume over time), a mass balance equation over the control volume imposes the following condition:

Thus, inlet and outlet have imposed velocity, according to the [1] and both are adiabatic in terms of heat flux. Free surface has been modeled imposing a surface tension coefficient and no augmented viscosity for turbulence. Anyway, the criterion applied on particle tracking is based on geometrical coordinates meaning that these boundary
conditions have no impact on this work. In fluid reactors engineering, the time constant expresses how quickly the system responds to input changes (such as concentration, flow or temperature). It reflects the average residence time of fluid and indicates how fast the tundish reacts to a given input. It is defined as:

Where:
V is the control volume, [m3]
Q is the volumetric flow rate, [m3/s]
For this study, τ ≈ 9 minutes. Considering that typically a transient is extinguished in a time between 3- and 5-time constants, this means a time between 30 minutes and 1 hour of CFD simulated time. Another aspect concerns the control volume itself since it has a direct impact on the number of nodes of the mesh: we cannot make a coarse mesh because it will impact on the resulting velocity field, and so on the particle trajectory prediction. In order to make reasonable comparisons, we must set a proper mesh size for both cases. Convergence studies showed that the number of nodes has been set around 100k per m3 of volume.
As a standard practice, is exploited the symmetry of the system which means in this case that we can consider only ½ of the global geometry. Further efforts have been made to optimize the simulation as much as possible: this is the main reason behind the choice of a virtual wall so only the liquid volume is directly involved in the computation while the wall is modelled in terms of equivalent thermal resistance. We used a mesh with fixed elements (non-adaptive remeshing) because we want to be robust in terms of particle tracking: a remeshing based on velocity, for instance, could locally make the mesh coarser invalidating or at least penalizing the particle trajectory estimation.
Particle tracking is a technique used to study inclusion trajectory in a fluid domain over time. The model assumes no interactions between inclusions. Therefore, there is no agglomeration or cohesion between particles, which establishes a decoupled approach. Despite this aspect, drag forces as well as buoyancy and fluid pressure and momentum balance have been considered turbulence. In this work 200 particles per size are released near to their source (ladle jet), totaling in almost 500 files per size (1 and 10 microns). All particles are injected simultaneously (pulse release) to better observe transport dynamics. They are placed near the main inlet jet to enhance transport toward the casting strands, as global trapping was not the focus here. Each file will result into a unique outcome: trapped by slag, entering one of the strands, or remaining in the pool. Particles still in the pool reflect dead zones, where low velocity or long residence time limits their removal. The asymptotic pool value may represent the dead volume fraction (k-pool).
Dimensionless philosophy
In order to compare different volumes, which imply different time constants, a classical approach is to normalize these quantities. Being C a concentration and t a time, then we can make it dimensionless simply by doing:

This approach allows us to compare different geometries. From RTD to KDE: an innovative approach Building a model with concentrations and residence time
distributions (RTDs) involves, by its nature, continuous quantities, which in turn involve integrals. This simulation deals instead with discrete events because particle tracking is discretized through both space and time. RTD is ba-
sically a plot showing how a substance distributes into the liquid domain. Its measure is concentration; therefore, we can express it as:

With this definition of concentration, we can compute an RTD as [2][4]:
By definition, RTD is normalized. In other terms:
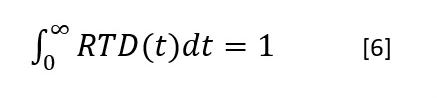
Kernel Density Estimation (KDE) curve is a nonparametric method for estimating the probability density function of a random variable from a sample of data [3]. It means that,
given an event E, a KDE shows the probability p that the event E occur:

Since it is a probability, its probability density function must be normalized, as an RTD curve:
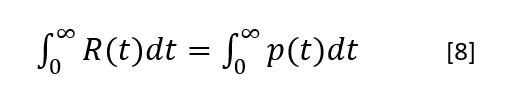
We can then make the hypothesis that using KDE plot to estimate RTD curve is acceptable because both quantities belong to the domain [0, ∞) and are normalized (the integral is equal to 1). This allows us to use kernel density estimation techniques which work well on a set of discrete events. Being plausible that the two integrals are equal, it also means that the shape of the two curves could probably be the same, even if the metrics are different. This aspect has not been deepened since we are interested in the corresponding peak time, which should not depend on the probability density by itself. Anyway, to give a reliable statistical model we must consider all possible outcomes, which are:
• A particle never reaches the liquid pool because it has
been blocked by the dumping device (dam/impact box).
• A particle is trapped by the slag.
• A particle passes through a casting strand and becomes an inclusion for the cast billet.
• A particle is still floating into the liquid pool, remaining in the liquid steel. This means that the lasts billets may have more inclusions than the standard produced.
Due to this analogy with the definition of probability the decision made is to afford on counting principle in order to define a fraction (or percentage), depending on time, of particle trapped by the slag as:

This approach has been used also to make an estimation of the ‘holding’ efficiency of the two components (dam, box). For example:

Therefore, we can define the fraction of particles released as:
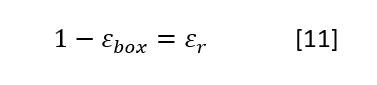
So, the total number of particles released is simply:

Rewriting equation 9 we get:
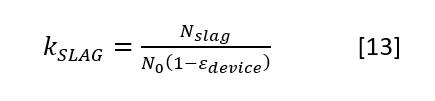
Similarly, for the particles that flow through a continuous casting strand, from here called ‘cc line’:

Having defined the end of a particle in only 3 possible ways we can also say that:

From which we can estimate k POOL. Notice that while kSLAG and kLINE,i increase over time, kPOOL decrease. A good design should have:
• Low kPOOL: its regime value is very low if not even zero. The bigger the slope, the better is the design because it means low dead volumes into the tundish.
• High kSLAG: it means that a big portion of inclusions have floated and reached the top of the control volume. For this model, this condition is sufficient to consider them as trapped by the slag.
• Low kLINE,I since we want to cast the cleanest billets possible.
With this approach we can now compare the two designs to figure out if there is a better configuration in terms of inclusion transport.
The computational algorithm used for this kind of analysis is based on the following principle: the life of a single particle could end in a deterministic way:
• Trapped by the slag, if its z coordinate reaches the top of the volume.
• Fallen into one continuous casting strand.
• Still floating into the liquid pool, potentially polluting the steel during the production of the last billets (while the tundish is emptying).
The algorithm collects the ‘end time’ and automatically assigns a label for each particle. Once this procedure is completed, we can have access to more accurate statistics, including also average time of the event, having distributions over time, even predicting some behavior
before the simulation runs up to 5-tau, which should allow in fact to a shorter computation. This has been done
assuming a classical transient equation of the kind:

Where:
• k ∞ is the regime value.
• t0 * is the initial dimensionless release time (10s of physical time for both simulations).
• r is the rate, indicating how fast we extinguish the transient.
The post processor, written in python, must find where each particle goes before. To perform this, the main regions of interest have been defined in preprocessing, once the regions of interest has been defined, it is just a matter of coordinates: if the particle falls into one of these regions it is automatically labelled for the further statistics. These regions of interest are identified by .stl volumes read also by the postprocessor before entering in the screening loop. A sensor file is a collection of results at each computed increments, and all these data are collected into a python pandas dataframe object. Once read, the algorithm scans the z coordinate at first (slag / strands), then x and y to eventually determine the cc line (central, peripheric). It automatically stops once one of these conditions are reached, moving to the next file.
Considering the simulation time (1.75 - 2τ) and the low timestep imposed by the CFD solver, every sensor file results having several thousands of lines, with a dimension around 4.5 MB per file. Once data are collected and properly labelled it is possible to go ahead with the KDE calculation, as well as the fitting over time to retrieve constants of the systems for the considered events.
The first results analyzed are the velocity field and the temperature of the liquid bath. Top surface, shown in figure 2, is between 5°C and 10°C hotter with the box rather than the dam. Anyway, looking at the symmetry plane (figure 3), we can deduce that this difference disappears while reaching the tundish bottom wall. This suggests that for low velocity (<0.1 m/s) the transport mechanism does not more rely on advection (high Pe number), but we should consider diffusion term as well. A deeper analysis suggested that advection/transport is still the major contributor since the velocity field leads the temperature distribution.
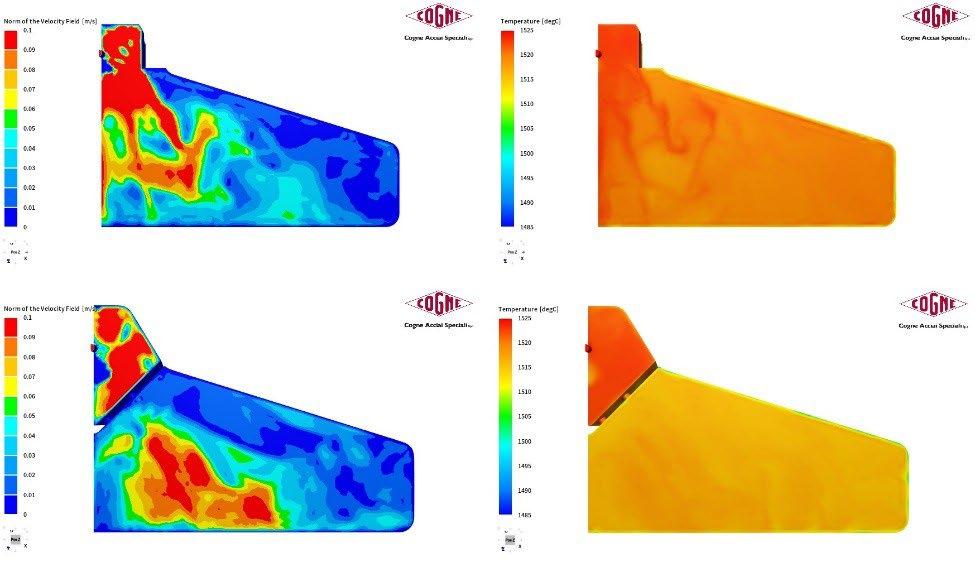
Fig.2 - Surface plane: velocity (left) and temperatures (right), for box (top) and dam (bottom).
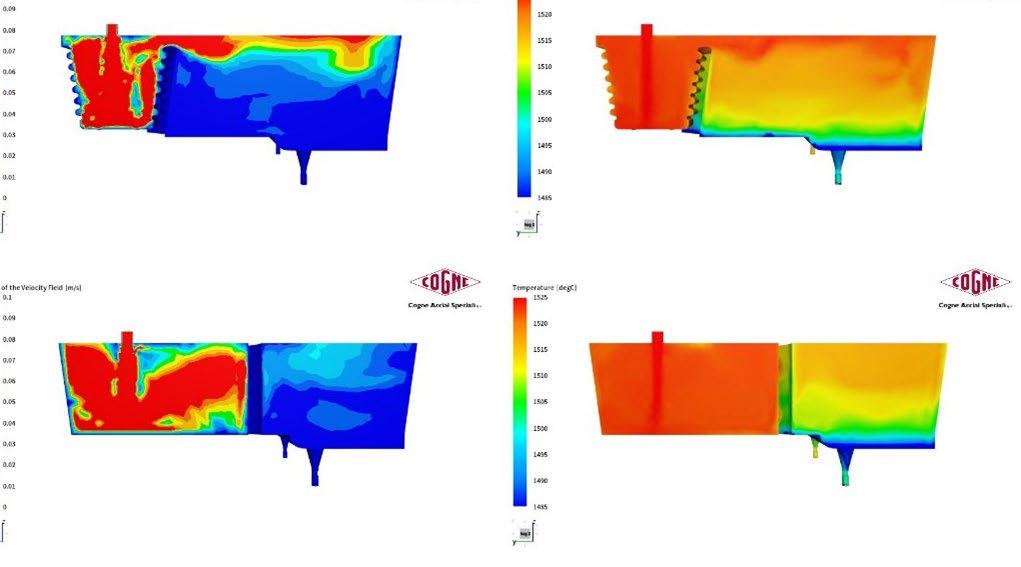
- Symmetry plane: velocity (left) and temperatures (right), for box (top) and dam (bottom).
Postprocessed particle tracking
We proceed now with the KDE plot of dimensionless time. We noticed that most probable time in the KDE curve does not coincide with the mean value calculated with standard techniques, but it is always lower. This implies that the distribution is not symmetric. An effort has been put also to find a distribution where the mode and the mean are the same number. The main distribution with this property is the normal distribution, which is defined
between (-∞,∞) while out domain belongs to (0, ∞). Since the aim of this work is to compare the two different setups we choose not to go deeper with this topic for the moment, evaluating just the peak dimensionless time:
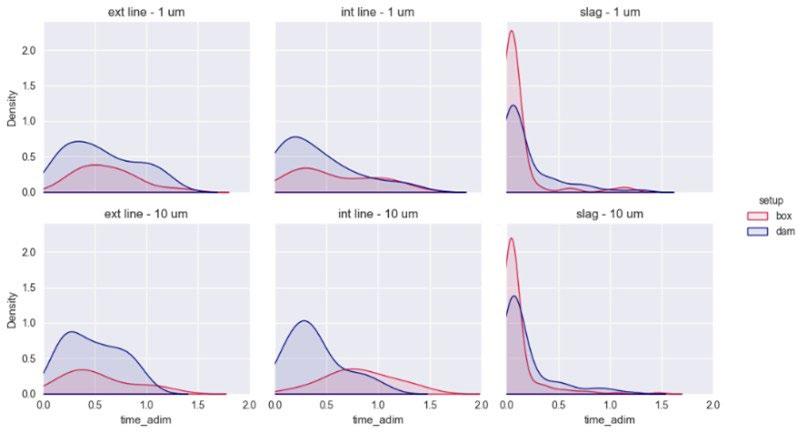
By fitting these values with equation (16) we can get the k values over time, describing the overall behavior of the two setups:
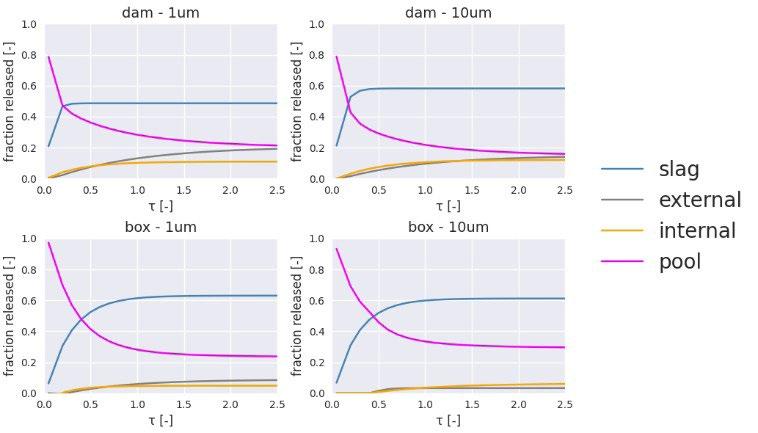
Fig.5 - k values over tau, describing the overall release fitted behavior.
We can deduce that the box setup leads to lower kline values, with a bigger contribute of the slag. This is particularly evident for the external line, where the dam and 1 micron particles: the flux is conveyed to the external lines because of its design holes that convoy the liquid steel on that particular region.
The role of the dumping device
Different geometries lead to different flux, so different particle behavior. It could be of interest to make an in-depth
analysis on the ‘dumping’ components in order to see if there is a difference already close to the pouring region. In fact, the two items have been built with two different control volumes. Since time constant directly depends on the volume because the flow rate can be considered constant, we can easily scale τ according to the change of volume. Fitted values show a faster release (bigger r from equation 16) and a lower fraction of particle released (k ∞ values).
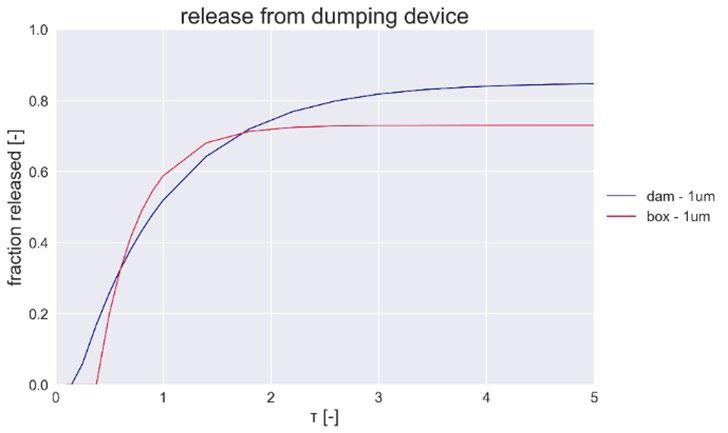
- Impact of the dumping device on the overall release of particles (1 micron) for the dam setup (blue) and the box (red).
We are finally able to assess if one configuration is better than another in terms of both fluid dynamics and particle tracking. A first analysis of the regime value shows that the box device releases less inclusions, and it is kinetically more stable (faster transient). The main impact of inclusion transport is localized into the external casting strand,
especially for lighter particles (1 micron) which showed a dump in particle flow of approximately 50% into the casting profile. Internal strands (1 micron) also follow this trend, with a resulting gain of 10-15% in slag contribution. For heavier particles, this trend is less emphasized but still present
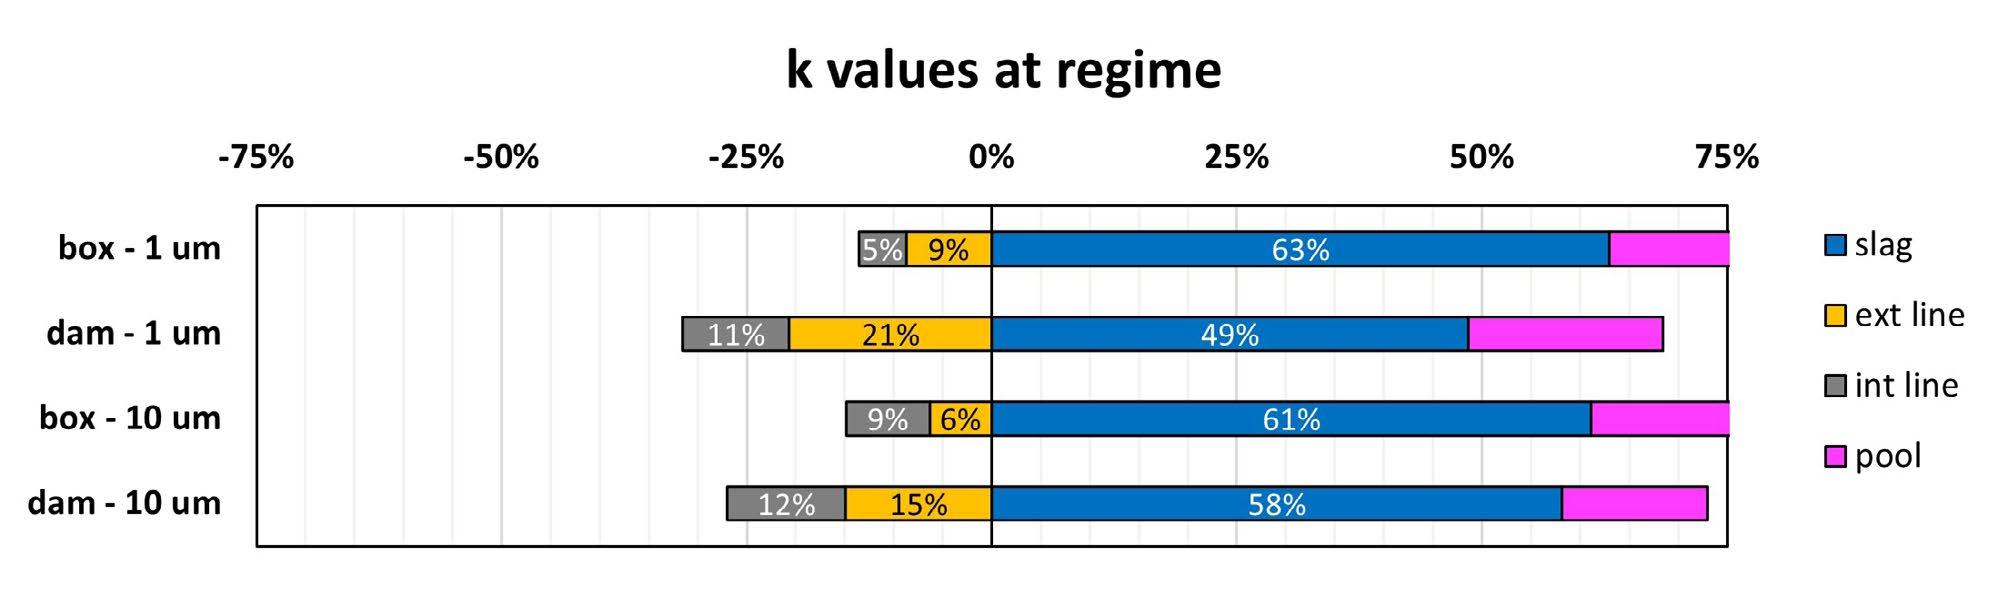
Fig.7 - Resumed fitted values for the two setup and two set of particles
Next steps will be to study particle transport from the gate into the continuous casting production line in order to see if these bigger particles generate inclusions inside the solid billet or if they float anyway, meaning that the main mechanism of bigger particles relies on the continuous casting mold.
[1] https://www.transvalor.com/en/thercast
[2] Y. Sahai, T. Emi, “Melt flow characterization in continuous casting tundishes”. ISIJ International, 1996, Volume 36, Issue 6, p. 667-672. https://doi.org/10.2355/isijinternational.36.667
[3] A. W. Bowman, A. Azzalini, “Applied Smoothing Techniques for Data Analysis: The Kernel Approach with S-Plus Illustrations”, Oxford Statistical Science Series, vol. 18, Oxford University Press, 1997. https://doi.org/10.1093/oso/9780198523963.001.0001
[4] H. Lei, “New insight into combined model and revised model for RTD curves in a multi-strand tundish”, Metall. Mater. Trans. B. 2015, 46(6):2408–13. doi:10.1007/s11663-015-0435-6
F. Baldussi, A. Chugaeva, A. Milan, A. Parimbelli, F. Guerra, L. Angelini, M. G. Gelfi, A. Pola
Solidification plays a fundamental role in metallurgical processes, such as continuous casting of steel billets, as it greatly influences the final microstructure, in terms of chemical segregation, grains morphology and size. Segregation of solute elements occurs because of their partitioning between the liquid and the growing solid. The liquid interdendritic regions are enriched of solute elements rejected by the growing dendrites. Such segregation cannot be fully mitigated through subsequent hot rolling processes. Common evidence of this undesirable phenomenon is the banded microstructure observed in hot-rolled products, characterized by alternating longitudinal bands of ferrite and pearlite. Normalization can reduce the banded microstructure, but micro-segregation remains difficult to completely homogenize. Therefore, hot-rolled wire rods produced from steel billets solidified under different conditions exhibit varying mechanical properties. In this context, the study presents a comparative analysis of two low-carbon steel billets with similar chemical composition but produced under different casting conditions with two different casting machines. The analysis investigated the differences in macro and micro-structure of the two billets by measuring the secondary dendrite arm spacing (SDAS) and the segregation index. The mechanical properties of wire rods derived from the billets were assessed by tensile tests and micro-hardness Vickers measurements. The microstructures (of billets and wire rods) were analyzed by optical and scanning electron microscopy (SEM) equipped with an energy dispersive spectrometer (EDS).
KEYWORDS: STEEL, CONTINUOUS CASTING, SOLIDIFICATION STRUCTURE, SDAS, MECHANICAL PROPERTIES;
The steel wire used to produce screws and bolts is commonly obtained by continuous casting of billets that are hot rolled, transformed into wire rods, and finally cold worked. Continuous casting is the predominant process in steel production because of its high efficiency, quality, and automation compared to traditional ingot casting [1, 2]. As well known, the typical billet solidification structure obtained by this process, when observing a cross section, is composed of three different regions: a surface equiaxed grain zone, a columnar zone, and a central equiaxed zone. The surface zone, also called chill zone, consists of a layer of fine equiaxed grains, formed from the molten steel in contact with the cooled copper mold. In fact, the highly undercooled liquid and its convective movement are responsible for the fine and dense number of grains. Beneath this layer columnar grains grow along
Dipartimento di Ingegneria Meccanica e Industriale, Università degli Studi di Brescia, Brescia, Italy
Acciaierie
the heat exchange direction, driven by the heat extraction towards the mold. At the core, equiaxed grains nucleated in the highly constitutionally supercooled molten metal and by small pieces of the columnar grains broken by the relative movement between liquid and already solidified phases [3]. Due to the lower cooling rate in this area, the resulting equiaxed grains are coarser than those in the chill zone. Solidification structure and its quality are of great importance, as they influence the final properties of steel product [4]. The use of electromagnetic stirrers during continuous casting also affects the cast product properties. In particular, the magnetic field is able to alter dendrite arm spacing, grain size [5], columnar to equiaxed transition [6, 7], and to homogenize the chemical composition, reducing the central segregation and the solidification interface morphology [8]. However, when the stirring effect is too strong, a white band can be observed in the cast billet, corresponding to a negative segregation region at the solidification interface [9]. As previously mentioned, the solidification of the continuously cast billets, occurs in the dendritic mode [4]. Therefore, the growing dendrites reject dissolved elements in the nearby liquid, due to the different solubility of elements in the solid and liquid phases [10]. Partitioning of rejected solute elements is responsible for both micro and macro segregation that, with the solidification structure, affects the final product quality and properties. Such chemical segregations, formed during solidification of the billet, cannot be removed during the subsequent reheating and hot rolling process [11]. In fact, a banded microstructure, formed by longitudinal alternating bands of ferrite and pearlite, is the common result of the micro-segregation of alloying elements in the hot rolled products, which reduces the mechanical properties of the final component, and can be mitigated only after a normalizing heat treatment [12]. The rolling process aligns the chemical variations in the interdendritic regions, producing bands with low and high concentrations of solute elements [3]. Since solidification conditions affect dendritic growth and the consequent elements partitioning, which causes segregations, secondary dendrite arm spacing (SDAS) could be used as an indicator of the interdendritic segregation. Moreover, since the SDAS is also influenced by the heat
transfer during solidification, it gives information about the solidification rate, increasing with decreasing cooling rate [3]. In summary, because the solidification structure that forms under a certain set of casting parameters affects the mechanical properties of the final hot rolled product [4, 13, 14], it follows the need of a precise control of the entire production process to fulfill the final product quality.
In this research, a comparative analysis was performed on 27MnB4 mod C + Si + Mn steel billets, produced by two different steelmaking plants. The two billets, named A and B, were hot rolled to produce wire rods of different diameters in the same plant with the constant parameters. However, an evident difference in the mechanical properties of the final wire rods was observed, consistently, for every diameter produced. Therefore, the solidification structure and segregation of the billets were evaluated and compared, along with the microstructure and mechanical properties of the final products. The results were then related to the two different continuous casting processes.
The analysis was focused on two 27MnB4 mod C + Si + Mn steel grade. Two billets (A and B) were produced, both 8000 mm long with a cross section of approximately 160 mm x 160 mm. Billet A was produced in a casting machine with a curvature radius of about 5 meters equipped with mold electromagnetic stirrers (MEMS) and strand electromagnetic stirrers (SEMS). Billet B was produced in a machine without SEMS, with a curvature radius of about 8 meters. The specific secondary cooling used for billet B was less intense than for billet A, but the cooling was distributed along a longer region of the strand. Subsequently, billets A and B were hot rolled in the same plant with the same process parameters.
Hence, both billets (with chemical composition shown in table 1) were sectioned to obtain sections about 20 mm thick. Two sections, one from billet A and one from billet B, were etched with diluted sulfuric acid (15% H2SO4, 85% H2O) for 10 hours and then macroscopically inspected, according to the UNI 3138 standard.
Tab.1 - Chemical composition of A and B steel billets.
The sections not selected for macroscopic inspection were cut into four parts (see figure 1a). Three of these parts (called Slice 1, Slice 3 and Slice 4) were then further divided into four parts to obtain smaller samples, to facilitate handling during the subsequent metallographic preparation and analysis. The two samples of the Slices 1 (1.1, 1.2) containing the half diagonal of the billets, after grinding and polishing, were etched using Nital 2% for 10 seconds. Using an optical microscope (Leica DMI 5000M) the microstructure was evaluated in the four regions specified in figure 1a (i.e.: a: external zone; b: ¼ external diagonal; d: ¼ internal diagonal; c: core), and some micrographs were collected for each of the specified zones. The four observed zones (a, b, c, d) were about 10 mm in diameter. The average ferritic grain
dimension in these four regions was evaluated using an optical microscope (Leica DM4 M) at 100x magnification, equipped with LAS X software, in accordance with the Intercept method presented in ASTM E112. To verify the results, the measurements were repeated also applying the Comparison method for average grain size determination, as described in the same standard.
The pieces of Slice 4 (4.1, 4.2) were used to determine the prior austenite grain size (PAGS) in the four regions already described for the slice n° 1(a, b, c, d). The PAGS was assessed by using the Khon method to reveal the austenitic grains, as prescribed by UNI EN ISO 643:2024 standard, applying the Comparison method for the measurements.
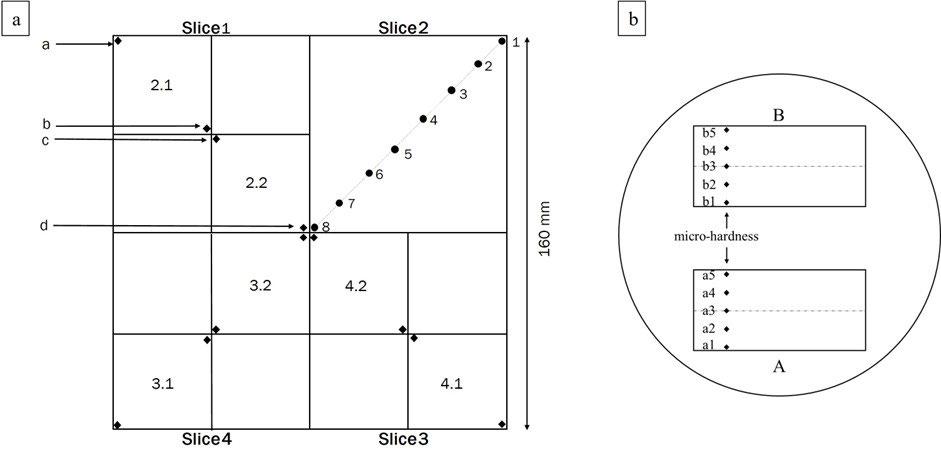
- Scheme of sample collection, a) billets samples, b) wire rods samples.
The two samples of Slices 3 (3.1, 3.2), along the diagonal of the billet were heat treated as presented by Wang et al. [15] to highlight the original solidification structure. In particular, the specimens were heated to 930°C at 10°C/ min and held for 30 minutes, then cooled to 680°C at 5°C/min and held for 120 minutes, followed by cooling to room temperature in the furnace. The specimens were ground, polished, etched with Nital 4% for 5
seconds. A macrograph was collected for each specimen to visually observe the evolution of the solidification structure and to better identify the columnar to equiaxed transition. The specimens were also observed under an optical microscope at 50x magnification to evaluate the SDAS values in the four selected regions. At least twenty dendrites were measured per zone. Method C, as presented by Vandersluis et al. [16], was used to determine the SDAS.
Finally, Slices 2 were designated for chemical analysis. The carbon and sulfur contents of eight different positions along the slice’s diagonal were measured, as shown in figure 1a. Samples were drilled by using a 5 mm diameter drill to a depth of 8mm. The chips were analyzed using an elemental analyzer (Eltra CS2000). The C and S trends along the billet were evaluated, and carbon segregation indexes were determined dividing the local carbon content by the average value, as suggested by Lan et al. [17]
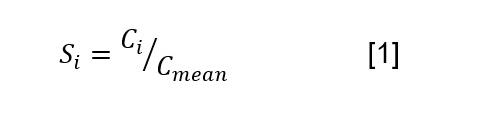
where Si is the segregation index at the measured position, Ci is the local carbon content, and Cmean is the average carbon content of the eight analyzed regions.
The wire rods produced from the two steel billets were also examined. For mechanical properties, wire rods of various diameters were tested, while for the microstructural analysis, two wire rods with 7.5 mm diameter (one from wire rod A, and one from wire rod B) were selected. A longitudinal cross section (7.5 mm x 20.0 mm) was taken from each wire rod for microscopic examination. The two small samples were mounted in a general-purpose thermosetting resin (figure 1b). The samples were then ground, mirror polished and etched with Nital 2%: the sample from wire rod A for 20 seconds, and the sample from wire rod B for 15 seconds. For each sample, Vickers microhardness measurements were taken at five different positions (as illustrated in figure 1b) by using a load of 1 kg. Position (a and b) 1 and 5 were near the specimen surfaces, at a distance of at least 2.5 times the diagonal length of the hardness indentation. Measurements (a and b) 2 and
4 were made halfway between the surface and the longitudinal axis (1.875 mm from the surface), and position (a and b) 3 was located along the longitudinal axis (3.75 mm from the sides). Each measurement was repeated three times per sample. Microstructural analysis was performed at the same five positions, using the hardness indentation as a reference, to determine the ferritic grain size in precise positions. The micrographs were collected at a 100x magnification using an optical microscope (Leica DM4 M) equipped with LAS X software, at a sufficient distance from the hardness indentation to avoid any influence. The ferritic grain size was evaluated in the five zones, in accordance with the Intercept method described in ASTM E112 and verifying the results repeating the measurement applying the Comparison method presented in the same standard.
The banded microstructure of the two wire rods was also investigated by SEM-EDS analysis, using a Leo Evo 40XVP scanning electron microscope equipped with an Oxford energy-dispersive X-ray spectrometer. Chemical evaluation of the Mn and C content were conducted along a path from the surface to the longitudinal axis, to detect localized segregation. For greater accuracy, the chemical composition of the ferrite and perlite bands were also analyzed.
Two additional samples were taken from each wire rod and polished to mirror finishing for non-metallic inclusion analysis. The inclusion count was performed by optical microscope while the Zeiss Sigma 360 scanning electron microscope equipped with the EDS microanalysis was used to determine their chemical composition.
The macroscopic examinations of the two billet slices revealed the first difference.
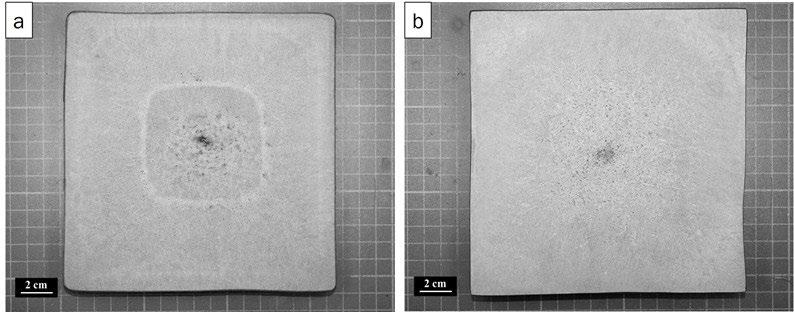
Billet A (figure 2a), produced using SEMS, shows the white band, a characteristic negative segregation, often visible in the cross section of billets produced by using strand electromagnetic stirrers. The band corresponds to the solid-liquid interface when stirring occurs [9, 18]. The white band has a diameter of approximately 72 mm. Billet B, produced without SEMS, does not show this peculiar feature (figure 2b).
The white band in billet A can also be seen in the macrograph of the 3.2 piece (figure 3a). From the macrographs of the four samples heat-treated and etched with Nital 4% (pieces 3.1 and 3.2 for A and B billets; figure 3), the extent of the equiaxed and columnar zones is clearly visible. For billet A, the columnar to equiaxed transition occurs at approximately one quarter of the billet diagonal (figure 3a).
The equiaxed region accounts for 32% of the total billet cross section area. The white band is entirely located within the equiaxed region (figure 3b). Therefore, the SEMS acts on the liquid steel after the columnar to equiaxed transition has occurred, helping to homogenize the chemical composition and temperature gradient of the molten steel at the core of the billet, thereby reducing the centerline defects. Billet B presents a more extended columnar region; the transition to the equiaxed structure is delayed and occurs closer to the billet core (figure 3d). In fact, the equiaxed zone accounts for only 14% of the billet cross section area, which is less than half of that of billet A. The larger columnar region in billet B could be due to a higher superheat of the steel and a high cooling rate, particularly in the initial primary cooling zone, in the mould region.
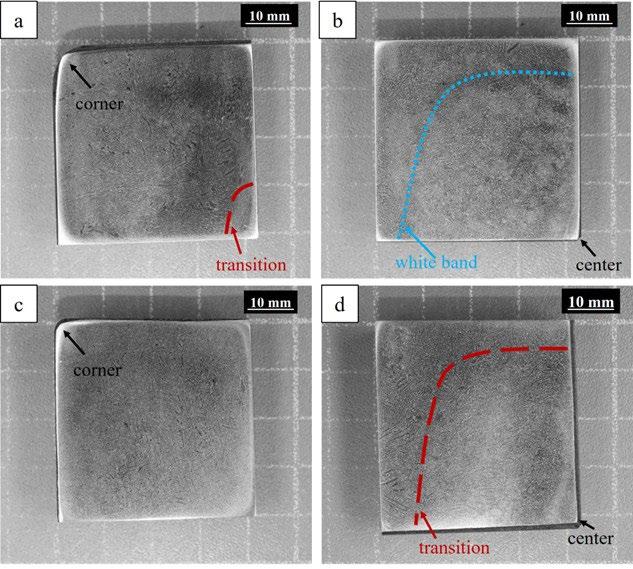
Billet A PAGS presents a G value of about 7.5 while billet B a G value of 7.0. The microstructure of both A and B billets (figure 4) consists of ferrite and pearlite, as expected for this C-Mn steel. Both steels present a microstructure that becomes coarser moving from the surface to the core of the billet, due to decreasing cooling rate. Billet A (figure 4a) shows finer grains compared to B billet (figure 4b), with an average grain size of 26.9 µ m. Billet B has an average grain size of 31.9 µ m, which is about 18% larger than that of billet A. This difference may be due to the higher secondary cooling rate used for billet A, which was stronger and concentrated
over a shorter length. In contrast, for billet B it was longer and divided into more subregions; thus, despite the initial intensive cooling in the mould region, it then becomes milder in the secondary cooling zones. As a result, billet A exits the secondary cooling region at lower temperature. Hence, the billet A remains at high temperature for a shorter time, preventing the coarsening of the γ grains, and promoting the formation of smaller ferritic-pearlitic grains compared to billet B during the subsequent transformation at lower temperature.
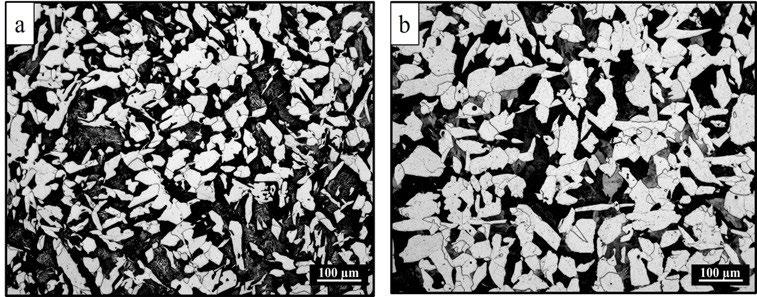
Figure 5a shows the SDAS values determined for the samples (Slice 3) in the four selected zones, for both billets. As can be seen, in both cases the SDAS values grow moving from the external zone to the core of the billets.
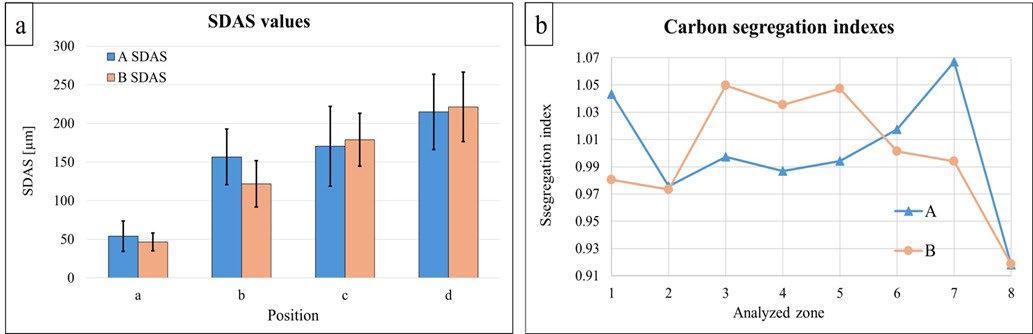
Fig.5 - a) SDAS values for A and B billets in the four selected regions; b) Carbon segregation index measured in different positions of billets A and B cross-sections.
For billet A, the small SDAS value measured in the external zone (figure 5a) shows an abrupt increase moving toward the core, because of the rapid transition from columnar to equiaxial growth that was detected in b position of the 3.1 sample. The billet A maximum SDAS value is
215 ±49 µ m, at the core of the billet. In billet B, the SDAS growth (figure 5a) from the external position to the core is more gradual, due to the larger extension of the columnar zone. The SDAS values at b and c positions for billet B are different despite their proximity because, during the
columnar growth, the solidification rate decreases moving towards the center of the billet. In the equiaxial zone at the core of the billet, instead, the solidification is more homogeneous and occurs almost simultaneously in the liquid mass, with slight differences between nearby areas. Billet A and B have comparable SDAS values in the four analyzed zone. The only notable difference is observed at position B, where billet A exhibits a slightly higher SDAS value due to the presence of an already developed equiaxed solidification structure, while billet B still shows a predominantly columnar solidification morphology at the same location.
Carbon and sulfur contents for the two billets (A and B), were measured on the diagonal of Slice 2 (figure 1a) with the elemental analyzer Eltra CS2000. Billet B presents a higher sulfur average content (32.7 ppm) respect to billet A (13.2 ppm). The difference is almost constant in the eight
positions analyzed along the billet’s diagonal, confirming the chemical composition presented in table 1. Looking at carbon content, billet B has an average value of about 0,25 ±0.011 %, while billet A presents a higher value of about 0,26 ± 0.012 %. The segregation index measured in the selected positions of the two samples is presented in the figure 5b. The difference in C content is not sufficient to affect markedly the material mechanical properties. Billet A shows larger segregation indexes respect to billet B in the internal zones, near the billet core, with a maximum value of about 1,07. The SEMS acts near position 5 in billet A (white band is close to this position). The billet A segregation indexes in the position 1 to 6 are homogeneous. On the contrary, in regions 7 and 8, which are the last that solidify and far from the SEMS influence zone, the segregation indexes exhibit a variable trend.
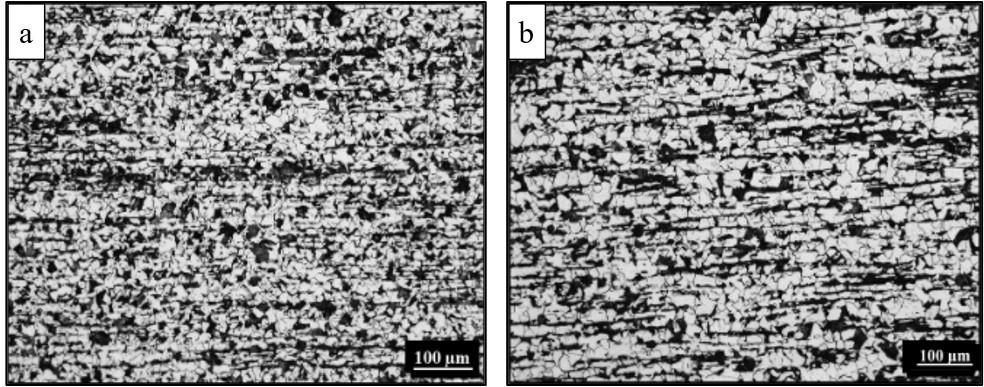
In figure 6, the microstructure of the wire rods manufactured from billed A and B are reported. The wire rod B shows marked bands of ferrite and pearlite (figure 6b), especially in the core zone of the sample, along the longitudinal axis. Moreover, the wire rod A presents a finer microstructure (figure 6a) with an average ferritic grain size of 6.1 µ m, while the B wire rod average grain size is 8.4 µ m, that is 39% larger than the wire rod A sample. The larger grain size for the wire rod B is responsible for the marked banded microstructure, as larger grains form bigger bands. It is worth noting that the microstructure of billet B is coarser than that of billet A. Therefore, after the hot rolling process, wire rod B microstructure is also expected to be coarser than that of wire rod A, given that the hot
rolling process parameters are the same for both billets. A larger equiaxed region, a comparable SDAS, and a finer microstructure of the billet, lead to a finer microstructure in the wire rod, after the hot rolling process [19].
The mechanical properties of the two wire rods A and B (table 2) are consistent with the observed difference in grain size. Wire rod A, with the finer microstructure, has also higher properties, with yield strength and tensile strength exceeding those of wire B by as much as 23 MPa.
Tab.2 - Yield strength, tensile strength and area reduction at fracture of A and B wire rods.
Considering the Hall-Petch relation, it is possible to predict the effects of grain size on the yield strength of metals through the formula: where σ y is the yield strength, σ i is the overall resistance of the lattice to dislocation movement; ky is the grain boundary locking term which measures the relative hardening contribution by the grain boundaries, and d is the grain diameter [20]. For low carbon steel, a k y value of 15 MN/m2mm1/2 can be assumed [21], resulting in a difference in yield strength between the two sample of 29 MPa. This value is quite in agreement with the difference measured by tensile tests (i.e. 23 MPa). Vickers micro-hardnesses also confirm the difference in the mechanical properties. As expected, also in this case, the finer microstructure of wire rod A is responsible for a superior hardness value. Wire rod A presents a hardness average value of 179 ± 4 HV, while wire rod B has an average value of 160 ± 5 HV. Using the conversion table provided in the ASTM A37015 standard to compare the hardness value to the tensile strength, the measured σ r difference is confirmed.
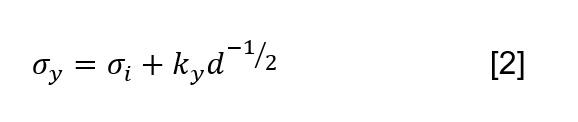
The observed discrepancy in the mechanical properties of the wire rods produced from the two steel billets can be attributed to the different microstructures resulting from their respective solidification conditions. Billet A, which underwent a higher cooling rate during solidification, developed a finer microstructure and a significantly larger equiaxed zone, approximately twice as wide as that of billet B, while maintaining a comparable SDAS. These initial features contributed to the formation of a finer microstructure in the hot-rolled wire rod. As mechanical properties are significantly influenced by grain size, the finer microstructure of wire rod A results in enhanced yield and tensile strength in comparison to wire rod B despite similar values of area reduction.
The authors would like to thank the laboratories staff of MetalL@BS (Università degli Studi di Brescia), and the staff of the quality department of Acciaierie di Calvisano S.p.A.* and Arlenico S.p.A.* (*Feralpi Group).
The SEM-EDS analysis performed to assess the segregation of Mn or C along the banded microstructure from the surface to the core of the wire rod samples revealed no significant difference between the two wire rods samples, indicating that no remarkable segregation is present. This confirms the chemical analysis on the two billets, where no significant segregation was detected. Comparable results were obtained also for the chemical analysis of pearlite and ferrite and for the non-metallic inclusion count.
[1] Y. Nian et al., “Application Status and Development Trend of Continuous Casting Reduction Technology: A Review,” Processes, vol 10, p. 2669, 12/12 2022, doi: 10.3390/pr10122669.
[2] A. Vakhrushev et al., “Electric Current Distribution During Electromagnetic Braking in Continuous Casting,” Metallurgical and Materials Transactions B, vol. 51, pp. 1-18, 09/01 2020, doi: 10.1007/s11663-020-01952-3.
[3] G. Krauss, “Solidification, segregation, and banding in carbon and alloy steels,” Metallurgical and Materials Transactions B, vol. 34, no. 6, pp. 781-792, 2003/12/01 2003, doi: 10.1007/s11663-003-0084-z.
[4] Y. Ji, H. Tang, P. Lan, C. Shang, J. Zhang, “Effect of Dendritic Morphology and Central Segregation of Billet Castings on the Microstructure and Mechanical Property of Hot-Rolled Wire Rods,” Steel Research International, vol. 88, p. 1600426, 02/01 2017, doi: 10.1002/srin.201600426.
[5] J. Kovács, A. Rónaföldi, Á. Kovács, A. Roósz, “Effect of the rotating magnetic field on the unidirectionally solidified macrostructure of Al6Si4Cu alloy,” Transactions of the Indian Institute of Metals, vol. 62, no. 4, pp. 461-464, 2009/10/01 2009, doi: 10.1007/s12666-0090085-y.
[6] S. Eckert, B. Willers, P. A. Nikrityuk, K. Eckert, U. Michel, G. Zouhar, “Application of a rotating magnetic field during directional solidification of Pb–Sn alloys: Consequences on the CET,” Materials Science and Engineering: A, vol. 413-414, pp. 211-216, 2005/12/15/ 2005, doi: https://doi.org/10.1016/j.msea.2005.09.014.
[7] T. Sun, F. Yue, H.-J. Wu, C. Guo, Y. Li, Z.-C. Ma, “Solidification structure of continuous casting large round billets under mold electromagnetic stirring,” Journal of Iron and Steel Research International, vol. 23, no. 4, pp. 329-337, 2016/04/01 2016, doi: 10.1016/ S1006-706X(16)30053-X.
[8] X. Li, Y. Fautrelle, Z. Ren, “Influence of thermoelectric effects on the solid-liquid interface shape and cellular morphology in the mushy zone during the directional solidification of Al-Cu alloys under a magnetic field,” Acta Materialia, vol. 55, no. 11, pp. 3803-3813, 2007/06/01/ 2007, doi: https://doi.org/10.1016/j.actamat.2007.02.031
[9] C. Yao et al., “Effects of Secondary Cooling Segment Electromagnetic Stirring on Solidification Behavior and Composition Distribution in High-Strength Steel 22MnB5,” JOM, Article vol. 74, no. 12, pp. 4823-4830, 2022, doi: 10.1007/s11837-022-05542-3.
[10] X. Zhang, C. Xu, C. Lei, T. Wang, H. Lin, H. Wu, “Study on Stirring Effect of Spiral Magnetic Field in Continuous Casting of Round Blooms,” steel research international, vol. 95, no. 1, p. 2300278, 2024/01/01 2024, doi: https://doi.org/10.1002/srin.202300278
[11] H. Preßlinger, M. Mayr, E. Tragl, C. Bernhard, “Assessment of the Primary Structure of Slabs and the Influence on Hot- and ColdRolled Strip Structure,” Steel Research International, vol. 77, pp. 107-115, 02/01 2006, doi: 10.1002/srin.200606362.
[12] W. A. Spitzig, “Effect of sulfide inclusion morphology and pearlite banding on anisotropy of mechanical properties in normalized C-Mn steels,” Metallurgical Transactions A, vol. 14, no. 1, pp. 271-283, 1983/02/01 1983, doi: 10.1007/BF02651624.
[13] X. Li, X. Wang, Y. Bao, J. Gong, W. Pang, M. Wang, “Effect of Electromagnetic Stirring on the Solidification Behavior of High-MagneticInduction Grain-Oriented Silicon Steel Continuous Casting Slab,” JOM, vol. 72, 02/11 2020, doi: 10.1007/s11837-020-04058-y.
[14] C. Yao et al., “Effect of traveling-wave magnetic field on dendrite growth of high-strength steel slab: Industrial trials and numerical simulation,” International Journal of Minerals, Metallurgy and Materials, vol. 30, no. 9, pp. 1716-1728, 2023/09/01 2023, doi: 10.1007/ s12613-023-2629-2.
[15] H. Wang et al., “Dendrite Structure, Spot Segregation and Banded Defect of Gear Steel in Continuous Casting and Rolling Process,” Metallurgical and Materials Transactions B, vol. 54, no. 2, pp. 895-912, 2023/04/01 2023, doi: 10.1007/s11663-023-02734-3.
[16] E. Vandersluis and C. Ravindran, “Comparison of Measurement Methods for Secondary Dendrite Arm Spacing,” Metallography, Microstructure, and Analysis, vol. 6, no. 1, pp. 89-94, 2017/02/01 2017, doi: 10.1007/s13632-016-0331-8.
[17] P. Lan, C. Su, H. Ai, “Solidification Structure and Segregation in Billet Continuous Casting Under High Casting Speed for Alloyed Steel,” Metallurgical and Materials Transactions B: Process Metallurgy and Materials Processing Science, Article vol. 55, no. 6, pp. 5093-5109, 2024, doi: 10.1007/s11663-024-03314-9.
[18] M. R. Bridge, G. D. Rogers, “Structural effects and band segregate formation during the electromagnetic stirring of strand-cast steel,” Metallurgical Transactions B, vol. 15, no. 3, pp. 581-589, 1984/09/01 1984, doi: 10.1007/BF02657390.
[19] S. S. Raza et al., “Effect of hot rolling on microstructures and mechanical properties of Ni base superalloy,” Vacuum, vol. 174, p. 109204, 2020/04/01/ 2020, doi: https://doi.org/10.1016/j.vacuum.2020.109204
[20] R. Lumley, A. Morton, I. Polmear, “Nanoengineering of metallic materials,” in Nanostructure Control of Materials, R. H. J. Hannink and A. J. Hill Eds.: Woodhead Publishing, 2006, pp. 219-250. doi:10.1533/9781845691189.219
[21] M.-Y. Seok, I.-C. Choi, J. Moon, S. Kim, U. Ramamurty, J.-I. Jang, “Estimation of the Hall-Petch strengthening coefficient of steels through nanoindentation,” Scripta Materialia, vol. 87, pp. 49-52, 2014/09/15/ 2014, doi: https://doi.org/10.1016/j.scriptamat.2014.05.004
Continuous casting has long been the most efficient method for converting liquid steel into solid semi-finished products for hot rolling. While over 90% of steel becomes high-quality slabs or bars, some are inevitably downgraded or scrapped during sequence starts, ends, or transition zones because of alloy changes within a casting sequence. Traditionally, the transition zone length is estimated based on online models and operator experience, often conservatively resulting in large buffer zones, which are either scrapped or downgraded. Laser-Induced Breakdown Spectroscopy (LIBS) enables real-time chemical analysis of steel strands, allowing precise identification of the position of transition zones and eventually minimizing downgrading or scraping.
KEYWORDS: LIBS; INLINE ANALYSIS IN CASTING STRAND; TRANSITION ZONE DETECTION; HOT SLAB AND BLOOM ANALYSIS; FIBERLIBS CONTINUOUS CAST; QUALITY ASSURANCE IN STEEL MAKING;
As steel markets shift toward more diverse grades and smaller production lots, continuous casting operations face increased stoppages or grade transitions during casting sequences. This creates a transition zone where steel properties change, requiring either downgrading or removal to maintain product quality, which reduces yield and profitability. Traditionally, this zone is estimated to use online models based on casting parameters and alloy compositions. Currently, validating these models is only possible by cutting slabs in slices and analyzing the chemical composition of these slices. Unfortunately, this validation method requires very high efforts and is destructive. Further, it is only possible postmortem. Due to this missing validation in practical processes users tend to add large buffer zones to the result of online models, often causing more material loss than necessary [3, 4]. Laser-Induced Breakdown Spectroscopy (LIBS) enables real-time tracking of alloy and trace element concentrations, allowing accurate detection of transition zone boundaries [1, 2]. This minimizes waste and enhances both productivity and resource efficiency.
Martin Sprunk, Amit Ahsan, Andreas John
SECOTPA analytics GmbH, Rheinstrasse 15B, Teltow, Germany, 14513
Laser-Induced breakdown spectroscopy (LIBS) is performed by focusing a laser beam on a sample. A small part of the material is ablated and transformed into plasma. The breakdown of the plasma emits element-specific light, which can be detected relative to the wavelength with a spectrometer. The acquired spectrum is analyzed with computational methods, determining which elements are present by comparing the wavelength of spectral peaks with databases. Furthermore, the intensity (height) of each peak can be linked to the concentration of said elements by calibrating a LIBS-device with reference material with known chemical compositions [1, 2].
Recently, Secopta implemented the first reference system on an industrial scale. A development from several, already industrial proven applications and hardware configurations. So far transition zones between different steel
grades have been measured successfully, showing precise stop and end position of the transition zone. These measured results can be directly transferred into the production control system of the user to automatically control the cut-position of flame cutters.
For the practical application the LIBS-sensor was mounted directly over the continuous cast strand in the horizontal part after the secondary cooling zone. In this way continuous measurements of the chemical composition of the strand are possible. Additionally, the hardware was protected by heatshields and a refractory lance (see picture figure 1).
Further the sensor was equipped with a pre-ablation laser to clean the surface from growing scale or other disturbances before measuring the chemical composition by the LIBS-sensor.
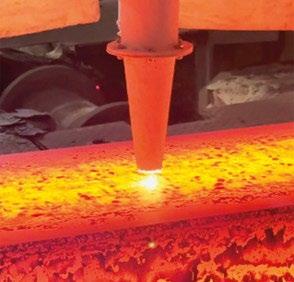
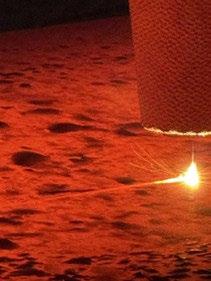
The system was tested at the industrial reference with several different steel grades and alloy-changes during sequences. As in an industrial process, grades cast sequentially on top of each other will always be as close to each other as possible, grades with close chemical compositions were picked. The variations were in the range of e.g.
0.2%Mo to 0%Mo and 1%Cr and 0%Cr (see the example in figure 2). When measuring the chemical composition over the length of the strand it was found that the composition of each element changes in the shape of an S-curve over the length of the strand.
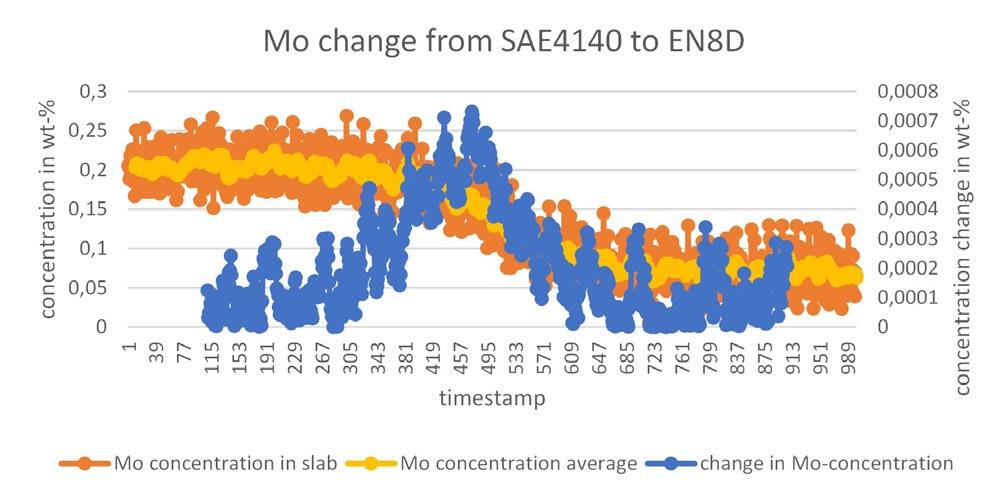
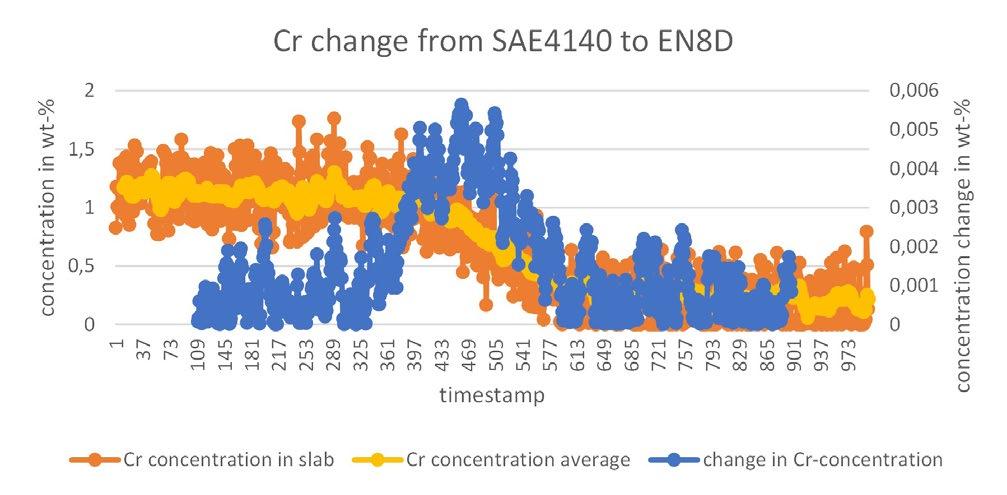
- The alloy change between a SAE4140 (42CrMo4) and an EN8D (C45) was measured, showing clearly the transition of Cr and Mo.
By calculating the change between each data point for each element a characteristic peak is formed, representing the derivative of the S-curve. This peak marks the beginning and the end of the transition zone for the respected element. By measuring Si, Mn, Al, Cr, Mo, Ti and V simultaneously, this peak is shown for several elements. Eventually all peaks will be normalized with respect to the mean concentration and added up (see figure 3). By several statistical rules the beginning and the end of
the transition zone can be derived from the added-up peak (see the dashed lines in figure 3). Eventually, the measured beginning and end positions of the transition zone were offset by the customer to account for the different position of the liquid phase tip by online simulations.
By several trials it was found that the length of the measured transition zones were around 4-5 meters depending on casting parameters and alloy compositions.
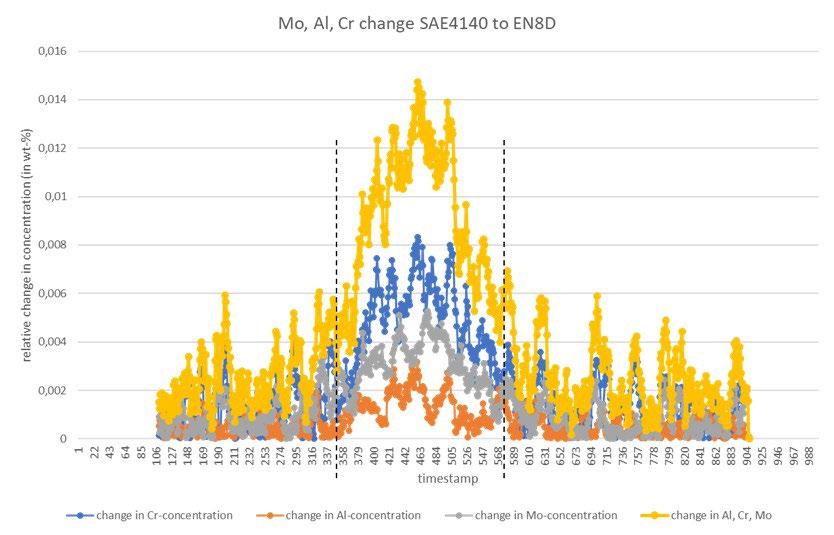
- Single peaks and added-up peak (yellow) for the elements Cr, Al and Mo for the transition of SAE4140 to EN8D.
In conventional process, to avoid intermixes, large safety zones with lengths of 8m (calculated by different models) are being cut as transition zones. Inline measurements with LIBS show significant potential to accurately detect the transition zones, realistically estimated to last
between 4 to 5 meters long. With three sequential castings per day and a cross-section of 530 x 390 mm2 this decrease of about 3 meters per alloy change led to an increase of 3.600 to of steel production per year in one strand. Previously this material was wasted and had to be scrapped or sometimes sold with a lower market value.
Therefore, the online detection of the intermixed zone during the alloy change poses a clear possibility to reduce waste and cut costs and CO2 emissions effectively. In the next steps methods for defining the beginning and end of the transition zone by the LIBS measurement need to be refined to further improve the accuracy of the detection.
[1] A. W. Miziolek, V. Palleschi and I. Schechter, “Laser Induced Breakdown Spectroscopy: Funda-mentals and Applications” Cambridge University press, 1st Edition, 2006, DOI: https://doi.org/10.1017/CBO9780511541261
[2] S. Musazzi and U. Perini, “Laser-induced breakdown spectroscopy: theory and applications” Springer, 2014, DOI: https://doi. org/10.1007/978-3-642-45085-3
[3] K. Taube, Stahlerzeugung kompakt: Grundlagen der Eisen- und Stahlmetallurgie, Braunschweig: Vieweg, 1998
[4] R. Stohn, Allgemeine Hüttenkunde, Leipzig: Fachbuchverlag, 1953
B. Glaser, S. Kuthe, I. Vaitsis, A. Chasiotis, M. Chini, D. Gaspardo, D. Olivieri, M. Schäfer, U. Faltings, P. Döhr, K. Rudolf, T. Lamp, M. Hölscher, H. G. Leonidas, F. Katsanevakis, H. Köchner
HIYIELD project applies advanced technologies to enhance circular economy practices by increasing scrap usage in steel production and reducing reliance on pig iron from coal-fired blast furnaces. The project’s objectives are structured across three industrial demo cases, each addressing a critical aspect of scrap utilization.
In demo case 1, industrial-scale trials were conducted to optimize scrap sorting through mechanical, physical, and sensor-based separation techniques. A hammer mill-based process achieved a ferrous yield of 99.5% purity, with a magnetic separation efficiency of 91%. In addition, a laser scanner system was implemented for real-time scrap volume estimation, improving charge optimization for steelmaking. A Deep Learning (DL) based classification model was developed to enhance automated scrap recognition, integrating Electric Arc Furnace (EAF) process data and real-time imaging for improved material characterization.
In demo case 2, industrial trials were conducted to optimize the identification, classification, and processing of pre-consumer scrap using X-Ray Fluorescence (XRF) based separation and DL-based models. The implementation of the Digital Scrap Information Card (DiSC) enabled efficient data exchange between suppliers and consumers, ensuring accurate scrap tracking. Furthermore, a DL-based scrap identification system utilizing Self-Supervised Learning (SSL) models for automated scrap classification was developed, improving scrap assessment.
In demo case 3, High-Speed Sampling (HSS) and an analysis system were developed for direct on-site characterization of liquid steel. The chemical compositions obtained from the combined HSS, and conventional lollipop sampling system were analysed, showing strong agreement between the two sampling methods. This high level of consistency confirms the accuracy and reliability of HSS sampling for immediate steel analysis. The project’s findings support increased scrap usage in steelmaking, enhanced process efficiency, and reduced environmental impact, aligning with the EU’s long-term decarbonisation and circular economy goals.
KEYWORDS: CIRCULAR ECONOMY; DECARBONISATION; DIGITALIZATION; SCRAP UTILIZATION; DEEP LEARNING; HIGH-SPEED SAMPLING; SCRAP CLASSIFICATION; STEEL PROCESS OPTIMIZATION;
The global crude steel production reached 1,884 million tons (Mt) in 2024 [1]. On average, 1.8 t of CO2 are emitted for every ton of steel produced [2]. The iron and steel industry accounts for approximately 7% of global CO2 emissions, corresponding to around 2.6 Gt CO2 annually. It ranks as the largest industrial contributor to CO2 emissions and the
second-largest industrial energy consumer worldwide. Therefore, efficient decarbonisation of the steel sector will play a key role in achieving the EU climate goals by 2050. Scrap-based steel production can contribute to decarbonisation by reducing the demand for pig iron and limiting iron ore reduction in coal-fired blast furnaces. This approach lowers CO2 emissions and supports more
sustainable steel production. The HIYIELD project [2] represents the effort of selected key representatives of the steelmaking value chain to contribute to the reduction of these emissions and thereby to compliance with EU climate targets. The project consortium was wellbalanced, comprising steel manufacturers, scrap suppliers and technology providers. The main objectives that the HIYIELD project addressed, among others, were to maximize:
1. scrap quality through optimal technologies for impurity removal and optimal use of alloying elements;
2. scrap usage through improved scrap identification and classification, along with scrap tracking within a circular economy;
3. product quality with increased scrap uptake by optimizing the charge and ensuring accurate liquid steel analysis, thereby improving the final steel product quality.
HIYIELD targeted the implementation of innovative technologies such as Artificial Intelligence (AI), Machine Learning (ML), Deep Learning (DL) and Big Data, aiming to increase scrap uptake in various scenarios that represented the prevailing European steelmaking routes [4-8]. The HIYIELD project was demonstrated through three industrial-scale demo cases, each designed to promote a more efficient and sustainable use of scrap within a circular economy framework. These three demo cases showcased how innovative technologies such as Deep Learning, HighSpeed Sampling, and Digital Scrap Tracking could be applied to different stages of the steelmaking value chain to maximize scrap utilization and reduce environmental impact. Demo case 1 focuses on enhancing the quality of low-grade post-consumer scrap through mechanical, magnetic, and sensor-based separation methods. Real-time scrap classification and laser-based volume estimation were implemented to optimize bucket charging strategies, directly contributing to better control of the raw material mix. Demo case 2 addressed the identification, separation, and traceability of pre-consumer scrap using X-Ray Fluorescence (XRF) based sorting and digital tools.
Digital Scrap Information Card (DiSC) ensured transparent communication between scrap suppliers and steelmakers, while Deep Learning models enabled highly accurate real-
time scrap classification supporting closed-loop material cycles within circular economy. Demo case 3 implemented a high-speed Optical Emission Spectroscopy (OES) system enabling direct, on-site chemical analysis of liquid steel. This approach can minimize production delays and energy losses while improving the reliability of alloy control, thereby supporting increased scrap utilization without compromising product quality. The developed innovations were collectively validated, at an industrial scale, in terms of technical excellence, environmental impact reduction, and industrial/business case relevance.
HIYIELD framework integrated digitalization, advanced analytics, and high-speed analysis technologies to increase scrap utilization, improve process efficiency, and reduce CO2 emissions in steel production. The project connected strategic objectives with demonstration cases, targeting increased scrap uptake while maintaining or improving product quality. The enabling methods are introduced in figure 1 and described in detail in the Methodology section.
Björn Glaser, Sudhanshu Kuthe, Fotios Katsanevakis
Department of Materials Science and Engineering, KTH Royal Institute of Technology, Brinellvägen 23, SE-10044, Stockholm, Sweden
Ioannis Vaitsis, Andreas Chasiotis
AEIFOROS Metal Processing AE, 12th km Old National Road Thessaloniki-Veria, PC 57008, Ionia Thessaloniki
Matteo Chini, Daniele Gaspardo, Daniele Olivieri
Ferriere Nord SPA, Via delle Ferriere, 33010 Zona Industriale di Rivoli di Osoppo (UD), Italy
Michael Schäfer, Ulrike Faltings
Stahl-Holding-Saar (SHS) GmbH, Werkstr. 1, 66763 Dillingen, Germany/ Saarstahl 66333 Völklingen, Germany
Philipp Döhr, Kristin Rudolf
Theo Steil GmbH, Ostkai 6, 54293 Trier, Germany
Torsten Lamp, Matthias Hölscher
Minkon GmbH, Heinrich-Hertz-Straße 30-32, D-40699 Erkrath, Germany
Haslinger Gerald Leonidas
Voestalpine BÖHLER Edelstahl GmbH, Mariazeller-Straße 25 8605 Kapfenberg
Herbert Köchner
ASenSo GmbH, Pulheim, Germany
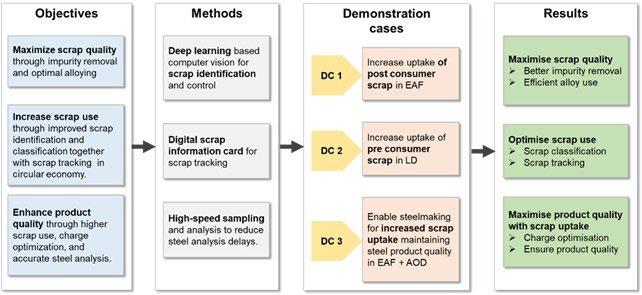
expected results.
The methodological framework of the HIYIELD project integrated industrial-scale experimental validation, digital data acquisition, and data-driven model development. The methodological framework of HIYIELD (see figure 1) consists of three main pillars:
• Deep Learning-based computer vision for scrap identification and control: DL and machine vision was applied to classify preconsumer and postconsumer scrap and correlate properties with process data for optimized charging prior to steelmaking. Data driven tool was also developed to support the optimal use of scrap.
• Digital Scrap Information Card (DiSC) for scrap tracking: a standardized digital interface enabled data exchange was developed between scrap provider and steel manufacturer. This includes digitization of scrap quality, analysis, quantity, and delivery timing.
• High-Speed Sampling (HSS) and analysis: a novel OES-based sampler was developed for direct onsite analysis of liquid steel, significantly reducing sampling time and energy consumption during steel melting and chemical control in the furnace. Demonstration trials were conducted at multiple partner facilities to evaluate the performance of scrap sorting technologies, sensor-based separation systems, and
analytical tools under real production conditions. Dedicated data acquisition systems were implemented to collect process-relevant information from scrap handling operations, XRF and laser-based systems, furnace monitoring systems, and High-Speed Sampling (HSS) analysis. The acquired datasets were used to develop and validate Deep Learning-based classification models and data-driven approaches for enhanced scrap characterization and process optimization. The datasets collected cover the following aspects:
• high-resolution scrap images taken at defined intervals;
• chemical composition data from XRF and OES;
• process parameters from real steelmaking operations;
• material flow and logistics data for Life Cycle Analysis (LCA).
Data-driven Deep Learning models were developed using validated datasets, applying cross-validation and industrial deployment trials. Performance indicators included classification accuracy, scrap purity, sampling time, and the level of agreement between analytical methods. The first demonstration case focused on improving the quality of post-consumer scrap through mechanical processing and sensor-based technologies. Scrap materials from end-of-life products often contain impurities and mixed materials that must be removed before use in steelmaking.
Industrial trials were conducted using a hammer millbased processing route designed to fragment scrap and liberate metallic components. This process improved the effectiveness of subsequent magnetic separation, resulting in a ferrous yield purity of approximately 99.5% and magnetic separation efficiency of approximately 91%. These results demonstrate that mechanical processing can significantly improve scrap quality. In addition to mechanical processing, a laser-based scanning system was implemented to estimate scrap volume in real time. Accurate volume estimation is essential for
optimizing bucket charging and reducing variability in furnace operation. The developed system enabled more consistent charging practices and improved control of the raw material mix. Deep Learning-based computer vision models were also developed to classify scrap types automatically. These models processed real-time images captured during scrap handling and were trained using industrial datasets. The classification results were used to support decision-making in scrap preparation and charging, reducing reliance on manual inspection in figure 2.
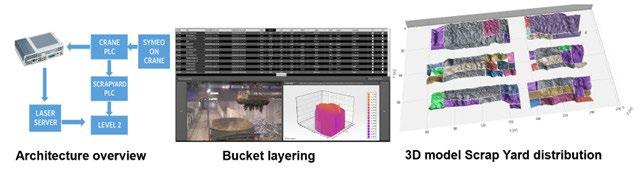
Fig.2 - Volume data obtained from the laser scanners are integrated into the scrap management software, including bucket loading and production recipes.
The second demonstration case addressed challenges related to the identification, classification, and traceability of pre-consumer scrap. Pre-consumer scrap often contains valuable alloying elements, but improper identification may lead to inefficient use or contamination of steel grades. X-Ray Fluorescence (XRF) systems were implemented to determine the chemical composition of scrap materials and enable separation based on alloy content. This approach improved control of tramp elements and supported more accurate scrap mix design. A key development in this demonstration case was the Digital Scrap Information Card (DiSC), a standardized digital system designed to facilitate the exchange of scrap information between suppliers and steel producers. The DiSC included data on scrap composition, origin, quantity, and delivery timing (figure 3). The digital infrastructure improves transparency and supports circular economy practices by enabling better tracking of material flows. Deep Learning models based on self-supervised learning techniques were developed to improve scrap classification without
requiring large labeled datasets. These models learned meaningful features from unlabeled scrap images and demonstrated improved classification performance compared with traditional approaches. The use of self-supervised learning is particularly advantageous in industrial environments where labeled datasets are limited. The third demonstration case focused on improving real-time characterization of liquid steel. Conventional sampling methods often require significant time for sample preparation and laboratory analysis, which may delay process adjustments and increase energy consumption.
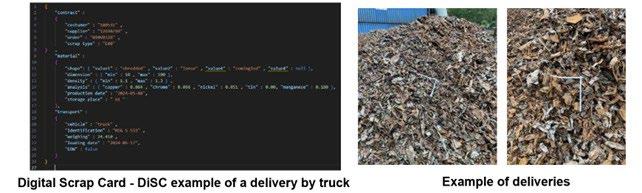
A High-Speed Sampling (HSS) system integrated with optical emission spectroscopy was developed in the third demonstration case to enable direct on-site chemical analysis of liquid steel. The system significantly reduced sampling time while maintaining high analytical accuracy. Comparative trials were conducted to evaluate the agreement between HSS and conventional lollipop sampling methods (refer figure 4). The results showed strong agreement in measured chemical compositions, confirming the reliability of the developed system. Faster analysis enabled quicker process adjustments, improved alloy control, and reduced energy losses during melting. For industrial verification of the high-speed analysis an in-line
combination sample has been developed. The sampler was suitable for automated application. More than 500 in-line combination samplers comprising one lollipop sample and one HS sample were applied under standard industrial conditions. These combination samples were collected from several heats with different compositions for statistical evaluation. All samples were analysed by laboratory reference methods and by the HS analyser. Outliers were excluded based on predefined criteria. Overall, 98% of the HS samples met the specified limits and were compared with the independent laboratory reference analysis of the lollipop standard sample.
RESULTS AND DISCUSSIONS
Mechanical Processing and Separation
Post-consumer scrap often contains mixed materials, coatings, and non-metallic inclusions. Mechanical processing is therefore required to liberate metallic components and improve separation efficiency. In the HIYIELD project, hammer mill-based processing was evaluated under industrial conditions. The fragmentation process
improved the effectiveness of downstream magnetic separation, resulting in a ferrous yield purity of approximately 99.5%. Magnetic separation efficiency reached approximately 91%, demonstrating the effectiveness of the processing route. Improved scrap purity reduces contamination risks in the furnace and enables higher scrap charging ratios without compromising product quality.
Accurate estimation of scrap volume is essential for optimizing bucket charging and ensuring consistent furnace operation. Variations in scrap density and geometry often make manual estimation unreliable. A laser scanning system was developed to estimate scrap volume in real time. The system generated three-dimensional surface profiles of scrap piles and calculated volume using geometric reconstruction algorithms. Industrial trials showed that the system improved charging consistency and reduced variability in furnace operation. More accurate charging also contributes to improved thermal balance and reduced energy consumption.
Computer vision techniques and Deep Learning techniques were applied to automate scrap classification. High-resolution cameras captured images of scrap during handling and processing. Convolutional neural networks were trained using large datasets of labeled scrap images. The models learned to distinguish between scrap types based on geometric features, surface texture, and color patterns. In addition to supervised learning approaches, self-supervised learning based on contrastive learning were investigated to improve model robustness and reduce dependence on labeled data. This approach enables feature learning from large volumes of unlabeled industrial data, which is particularly valuable in scrap processing environments. Experimental evaluation demonstrated that self-supervised models achieved improved classification accuracy (98%) and robustness under variable lighting and environmental conditions. Industrial deployment demonstrated that automated classification can support optimized charging strategies and reduce reliance on manual inspection.
Pre-consumer scrap often contains valuable alloying elements that must be properly identified to ensure efficient reuse. X-Ray Fluorescence (XRF) systems were implemented to measure chemical composition and enable sorting based on alloy content. The use of XRF-based sorting improved control of tramp elements and enabled more accurate scrap mix design. This contributes to improved metallurgical control and reduced risk of off-specification steel grades.
A key innovation of the project was the Digital Scrap Information Card (DiSC), a standardized digital system designed to improve scrap traceability. The DiSC stores information including:
• scrap origin;
• chemical composition;
• processing history;
• quantity and logistics data.
This digital infrastructure enables transparent communication between scrap suppliers and steelmakers, supporting closed-loop recycling and circular economy practices.
Comparative trials demonstrated strong agreement for key alloying elements between the high-speed (HS) analyzer and conventional OES laboratory analysis for all investigated elements. Correlation analyses showed excellent consistency between measurements taken on both sides of the HS samples using the HS analyzer, as well as high agreement between HS and conventional laboratory OES results. For carbon and silicon, very high coefficients of determination confirm reliable analytical performance. Similarly, copper and aluminium measurements showed strong correlations and low standard deviations, indicating stable and precise analysis.
Overall, the results confirmed that the High-Speed Sampling system provided accurate and reproducible chemical measurements under industrial conditions, supporting its suitability for implementation in routine steelmaking operations.
Increasing scrap utilization reduces energy consumption and CO2 emissions by reducing the need for primary raw materials. The technologies developed in the HIYIELD project support the implementation of higher scrap ratios while maintaining productivity and quality. Digitalization helps improve operational efficiency by reducing delays, improving decision-making, and enabling predictive optimization. These improvements contribute to environmental sustainability and enhanced operational efficiency. LCA was conducted to evaluate the environmental impacts of HIYIELD innovations within EAF and BF-BOF route [8].
The analysis combined:
• primary data from scrap sorting processes;
• steelmaker data for traditional scrap compositions and emissions;
• secondary datasets including Ecoinvent 3.11 and WorldSteel databases.
The LCA showed that improved scrap sorting and classification technologies can reduce environmental impacts by enabling higher-quality scrap input and minimizing variability during melting. The gap between the design performance and the actual output highlighted the influence of feedstock variability, labour availability, and equipment efficiency under real industrial conditions. Despite these practical limitations, the trials confirmed that the upgraded infrastructure significantly improved scrap quality and process yield.
The results of the HIYIELD project provide a solid foundation for the further industrial deployment of digital scrap management and process optimization technologies in steel production. Future efforts should focus on large-scale implementation across different plant configurations and production routes to validate scalability and long-term operational stability. Further development of data-driven models, including adaptive and self-learning systems, will be essential to improve robustness under varying scrap qualities and fluctuating market conditions. Integration of real-time monitoring tools, advanced analytics, and predictive control strategies into plant-wide automation systems offers significant potential to further increase scrap utilization while maintain-ing stable process performance and product quality. In addition, continued assessment of environmental per-formance through comprehensive life cycle approaches will support transparent evaluation of sustainability benefits. Expanding digital traceability concepts, such as standardized scrap information systems, could fur-ther strengthen value chain integration and resource efficiency. Overall, the transition toward digitally ena-bled, resource-efficient steel production requires sustained collaboration between technology providers, steel producers, and research institutions to ensure continuous innovation and industrial impact.
[1] World Steel Association (2025). Annual production: Crude steel total. Accessed July 20, 2025. Available at: https://worldsteel.org/ data/annual-production-steel-data/?ind=P1_crude_steel_total_pub
[2] L. Holappa, “A general vision for reduction of energy consumption and CO₂ emissions from the steel industry”, Metals, 10(9), 1117, 2020. https://doi.org/10.3390/met10091117
[3] HIYIELD Project. HIYIELD Project website. Accessed February 21, 2026. Available at: https://www.hiyield.proj.kth.se
[4] M. Schäfer, U. Faltings, B. Glaser, “DOES: A multimodal dataset for supervised and unsupervised analysis of steel scrap”, Scientific Data, 10(1), 780, 2023. https://doi.org/10.1038/s41597-023-02623-9
[5] M. Schäfer, U. Faltings, B. Glaser, “CLRIUS: Contrastive learning for intrinsically unordered steel scrap. Machine Learning with Applications”, 17, 100573, 2024. https://doi.org/10.1016/j.mlwa.2024.100573
[6] M. Schäfer, U. Faltings, B. Glaser, “Machine learning approach for predicting tramp elements in the basic oxygen furnace based on the compiled steel scrap mix”, Scientific Reports, 15(1), 2430, 2025. https://doi.org/10.1038/s41598-025-02430-x
[7] M. Schäfer, U. Faltings, B. Glaser, “Artificial intelligence-based back-calculation model for scrap compiling optimization”, Engineering Applications of Artificial Intelligence, 167, Part B, 2026. https://doi.org/10.1016/j.engappai.2026.113809
[8] G. Wernet, C. Bauer, B. Steubing, J. Reinhard, E. Moreno-Ruiz, B. Weidema, “The ecoinvent database version 3 (Part I): Overview and methodology”, International Journal of Life Cycle Assessment, 21(9), 1218–1230, 2016. https://doi.org/10.1007/s11367-016-1087-8
DOI 10.36146/2026_03_65
M. De Santis, E. D’Amanzo, D. Capobianco, N. E. Perez, D. Mier Vasallo, C. Gruber, A. Atf, K. Marx, M. Koester, P. Ramirez Lopez, A. Gotti
Advancements in modelling are transforming the metallurgy sector, providing more precise tools for quality control and process optimization. In this context, within the framework of an EU-financed dissemination project (METACAST, Research Fund for Coal and Steel), a comprehensive review of solidification modelling in continuous casting and of the research landscape in Europe and worldwide has been performed.
Modelling steel continuous casting and solidification is essential for the accurate optimization of process parameters, such as casting speed and secondary cooling, in order to minimize defects like cracks and segregation. The use of advanced numerical simulations allows the prediction of dendritic structures and improves the quality of the final product. The research examines the fundamentals of thermodynamics, solidification kinetics, and fluid dynamics, and highlights the interplay among heat flow, mass transfer, and thermal stresses, showing their relevance in predicting microstructure formation and defect control. Techniques such as numerical simulation and thermal analysis are used to predict the formation of porosity and shrinkage, thereby improving the quality of the final product. The integration of advanced technologies, such as artificial intelligence and machine learning, is opening new frontiers in solidification modelling, allowing for greater precision and adaptability of models to various production processes. The scope of the work was to map solidification models and research groups present in Europe by gathering statistical data on their countries of origin and on the areas of interest of the developed models, and to identify common lines between them and compare EU expertise within the global context.
KEYWORDS: STEEL SOLIDIFICATION, FLOW, MODELLING, SKILL MAPPING, PROCESS CONTROL;
The numerical modelling of steel casting and solidification has become an essential discipline in modern metallurgical engineering, enabling the prediction of process behavior, optimization of industrial operations, and prevention of defects that impact steel quality. Over the past decades, increasingly sophisticated computational approaches have been introduced, allowing researchers and engineers to simulate heat transfer, fluid flow, microstructure evolution, and defect formation with unprecedented accuracy.
Today, numerical models serve not only as design and diagnostic tools but as integral components of digital ecosystems that connect simulations with real casting oper-
Michele De Santis, Edoardo D’Amanzo, Damiano Capobianco RINA Consulting, Centro Sviluppo Materiali SpA, Rome, Italy
Nora Egido Perez, Diana Mier Vasallo SIDENOR I+D, Basauri, Spain
Christine Gruber, Alireza Atf K1-MET, Linz, Austria
Kersten Marx, Marc Koester Betriebsforschungsinstitut, Düsseldorf, Germany
Pavel Ramirez Lopez SWERIM, Luleå, Sweden
Arianna Gotti Transvalor, France
ations through advanced sensors, real-time monitoring, and data-driven optimization. In this evolving landscape, the competencies of research institutions, industrial laboratories, and technology providers play a crucial role, as they shape the development and adoption of innovative modelling techniques across different regions.
The following section provides an overview of the fundamental physical phenomena involved in steel casting modelling, alongside the main numerical approaches used in research and industry. Subsequently, a geographic mapping of leading expertise is presented, highlighting centers of excellence and the regional distribution of modelling capabilities worldwide.
Numerical methods for modelling steel casting and solidification include the Finite Element Method (FEM), Finite Volume Method (FVM), Cellular Automata (CA) and Phase Field Models (PFM).
The key phenomena in steel casting modelling can be listed as follows.
• Heat Transfer, governing the solidification rate and significantly influencing the grain structure.
• Fluid Flow, affecting heat transfer, solute distribution, and inclusion behavior, via key mechanisms as natural and forced convection (e.g., due to electromagnetic stirring) and buoyancy-driven flow, which influence the flotation of non-metallic inclusions. CFD models are extensively used to study the impact of turbulent flow on solidification and simulate mold flow dynamics, including turbulence and electromagnetic effects.
• Solidification, determining the internal structure of steel (e.g., columnar or equiaxed grains). Accu-rate modelling requires coupling thermal and fluid flow models, often incorporating Darcy’s law, to describe the flow in the mushy zone.
• Solute Redistribution and Microsegregation, affecting the mechanical and chemical properties of the final product and requiring careful modelling approaches to ensure quality control.
• Precipitates, Inclusions and Defect Formation, linked to product quality and object of problem solv-ing.
The development and adoption of commercial and open-source computational tools have significantly advanced the modelling of steel casting processes. These tools implement momentum, heat, and solute con-servation equations in user-friendly interfaces. Recent innovations in steel casting and solidification model-ling include advanced computational techniques (e.g., multi-physics simulations and high-performance computing), as well as machine learning (ML) and artificial intelligence (AI), which are increasingly being used to predict casting defects, optimize process parameters, and analyze large datasets from simulations and experiments. Real-time monitoring through digital twins, acting as virtual replicas of casting processes, enables online process supervision and optimization.
To substantiate the regional classification, criteria were taken by assuming quantitative indicators from peer-reviewed technical literature and reproducible bibliometrics (Scopus/Web of Science, 2011–2025). In-dicators include scientific output, institutional presence, industrial competence (plant-validated model-ling/digital twins), software & technology development, and participation in technical networks. The indica-tors shown in table 1 were identified, normalized to a 0-5 scale by dividing by the maximum value across all regions.
Publications from 2011–2025 (inclusive) were considered, ensuring sufficient temporal coverage for contin-uous casting modelling developments including CFD, FEM/ FVM, multiphase modelling, thermo mechanical coupling, and emerging digital twin applications (well represented in the literature from ~2018 onward). Ex-amples include peer reviewed works on advanced multiphase models (e.g., CFD DBM VOF) and plant vali-dated digital twin control systems for bloom casters, software oriented modelling papers (ProCAST, MAG-MAsoft, FLOW 3D, etc.), and University/RTO outputs in casting modelling conferences.
Tab.1 - Indicators identified for region skill classification on casting modelling.
Indicator Description
Scientific Output
Institutional Presence
Industrial Competence
Software & Technology Development
Standards & Networks
# of publications in the fields of CFD, FEM, FVM, CA, PFM, solidification modelling, and casting process simulation; presence of internationally cited papers and recurrent authorship in high impact metallurgical journals
Existence of universities, research centers, or laboratories with dedicated groups in casting modelling, metallurgical process simulation, or materials solidification research; participation in multinational research programs (e.g., EU Horizon projects, industrial consortia
Activity of steel plants, technology suppliers, or engineering firms implementing advanced numerical modelling (e.g., virtual casting, mold simulation, inclusion behavior modelling); use of commercial or proprietary modelling tools at the industrial level
Contribution to the development of CFD/FEM software used in metallurgy (commercial or open source); specialized industrial suppliers producing simulation tools for casting and solidification.
Participation in industrial/technical committees/networks (AIST, SEAISI, etc.)
In fact, a classification based exclusively on publicly accessible evidence (peer reviewed publications, technical reports, and documented industrial case studies) may have under-represented actual competence in regions where advanced modelling is conducted predominantly within industry or in non-indexed chan-nels.
The arising classification in table 2 below was then re-elaborated based on Real Competence / Technologi-cal Skill. A typical example is Latin America. Here, Brazil ( see long tradition in metallurgical modelling, process simulation,
and computational engineering CSN, Gerdau, ArcelorMittal Tubarão, Usiminas, as well as strong steelmaking and modelling groups in Brazilian universities -USP, UFMG, UFOP, UFRGS) and Ar-gentina (e.g., Tenaris/Techint group, Tenaris R&D in Campana and the Tenaris/university collaborations in Argentina & Italy) host highly capable industrial and R&D teams with long standing practice in continuous casting simulation and process model-ling; however, much of this work is proprietary and therefore not fully reflected in bibliometric indicators.
Tab.2 - Classification of Research and Industrial Expertise in Steel Casting Modelling.
Region Skill based Classification Why
Europe Very High
East Asia (China, Japan, Korea)
Very High
North America High / Very High
South Asia (India) Medium
South East Asia Medium
Latin America Medium
Middle East Low–Medium
Long history, strong RTO network, advanced solver development, industrial adoption.
Strong computational modelling + extensive industrial DT implementation [7].
Strong Level 2/3 systems, CFD/ML expertise, large steel producers with modelling teams [8].
Large academic modelling base, some industrial adoption [9].
Growing competence but uneven across countries [10].
Strong industrial modelling culture (Tenaris, Gerdau, Usiminas), but largely internal and unpublished—competence is higher than literature suggests [11,12].
Modernizing steel sector but modelling mostly imported.
Global Positioning of European Expertise. Europe is internationally recognized for its highly advanced capabilities in the development, validation, and industrial implementation of numerical models for steel continuous casting. Over the past decades, the European research and industrial ecosystem has consolidated a leadership position, supported by extensive scientific production, long-standing academic–industry collaboration, and structured investment through EU funding programmes such as the Research Fund for Coal and Steel (RFCS). This combination has enabled Europe to move beyond purely theoretical modelling efforts and to translate advanced simulation methodologies into robust, operational tools widely adopted across industrial plants.
In approximately the last three decades [2], about 35 EU-funded projects have been developed involving casting modelling, roughly half of which were core R&I projects explicitly focused on modelling for steel continuous casting (Main Topic “Modelling”), with the remainder including modelling-centric accompanying measures. The most involved countries—listed in order of participation—are Germany, Italy, Austria, Spain, Belgium, Sweden, France, the United Kingdom, Finland, and the Netherlands.
The maturity of European expertise is reflected not only
in the depth of fundamental research—covering thermodynamics, fluid flow, microstructure evolution, and defect prediction—but also in its strong orientation toward applied problem-solving. European groups have been among the first to integrate high-fidelity numerical simulations, data-driven approaches, and digital-twin technologies into real production environments. As a result, Europe positions itself at a remarkably advanced level in the development, validation, and industrial deployment of numerical models for steel continuous casting, demonstrating a clear ability to bridge scientific innovation with practical implementation.
Furthermore, the widespread use of advanced computational tools, coupled with strong industrial capability in adopting simulation-based decision-making, has strengthened Europe’s role as a global reference point for modelling-oriented process optimization. The integration of modelling with digital manufacturing and automation is expected to further increase the demand for specialized skills while reinforcing Europe’s competitiveness in the international steel sector.
Figure 1 shows a simplified geographic elaboration after mapping the most prominent competencies in steel casting and solidification modelling categorized by country.
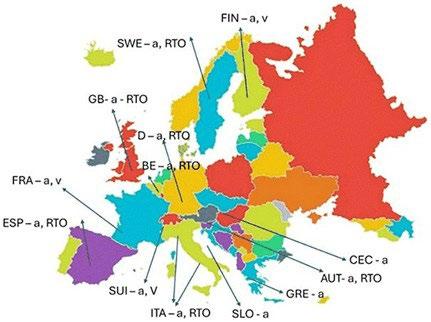
- Regional Patterns
Casting
within Europe. Legenda: a = academic frame; v = code developers; RTO = research centers.
This visual overview highlights the regional distribution of specialized expertise across Europe and beyond. In recent years, there has been a noticeable pivot from foundational research toward the deployment of models in industrial practice. Europe currently stands at the forefront of global expertise in this domain, facilitating a shift from theoretical exploration to applied problem-solving and operational enhancement, also supported strongly by EU funding programmes such as the Research Fund for Coal and Steel (RFCS).
As examples of cutting-edge simulations and European leadership, multi-physics coupling—turbulent mold flow (RANS/LES), heat transfer, solidification and thermo-mechanical stress—has matured into workflows that track defect precursors such as strain localization near corners and the mechanisms of oscillation-mark formation, while also resolving mushy-zone transport (Darcy law), inclusion flotation and steel–slag interactions under electromagnetic stirring (EMS). These capabilities, developed and disseminated through EU-funded activities and expert centres1, have moved beyond single-physics models to actionable tools for powder practice, taper and EMS set-point optimization [3, 6].
Moreover, Europe has pushed research-grade models into plant service via industrial digital twins. These environments connect CFD/solidification/thermo-mechanical solvers with real-time measurements to support casting-speed tuning, breakout-risk mitigation and defect prediction; they explicitly account for argon injection, curved casters, taper & friction, oscillation kinematics and EMS/brake fields, enabling fast what-if analyses aligned with production schedules [4,6].
Most challenging aspects to model. Despite the progress, several topics remain inherently difficult and are active focuses of European work: (i) crack prediction (surface/subsurface/corner), which demands accurate high-temperature material laws, contact/friction in the mold and tightly coupled thermo-mechanical–flow solvers; (ii) oscillation marks, slag infiltration and rim build-up, which require coupling transient level fluctuations, slag rheology/solidification and mold heat-flux reconstruction; (iii) argon-laden, turbulent mold flow under EMS, where two-phase clo-
sures and electromagnetic body forces must be validated against plant measurements; and (iv) macrosegregation driven by mushy-zone permeability, shrinkage/feeding and columnar–equiaxed transitions, often addressed with CA/phase-field couplings. Progress on these fronts is documented in European-led studies and remains central to industrial defect control (examples on [3, 4, 5]).
An overview has been presented of the research and development activities related to continuous casting modelling worldwide and across Europe. Europe currently stands at the forefront of global expertise in this domain, facilitating a shift from theoretical exploration to applied problem-solving and operational enhancement.
In recent years, there has been a noticeable pivot from foundational research toward the deployment of models in industrial practice. The EU funding programmes, e.g., the Research Fund for Coal and Steel (RFCS), have played a relevant role by contributing significantly to consolidating stakeholder involvement and promoting a modelling-oriented research culture.
The evolution of modelling applications has progressed from process enhancement to advanced control and, more recently, to real-time monitoring and automation. Furthermore, the integration of modelling with digital technologies is expected to drive demand for a more highly skilled workforce. In this context, the precision in simulating physical phenomena and the deepening of process knowledge have become increasingly crucial, underpinning the reliability of advanced modelling tools, supporting efficient production management, and strengthening the global competitiveness of European actors in the steel sector.
This study was carried out with a financial grant from the Research Fund for Coal and Steel of the European Community. The authors would like to thank the EU for supporting the ongoing METACAST project (contract number 101155952) for disseminating the main outcomes in the field of casting modelling.
1 E.g., those involved in the METACAST project (SWERIM, BFI, K1-MET, RINA-CSM, SIDENOR)
[1] https://www.seaisi.org/publications;
[2] Valorisation and dissemination of RFCS projects results and experience in steel surface quality (VALCRA). n. 847194, 2019-2020
[3] P. E. Ramirez-Lopez, “Modelling of Continuous Casting of Steel: from virtual calculations to industrial reality”, VALCRA Seminar, 2020. Available: https://www.valcra.eu/wp-content/uploads/2020/07/VALCRA-Modelling-of-Continuous-casting-of-steel-SEMINAR25june2020.pdf
[4] P. E. Ramirez-Lopez, “Digital Twin for Continuous Casting Modelling”, VALCRA Webinar slides, 2020. Available: https://www.valcra. eu/wp-content/uploads/2020/10/VALCRA-Modelling-Webinar-Sep-30th-Pavel-talk2-Digitial-Twin-Continuous-Caster-FINAL.pdf
[5] B. G. Thomas, “Modeling of Continuous Casting”, Chapter 5, University of Illinois, 2003. Available: https://ccc.illinois.edu/PDF%20 Files/Publications/03_AISE_Model_Ch5.pdf
[6] S. Challapalli, L. Busolini, A. Polo, M. Ometto, “Modernization of Continuous Casting Machines in the Era of Intelligent Manufacturing”, AIST Digital Transformations column, 2019. Available: https://www.aist.org/AIST/aist/AIST/Publications/Digital%20 Transformations/19-july-digital-transformations.pdf
[7] J. Yang, Z. Ji, W. Liu, Z. Xie, “Digital-Twin-Based Coordinated Optimal Control for Steel Continuous Casting Process”. Metals, 2023, 13(4), 816. https://doi.org/10.3390/met13040816
[8] Y. Fei, N. Gregurich, K. Toth, L. Yakovleva, A. Zafar, C. Zhou, “Enhanced Digital Twin Solution for Con-tinuous Casting”, AISTech 2022 Proceedings of the Iron and Steel Technology Conference, 1333-1340. 10.33313/386/153.
[9] P. Biswas, A. Kumar, “Optimization and simulation of continuous casting process for production of stain-less steel by using Ansys CFD”, AIP Conf. Proc. 3111, 040008, 2024. https://doi.org/10.1063/5.0221474
[10] https://www.seaisi.org/
[11] A. Gastón, G. Sánchez Sarmiento, J. S. Sylvestre Begnis, “Thermal analysis of a continuous casting tundish by an integrated fem code”, Latin American applied research, 2008. 38(3), 259-266.
[12] J. R. de Sousa Rochaa, E. E. Barros de Souza, F. Marcondes, J. A. de Castro, “Modeling and compu-tational simulation of fluid flow, heat transfer and inclusions trajectories in a tundish of a steel continuous casting machine,” J. Mater. Res. Techn., 2019;8 (5):4209–4220
V. Colla, I. Matino, O. Toscanelli, A. Soto Larzabal, A. Zubero Lombardia, T. Rodriguez Duran, J. Orre, E. Sandberg, M. Lundgren, M. Magnelov, D. Muren, P. Kwaschny, A. Zaccara
The achievement of C-lean and sustainable steelmaking processes is one of the challenges of the European Green Deal to target the climate neutrality by 2050. In this context, electric steelmaking is investigating alternatives to improve the sustainability of its production routes. The use of alternative carbon-bearing materials in electric arc furnaces and the replacement of natural gas with green hydrogen in related burners are two promising solutions. However, investigations are fundamental to assessing the viability of different technological solutions and their possible combination by avoiding unexpected process and product issues. Therefore, next to industrial trials, simulations are important to broaden the investigation, as they enable exploration of process configurations and the use of materials that are also quite far from conventional practices and that cannot be directly investigated through experiments for economic and practical constraints, such as material unavailability and high costs. The contribution focuses on the results of pilot trials and simulations done with an updated flowsheet model of the electric steelmaking route.
KEYWORDS: ELECTRIC STEELMAKING, ALTERNATIVE CARBON BEARING MATERIALS, HYDROGEN, EAF BURNERS, SUSTAINABILITY, MODELLING AND SIMULATION, PILOT TRIALS;
The European steel sector is challenged by the ambitious objectives of the European Green Deal, which aims at achieving climate neutrality by 2050. Therefore, novel C-lean and sustainable steelmaking processes are being investigated through large-scale pilot projects, accompanied by studies on the possibility of improving operating practices and introducing new components in conventional routes. Moreover, Circular Economy and Industrial Symbiosis can further support the decarbonization process [1, 2] while reducing depletion of natural resources. As far as the electric steelmaking route is concerned, many recent investigations focus on the replacement of fossil carbon-bearing materials fed to the Electric Arc Furnace (EAF) with renewable and/or Alternative Carbon-bearing Materials (ACMs) [3] from biogenic [4] and non-biogenic sources [5, 6]. Moreover, the use of green hydrogen to at least partially substitute Natural Gas (NG) in the EAF for heating purposes is intensively investigated [7,8].
Valentina Colla, Ismael Matino, Orlando Toscanelli
Scuola Superiore Sant’Anna, TeCIP Institute, Pisa, Italy
Antonella Zaccara
Scuola Superiore Sant’Anna, Pisa, Italy / Università di Padova, Padova, Italy
Aintzane Soto Larzabal, Asier Zubero Lombardia
Sidenor Aceros Especiales, Basauri, Bizkaia, Spain
Tamara Rodriguez Duran
Sidenor I+D, Basauri, Bizkaia, Spain
Joel Orre, Erik Sandberg, Maria Lundgren, Marianne Magnelov
Swerim AB, Lulea, Sweden
David Muren, Pascal Kwaschny
Linde Sverige AB, Sweden
In this context the project entitled “Gradual Integration of Renewable non-fossil energy sources and modular heating technologies in EAF for progressive CO2 decrease” (Ref. GreenHeatEAF – G.A. No. 101092328) aims at exploring and validating these decarbonization strategies through the integrated and synergistic use of pilot and demonstration trials, advanced digital simulations, and enhanced monitoring and control systems. In effects, while pilot trials are indeed fundamental to thoroughly assessing the industrial feasibility of the investigated substantial modifications in process operations [9, 10], they are costly and time-consuming, thus they cannot span the full range of possible process conditions of interest and possible input material mix and/or Hydrogen/NG blends.
On the other hand, simulations through a validated physics-based model, although based on a virtual replica of the EAF which relies on assumptions and simplifications, enable exploring a wide range of scenarios and make detailed sensitivity analyses [11, 12]. Therefore, the combination of these two investigation approaches provides an ideal insight into the viability of potential modifications of consolidated industrial practices.
Within GreenHeatEAF, industrial trials were conducted to identify ACMs with characteristics that are similar to standard fossil carbon that do not affect process reliability nor product quality. The industrial tests also aimed to evaluate the handling characteristics and safety implications of using ACMs in EAF-based steel production. Pilot trials were conducted in a pilot EAF with a capacity of 10 tons [13] to assess both the effect of transition from NG to hydrogen as fuel in the burners and the effect of transition from fossil carbon to biochar. Simulations were carried out via a stationary flowsheet model of the EAF-based steelmaking route, which was updated to simulate the addition of pyrolyzed biomass, i.e. bio-carbon/biochar, plastic and tires in the EAF and the feeding of the EAF burners with hydrogen or NG/hydrogen blends [14].
This paper presents the methodology adopted for pilot trials and simulations, and overviews the most relevant results of both investigations, by highlighting the opportunities and barriers.
Pilot trials were conducted to evaluate both the effect of transition from NG to hydrogen as fuel in the burners and the effect of transition from fossil carbon to bio-carbon.
The use of alternative fuels and carbon sources was tested in a pilot EAF available at Swerim’s facilities in Lulea (Sweden), which has a capacity of 10 tons and was equipped with a CoJet-burner manufactured by Linde for these trials. The fundamental principle underlying CoJet technology is the use of an annular oxy-fuel flame shroud that envelops the primary supersonic jet, thereby generating a coherent jet capable of penetrating more deeply into the molten bath compared to a conventional supersonic jet [15]. The use of this type of burner is well established in EAF operations; however, the novelty of the present trials lies in feeding a suitably adapted CoJet burner with hydrogen over extended periods that was not previously investigated. The injected hydrogen is produced in the same experimental facility thanks to Swerim’s high-pressure alkaline electrolyzer.
The carbon was injected in the pilot EAF via a pressurized carbon dispenser equipped with a roto-feeder and a supersonic wall-mounted carbon injector manufacture by Tallman Technologies using nitrogen as carrier gas. During the tests, carbon was also available for feeding from via the overhead bin. As emerged from previous experiments, the injectable particle size of the carbon material must not exceed 3 mm, and the moisture content must be lower than 5% to minimize the risk of clogging. In addition, the ash and volatile matter contents should be low to achieve a high fixed carbon content and to prevent adverse effects on the process. Based on this experience, the trials concerned:
1. Injection of bio-carbon to investigate the difference on slag foaming and slag reduction. Anthracite was used as reference carbon source.
2. Hydrogen use with Linde CoJet-burner by using Synthetic NG (SNG) as reference burner fuel.
Considering the ongoing transition of steel production towards more sustainable processes—characterised by the increasing use of Hot Briquetted Iron (HBI) and Direct
Reduced Iron (DRI), together with higher degree of continuous feeding—various iron carriers and charge mixes were employed in the tests to reflect expected variability of future EAF steelmaking operations, as follows:
1. Scrap charging with two-basket practice and carbon injection during the refining phase.
2. Scrap+HBI charging with one-basket practice and subsequent HBI feeding, and carbon injection during the HBI feeding phase and the refining phase.
3. Continuous scrap feeding and carbon injection used during the entire process.
4. Continuous DRI feeding, and carbon injection used during the entire process.
During the trials, anthracite was used as charge carbon in both the scrap and HBI charging campaigns. The experimental campaign comprised of 25 heats.
For each iron carrier and its corresponding process configuration, the following trial blocks were defined:
1. SNG-Anthracite, reference trials using SNG as burner fuel and anthracite as injected carbon.
2. H2-Antrhacite using hydrogen as burner fuel and anthracite as injected carbon.
3. H2-Biocarbon using hydrogen as burner fuel and biobased carbon as injected carbon.
The described experimental design enables the assessment of the impact of substituting NG with hydrogen as burner fuel through the comparison of H2- Anthracite with SNG-Anthracite and the evaluation of the effect of replacing fossil carbon with bio-carbon comparing H2-Biocarbon with H2-Anthracite.
The bio-carbon selected for the trials is wood-based charcoal with high carbon content, which is similar to fossil anthracite. Bio-carbon has lower density, volatile matter and ash content as Sulphur, see table 1, which provides the chemical composition (in wt%) of the adopted materials for injection. Photographic images of the bio-carbon and anthracite for injection are provided in figure 1.
Anthracite, 0-3 mm, as injection carbon. Supplier Carbomax
Bio-carbon, 0-3 mm, as injection carbon. Supplier Envigas
The model used for the simulations is developed in Aspen Plus® V11 and allows simulation of all the common steps of standard electric scrap-based steelmaking route from charging mix preparation to continuous casting through the combination of standard process blocks, customized calculators, and design specification units [11, 12]. The modular modelling framework considers key physical and chemical phenomena in the EAF process. It estimates molten steel quantity, temperature, and composition at different stages, as well as slag characteristics, electricity demand, and overall mass and energy balances. Since the model is based on input parameters and tuning data that are regularly measured in industrial practice, it can be easily calibrated, validated, and adapted across different steel plants and steel grades. Its modular structure also enables targeted modifications, as in this work to evaluate the replacement of fossil carbon in slag foaming and the substitution of natural gas in EAF burner operations.
For the planned investigations, alternative carbon-bearing materials were modelled as non-conventional solids starting from suppliers’ data. Furthermore, related streams and new unit blocks were added to the original version of the model, and some were modified to allow the use of these materials and simulate their effects. Literature and industrial data—coming from plant standard operations and collected during field trials—were used for the scope. In particular, literature data [16–18] together with industrial results from an initial set of field trials—focused on replacing the quantity of anthracite added to an industrial EAF through the 5th hole for slag foaming—were used to tune the model. The calibrated model was then tested against industrial data not used during the tuning phase. The tuning and validation procedures, as well as the test results, are deeply described in [14]. For instance, the relative percentage error ranges of the tests—i.e., (simulated value-actual value)/(actual value) %—for tapped steel amount is between 5.22% and 9.95%.
Similarly, considering literature data, new streams and unit blocks were included in the model for allowing the use of hydrogen (or blend with NG) in EAF burners and consider related effects. Specifically, it was necessary to add design specification blocks to manage gas flows to ensure the same energy input regardless of the gas mixtures used.
The adapted flowsheet model was used to perform scenario analyses aimed at assessing the effects of using alternative carbon-bearing materials and/or hydrogen on both process performance and key product characteristics (e.g. composition).
1. Alternative carbon-sources: the simulations allowed to include effects not considered in industrial trials (e.g., electricity demand, fossil CO2 emissions, steel composition, slag mass quantity) and to test a greater number of alternative materials, thereby complementing pilot and industrial tests, which focused mainly on foaming performance and safety issues, aspects not considered in the simulations. Specifically, simulations permit to evaluate the impact of replacing only the anthracite charged through the 5th hole of the EAF for starting the slag foaming—which represents less than 15% of the total fossil carbon input— while ensuring a fixed carbon input or energy supply, as well as the effect of the replacement of the entire amount of carbon needed for slag foaming (anthracite + foaming coal). In addition, sensitivity analyses are performed to evaluate the effect of the contents of different biochar compounds.
2. H2 usage as burner fuel: the simulations examine the gradual substitution of NG used under standard operating conditions with H2, while maintaining an equivalent total energy input to the EAF. Key process indicators—including EAF off-gas composition, steel chemistry, and relevant operational parameters (e.g., electrical energy demand, slag quantity, and slag composition)—are systematically monitored. Furthermore, the simulations encompass the entire secondary metallurgy to evaluate whether the current Vacuum Degassing (VD) practice is adequate to mitigate potential adverse effects on tapped steel quality, particularly those associated with increased hydrogen content.
of the pilot trials
The results from the trials were evaluated with respect to yield of injected carbon, slag foaming quality, steel chemistry, slag chemistry and dust and off-gas generation. Figure 2 shows the total carbon yield for each heat. The
carbon yield is calculated using output from the HSC model described by J. Orre et al [19]. The average carbon yield is 53% for anthracite (excluding the heat with negative carbon yield) and 42% for the investigated biocarbon. This is equivalent to a replacement factor of 1.25 for car-
bon in anthracite with carbon in the investigated bio-carbon, i.e. 25% more carbon atoms are needed for bio-carbon injection.
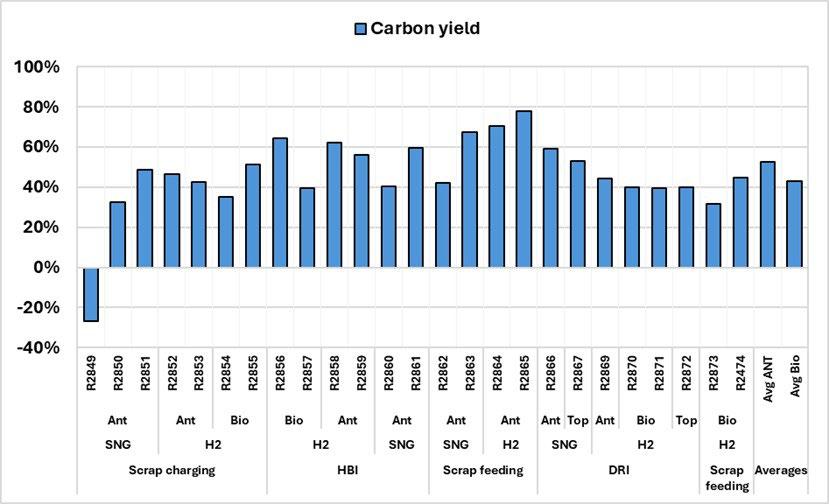
Fig.2 - Carbon yield to slag reduction.
The slag foaming was assessed by visual inspection when the slag door of the EAF was opened for sampling. The following classification of the slag foaming performance was adopted:
1. bad, if the arcs are clearly visible in the furnace;
2. OK, if the arcs in the furnace are not visible and the slag is not at the level of the slag door when the furnace is in horizontal position;
3. good, if the arcs in the furnace are not visible and the
slag is at the level of the slag door when the furnace is in horizontal position or inclined towards the steel tapping side.
Table 2 reports the average values of qualitative results of slag foaming assessment for the three trial blocks described before under different process conditions. The inspection showed that the foaming is good and equivalent for all the different CoJet fuels and injected carbon sources
Metal and slag chemical composition was assessed during the trials (see figure 3), and the results showed that no significant effects were observed on steel and slag chemical
compositions in relation to use of hydrogen. However, the FeO content of the slag was generally higher for the bio-carbon heats (34% compared to 28% for the anthracite
heats). Consequently, the iron losses to slag (and removal of oxidizable impurity elements as Mn and Cr to slag) were higher for the bio-carbon heats. The Sulphur content of
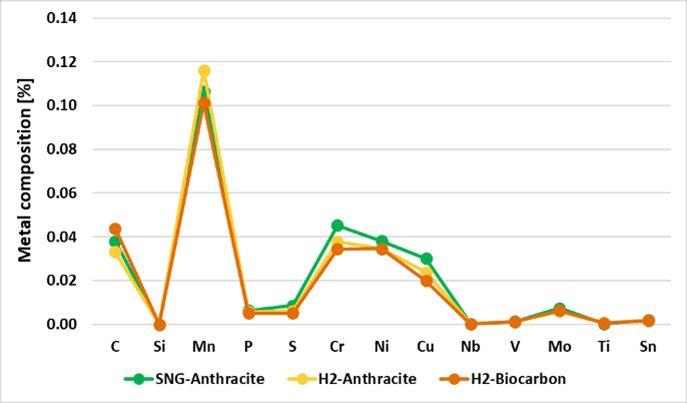
the steel was also slightly lower for the bio-carbon heats, which can be explained by the lower Sulphur content of the bio-carbon than the anthracite (see table 1).
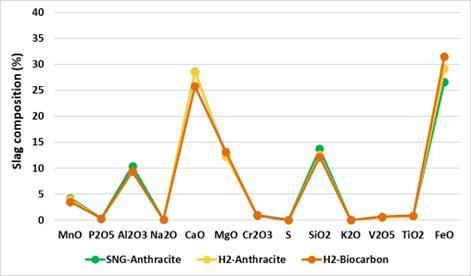
- Chemical compositions (wt%) of a) Average tapped metal; b) Average EAF slag.
Also, it is important to mention that the impact of hydrogen on the metal composition cannot be evaluated since the content of hydrogen was not measured in the melted metal. This aspect was therefore investigated by simulations, as showed in section “Results of the simulations”. The EAF-gas composition in terms of volume percent of CO, CO2, O2 and H2 was continuously measured during the trial campaign. Figure 4a compares tests with H2 as fuel with SNG, while figure 4b shows the average EAF
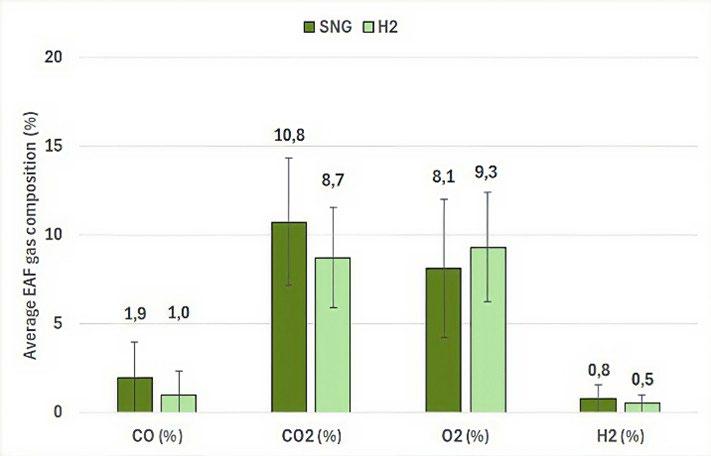
gas composition for the different burner fuels and the different carbon sources. The average gas composition in burner mode was calculated using data from periods when the burner was operating during the scrap charging trials and the HBI feeding trials. Figure 4 shows that using H2 instead of NG as fuel has a positive effect in terms of CO2 emission reduction, while no significant difference was observed on EAF-gas composition between anthracite and bio-carbon.
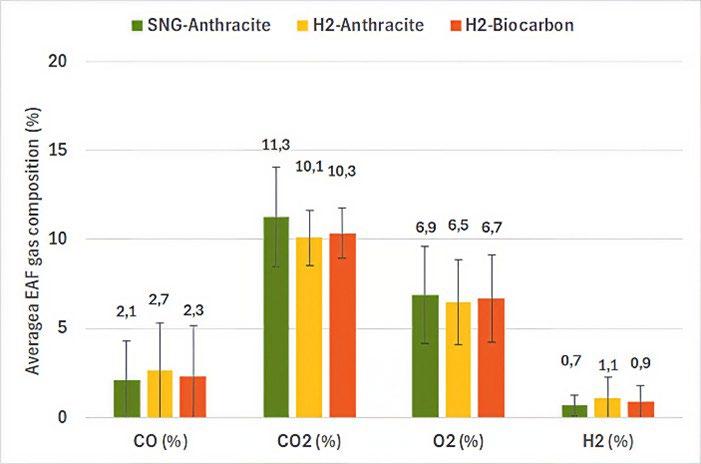
Finally, possible differences in dusts compositions were assessed. During the trials, the weight of off-gas dust, collected in barrels after the bag house filter, were recorded for each heat. Furthermore, the chemical composition of the collected dust samples was analysed. Although the
variations in dust chemistry and amount were quite high during the tests due to variations in zinc and alkali contents of the charge materials, the difference in dust chemistry for use of bio-carbon and anthracite were insignificant.
Results of the simulations
Table 3 summarises the results of the two main simulated scenarios. Concerning the effects of the use of alternative carbon-sources as foaming materials, the variations of the following monitored variables have been included in the table: EAF specific electrical energy consumptions, specific CO2 emissions and slag, and contents of C and S in tapped steel. The use of H2 in EAF burners is assessed,
among others, by monitoring the content of H2 in liquid steel during tapping and after VD, to complement pilot and industrial trials that do not monitor this aspect. The results are reported in terms of range of variation with respect to reference conditions, considering the whole explored range, and all the simulated heats and considered materials.
- Overview of the results of the simulations.
1. Alternative C-sources
Replacement of fossil carbon used for slag foaming process with alternative carbon-bearing materials
Use of fossil carbon in slag foaming process (anthracite for starting + foaming coal)
2. H2 usage as burner fuel Gradual replacement of NG with H2 in EAF burners (step of 10% of NG energetic contribution)
Full NG use in EAF burners
In scenario 1, the high values of electricity consumption reductions are connected to the use of tires at fixed carbon fed, while the increases of required electric energy are generally related to the full replacement of fossil carbon with biochar. They depend on the lower Higher Heating Value (HHV) of almost all the considered biochars compared to reference anthracite and to their moisture content. However, the extent of such increase depends on the produced steel family (i.e. group of similar steel grades) and related operating practices. Obviously, higher fossil CO2 reductions are achieved when global replacement of fossil carbon compared to replacement of anthracite only. Moreover, higher decreases in slag amount refer to full replacement of fossil carbon, while slight increase of slag amount has been observed with biochars having higher carbon content. Finally, a reduction in carbon content is obtained by using tires in simulation at fixed supplied energy, and high Sulphur content reductions refer
to full replacement of fossil carbon with biochar, while Sulphur content increases if tires are used. As anticipated, full fossil carbon replacement yields the most significant variations. Figure 5 depicts the specific results of some simulations where fossil carbon is entirely replaced by one of the considered biochar (80% wt. of fixed C and 7.4 kWh/kg of HHV), while ensuring the same fed carbon as the reference case. The results shown relate to four simulated heats belonging to different steel families; they are reported in terms of variations of the variables considered in table 3 with respect to the reference heat. It can be observed that, although similar trends, the extent of the obtained variations in monitored variables depends on the produced steel family and consequently on operating conditions used in related productions.
In scenario 2 an increase of H2 content in tapped steel is observed in all simulations. Besides the values reported in table 3, a typical obtained trend is depicted in the illus-
trative figure 6, where an example is shown of the extent of H2 variations in steel in case of gradual replacement of NG in EAF burners. Specifically, with full replacement of NG in EAF burners, hydrogen content in tapped steel, while remaining within the ppm range, more than doubles compared to the reference heats where only NG is fed to
EAF burners. However, simulations also show that this increase does not affect the final product, as it can be handled by current VD procedures, that are always capable of ensuring that the required specification is met in obtained steel.
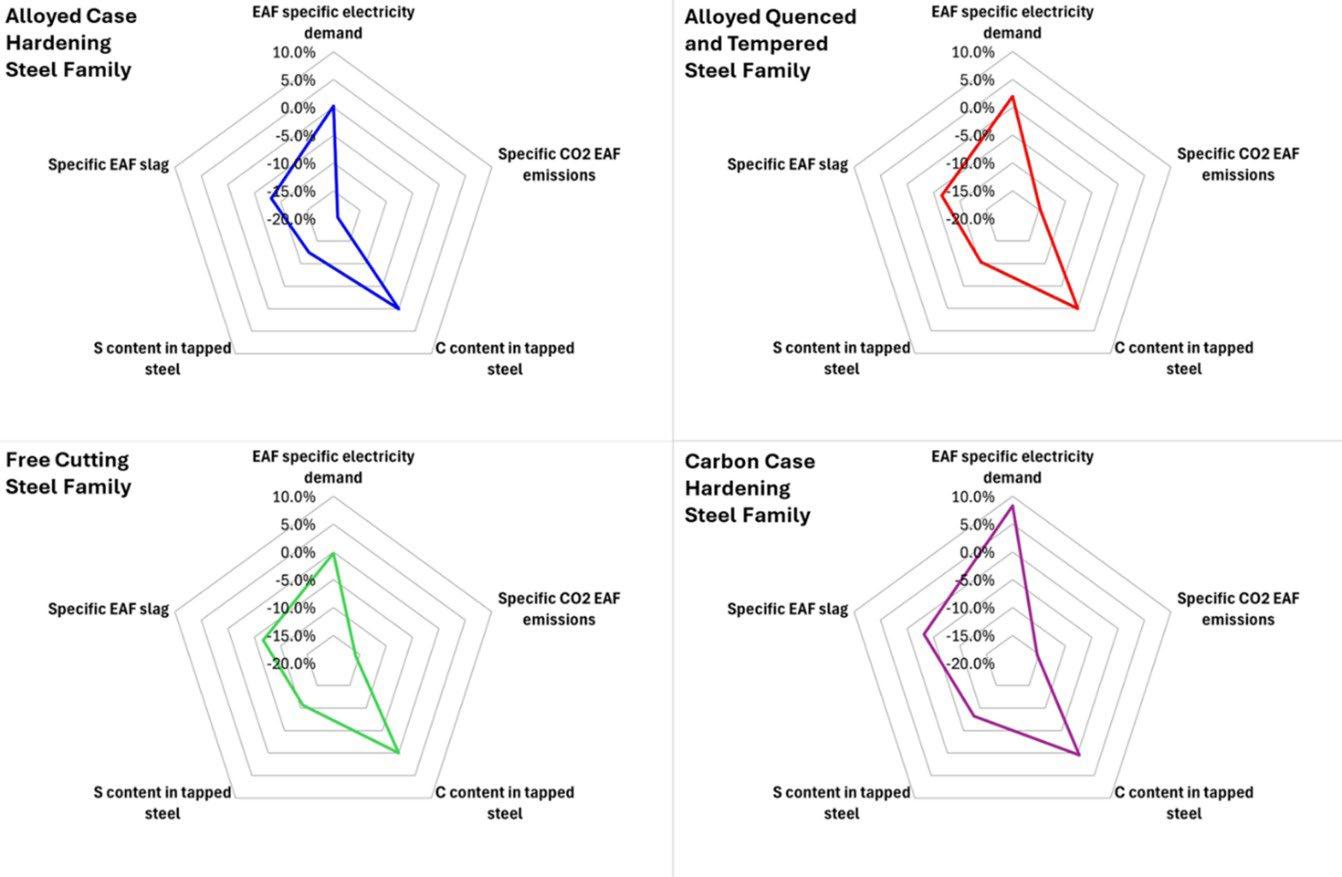
Fig.5 - Examples of results obtained during simulations of heats belonging to different steel families and aimed at full replacement of fossil carbon with biochar.
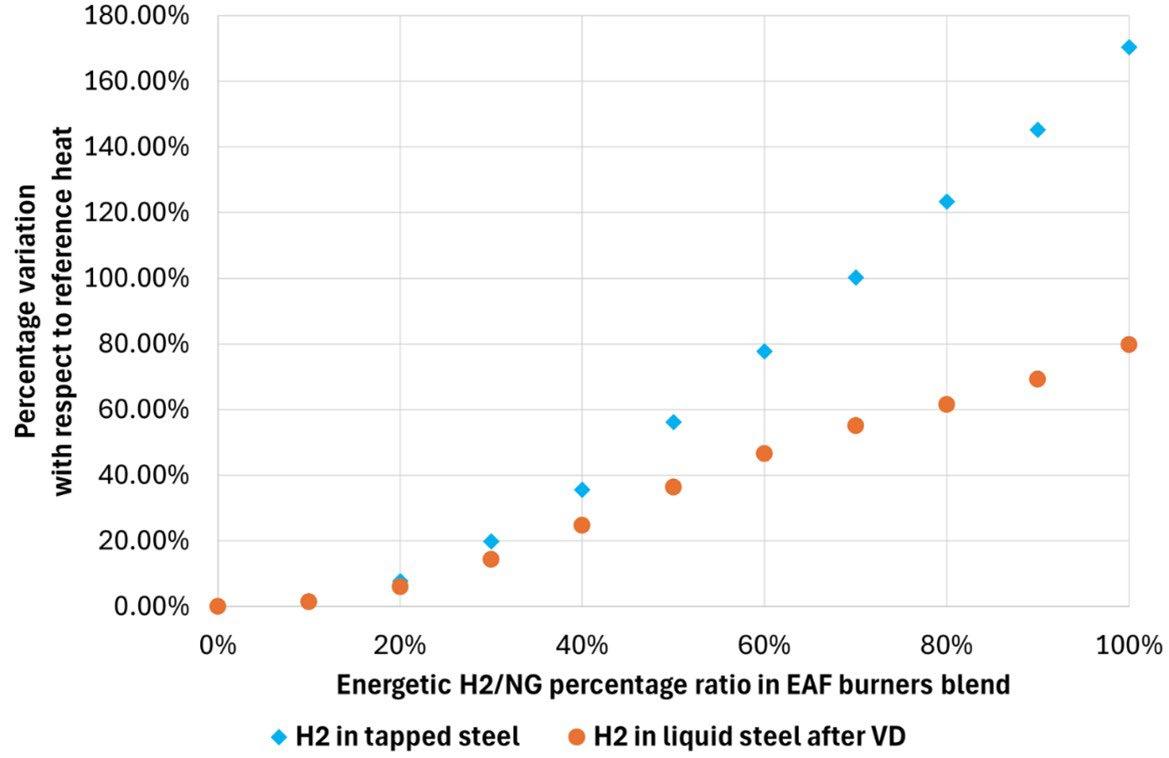
Fig.6 - Example of variations of hydrogen in steel obtained in simulations of the gradual NG replacement with H2 in EAF burners.
The pilot trials in Swerim’s EAF were conducted successfully and the following conclusions can be drawn.
1. In the pilot trials carbon in fossil anthracite was replaced by carbon in bio-carbon with a replacement ratio of 1.25, providing the following outcomes.
• The slag foaming was mostly good, and no significant difference arises between trials with injection of anthracite and biocarbon.
• The use of bio-carbon led to a decrease in Sulphur content in slag and metal due to lower Sulphur input compared to anthracite.
• No significant difference arose on the composition of EAF off-gas and dust between trials with injection of anthracite and the investigated bio-carbon. No substantial difference was expected since the contents of carbon and Hydrogen are similar, although bio-carbon has slightly higher Hydrogen content.
• Some further process optimization considering the total carbon and Oxygen input to the furnace may be investigated. For example, reduced oxygen injection could reduce the need for bio-carbon for slag reduction without negative effects on the slag foaming or FeO content due to higher gas generation per carbon atom provided by the biocarbon than the anthracite.
• The reasons for the lower yield of carbon in bio-carbon (42%) compared to anthracite (53%) may be further investigated. Factors likely to contribute to the lower carbon yield of bio-carbon are material properties like higher volatile content, lower density and smaller particle size.
• Adaption of production methods for improving bio-carbon properties for use with standard injection systems at EAF steel plants, or adaption of standard injection systems for use of bio-carbon could improve the carbon yield and reduce the replacement ratio for bio-carbon.
2. H2 was used with a 1:1 energy replacement ratio between SNG and H2 [19]
• There were no significant measured differences on steel, slag, dust and off-gas composition. However, simulation indicated significant higher H-content in the steel when using hydrogen injection.
• Further investigation of the actual Hydrogen con-
tent in crude steel when using hydrogen injection and its effect on the final steel quality is of interest for future work.
• It is confirmed that CO2 emissions are higher in SNG-based heats compared to H2-heats.
The simulations investigated substitutes of fossil carbon with similar or lower characteristics of used anthracite; generally, they do not provide negative effects on process and product. Also, the replacement of the entire amount of foaming carbon (anthracite through the 5th hole + foaming coal) does not affect negatively the process performance or the quality of the liquid steel. In general, substituting fossil carbon in the foaming process with various types of alternative carbon-bearing materials can lower CO2 emissions. The carbon and sulfur contents in tapped steel rise in proportion to their respective concentrations in the considered alternative carbon-bearing materials. In addition, electric energy demand increases with higher moisture contents and is also influenced by volatile matter content and HHV.
To sum up, the combination of pilot trials and simulation highlights that no major negative effects on the product are observed from the use of alternative C-bearing material, independently of the way they are introduced in the furnace. However, further parallel real industrial trials showed that an excessive amount of some of these materials may jeopardize operational safety and leads to poor slag foaming. Furthermore, it is possible to confirm that hydrogen can be used as burner fuels with benefit in terms of CO2 emissions. Large quantities of hydrogen fuel result in an increase of hydrogen content in liquid steel but standard VD operating practices appear adequate to mitigate this effect leading to a final hydrogen content meeting the given specifications for each considered steel family.
The work described in the present paper has been developed within the project entitled “Gradual Integration of Renewable non-fossil energy sources and modular heating technologies in EAF for progressive CO2 decrease” (GreenHeatEAF – G.A. No. 101092328) that has received funding from the European Union through the Horizon Europe programme, which is gratefully acknowledged. The sole responsibility for the issues treated in the present paper lies with the authors; the Commission is not responsible for any use that may be made of the information contained therein.
[1] European Commission, “Circular Economy Action Plan”, accessed 15 January 2026, https://environment.ec.europa.eu/strategy/ circular-economy-action-plan_en
[2] V. Colla, T.A. Branca, R. Pietruck, S. Wölfelschneider, A. Morillon, D. Algermissen, S. Rosendhal, H. Granbom, U. Martini, D. Snaet, “Future Research and Developments on Reuse and Recycling of Steelmaking By-Products,” Metals, 2023, vol. 13, no. 4., art. 676. https://doi.org/10.3390/met13040676
[3] T. Echterhof, “Review on the use of alternative carbon sources in EAF steelmaking”. Metals, 2021, vol. 11, no. 2, art. 222. https://doi/ org/10.3390/met11020222
[4] A. Cardarelli, M. Barbanera, “Substitution of Fossil Coal with Hydrochar from Agricultural Waste in the Electric Arc Furnace Steel Industry: A Comprehensive Life Cycle Analysis,” Energies, 2023, vol. 16, No. 15, art. 5686. https://doi.org/10.3390/en16155686
[5] M. Bissoli, E. Malfa, E. Marchesan, L. Di Sante, M. Casa, P. Frittella, L. Salas, “Multi-material injection system to foster circularity: Valorization of recycled polymers from waste plastics in electric arc furnace,” Thermal Science and Engineering Progress 2025, vol. 61, https://doi.org/10.1016/j.tsep.2025.103497
[6] F. Cirilli, M. De Santis, L. Di Sante, D. Mirabile, L. Kieush, J. Rieger, J. Borlée, C. Brondi, D. Rov-elli, T. Echterhof, C. Thaler, N. Jaeger, K. Peters,·D. Snaet, V. Colla, I. Matino, M. Bissoli, E. Malfa, S. Möhring, G. Stubbe, R. Attrotto, A. Sorino, G.B. Landra, M. Bianchi, L. Bianco,·M. Chini, D. Gaspardo: “A Comprehensive Review of Secondary Carbon Carriers for Ironmaking and Steelmaking Processes: Industrial Utilization of Non-biogenic Materials in Steel Production,” Journal of Sustainable Metallurgy, 2025, vol. 11, no. 4, p. 3343, https://doi.org/10.1007/s40831-025-01149-5
[7] J. von Schéele, “Pathways towards full use of hydrogen as reductant and fuel,” Matériaux & Techniques, 2023, vol. 111 no. 4, art. 405. https://doi.org/10.1051/mattech/2023030
[8] M. Mostafa, A. Ashabi, A. Hryshcenko, I. O’callaghan, K. Bruton, D.T.J.O. Sullivan, “Green Hydrogen Penetration in Steel Industry Operations: A Year-long Modeling Case Study,” 6th International Conference on Environmental Sciences and Renewable EnergyESRE 2024, p. 566. https://doi.org/10.1051/e3sconf/202456603003
[9] C. Wang, Y.C. Lu, L. Brabie, G. Wang, “A Pilot Trial Investigation of Using Hydrochar Derived from Biomass Residues for EAF Process,” Minerals, Metals and Materials Series 2023, p. 153. https://doi.org/10.1007/978-3-031-22634-2_15
[10] F. Cirilli, G. Baracchini, L. Bianco, “EAF long term industrial trials of utilization of char from biomass as fossil coal substitute,” La Metallurgia Italiana 2017, vol. 109, no. 2, p. 13.
[11] I. Matino, E. Alcamisi, V. Colla, S. Baragiola, P. Moni, “Process modelling and simulation of electric arc furnace steelmaking to allow prognostic evaluations of process environmental and energy impacts,” Matériaux & Techniques, 2016, vol. 104, no. 1, art. 104. https:// doi.org/10.1051/mattech/2016004
[12] I. Matino, A. Petrucciani, A. Zaccara, V. Colla, M. Ferrer Prieto, R. Arias Pérez, “Characterization of EAF and LF Slags Through an Upgraded Stationary Flowsheet Model of the Electric Steelmaking Route,” Metals, 2025, vol. 15, no. 3, art. 279. https://doi. org/10.3390/met15030279
[13] I. Heintz, E. Mousa, G. Ye, “Development of Fossil-Free Technologies for the Metallurgical Industry—Swerim Pilot and Industrial Experiences,” Minerals, Metals and Materials Series 2023, p. 55. https://doi.org/10.1007/978-3-031-22634-2_5
[14] I. Matino, V. Colla, A. Petrucciani, A. Zaccara, O. Toscanelli, A. Soto Lazabal, A. Zubero Lombardia, “An advanced simulation tool to support adoption of alternative non-fossil carbon sources in electric steelworks,” Materiaux et Techniques 2024, vol. 112, no. 5, art. 504. https://doi.org/10.1051/mattech/2024029
[15] W. Mahoney, A. Deneys, P. Mathur, S. Warty, “The Critical Role of Hydrogen in Linde’s Coherent Jet Technology,” AISTech - Iron and Steel Technology Conference Proceedings 2023, p. 566. https://doi.org/10.33313/387/065
[16] R. Robinson, L. Brabie, M. Pettersson, M. Amovic, and R. Ljunggren, “An empirical comparative study of renewable biochar and fossil carbon as carburizer in steelmaking. ISIJ International 2022, vol. 62 no. 12, p. 2522, https://doi.org/10.2355/isijinternational. ISIJINT-2020-135
[17] M. Mayyas, R. K. Nekouei, and V. Sahajwalla, “Valorization of lignin biomass as a carbon feedstock in steel industry: Iron oxide reduction, steel carburizing and slag foaming” Journal of Cleaner Production 2019, vol. 219, p. 971, https://doi.org/10.1016/j. jclepro.2019.02.114
[18] L. Kieush, J. Schenk, A. Koveria, G. Rantitsch, A. Hrubiak, and H. Hopfinger, “Utilization of renewable carbon in electric arc furnacebased steel production: comparative evaluation of properties of conventional and non-conventional carbon-bearing sources”, Metals 2023, vol. 13, no. 4, art. 722. https://doi.org/10.3390/met13040722
[19] J. Orre, E. Sandberg, M. Magnelöv, “Effects of H2 as energy source and biocarbon injection in EAF,” Proc. of the 7th European Steel Technology and Application Days ESTAD 2025, Verona (Italy), October 6-9, 2025 vol. 2, p. 173.
TORNA ALL'INDICE >
L. Angelini, P. Frittella, M. Bersani, V. Duro, C. Di Cecca, G. Badina, F. Fredi
In EAF steel production, the development is moving toward the direction to improve both the process management and the potential reuse of the residual materials, to reduce the environmental impact in terms of CO2 emissions and residual wastes to be treated.
Both necessities pass also through the management and monitoring of the slags coming from EAF process or from secondary metallurgical treatments considering slag is strictly connected with metallurgical processes occurring between steel and slags and is also the main quantity of materials to be recovered. Acciaierie di Calvisano (AdC), included in the line of special steels production of Feralpi Group, is improving slag management as way to improve the metallurgical treatments through application of sensors for slags and process monitoring, a process modelling approach and new control systems.
For this reason, it has been developed the project “iSlag” with a Consortium of other EU companies, co-funded by Research Fund for Coal and Steel. The main goal of this project is not only to improve capability of process monitoring, but also to develop the necessary Decision Support Tool, in order to manage the slags in a proper way as based on the previous concept of process management, including in particular new sensors and also process modelling.
KEYWORDS: STEEL TREATMENT, EAF, SLAG, MODELLING, STEELMAKING, PROCESS CONTROL, LF, SIMULATION;
In modern steel production it is important to have an integrated view of the production processes and plants, including performances optimization, maintenance conditions, and reduction of environmental impacts through reduction of residual wastes and CO2 emissions from the production.
In particular to consider the slags generated by the processed production of EAF and LF is a relevant point, including both evaluations regarding the process treatments optimization and the conditions of residual slags from production, as necessary to increase capability of slags recovery.
In fact, the proper slags conditions both in EAF and in LF are crucial to increase the efficiency of the metallurgical processes as dephosphorization, desulphurisation, decarburization, deoxidation, slag foaming and avoidance of refractories erosion.
For this reason, knowing the present status of the slags
Acciaierie
during the process and defining the proper target as slag conditions to be adopted during the treatments is a relevant point, in order to manage and to improve the production processes to make more efficient the metallurgical processes.
It is also fundamental to know the necessary target of the slags to be adopted for subsequent landfill or for the slags reuse and recovery.
The slag conditioning and the process management to obtain the proper slag conditions is a point affecting both the circularity of the sector and the processes performances.
For these scopes, a global approach has been adopted coupling in a single strategy/architecture new slag monitoring sensor, a new modelling approach and a control system to realize a Decision Support Tool-DST.
Architecture of the Global Approach
A general view of the global approach architecture is reported following with overall purposes as:
• supporting the process monitoring;
• correlating the slag conditions with the practices
adopted and technological phenomena occurring during the process;
• supporting process management suggesting evidences or actions to be promoted.
These actions have to be adopted for the whole steelmaking area meaning both EAF and LF processes of liquid steel production and considering the time-dependent evolution of the process in different steps.
The architecture of the DST system is flexible, aiming to provide operators with the following main features:
• on-line time trends of relevant process parameters which describe relevant technological aspects;
• a summary overview highlighting measurements or aspects of the process, which are relevant to the slags conditions coming from EAF and LF;
• flexibility and user-friendliness for the needs of the operators and process technologists.
For these reasons, the architecture depicted in figure 1 has been designed as basis of the project, which is composed of five main modules corresponding to the functionalities that can be used in different periods.
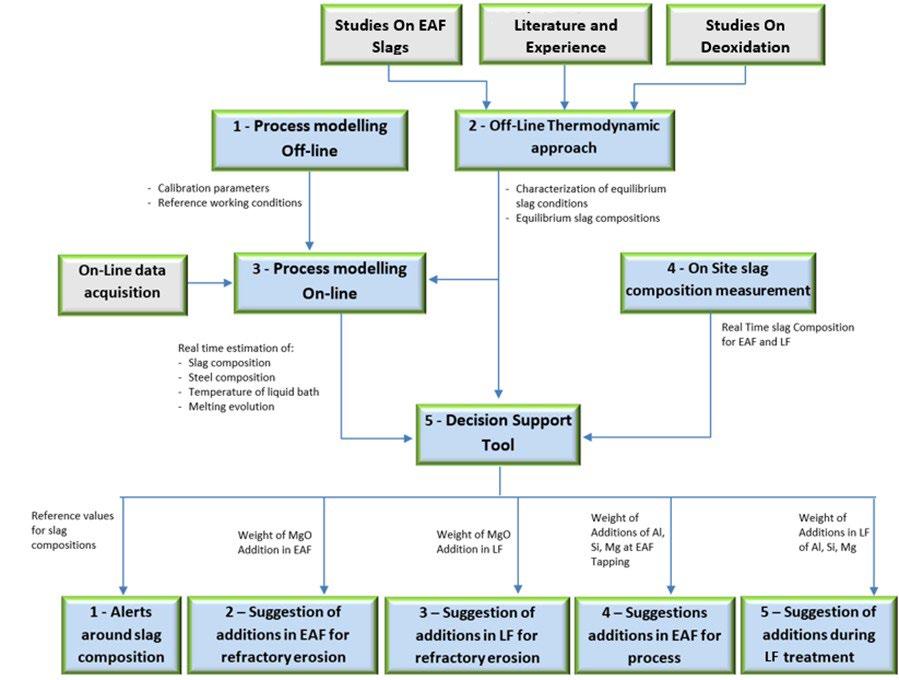
1. Off-line process modelling: it predicts the process results depending on the adopted operating practices.
2.Off-linethermodynamicapproach: it provides a deeper knowledge of slag conditions that are not available by simple on-line process modelling.
3. On-line process modelling: it makes available in real time a whole continuous representation of the processes and the associated technological parameters that are not measured.
4. On-site slag composition measurement: it provides the slag composition in real time during the process, with a measurement time that is low enough to enable process control or management.
5. Decision Support Tool: it provides indications for process adjustments.
These modules are working together in a flexible way with a modular architecture, being the data exchange between the modules flexible and managed depending on the specific application to be realized.
The off-line process modelling of the EAF process esti-
mates the effects on the main process parameters when modifying of some variation of operating practices. The final target is to improve the settings of new operating practices and to assess the reference values of slag compositions aimed at the EAF. In particular, the system allows the operator to visualise and monitor the time trend of a series of relevant EAF power supply parameters, weights, temperature and contents of the main chemical components of the EAF steel and slag composition. The off-line simulator of EAF process estimates the reference conditions in terms of process results and aimed slag compositions to be used as reference for subsequent evaluation of thermodynamic equilibrium and for the on-line system and the DST.
On the other hand, the off-line process modelling of steel treatment in LF predicts process results by variation of practices to improve the settings of new operating practices and to assess the reference values of slag compositions aimed in the secondary steel treatment. The system allows to visualize the time trend of relevant variables such as steel temperature after tapping from the EAF and LF slag composition.
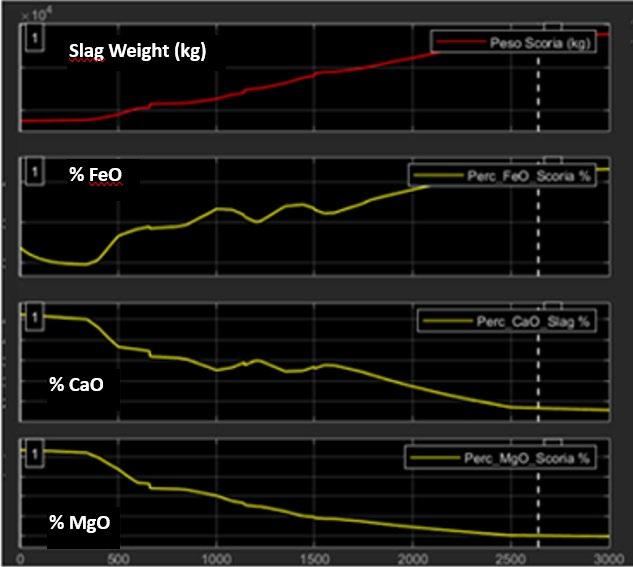
Thermodynamic equilibrium calculations have been realized by Rina-CSM by using the tool ThemoCalc. In partic-
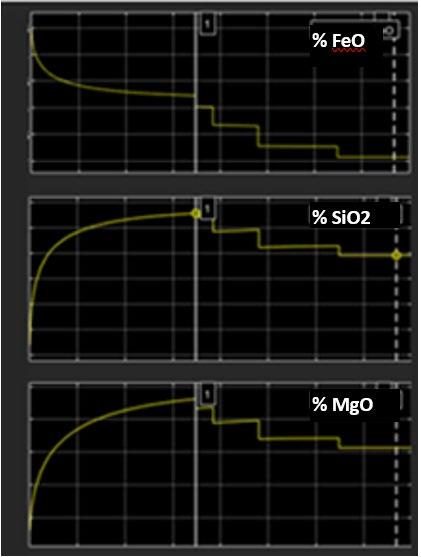
by the off-line model.
ular, considering the reference conditions of masses and reference slag composition measured, the equilibrium conditions that would be obtained in terms of slag com-
position and precipitate formations have been realised in different theoretical conditions.
In particular, the main investigations that have been carried out included:
• evaluation of saturation in terms of % MgO in slag;
• evaluation of precipitates formation (%).
Based on the results provided by the above-described investigations, mathematical rules were derived to describe the %MgO saturation in slag in different conditions and these rules were implemented in the subsequent module of on-line real-time process description and for providing the operators with suggestions on additions to be made during treatment. The knowledge of %MgO of saturation can be a reference condition for DSS to know the actions to be adopted to reach the MgO saturation in slag.
The EAF process model was applied on-line to AdC EAF, preliminary, as separated system with data exchange with onsite automation and, subsequently, as tool integrated into the on-line database available on-site. In this way the difficulties and time necessary for data exchange are strongly reduced, improving system maintenance and for data availability.
The on-line system includes:
• data acquisition;
• parameters calculation;
• results visualization in reference pages.
The models implemented within such system includes following estimations:
• mass and energy balance;
• dynamic energy balance with available input/output energy values;
• representation of chemical reactions between steel and slag;
• steel conditions: mass, temperature, composition[A1.1][A1.2];
• slag conditions as: mass, temperature, composition (CaO, FeO, SiO2, MgO, MnO, Cr2O3, Al2O3);
• evaluation of MgO saturation in slag;
• evaluation of the arc covering by foaming slag (with acoustic measurement principle);
• alert raising in case of too low MgO content in slag with respect to the saturation degree;
• alert raising in case foaming agents injections (coal, polymers) are needed due to arc uncovering.
Figure 3 provides an exemplary overview of the window shown on-line simulations available in real time.
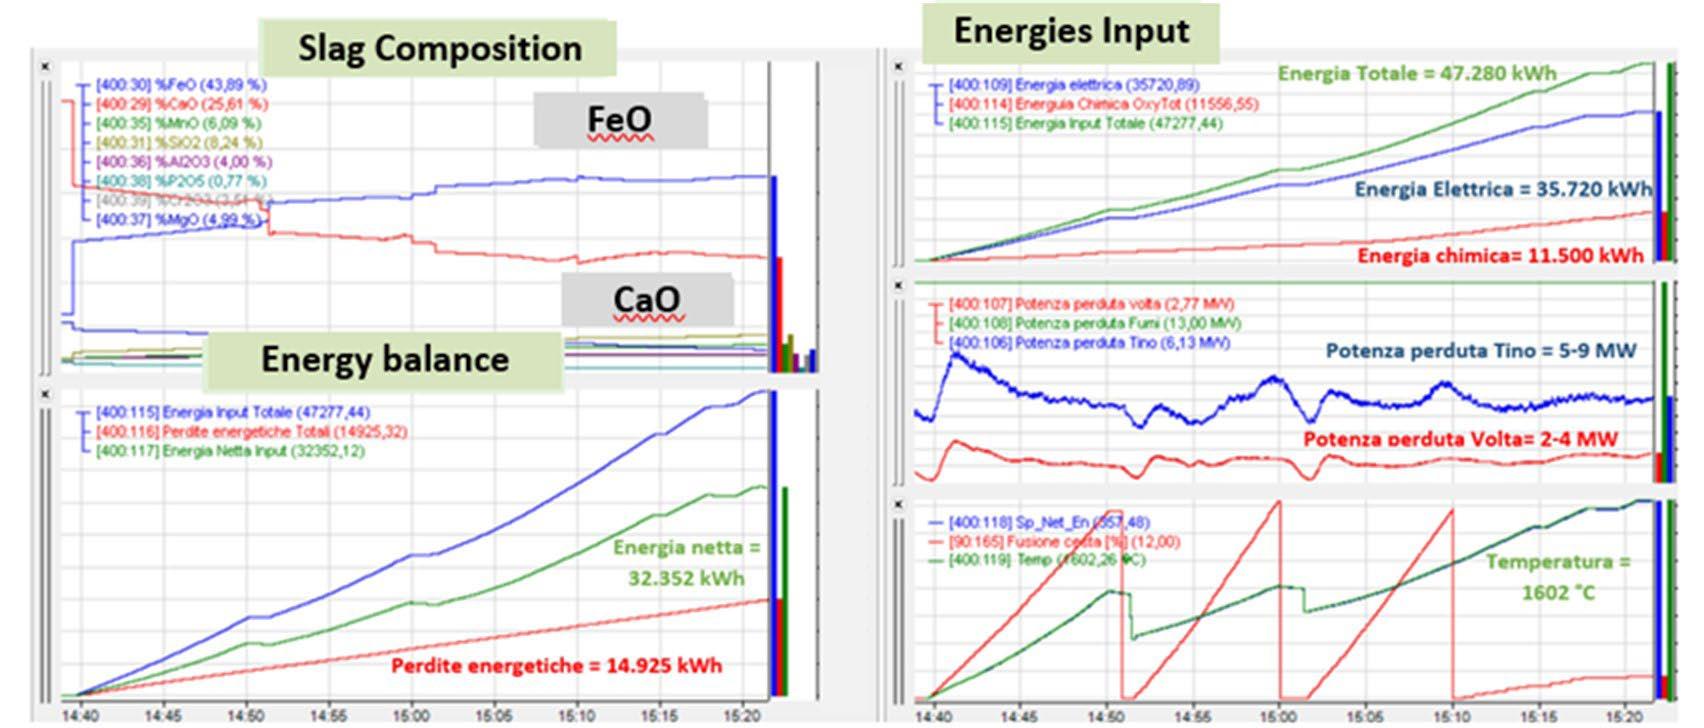
Fig.3 - Window showing on-line simulations including energy balance and slag composition.
A system for EAF and LF slag composition detection (Fast Slag Analysis system) has been implemented, which exploits the QLX9 analyser based on laser Optical Emission Spectroscopy (OES) produced by Quantolux Innovation GmbH. The introduction of this device was needed to measure the composition of the EAF and LF slag after 3/5 minutes from the liquid slag sampling. In this way the knowledge on the slag composition is a real-time infor-
mation included in subsequent steps of calculation. The procedure for application of this approach includes: 1. Sampling, 2. Granulation, 3. Charging of the sensor with obtained sample, 4. Laser measurement, 5. Slag composition evidence, 6. Application of management action on LF treatment based on slag composition detected. The activity is included in the frame of the project Multisens EAF supported by EU funding scheme RFCS (Research Fund for Coal and Steel).
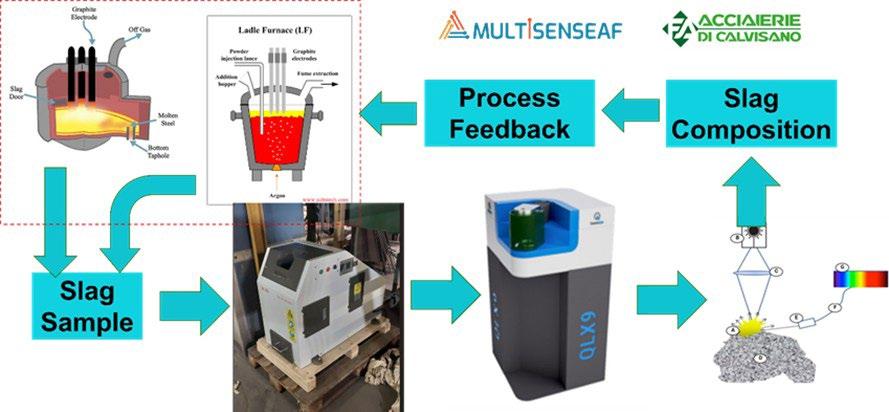
Fig.4 - Control loop of application of fast slag analysis system on the EAF/LF process management.
The DST includes the following functionalities related to the EAF process:
• detection of poor slag foaming/arc uncovering → indication of foaming agents injection;
• determination of low %MgO respect the saturation level → indication addition with MgO in EAF;
• determination of necessary deoxidation, desulfurization, steel composition corrections and indication of correct materials additions (For LF Process).
Detection of poor slag foaming/arc uncovering → Indication of foaming agents injection
The detection of arc uncovering in refining phase is realized thanks to acoustic detection. It occurs if the Arc Foaming index, which is dynamically represented during the refining phase, overcomes the acceptable level in terms of arc uncovering, as this is considered a reliable indicator of arc uncovering and poor slag foaming. In this
case the indication to increase the foaming agents injection is shown, to optimize the process.
Determination of low %MgO respect the saturation level → Indication to Add MgO addition at EAF and LF
To achieve this goal, the following steps are carried out:
1. evaluation of the current slag composition/status (by using the Fast Slag Analysis System);
2. evaluation of the level of %Saturation in terms of MgO, indicated following as %MgOSat;
3. calculation of difference (indicated in the following as GAP_%MgOSat_EAF for EAF slag and GAP_%MgOSat_LF for LF slag) between the saturation level and the current %MgO content in slag (%MgOSlag_EAF and %MgOSlag_LF, respectively) namely:
GAP_%MgOSat_EAF = %MgOSat - %MgOSlag_EAF
GAP_%MgOSat_LF = %MgOSat - %MgOSlag_LF
4. showing an indication of the addition of MgO in slag is needed in case the value of the difference computed
at the previous step is higher than a fixed threshold. Figure 5 shows an example related to EAF slag samples. In this figure the three possible ranges for the values of GAP_%MgOSat_EAF can be distinguished: the “admissible” range is highlighted in green, and here a MgO addition is not required; the “intermediate” range is highlighted in yellow, and here adding a small amount of MgO is beneficial but not strictly needed;
the “warning” range is highlighted in red, and here adding MgO is strictly needed.
The DST raises an alert in case the value of GAP_%MgO Sat_ EAF for EAF slag or GAP_%MgOSat_LF for LF slag is out of the admissibility range and suggests how much MgO needs to be added.
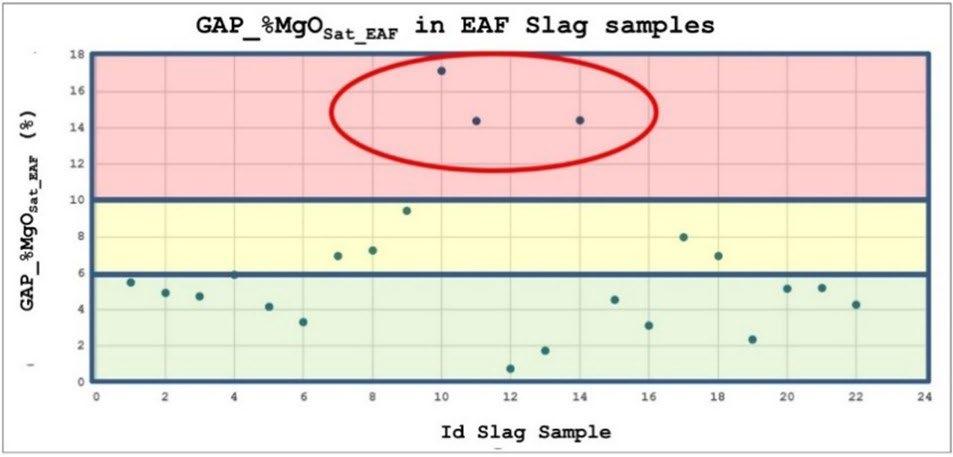
Fig.5 - Exemplar values of GAP_%MgOSat_EAF for some EAF slag samples collected during the trials.
The use of the Isosolubility Diagram approach (ISD) is a further method followed using the slag composition measurement for the EAF and in particular to evaluate the proper slag conditions for the slag foaming and arc covering. In this way the area of the slag liquid or solid due to precipitates formation are shown, and the distance of the actual slag composition detected in relation to these areas are represented.
This approach takes into account composition and temperatures of the slags to determine when the slag in EAF is too much liquid or solid, which are conditions not proper for a slag foaming. Differently it can be seen when a good portion of precipitate formation is present to fit with an optimal composition for slag foaming.
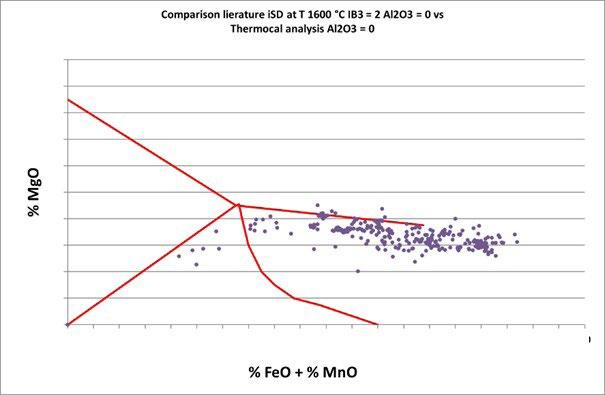
Fig.6 - Application of ISD approach to evaluate optimal slag conditions for foaming.
Determination of necessary deoxidation, desulfurization, steel composition corrections → indication of correct material additions at the LF
A tool has been developed as preliminary approach to estimate ladle additions at tapping and in LF and tested to evaluate the feasibility of this approach for additions suggestions at different conditions of steel and slags also using the LF slag analysis provided by the Fast Slag Analyser Quantolux QLX9. In particular, two functions developed:
a) assessment of possible weight of compounds to be added and associated results on steel and slag to estimate the best additions depending on the targeted results; → The Oxygen ac-tivity at arrival in LF is estimated as a function of different additions
of materials for deoxidation (Si, Al, Mn) at tapping. The DST estimates the suitable additions of materials in the LF for deoxidation;
b) suggestion of additions (in weight) provided by the DST based on the targeted Oxygen activ-ity and steel and slag conditions in arrival from EAF or after sampling in LF. The system runs to realize several iterations of the simulation with different additions combination until it reaches the aimed conditions.
Figure 7 shows an example of the results estimated for the iteration of different combinations of deoxidants additions in terms of oxygen activity at arrival of steel in LF.
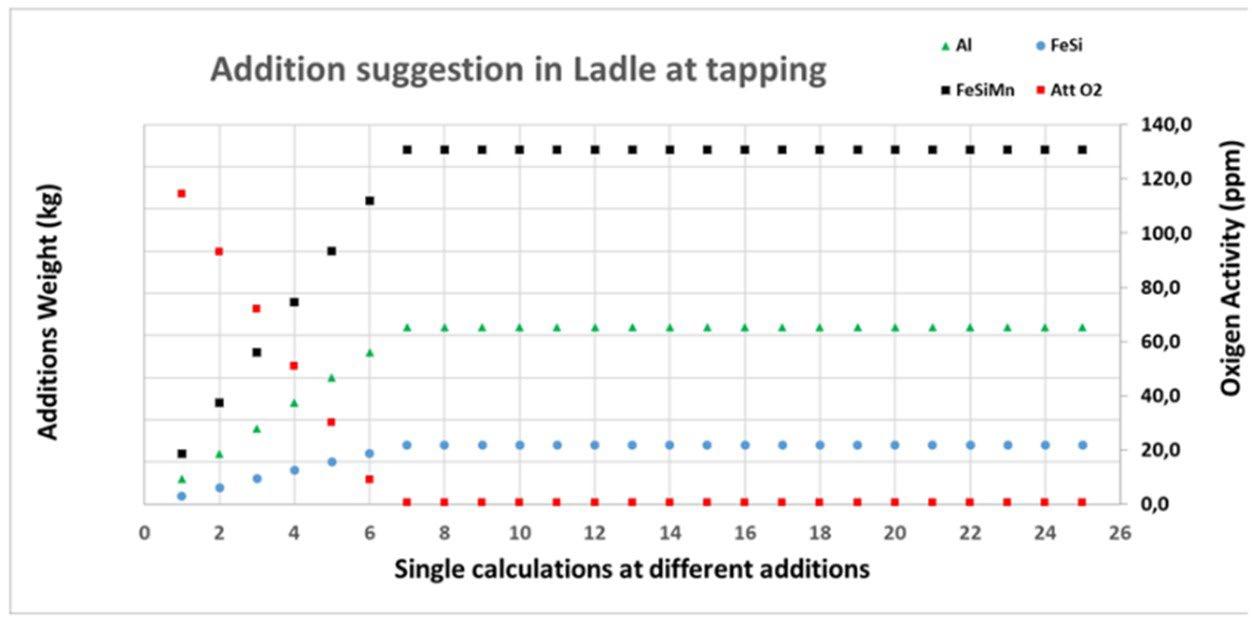
Fig.7 - Results of iteration of different combinations of additions in LF at tapping in terms of O2 activity.
Figure 8 shows an estimation of different additions at tapping into the ladle depending on different levels of oxygen activities in EAF. At higher levels of oxygen activity in EAF higher amounts of additions are needed.
While figure 9 shows estimations of different additions in ladle for different targets of oxygen activities at the entrance to LF. At higher levels of oxygen activity target in LF higher amounts of additions are needed.
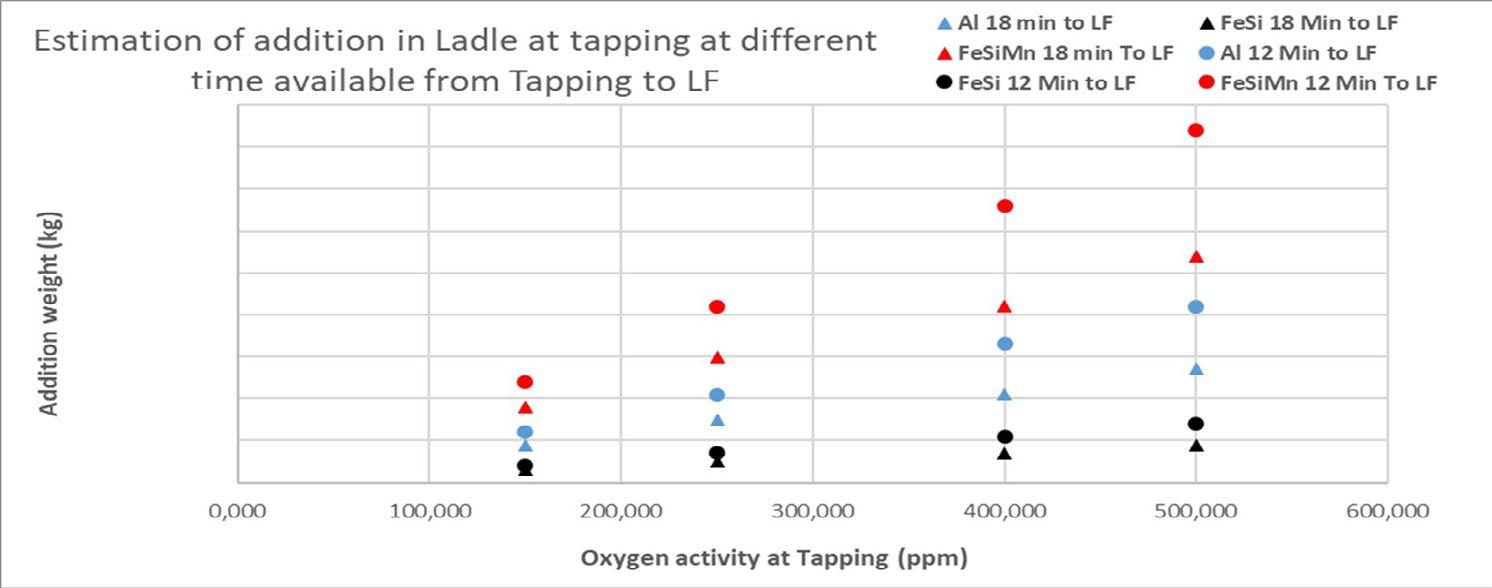
Fig.8 - Estimation of different additions in LF suggested at different oxygen activity at tapping for different values of the time available from EAF to LF steps (12 min vs 18 min).
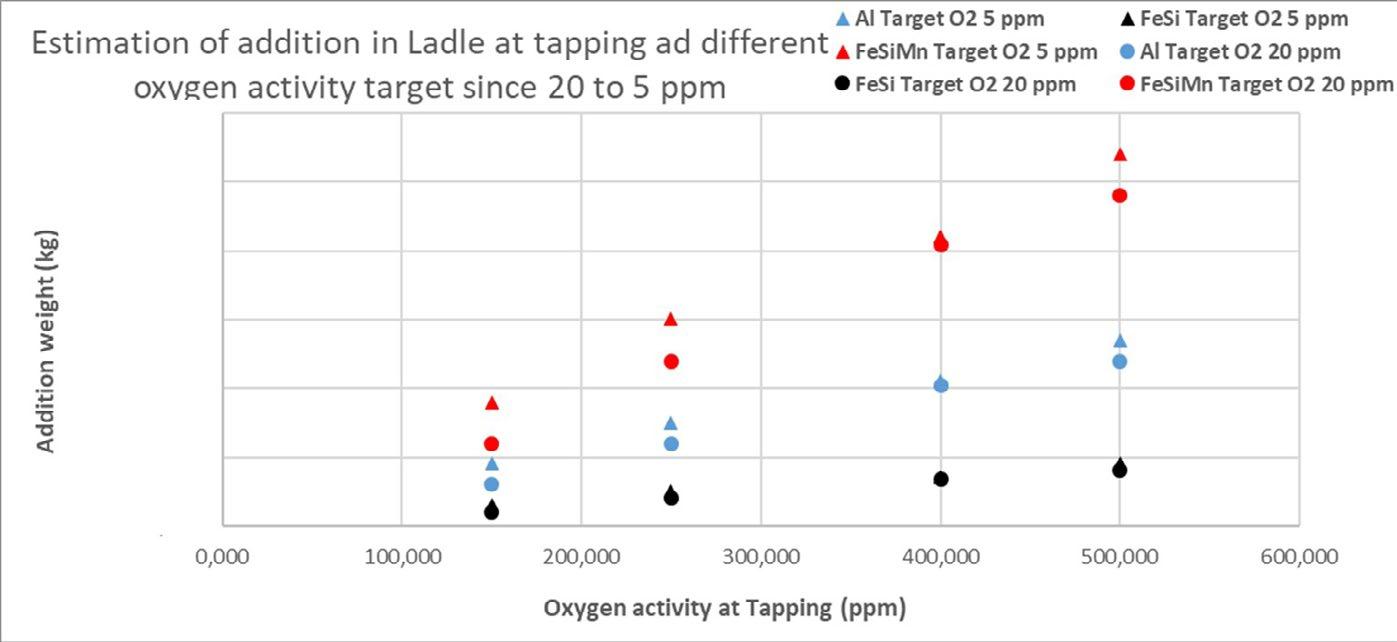
Fig.9 - Estimation of different additions in LF suggested at different oxygen activity at tapping for different aims in terms of oxygen activity at LF inlet (5 ppm vs 20 ppm).
Industrial tests of the Decision Support Tool
At AdC different trials have been realized for the project during the period 2023-2024 by exploiting the Fast Slag Analyser for different purposes and Application Cases (AppC):
AppC1 - evaluation of status of steel oxidation at arrival to the LF and of slag carryover from EAF tap-ping;
AppC2 - detection of low MgO content in EAF and LF slag that can lead to high refractory erosion;
AppC3 - determination of necessary additions for deoxidation, desulfurization, steel composition cor-rections to be performed in Ladle at EAF Tapping.
In AppC1 previous simulations enabled the identification of the ranges of acceptability of the slag composition, which allows identification of abnormal values (see figure
10 which refer to assessment of oxidation status).
The following situations can therefore be identified:
• slag carryover from tapping at regular deoxidation of steel;
• high oxidation status of the steel in arrival in LF to act with soon deoxidation.
• Figure 10 exemplifies the detection of excessive steel oxidation through the analysis of the slag at the end of the EAF process.
In case an excessive oxidation status is detected, the following decisions can be taken:
• lowering the use of O2 injection in EAF in subsequent heat;
• increasing the use of deoxidant in ladle at tapping or at entrance to the LF treatment on-going.
In case of slag carryover from EAF tapping, unnecessary additions for deoxidation can be avoided.
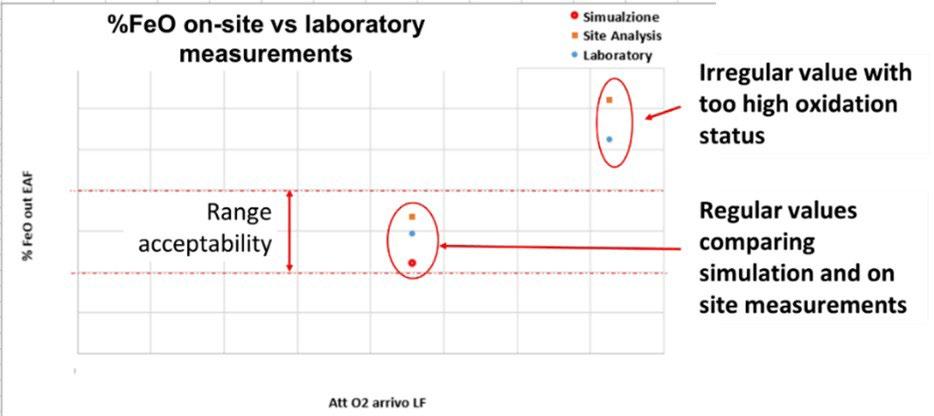
Fig.10 - Admissible ranges of FeO content in slag at the arrival to LF.
In AppC2 trials were conducted on both EAF/LF slags and the procedure elaborated and based on comparison of GAP_%MgOSat_EAF and GAP_%MgOSat_LF with previously
computed admissibility ranges is applied. If MgO content in slag is low, the additions of MgO must be performed to reduce refractory erosion.
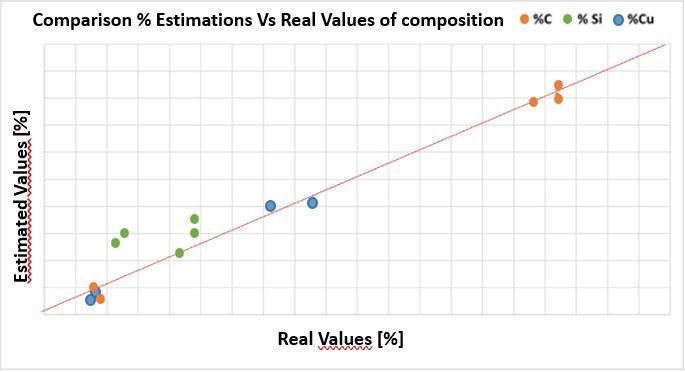
Fig.11 - Computed vs real value of the contents of C, Cu and Si in steel.
In AppC3 the trial campaign for tuning and calibration of the system proved that the DST achieves a good accuracy in the determination C and Cu contents in steel, while a lower level of accuracy was obtained for Si, such as exemplarily shown in figure 11. As already explained, two functions were developed based on the same modelling approach and comparison of additional suggestions reported in figure 12. In particular, different cases of calculation of suggested additions (in weight) are shown based on the targeted oxygen ac-
tivity, steel and slag conditions in arrival from EAF or after sampling in LF: Case a) oxygen activity at tapping = 150 ppm, calculated weight additions as reference; Case b) oxygen activity at tapping = 300 ppm, calculated weight additions +94% in relation to reference; Case c) oxygen activity at tapping = 600 ppm, calculated weight additions +247 %; Case d) oxygen activity at tapping = 600 ppm and increase of time available for treatment in LF since 18 min till 30 min; calculated weight additions +136%.
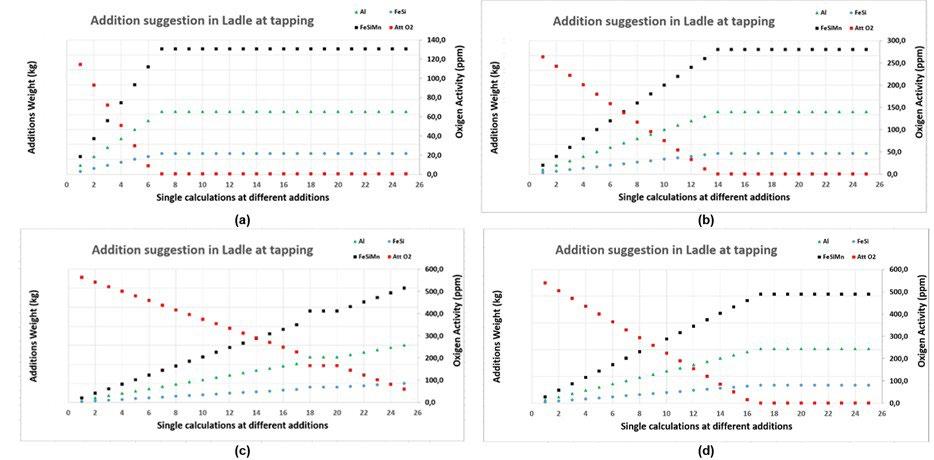
Fig.12 - Examples of calculation of suggested additions (in weight).
This work was carried out with the support of the European Union’s Research Fund for Coal and Steel (RFCS) research program under the ongoing project: Modular hybrid technology in the Steel plant production – iSlag - GA number 101099118 and MultiSensEAF GA number 101112488.
[1] H. D. Goodfellow, M. Pozzi, J. Maiolo, “Holistic Approach to Process Optimization for EAF Steelmakers”, AISTech 2006, Cleveland, Ohio (USA), 1-4 May 2006.
[2] Filippini et al., “Cost and energy effective management of EAF with flexible material mix”, EEC 2012, Graz, Austria, 25-28 September 2012.
[3] P. Nyssen et al., 7th EESC, Venice, Italy, 26-29 May 2009
[4] J. Wendelstorf, K.-H. Spitzer, “A Process Model for EAF Steelmaking”, AISTech, AISTech 2006, Cleveland, Ohio (USA), 1-4 May 2006.
[5] B. Kleimt et al., “Continuous dynamic EAF process control for increased energy and resource efficiency”, EEC 2012, Graz, Austria, September 25-28, 2012.
[6] P. Frittella et al., “EAF process improvement through application of tools for process monitoring and simulation”, AISTech 2014, Indianapolis, Indiana (USA), 5-8 May 2014.
[7] P. Frittella et al., “iCSMelt applications to EAF operating practice optimization”, AISTech 2014, Indianapolis (USA), 5-8 May 2014.
[8] P. Frittella et al., “Modelling approach for the analysis of energy recovery benefits applied in EAF process for the case of Elbe Stahlwerke Feralpi GmbH”, AISTech 2015, Cleveland, Ohio (USA), 4-7 May 2015
[9] P. Frittella, A. Ventura, L. Angelini, “Application of monitoring system based on performances indicators (KPI’s) and process simulation applied at the EAF process improvement”, METEC 2015, Dusseldorf, Germany, 16-20 June 2015.
[10] P. Frittella, L. Angelini, S. Filippini, A. Tolettini, G. Miglietta, “Charge mix management and process simulation for improvement of EAF process to Acciaierie di Calvisano”, EEC 2016, Venezia, Italy, 25-26-27 May 2016.
[11] P. Frittella, L. Angelini, A. Ventura, S. Filippini, A. Tolettini, G. Miglietta: “Improvement of metallic yield for the EAF of Acciaierie di Calvisano through application of KPI’s approach”, EEC 2016, Venezia, Italy, 25-26-27 May 2016.
[12] P. Frittella, L. Angelini, A. Landini, G. Foglio, F. Fredi, C. Di Cecca, M. Tellaroli, B. Cinquegrana, F. Morandini: “Combination of EAF process modelling and process control for improvements of steel production through innovative approaches”, AIM conference 2023.
[13] iSlag “Optimising slag reuse and recycling in electric steelmaking at optimum metallurgical performance through on-line characterization devices and intelligent decision support systems” co-funded by European Union’s research program RFCS (Research Fund for Coal and Steel), GA number 101099118
[14] MultiSensEAF “Multi-Sensor Systems for an optimized EAF Process Control” co-funded by European Union’s research program RFCS (Research Fund for Coal and Steel), GA number 101112488

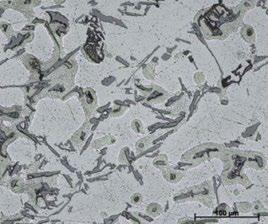
Corso itinerante
Macchina fusoria
BRESCIA, MARONE (BS), STEZZANO (BG), CASTEL ROMANO (RM), BRESCIA, OSPITALETTO (BS)8-9-15-16-22-23 APRILE 2026
>> SCOPRI DI PIÙ
Giornata di studio
Saldatura delle leghe di alluminio. Sviluppi metallurgici e processi tecnologici
Genova c/o Istituto Italiano della Saldatura - 21 aprile 2026
>> SCOPRI DI PIÙ
Master
Master in Progettazione stampi
MODULO 2
La progettazione dello stampo con riferimento al Manuale della difettologia AIM
15 e 16 aprile 2026 - via Zoom + 29 aprile 2026 - Brescia presso UniBs
MODULO 3
I difetti nei getti pressocolati con riferimento al Manuale della difettologia AIM
20 e 21 maggio 2026 - via Zoom + 27 maggio 2026 - Vicenza presso UniPd – DTG
>> SCOPRI DI PIÙ

EEC 2026 - EMECR 2026 Conferences - siderweb FORUM
4th European Electric Steelmaking conference, 5th International Conference on Energy and Material Efficiency and CO2 Reduction in the Steel Industry and the 2nd edition of the biennial event organised by siderweb to discuss the present and future of Italian and European steel Milano - 11-13 May 2026
>> MORE INFO
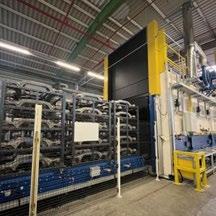

Giornata di Studio Caratterizzazione di prodotti da processi additive manufacturing Casi pratici e studi di difettologie Rovereto c/o Trentino Sviluppo - 21 maggio 2026
>> SCOPRI DI PIÙ
Giornata di Studio Trattamenti termici delle leghe di alluminio Dal fornitore al cliente Provaglio d’Iseo (BS) c/o Gefran - 10 giugno 2026
>> SCOPRI DI PIÙ
Giornata di Studio ECNDT 2026 | Failure Analysis & NDT Verona - 18 giugno 2026
>> SCOPRI DI PIÙ
Tribologia c/o Laboratorio Te.Si. dell'Università degli Studi di Padova Rovigo - 24-25 giugno 2026
>> SCOPRI DI PIÙ
Summer School Digitalization & AI in Metallurgy Udine – 28-29-30 giugno – 1 luglio 2026
>> MORE INFO
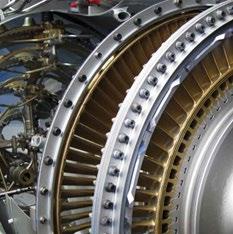



Giornata di Studio Superleghe di nichel
Reggio Emilia - 7 luglio 2026
>> SCOPRI DI PIÙ
Summer school “Environmental Assisted Cracking” Milazzo (ME) - 5-9 July 2026
>> MORE INFO
WCCM 2026
The 4th World Congress on Condition Monitoring Milano, Italy - 25-27 August 2026
>> MORE INFO
41° Convegno Nazionale AIM Progettiamo il futuro tra ricerca e innovazione Brescia - 9-11 settembre 2026
>> SCOPRI DI PIÙ
5th International Conference on INGOT CASTING, ROLLING & FORGING
Bardolino, Verona - 13-15 October 2026
>> MORE INFO
di Enzo Emilio Parente
Terzo classificato della prima edizione del concorso “Metallurgia a fumetti” 2025
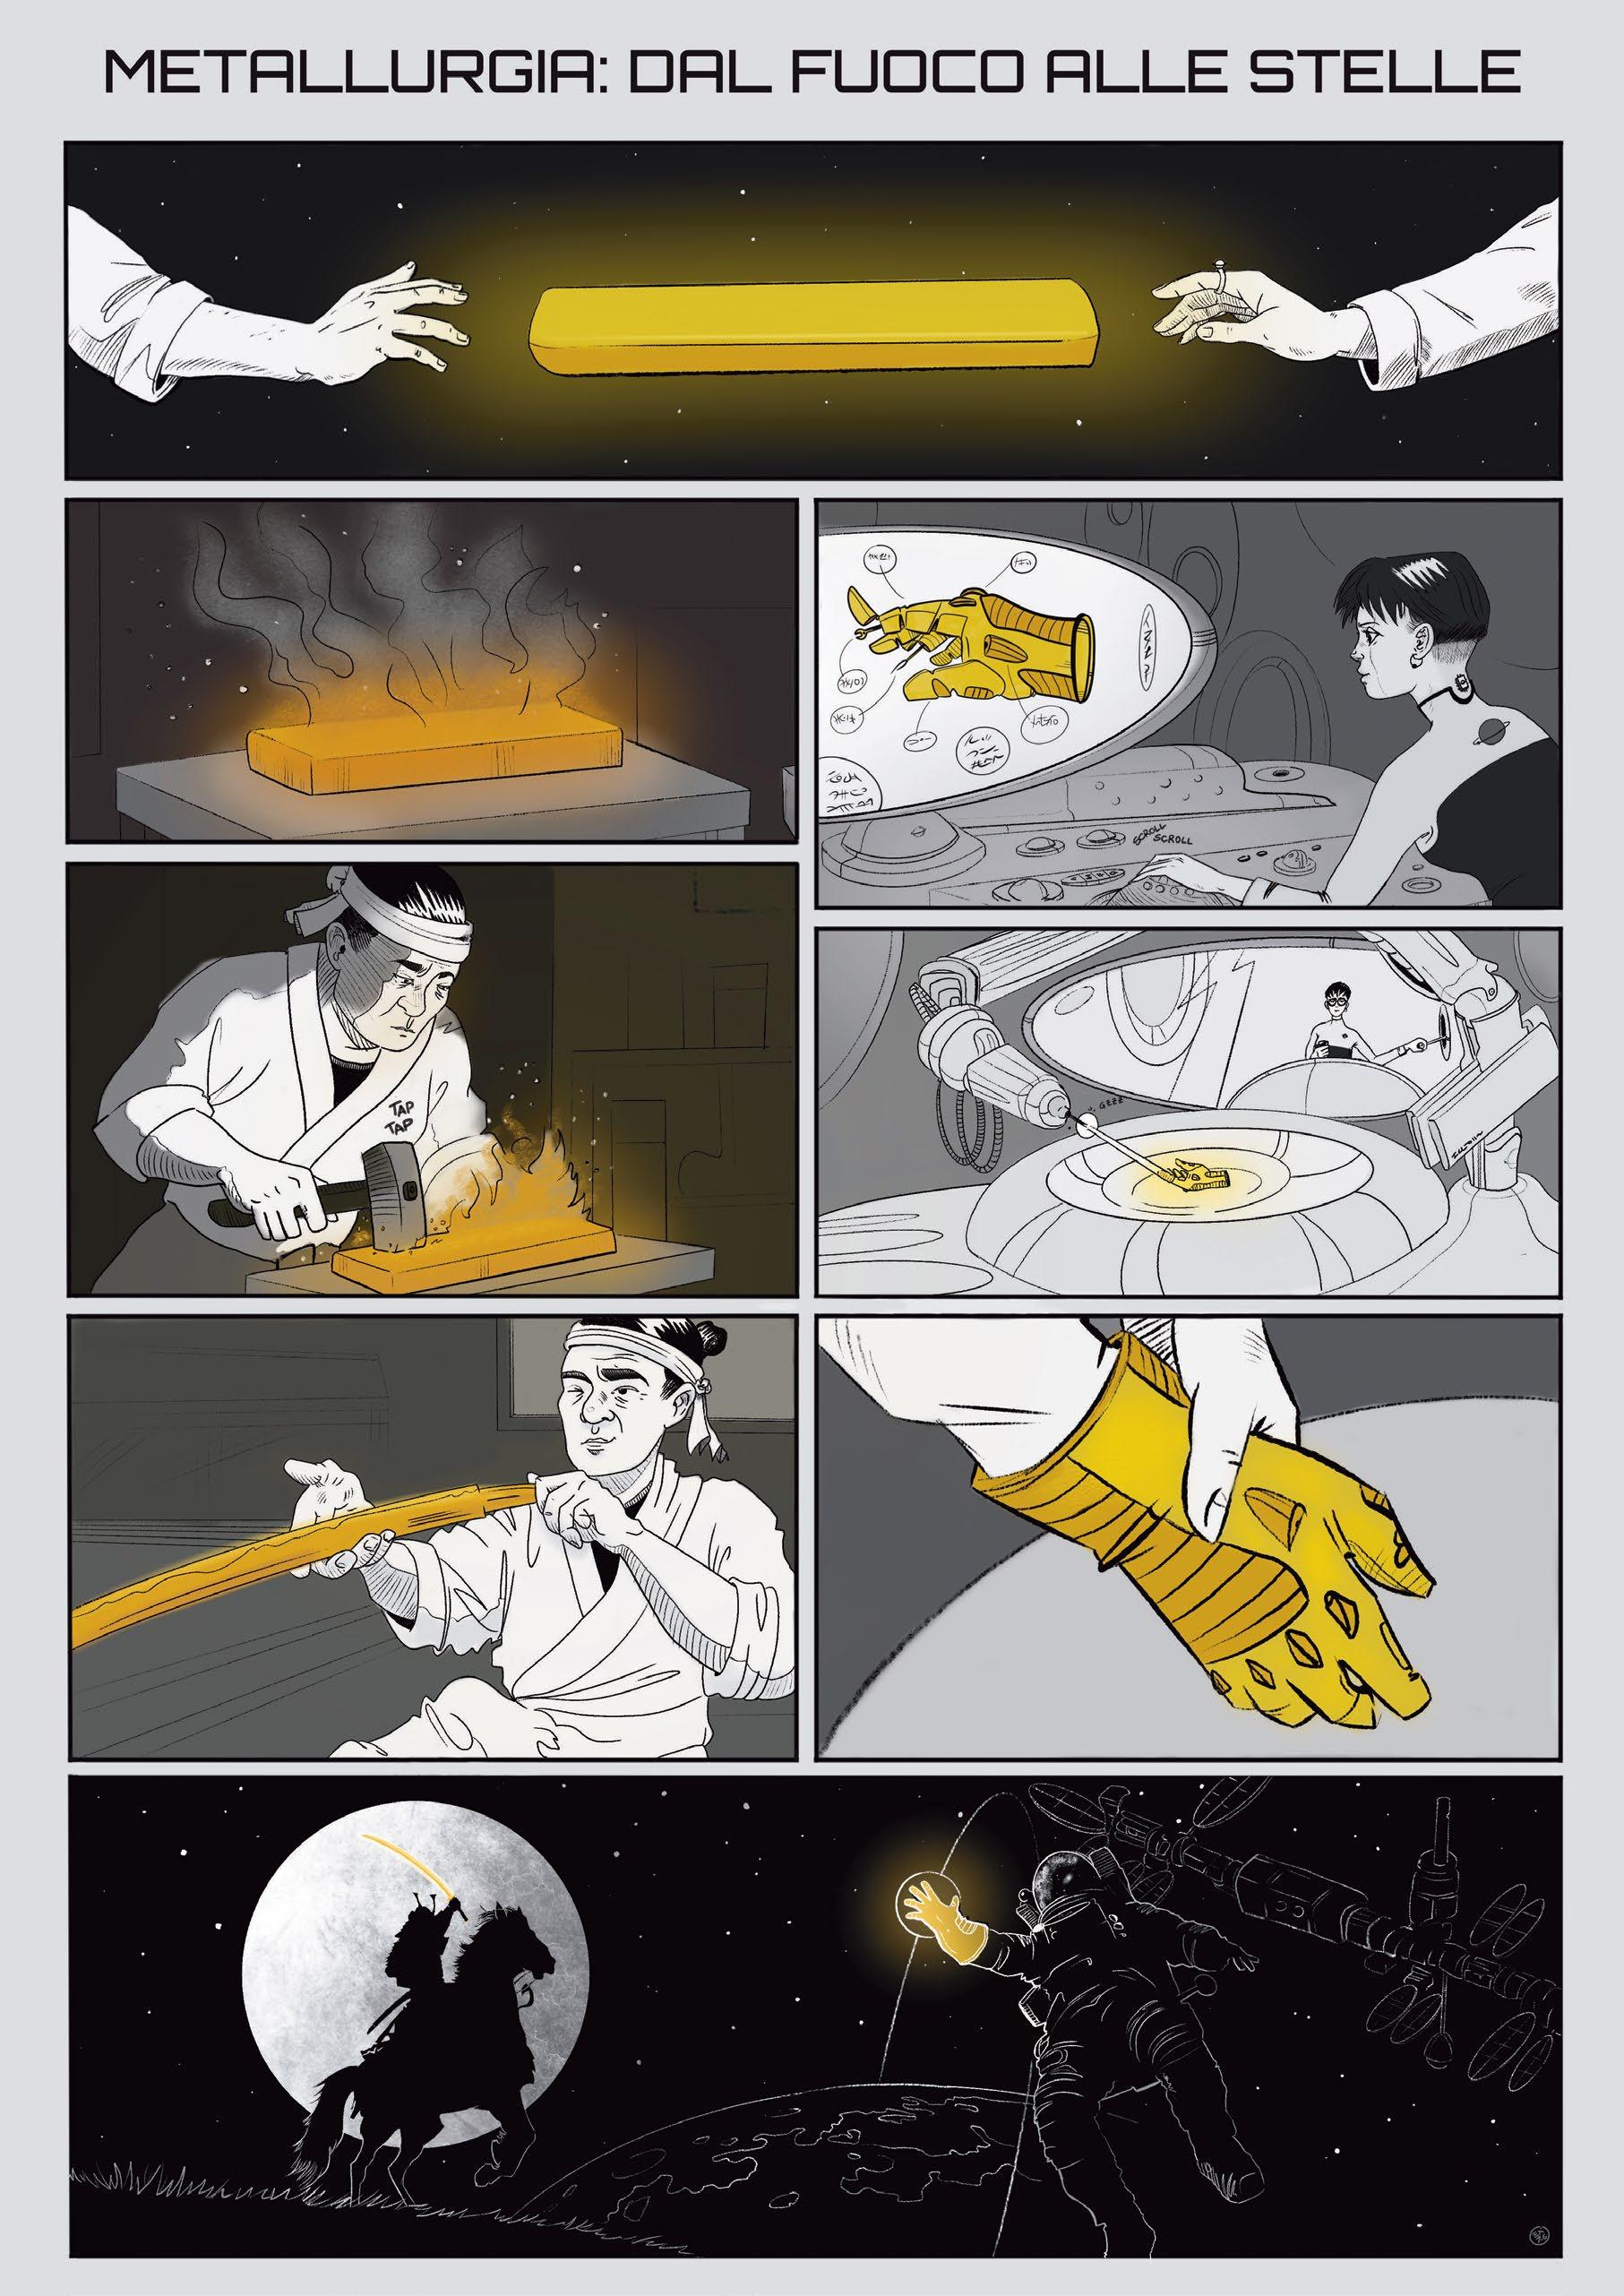
Normativa / Standards
Norme pubblicate e progetti in inchiesta (aggiornamento al 28 febbraio 2026)
Norme UNSIDER pubblicate da UNI nel mese di febbraio 2026
UNI EN 10284:2026
Raccordi in ghisa malleabile con estremità a compressione per sistemi di tubazioni in polietilene (PE)
UNI EN ISO 13628-1:2026
Industrie del petrolio e del gas, compresa l’energia a basse emissioni di CO2 — Progettazione e gestione operativa di sistemi di produzione sottomarini - Parte 1: Requisiti generali e raccomandazioni
UNI EN ISO 19905-1:2026
Industrie del petrolio e del gas, compresa l’energia a basse emissioni di CO2 — Valutazione dei siti per il posizionamento di unità offshore - Parte 1: Piattaforme auto-sollevanti (Jack Up) elevate in sito
UNI EN 10342:2026
Materiali magnetici — Classificazione dell’isolamento della superficie delle lamiere, dei nastri e delle lamelle magnetiche di acciaio
UNI EN ISO 13680:2026
Industrie del petrolio e del gas, compresa l’energia a basse emissioni di CO2 — Tubi in lega senza saldatura resistenti alla corrosione utilizzati come tubi di rivestimento, tubi di produzione e tubi sbozzati per la produzione di manicotti — Condizioni tecniche di fornitura
UNI EN 10242:2026
Raccordi di tubazione filettati di ghisa malleabile
UNI EN 12680-1:2026
Fonderia — Controllo mediante ultrasuoniParte 1: Getti di acciaio per impieghi generali
UNI EN ISO 14723:2026
Industrie del petrolio e del gas, compresa l’energia a basse emissioni di CO2 — Sistemi di tubazioni per il trasporto — Valvole per tubazioni sottomarine
Norme UNSIDER ritirate con sostituzione da UNI nel mese di febbraio 2026
UNI EN ISO 13680:2020
Industrie del petrolio e del gas naturale — Tubi in lega senza saldatura resistenti alla corrosione utilizzati come tubi di rivestimento, tubi di produzione e tubi sbozzati per la produzione di manicotti — Condizioni tecniche di fornitura
UNI EN 10342:2005
Materiali magnetici — Classificazione dell’isolamento della superficie delle lamiere, dei nastri e delle lamelle magnetiche di acciaio
UNI EN ISO 13628-1:2010
Industrie del petrolio e del gas naturale — Progettazione e gestione operativa di sistemi di produzione sottomarini - Parte 1: Requisiti generali e raccomandazioni
UNI EN 10242:2009
Raccordi di tubazione filettati di ghisa malleabile
UNI EN 12680-1:2005
Fonderia — Controllo mediante ultrasuoniParte 1: Getti di acciaio per impieghi generali
UNI EN 10284:2003
Raccordi in ghisa malleabile con estremità a compressione per sistemi di tubazioni in polietilene (PE)
UNI EN ISO 19905-1:2023
Industrie del petrolio e del gas, compresa l’energia a basse emissioni di CO2 — Valutazione dei siti per il posizionamento di unità offshore - Parte 1: Piattaforme auto-sollevanti (Jack Up)
UNI EN ISO 14723:2009
Industrie del petrolio e del gas naturale — Sistemi di tubazioni per il trasporto — Valvole per tubazioni sottomarine
Norme UNSIDER pubblicate da CEN e ISO nel mese di febbraio 2026
EN ISO 24202:2026
Oil and gas industries including lower carbon energy — Bulk material for offshore projects — Monorail beam and padeye (ISO 24202:2023)
EN ISO 3845:2026
Oil and gas industries including lower carbon energy — Full ring ovalization test method for the evaluation of the cracking resistance of steel line pipe in sour service (ISO 3845:2024)
EN ISO 18203:2026
Steel — Determination of the thickness of surface-hardened layers (ISO 18203:2026)
EN ISO 14577-5:2026
Metallic materials — Instrumented indentation test for hardness and materials parameters - Part 5: Linear elastic dynamic instrumented indentation testing (DIIT) (ISO 14577-5:2022)
EN ISO 21809-2:2026
Oil and gas industries including lower carbon energy — External coatings for buried or submerged pipelines used in pipeline transportation systems - Part 2: Single layer fusion-bonded epoxy coatings (ISO 21809-2:2026)
ISO 21809-2:2026
Oil and gas industries including lower carbon energy — External coatings for buried or submerged pipelines used in pipeline transportation systems - Part 2: Single-layer fusion-bonded epoxy coatings
ISO 21809-4:2026
Oil and gas industries including lower carbon energy — External coatings for buried or submerged pipelines used in pipeline transportation systems - Part 4: Polyethylene coatings (2-layer PE)
Progetti UNSIDER messi allo studio dal CEN (Stage 10.99) – marzo 2026
prEN ISO 19901-9 rev
Oil and gas industries including lower carbon energy — Specific requirements for offshore structures - Part 9: Structural integrity management
prEN ISO 13503-5 rev
Oil and gas industries including lower carbon energy — Completion fluids and materialsPart 5: Measuring conductivity of proppants
prEN ISO 10426-1 rev
Oil and gas industries including lower carbon energy — Cements and materials for well cementing Part 1: Specification
EN ISO 16961:2024/prA1
Oil and gas industries including lower carbon energy — Internal coating and lining of steel storage tanks — Amendment 1: Oil and gas industries including lower carbon energy — Internal coating and lining of steel storage tanks — Commonly used liquid and/or gas compositions in storage tanks — Amendment 1
prEN 1563 rev
Founding — Spheroidal graphite cast irons
prEN ISO 25973
Metallic materials — Sheet and strip — Shear testing for the characterization of work hardening
prEN 10111 rev
Continuously hot rolled low carbon steel sheet and strip for cold forming — Technical delivery conditions
EN 10338:2025/prA1
Hot rolled and cold rolled non-coated products of multiphase steels for cold forming — Technical delivery conditions
EN 10205:2024/prA1
Cold reduced tinmill products — Blackplate
Progetti UNSIDER in inchiesta prEN e ISO/DIS – marzo 2026
prEN – progetti di norma europei
prEN 15189
Ductile iron pipes, fittings and accessories — External polyurethane coating for pipes — Requirements and test methods
ISO/DIS – progetti di norma internazionali
ISO/DIS 25411
Carbon footprint accounting and reporting of non-parallel steel wire and cords for tyre reinforcement
ISO/DIS 25408-1
Testing method for bead wire - Part 1: General requirements
ISO/DIS 25408-2
Testing method for bead wire - Part 2: Adhesion test
ISO/DIS 25241
Oil and gas industries including lower carbon energy — Injection equipment for chemical flooding — Layered injection tools
ISO/DIS 25160
Testing method for hose reinforcement wire
ISO/DIS 20805
Hot-rolled steel sheet in coils of higher yield strength with improved formability and heavy thickness for cold forming
ISO/DIS 14656
Epoxy powder and sealing material for the coating of steel for the reinforcement of concrete
ISO/DIS 14654
Epoxy-coated steel for the reinforcement of concrete
ISO/DIS 6934-3
Steel for the prestressing of concrete - Part 3: Quenched and tempered wire
ISO/DIS 6338-4
Calculations of greenhouse gas (GHG) emissions throughout the liquefied natural gas (LNG) chain - Part 4: Shipping
ISO/DIS 6338-5
Calculations of greenhouse gas (GHG) emissions throughout the liquefied natural gas (LNG) chain - Part 5: Regasification
Progetti UNSIDER al voto FprEN e ISO/ FDIS – marzo 2026
FprEN – progetti di norma europei
FprEN ISO 20815
Oil and gas industries including lower carbon energy — Production assurance and reliability management (ISO/FDIS 20815:2026)
FprEN ISO 19008
Oil and gas industries including lower carbon energy — Standard cost coding system (ISO/ FDIS 19008:2026)
FprCEN/TR 18341
District heating and cooling systems — Sup-
plementary information on usage of CEN/TC 107 documents
FprEN ISO 14577-1
Metallic materials — Instrumented indentation test for hardness and materials parameters - Part 1: Test method (ISO/FDIS 145771:2026)
ISO/FDIS – progetti di norma internazionali
ISO/FDIS 20815
Oil and gas industries including lower carbon energy — Production assurance and reliability management
ISO/FDIS 20198
Metallic materials — Steel — Method of test for the determination of brittle crack arrest temperature (CAT)
ISO/FDIS 19008
Oil and gas industries including lower carbon energy — Standard cost coding system
ISO/FDIS 14577-1
Metallic materials — Instrumented indentation test for hardness and materials parameters - Part 1: Test method
ISO/FDIS 4967
Steel — Determination of the non-metallic inclusion content — Micrographic method
ISO/FDIS 1035
Hot-rolled steel bars — Dimensions, shape, masses and tolerances
ISO/FDIS 657-1
Hot-rolled steel sections — Dimensions, sectional properties and tolerances - Part 1: Angles, sloping flange channels and sloping flange beams
Milan
siderweb FORUM è l’appuntamento biennale di siderweb che riunisce i protagonisti dell’industria siderurgica italiana ed europea per discutere il presente e il futuro del settore.
Per la seconda edizione, l’evento cresce in format, durata e attrattività per il pubblico: si svolgerà in contemporanea con EEC 2026 (14th European Electric Steelmaking Conference) ed EMECR 2026 (5thInternational Conference on Energy and Material Efficiency and CO2
Reduction in the Steel Industry), due conferenze internazionali organizzate da AIM
Associazione italiana di Metallurgia
SIDERWEB FORUM
• Scenari geopolitici
• Mercati globali
• Transizione energetica
• Innovazione
EEC | EMECR
• Tecnologie per la decarbonizzazione
• Processi innovativi per EAFs
• Efficienza energetica e riduzione della CO2
Il programma è in fase di definizione.
L’agenda aggiornata dei convegni è disponibile su siderweb.com/siderweb-forum
Oltre ai convegni e alle conferenze, sarà presente anche un’area espositiva dedicata alle aziende del settore. Guarda gli espositori ALREADY ON BOARD
Diventa espositore!

I pacchetti sponsor sono pensati per garantire massima visibilità su tutti i partecipanti.
Diventa sponsor!
CO-ORGANIZED BY