Italiana La Metallurgia
International Journal of the Italian Association for Metallurgy
n.01 gennaio 2026
Organo ufficiale dell’Associazione Italiana di Metallurgia. Rivista fondata nel 1909
International Journal of the Italian Association for Metallurgy
n.01 gennaio 2026
Organo ufficiale dell’Associazione Italiana di Metallurgia. Rivista fondata nel 1909
International Journal of the Italian Association for Metallurgy
Organo ufficiale dell’Associazione Italiana di Metallurgia. HouseorganofAIMItalianAssociationforMetallurgy. Rivista fondata nel 1909
Direttore responsabile/Chiefeditor: Mario Cusolito
Direttore vicario/Deputydirector: Gianangelo Camona
Comitato scientifico/Editorialpanel: Marco Actis Grande, Silvia Barella, Paola Bassani, Christian Bernhard, Massimiliano Bestetti, Wolfgang Bleck, Franco Bonollo, Irene Calliari, Mariano Enrique Castrodeza, Emanuela Cerri, Vlatislav Deev, Andrea Di Schino, Donato Firrao, Bernd Kleimt, Carlo Mapelli, Denis Jean Mithieux, Roberto Montanari, Marco Ormellese, Mariapia Pedeferri, Massimo Pellizzari, Barbara Previtali, Evgeny S. Prusov, Dario Ripamonti, Dieter Senk
Segreteria di redazione/Editorialsecretary: Flynn Russo
Comitato di redazione/Editorialcommittee: Federica Bassani, Gianangelo Camona, Mario Cusolito, Carlo Mapelli, Federico Mazzolari, Flynn Russo, Silvano Panza
Direzione e redazione/Editorialandexecutiveoffice: AIM - Via F. Turati 8 - 20121 Milano tel. 02 76 02 11 32 - fax 02 76 02 05 51 met@aimnet.it - www.aimnet.it
Reg. Trib. Milano n. 499 del 18/9/1948. Sped. in abb. Post. - D.L.353/2003 (conv. L. 27/02/2004 n. 46) art. 1, comma 1, DCB UD
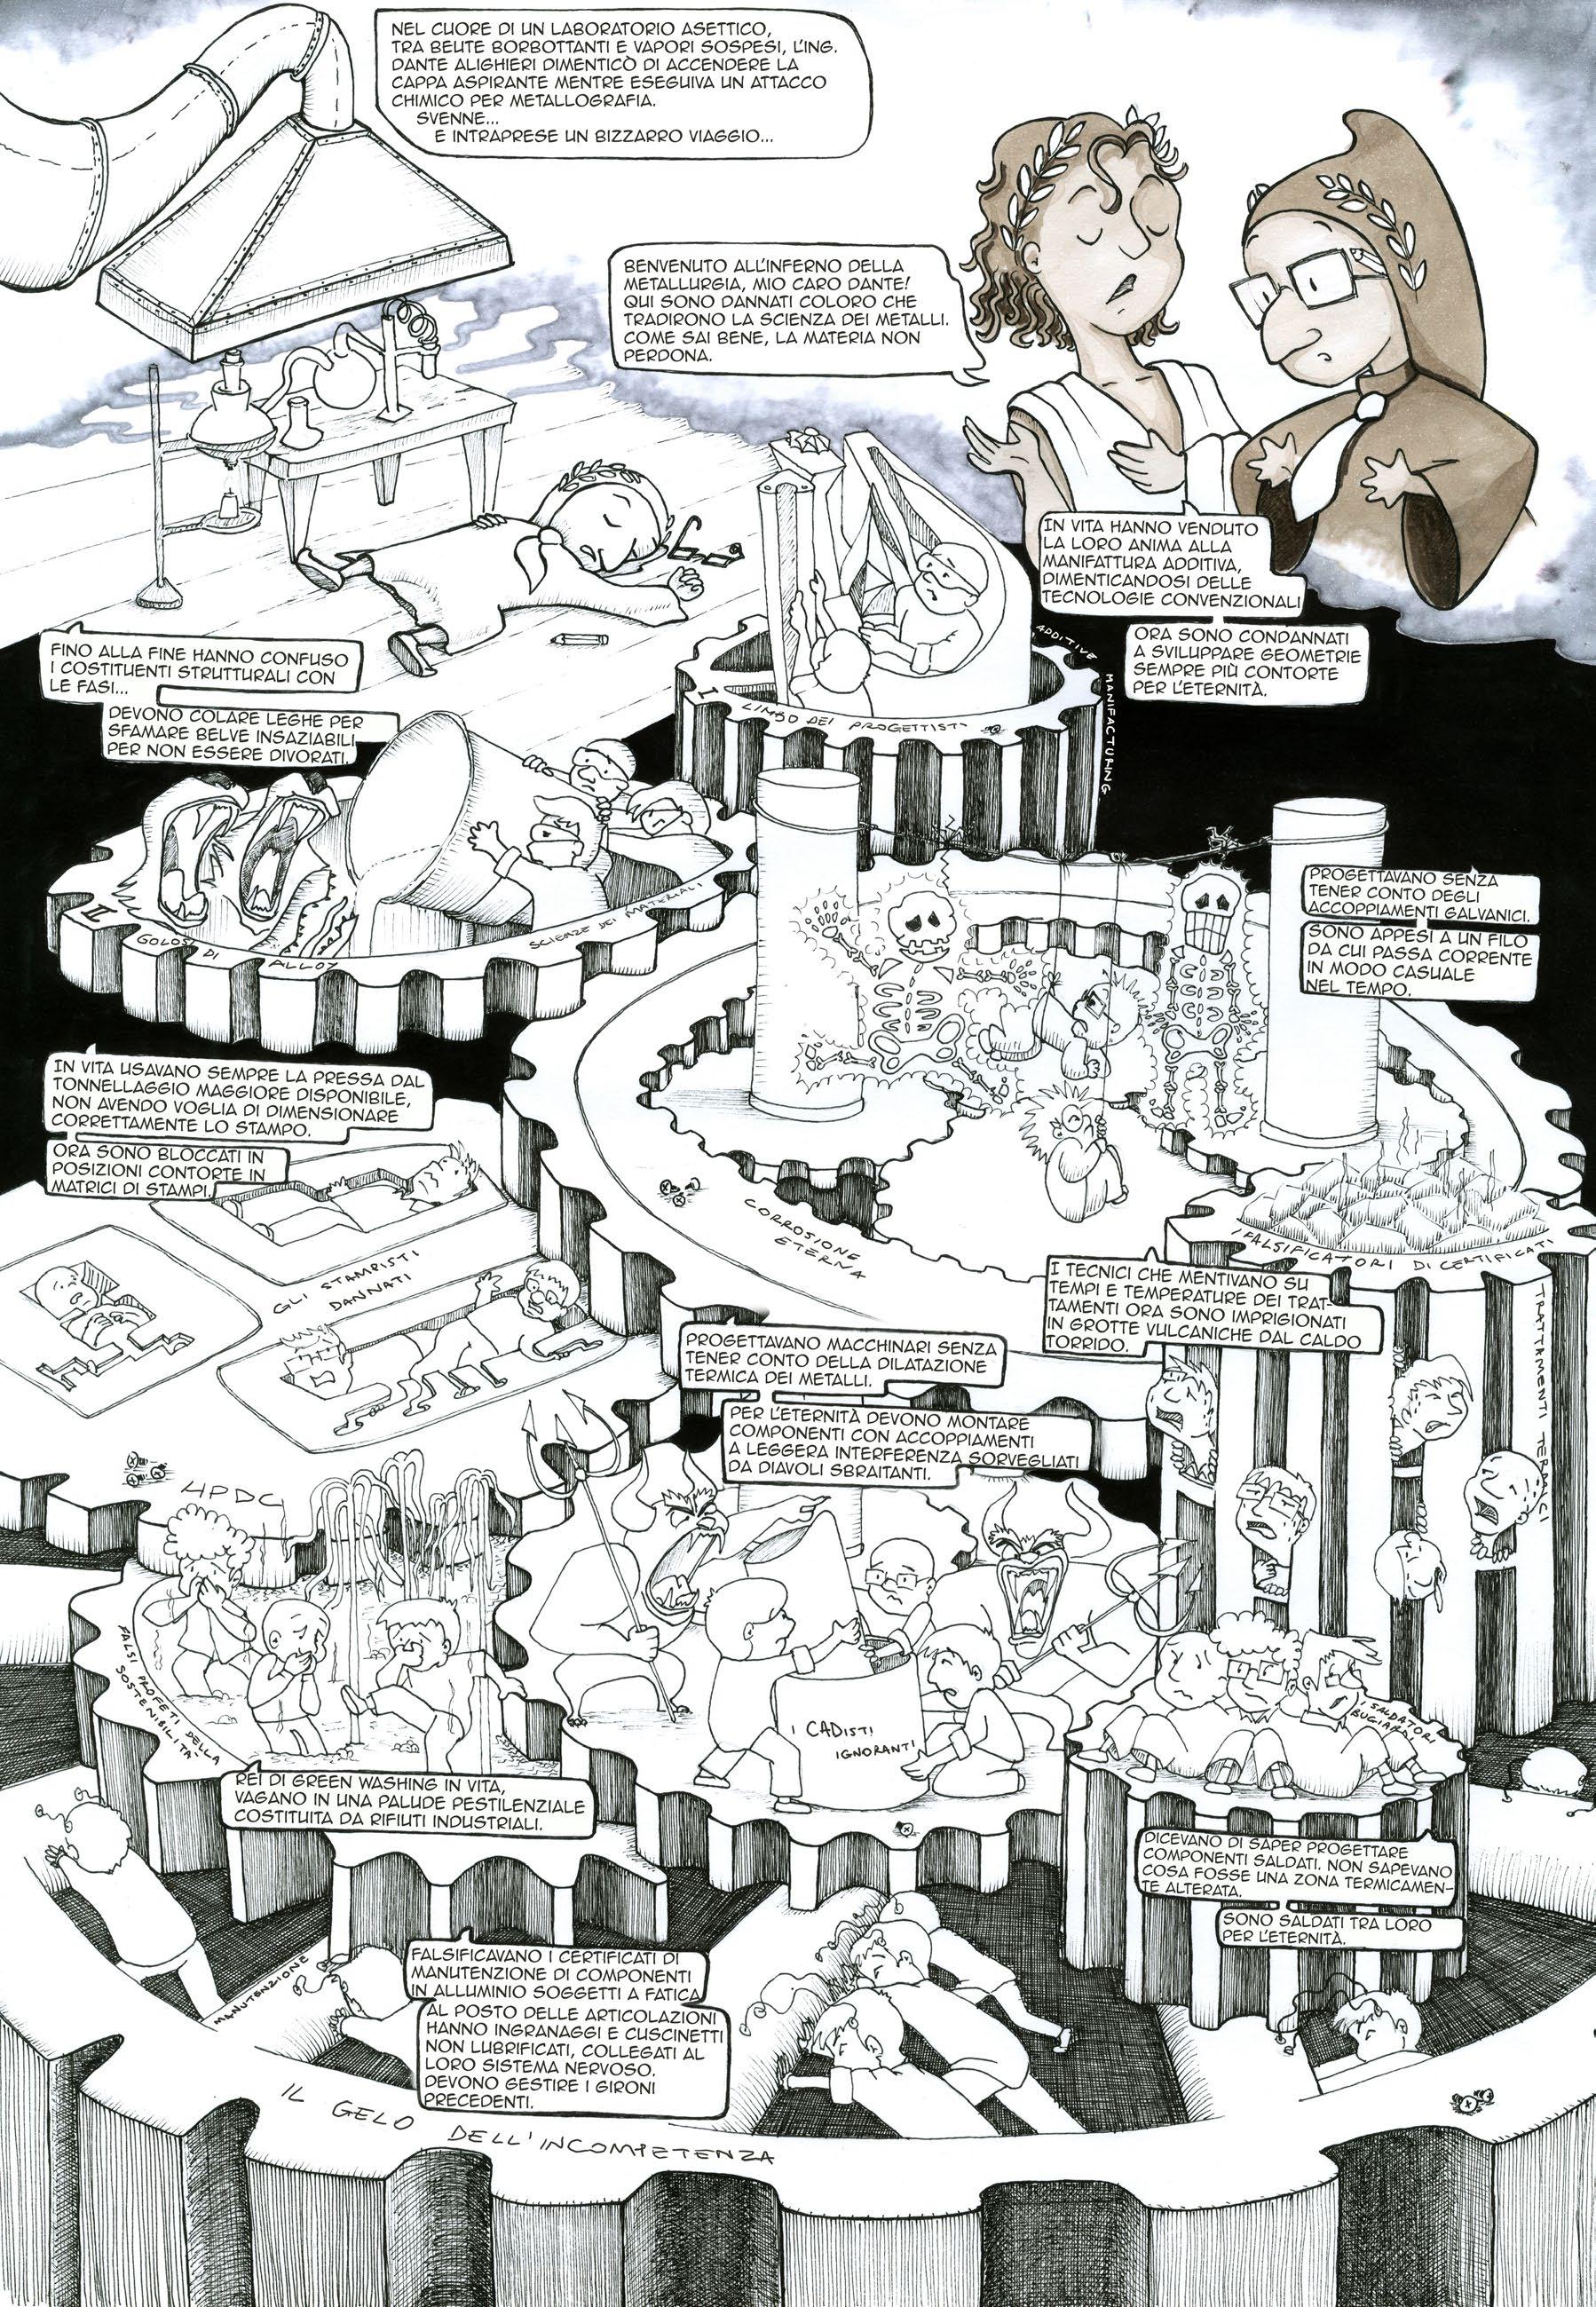
Immagine in copertina: “L’Inferno della Metallurgia” Luca Marchini, Primo classificato concorso “Metallurgia a fumetti” 2025

Gestione editoriale e pubblicità Publisher and marketing office: siderweb spa sb Via Don Milani, 5 - 25020 Flero (BS) tel. 030 25 400 06 commerciale@siderweb.com - www.siderweb.com
La riproduzione degli articoli e delle illustrazioni è permessa solo citando la fonte e previa autorizzazione della Direzione della rivista. Reproduction in whole or in part of articles and images is permitted only upon receipt of required permission and provided that the source is cited.
siderweb spa sb è iscritta al Roc con il num. 26116
n.01 gennaio 2026
Anno 117 - ISSN 0026-0843
Editoriale / Editorial
Silvano Panza, Presidente AIM . pag.05
Memorie scientifiche / Scientific papers
Intelligenza artificiale / Artificial Intelligence
Deep learning-powered system for automated detection and quantification of Vickers indentations
F. Bertolini, M. Mariani, N. Lecis ......................................................................................................................... pag.10
Digital Twin Framework and federated learning for multi-plant knowledge sharing in decision support for electric steelmaking and beyond P. Kannisto, B. Kleimt, A. Chandgude, N. García, I. Guardiola, R. Lazcano, C. Perea, S. Dettori, A. Zaccara, L. Vannini, V. Colla, D. Blazquez, B. Fernandez, I. Garcia . pag.25
From kinetics to imagery: A JMAK-informed, chained predictive artificial intelligence method for interpretable steel microstructure simulation
S. Bazri, C. Mapelli, D. Mombelli, R. Nemfardi, R. Bedini, G. Zucchelli . pag.37
Caratterizzazione/Characterisation
CorrelationBetweenStarterBlockGeometry,CrystalOrientation,andCreep RuptureLifeinCMSX-4SingleCrystals
A. Jadidi, S. M. Abbasi, M. Seifollahi ............................................................................................................pag.44
Atti e notizie / AIM news
Eventi AIM / AIM events ...................................................................................................... pag.61
Primo classificato concorso “Metallurgia a fumetti” 2025 ................................... pag.65
Normativa / Standards ....................................................................................................... pag.66
11th-13th May 2026
Milan
The 14th European Electric Steelmaking conference will cover a wide range of topics related to the production of steel using electric arc furnaces (EAFs) and other electric-based processes
The 5th International Conference on Energy and Material Efficiency and CO2 Reduction in the Steel Industry will host high level discussions on environmental related topics
The 2nd edition of the biennial event organised by siderweb to discuss the present and future of Italian and European steel
“Per i giovani che oggi si affacciano al mondo del lavoro, spesso segnato da fragilità e incertezza, AIM può rappresentare un luogo di orientamento, di confronto, di costruzione del futuro.”
Cari Associati,
“Foryoungpeoplethat areenteringtheworkforce today,inaworldmarkedby weaknessesanduncertainty, AIM could represent a place of orientation, confrontation, andwheretheycanbuild their own future.”
con il mese di maggio si concluderà il mio secondo e ultimo mandato alla guida della nostra Associazione. Un percorso che ho vissuto con intensa partecipazione e con la volontà costante di dare valore a ogni attività di AIM, rafforzandone l’identità e lo spirito comunitario. Quando, quattro anni fa, iniziai questa esperienza, scelsi nel mio editoriale di manifestare e condividere con voi alcuni principi che sentivo miei come uomo, professionista e motociclista e ritrovavo applicati sistematicamente nelle attività dell’associazione: leggerezza, rapidità, esattezza, visibilità, molteplicità e coerenza. Virtù che, allora come oggi, considero la bussola che ha guidato AIM e che ha ispirato ogni scelta fatta insieme.
In questo secondo mandato mi sono posto cinque obiettivi chiari, che mi paiono realizzati:
1. Dare centralità ai giovani, continuando a offrire a loro spazi e strumenti per partecipare, crescere e condividere competenze ed entusiasmo con i soci più esperti.
2. Valorizzare i membri e i Presidenti dei Centri di Studio, cuore pulsante dell’AIM, custodi di conoscenza e motore di divulgazione dell’innovazione scientifica.
3. Rendere la nostra rivista più attrattiva, aprendo le sue pagine alle aziende associate, a

Dear Members,
my second and last mandate as President of our Association will end in May. A path that I experienced with great participation and guided by the willpower to value every single activity of AIM, strengthening its identity and its community.
Four years ago, when I took on this role, in my first editorial I chose to express and share some of the principles I felt mine as man, as professional in the field and as biker, that were also systemically put into practice in every activity of the Association: lightness of being, swiftness, precision, visibility, variety and consistency.
Now as then, these are virtues I regard as the compass that guided AIM and that inspired every decision we took together.
During this second mandate, I established five precise objectives that I think we were able to achieve:
1. Prioritise the youth, by ceaselessly giving them platform and instruments for them to contribute, grow, share skills and passion with their experts.
2. Give value to the members and Presidents of Study groups, the very core of AIM, keepers of knowledge and models of scientific dissemination.
3. Make our journal more appealing, by giving space on its pages to associated companies with
esperti esterni e anche alle nuove generazioni. È nata così l’idea del premio “La metallurgia a fumetti”, un modo semplice, originale e curioso per descrivere i nostri processi e avvicinare nuovi lettori con leggerezza.
4. Rinnovare la veste dei nostri uffici, perché rappresentino anche nell’immagine il valore della nostra Associazione.
5. Ampliare la base associativa e rafforzare il ruolo pubblico di AIM attraverso l’incarico assegnato quest’anno alla Vicepresidente Raffaella Poggio per lo “Sviluppo strategico di marketing & comunicazione per AIM”.
Un contesto difficile che richiede unità e intelligenza collettiva
Gli anni che stiamo vivendo non sono semplici, soprattutto per il comparto metallurgico.
L’aumento dei costi energetici, le difficoltà del settore automotive, i dazi e le tensioni geopolitiche stanno mettendo a dura prova le imprese del nostro settore e non solo.
In questo scenario, tuttavia, AIM ha un ruolo ancora più importante: fare massa critica.
Unire competenze, creare nuovi stimoli, generare confronto e individuare insieme le traiettorie innovative che la nostra intelligenza umana, quella vera, fatta di esperienza, visione e spirito di collaborazione, non ha mai fatto mancare.
È in momenti come questi che si misura la forza di una comunità tecnica: nella capacità di condividere conoscenza e di interpretare il cambiamento.
Il valore dei giovani e della formazione continua
In questi anni AIM ha visto crescere la partecipazione dei soci junior, molti dei quali hanno trovato nei nostri convegni e nei nostri Centri di Studio un ambiente accogliente, autorevole e stimolante. Per i giovani che oggi si affacciano al mondo del lavoro, spesso segnato da fragilità e incertezza, AIM può rappresentare un luogo di orientamento, di confronto, di costruzione del futuro. Continuiamo quindi a sostenere il loro coinvolgimento attivo, affinché possano diventare protagonisti della metallurgia di domani, in
us, to external experts, and to the new generation too. This gave birth to the contest “La metallurgia a fumetti” (Metallurgy in comics), a simple, original, and interesting way of explaining the processes in our field, drawing new readers with lightness of being.
4. Renew our offices, because we want them to represent the worth of our Association.
5. Expand our membership base and strengthening AIM’s public role by giving, this year, the new role of “Strategic marketing development and communication of AIM” to Vice president Raffaella Poggio.
A difficult context that requires unity and collective intelligence
The years we are living in are not simple, especially for the metallurgical field.
The increase in energetic prices, the hardships of the automotive field, duties and geopolitical tensions are putting to the test the companies in our field and in others as well.
And yet, in this scenario AIM has a most important role: to be critical mass.
Putting different skills together, encouraging and inspiring discussions, and identifying innovations that our own intelligence, human, real, forged by experiences, vision and collaborative spirit, never fell short of.
The strength of a technical community is put to the test exactly in moments like these, in its sharing knowledge and interpreting changes abilities.
The value of new generation and ongoing education
In these years, AIM saw an increase in junior associates, and most of them found a welcoming, reliable, and exciting space in our conventions and in our Study groups.
For young people that are entering the workforce today, in a world marked by weaknesses and uncertainty, AIM could represent a place of orientation, confrontation, and where they can build their own future.
un dialogo costante tra generazioni.
I Centri di Studio: la nostra spina dorsale
Desidero rinnovare la mia gratitudine ai Presidenti dei Centri di Studio e ai loro collaboratori. Sono tutti loro che, con competenza e dedizione, osservano l’evoluzione tecnologica, colgono i bisogni emergenti e li trasformano in giornate di studio, convegni, percorsi formativi e momenti di confronto di altissimo livello.
Grazie a loro AIM continua a essere un punto di riferimento nazionale e internazionale nel settore metallurgico.
Innovazione: tra tradizione e futuro digitale
Durante il mio mandato, ho più volte sottolineato come l’avanzare dell’Intelligenza Artificiale rappresenti un’opportunità, non una minaccia.
Nel mondo della metallurgia, così come nella comunicazione, nella formazione e nella gestione dei processi, l’IA può diventare uno strumento al servizio dell’uomo, capace di ampliare le capacità decisionali e accelerare l’innovazione.
Il nostro compito, come Associazione, è quello di accompagnare questo cambiamento con competenza, realismo e visione del futuro, evitando entusiasmi frenetici, ma anche resistenze improduttive.
Come da sempre il futuro sarà di chi saprà integrare tradizione e innovazione, con esattezza, rapidità e visibilità, guardando sempre oltre la curva.
Una comunità che ha ancora molto da dare
Guardando a questi anni, sento forte la consapevolezza di aver condiviso con voi un percorso intenso e ricco di soddisfazioni.
Ma soprattutto sento che AIM ha davanti a sé una nuova fase di crescita tra molteplicità e coerenza di obiettivi:
• nei contenuti scientifici,
• nelle attività formative,
• nell’apertura verso i giovani,
• nell’evoluzione della rivista,
• nell’interpretazione delle sfide che il settore metallurgico dovrà affrontare,
• nel marketing e comunicazione.
We will keep supporting their engagement so that they couldbecomeprotagonistsoftomorrow’smetallurgical world, in a constant dialogue between generations.
Study groups: our spine
I wish to reconfirm my deepest gratitude to the Presidents of Study groups and their collaborators. Every one of them watches closely the technological evolution, with competence and dedication, gathers the emerging needs and transforms them in study days, conferences, training courses, and moments of confrontation of the highest level.
Thanks to them, AIM continues to be a national and international reference point in the metallurgical field.
Innovation: between tradition and digital future
During my mandate, I have pointed out more than once that the deployment of Artificial Intelligence is an opportunity, not a threat.
In the metallurgical world, as well as in the communications and training ones, and in the management of processes, AI could become an instrument at the service of man, capable of expand decision-making process and speed up innovation.
As Association, our duty is to support these changes with competence, pragmatism and a clear vision of the future, without being carried out but also avoiding unproductive resistance.
The future will belong to the ones that will be able to integrate tradition and innovation, with precision, swiftness and visibility, looking beyond the curve, as it always has been.
A community that still has a lot to do
Looking at these past years, I am fully aware that I shared with you an intense and successful path.
But I mostly feel that AIM has in front of it a new growth phase between variety and consistency of objectives:
• scientific content,
• training activities,
• openness towards young people,
• evolution of our journal,
Il mio mandato si avvicina alla conclusione, ma non il mio impegno verso l’Associazione.
Continuerò, come faccio da cinquant’anni, a sostenere AIM con la stessa passione di sempre, forte della convinzione che solo insieme possiamo superare le complessità del presente e costruire un futuro ancor più solido per la nostra comunità.
Conclusione
Vi ringrazio, di cuore, per la fiducia, la partecipazione e l’energia che avete donato all’AIM in questi anni. Siamo una grande Associazione, fatta di donne e uomini competenti, appassionati e generosi.
Che il 2026 sia per tutti noi un anno di nuove scoperte, di collaborazione autentica e di crescita personale e professionale.
E che la felicità, come amo dire, accompagni le nostre vite, dentro e fuori l’Associazione.
Con sincera stima, Silvano Panza
• interpreting the challenges that the metallurgical field must face,
• marketing and communication.
My mandate is approaching its conclusion, but my dedication to the Association does not end here.
I will keep supporting AIM, as I have been doing for the past fifty years, with the same passion, strongly convinced that we can overcome the difficulties of the present only together and build a stronger future for our community.
Conclusion
From the bottom of my heart, I thank you for the trust, the involvement and the energy that you poured in AIM in these years. We are a great Association, made of competentwomenandmen,enthusiasticandgenerous. May 2026 be a year of new discoveries, of authentic collaboration and of personal and professional growth for us all.
And as I often like to say, may happiness accompany our lives, in and outside the Association.
With sincere regards, Silvano Panza


Convegno N azionale

Gli interessati a presentare memorie scientifiche dovranno inviare entro il 31 marzo 2026, il titolo della memoria, i nomi degli autori e la loro affiliazione ed un sommario di circa 300 parole. Ci sono due modi per sottoporre le proposte di memorie:
• compilando il form online presente sul sito dell’evento: www.aimnet.it/nazionaleaim
• inviando tutte le informazioni (titolo, autori con affiliazioni, recapiti del relatore e sommario) a mezzo e-mail: info@aimnet.it
Invio titolo e riassunti
Notifica accettazione
Apertura iscrizioni
Invio dei testi completi
31 marzo 2026
15 maggio 2026
15 maggio 2026
10 luglio 2026
Hardness testing is a key procedure in materials science for evaluating mechanical properties and process quality. Traditional Vickers hardness measurement relies on manual identification of indentation diagonals, a process that is slow, subjective, and prone to variability. This work introduces a deep learning-based pipeline for fully automated Vickers hardness measurement, combining instance segmentation via Mask R-CNN with sub-pixel geometric fitting for diagonal extraction. A dataset of 403 micrographs of samples under loads from 10 gf to 2000 gf was assembled and annotated for training and validation. Hyperparameter optimisation was performed using a Taguchi design of experiments, and the final model achieved near-perfect segmentation accuracy (overall AP ≈ 90.5%) on the test set. Measurement accuracy was assessed against manual ground truth, yielding mean relative errors of 1.6-1.9% for the two diagonals, with most cases within 2-3%. These results demonstrate that the proposed system provides robust detection, high metrological precision, and reproducible performance across diverse imaging conditions, paving the way for reliable, high-throughput hardness testing in industrial and research settings.
Hardness testing remains a fundamental procedure in materials science and engineering for assessing material quality, mechanical properties and process efficacy [1]. This method employs a pyramidal diamond indenter with a 136° angle, and the resulting hardness number is derived from the applied test force (F) and the measured average diagonal length (d) of the approximately squareshaped indentation [2]. Hardness testing is valuable because the measured metric tends to correlate with key mechanical properties such as tensile strength, ductility and wear resistance, thus providing information on the effects of thermomechanical processing [1, 2]. Accurate measurement of the indentation diagonal in the Vickers test is essential: owing to the quadratic dependence on the diagonal length, any error in its measure is amplified in the final value [2].
Although routine, manual measurement of Vickers indentations has its drawbacks. The process is tedious and repetitive, and for each indentation it may take
a couple of minutes, making it impractical for highthroughput settings. Moreover, when an operator measures the diagonal length, the result depends on their viewpoint, skill and fatigue, which introduces subjectivity and variability [1, 3, 4]. In addition, the specimen and image quality add complications: the indentation edges are not always sharply defined and may appear more like shadows than crisp lines. Real-world conditions further undermine accuracy: variable lighting, reflective or rough surfaces, etching marks, and defects such as grooves, cracks or pile-up/sink-in around the indent all affect the measurement [1, 3, 4].
Classical automated methods based on traditional computer-vision techniques, such as image thresholding, edge detection or Hough-transform-based approaches, can be useful but face limitations in many practical indentation-measurement settings [5, 6, 7, 8, 9, 10]. For example, thresholding often works when the indentation contrasts cleanly with the background, but it becomes unreliable if illumination is uneven or the contrast is low. Similarly, Hough-transform or straight-edge detectors may yield acceptable results when indentation boundaries are crisp and well aligned, but their accuracy decreases when the actual boundaries are curved (due to pile-up/sink-in or surface preparation) or when the indentation is rotated relative to the image axes. Overall, while these classical techniques can perform adequately under controlled conditions, their robustness across the wide variety of materials, surface finishes and imaging conditions found in industrial practice remains limited. Some improved methods, including active-contour models, focus-assessment routines and custom imageprocessing pipelines, extend capabilities further, but they still often require fine-tuning of parameters (illumination, focus, threshold) and may be sensitive to surface artefacts or process variations [11, 12, 13, 14].
To overcome the robustness limitations of classical automation, Convolutional Neural Networks (CNNs) have been increasingly investigated for Vickers and Brinell indentation analysis, offering improved automatic feature extraction capabilities [15, 16, 17, 18, 19, 20, 21]. Approaches vary from directly predicting the Vickers hardness value via regression to image-processing
pipelines utilising CNNs or Fully Convolutional Networks (FCNs) for indentation localisation and segmentation. Object detection models such as Faster R-CNN- or YOLO-based variants have been employed to predict the indentation as a bounding box, typically as an intermediate localisation step within broader pipelines [16,17]. While effective for initial localisation, the bounding-box approach fundamentally limits precision, especially for slightly rotated or irregularly shaped indentations, as it does not capture pixel-level contour information that is essential for accurate metrology [6,16]. Other segmentation-based methods, including FCNs and active-contour-assisted schemes, aim to predict pixellevel masks and achieve good performance in controlled conditions [6, 8, 16]. However, in practical metallographic micrographs, the imprint boundary can be degraded by heterogeneous microstructures, polishing scratches, debris, and pile-up/sink-in effects, so that the limiting factor becomes accurate boundary delineation rather than coarse localisation. In these cases, semantic masks or corner-only regression may under-represent locally distorted or concave edges, and small boundary errors can propagate nonlinearly into diagonal estimation and hardness due to the quadratic dependence on diagonal length. Deep learning approaches in general have shown clear potential for automating hardness indentation evaluation, but many reported studies focus on either relatively small datasets or in ideal conditions (e.g. reference hardness blocks under controlled imaging), so their behaviour on more heterogeneous materials remains less systematically explored [11,14,16,17]. Table 1 summarises the main recent deep-learning approaches and compares them with the present work.
The goal of this work is to present a robust, pragmatic, and high-accuracy pipeline for automatic Vickers hardness test detection and analysis. We achieve this by combining the precision of a Mask R-CNN-based instance segmentation model for pixel-accurate indentation boundary detection with a dedicated geometric fitting procedure for diagonal extraction. Mask R-CNN, an instance segmentation framework, provides precise segmentation masks superior to bounding-box approximations or corneronly detection, thereby addressing the crucial problem
of accurate boundary delineation in noisy images [22]. To ensure the robustness and reproducibility of the system’s performance across diverse operational settings, we systematically investigate the influence of various training conditions using a Taguchi L16 Design of Experiments (DoE) approach [23, 24]. This paper presents this integrated methodology as a demonstrated, alternative, and practical route to achieve objective and reliable automatic Vickers test detection and hardness values measurement.
Tab.1 - Comparison of recent deep-learning approaches for automated Vickers indentation analysis, reporting architecture, diagonal (or hardness) extraction strategy, dataset setting, and the main accuracy metric as reported in each study.
Study Architecture
Tanaka et al. (2020) [17]
Dual CNN (rough BB + corner refinement)
Jalilian & Uhl (2021) [21] FCN (RefineNet)
Li & Yin (2021) [18]
Cheng et al. (2022) [19]
Privezentsev et al. (2019) [20]
This work
FCN-ED (U-Netbased)
Multi-task learning (MTL) CNN
Hybrid (object detection + image processing)
Mask R-CNN (instance segmentation)
MATERIALS AND METHODS
Dataset Acquisition and Preparation
Diagonal extraction Data (size & setting)
Two-stage regression (pixels)
Linear curve fitting + ROI vertex refinement
Oriented bounding box (OBB) on predicted mask
Direct hardness prediction (regression)
Large datasets (e.g., 4140+2400 and 3840+3200 images)
Two industrial datasets: DA=150, DB=216 images (1280×1024)
Augmented dataset 12,000 (8:1:1 split); boundary annotated via sampled points
105 base indentations; augmented mixed images (train/val/test 5000/500/100); +59 unseen images
Contour selection from detected imprint 108 indentations
Sub-pixel fitting via signed distance fields
A dataset of Vickers microhardness indentations was assembled from laboratory measurements conducted with an FM-180 microindenter by FUTURE-TECH CORP on polished metallic and ceramic samples under different loads, ranging from 10 gf up to 2000 gf. Micrographs were acquired using an optical microscope integrated within the hardness tester. Each image contained one or two indentations exhibiting typical variations in contrast, surface finish, and minor optical artefacts commonly encountered in metallographic imaging. A total of 403 images were collected.
403 images (10–2000 gf); COCO masks
Reported measurement accuracy
Diagonal
7.03 px (DA), 3.24 px (DB)
Geometrical relative MAE < 4%
All micrographs were manually annotated using 4-point polygonal masks tightly enclosing each indentation, through LabelMe. Annotations were exported in COCOcompatible format to enable direct use within the Mask R-CNN framework. The dataset was then divided into independent training (75%), validation (15%), and test (10%) subsets, ensuring that no visually similar images appeared across different splits (three-way split) [25].
Indentation segmentation was performed using a Mask R-CNN architecture [22], employing a ResNet-101 backbone and Feature Pyramid Network (FPN). This
configuration extracts multi-scale features to ensure robustness across indentation sizes, enabling the twostage pipeline to jointly localise and segment instances at the pixel level.
This design, originally proposed for high-precision instance segmentation tasks, is particularly suitable for Vickers impressions, where accurate delineation of the indentation edges is required for geometric measurement. Compared with single-stage object detectors, the two-stage Mask R-CNN paradigm typically provides higher segmentation fidelity, which is essential for the subsequent extraction of diagonals. The network weights were initialised from a COCOpretrained model to leverage generic visual features. Only one object class (“indentation”) was used.
The objective of training was to obtain high-fidelity segmentation masks while maintaining sufficient recall to detect all impressions present in an image. Hyperparameters influencing convergence and mask quality were explored through a structured Taguchi design of experiments (L16(44)) [26], enabling systematic variation of four key factors: learning rate, weight decay, number of training epochs, and the RPN non-maximum suppression threshold. This design allowed systematic sampling of the hyperparameter space while limiting the total number of training runs to sixteen. Each configuration (see table 2) was trained independently on the same train/validation split, and segmentation performance was quantified on the validation set using the COCO mask average precision (segmAP).
To ensure that performance differences observed across the DoE were not attributable to stochastic
training variability, each of the sixteen hyperparameter configurations was trained three times with different random seeds; occasional unstable runs were discarded and replaced with the mean of the corresponding stable repetitions. The three validation scores obtained for each configuration were then aggregated (mean and variance), providing a more reliable estimate of the true performance associated with each hyperparameter combination.
The hyperparameter configuration yielding the highest validation segmentation accuracy was selected for final training. The final model was retrained on the combined training and validation sets using the optimal configuration identified through the Taguchi analysis and compared against the baseline model (retrained on the same combined training and validation data).
After instance segmentation, each detected indentation mask was processed by a geometric fitting routine to recover the two Vickers diagonals using the OpenCV library [27]. For each detected indentation mask, a signed distance field was computed from the binary region using standard distance-transform formulations [28], [29], and the 0-level isocontour was extracted via a marching squares scheme [30]. The resulting sub-pixel contour was partitioned into four arcs using the top, bottom, left, and right extrema, each arc corresponding to one side of the rhomboidal imprint. A straight line was then fitted to each arc using an orthogonal (total least-squares) regression [31]. Intersections between adjacent fitted lines yielded four sub-pixel vertices of the indentation.
The two Vickers diagonals were obtained from opposite vertex pairs. Their arithmetic mean, d, was used in the standard Vickers hardness as in equation 1 [2]:
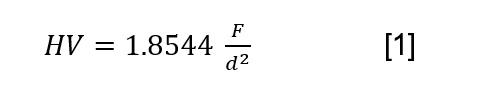
Where F is the applied load in kgf and d is expressed in mm.
Basic quality-control criteria were applied, excluding cases
where the predicted shape was excessively distorted, too small for reliable measurement, or located near the image boundary. Surviving instances were retained for hardness computation and downstream analysis.
Tab.2 - Taguchi Design of Experiment employed for the hyperparameter optimisation.
Evaluation Protocol
Segmentation performance was evaluated using COCO mask average precision (segmAP). During the hyperparameter study, the mean validation segmAP over three training seeds was used as the response variable for each Taguchi configuration, with standard deviation as an indicator of stability. For the baseline and final models, segmAP and size-specific APs (AP50, AP75, APs, APm, APl) were computed on the independent test set. Diagonal-measurement accuracy was assessed on the test subset with manual reference diagonals as ground truth. For each detected indentation, d1 and d2 were compared through absolute and relative errors, tolerance-band
statistics, correlation coefficients and Bland-Altman analysis. An additional multiphase microstructure example was used to show the model performance; the pixel-to-micron conversion was manually calculated from the scale bar in the image and given to the code as input.
model training
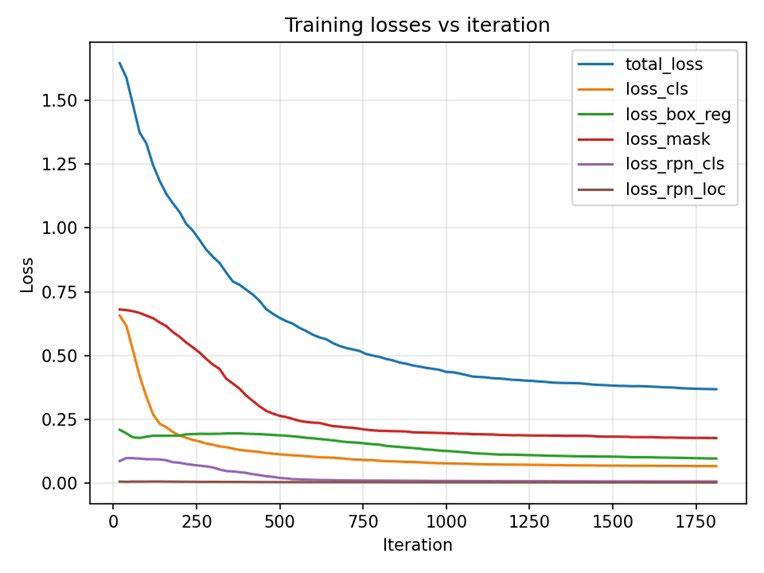
The baseline Mask R-CNN model was first trained using the default hyperparameter configuration described in the Methods section. The training progressed smoothly, as shown in figure 1, with all loss components decaying
monotonically and stabilising after the first few hundred iterations. The absence of oscillations or divergence indicates a well-behaved optimisation process even without any hyperparameter tuning.
On the validation set, the baseline model reached a segmentation AP above 86%, with almost perfect AP50 and
AP75 above 97%, confirming that a standard configuration already provides robust indentation detection (tab. 3). Size-specific APs also remained consistently high, suggesting that the network generalised well across the typical range of indentation dimensions encountered in the dataset.
Hyperparameters optimisation (Taguchi DoE)
Across the 16 Taguchi configurations, the mean validation AP spanned a wide range, from mid-84% for the weakest settings to more than 93% for the best-performing ones. This substantial spread already indicates a strong dependence of segmentation accuracy on the chosen hyperparameters. For each configuration, the average AP and its standard deviation across seeds are reported in table 4. High-performing runs generally exhibit low variability,
whereas lower-performing setups show larger fluctuations or, in a few cases, instability. Divergence occurred in two repetitions of run 14 and in one repetition of run 15, exclusively in configurations combining relatively high learning rates with short training schedules or insufficient optimisation time. These unstable repetitions were excluded and replaced by the mean of the valid runs.
The ANOVA (tab. 5) identifies max_epochs as the dominant factor (F ≈ 9.51, p ≈ 0.048), and the main-effects re-
sponse table (fig. 2) confirms this, showing the largest Δ (≈ 6.7 AP points) and a strong monotonic increase in performance from 5 to 20 epochs. The RPN NMS threshold is the second most influential factor, with a Δ ≈ 3.1 AP points. Intermediate NMS levels provide the best balance between suppressing redundant proposals and retaining closely spaced indentations.
In contrast, base learning rate and weight decay show considerably smaller Δ values (≈ 1.9 and 1.3 AP points, respectively) and no statistically significant effects in the ANOVA (p > 0.5 for both). The small coefficients of these
terms in the linear model further confirm that, within the tested ranges, the model is relatively insensitive to moderate variations of these two parameters. Overall, the response analysis demonstrates that adequate training duration and appropriate NMS filtering are the key drivers of segmentation performance, while learning rate and weight decay exert only secondary, fine-tuning effects. Accordingly, the best-performing configuration identified by the Taguchi design corresponds to a learning rate of 0.007, a weight decay of 3.35 × 10⁻⁴, a training schedule of 20 epochs and an RPN NMS threshold of 0.30.
- Analysis of variance (ANOVA) for the Taguchi design.

Best model training and comparison with baseline
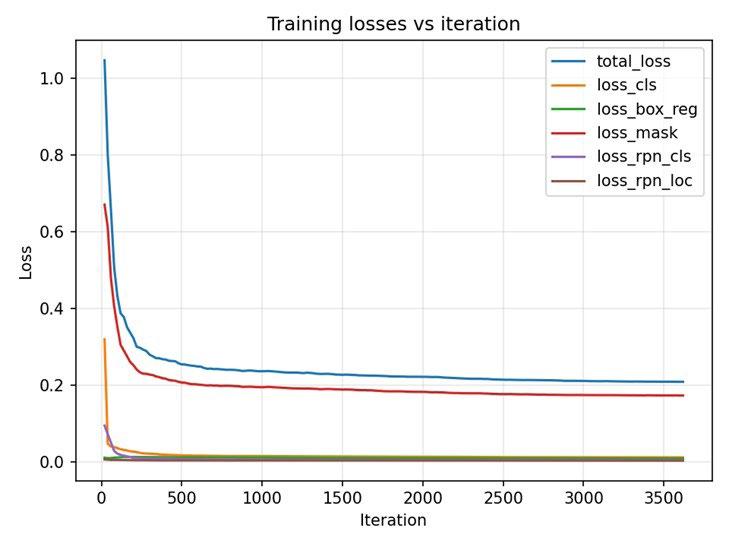
The best-performing hyperparameter configuration identified by the Taguchi design was then used to retrain the final Mask R-CNN model on the combined training and validation sets. A direct comparison of the training dynamics in figure 3 highlights the substantial impact of this optimisation on the learning behaviour. In the baseline run (letft panel), convergence is relatively gradual: the total loss decreases slowly and requires on the order of 1000 iterations to reach a stable plateau at about 0.38. By contrast, the optimised model (right panel) exhibits much more efficient learning, with the total loss dropping
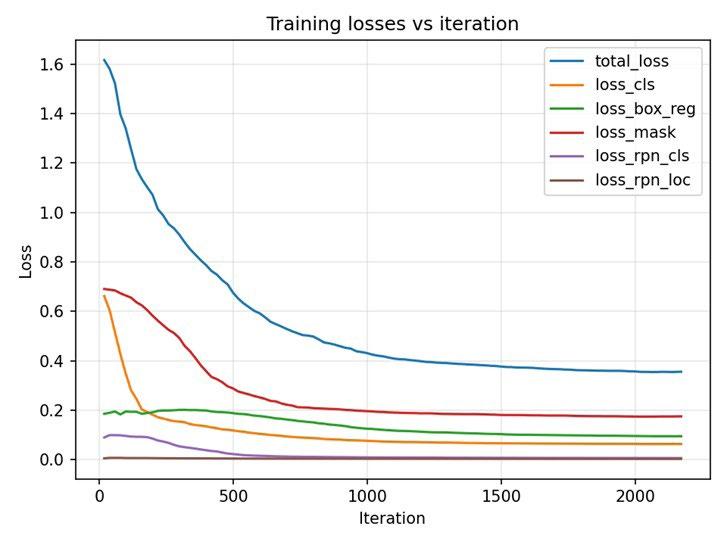
steeply within the first ≈250 iterations and stabilising at a markedly lower value, close to 0.20.
In addition to this overall reduction, the mask loss remains consistently lower for the optimised configuration throughout training. This indicates that the tuned hyperparameters enable the network to resolve indentation boundaries with higher fidelity and confidence, effectively reducing pixel-level segmentation errors that would otherwise propagate into the diagonal measurements and, ultimately, into the computed hardness values.
Even in its baseline configuration, the Mask R-CNN demonstrates strong segmentation capabilities: it consistently detects indentation regions and produces masks that align reasonably well with the true imprint geometry. This behaviour is evident in the top panel of figure 4, where the baseline model correctly identifies and segments most indentations, yielding visually coherent masks for medium and large imprints.
However, qualitative inspection also highlights clear limitations of the baseline model, particularly on more challenging samples. In low-contrast regions or in the presence of strong background texture, polishing scratches or debris, the predicted boundaries tend to be slightly irregular and, in some cases, the model produces spurious detections. While these issues do not drastically undermine average performance, they are critical from an operational standpoint: in an industrial context, the system must be highly reliable, and any false positive or irregular mask is unacceptable, as it directly corrupts the subsequent diagonal estimation and hardness computation.
The optimised model, obtained through the Taguchi hyperparameter exploration and final retraining, mitigates these weaknesses. The bottom panel of figure 4 shows the corresponding predictions from the best model for the same three test images. In the first example, the optimised model produces a cleaner and more tightly aligned mask around the indentation edges, markedly reducing the small boundary irregularities still visible in the baseline output. In the second, more challenging example, where the baseline model produced two false positives, the optimised model correctly identifies a single indentation with no spurious detections. In the third example, representing a large and well-defined imprint, both models perform well, but the optimised model exhibits sharper contour definition and a more consistent alignment between the mask and the underlying imprint geometry.
Quantitatively, the optimised configuration delivers a clear and consistent improvement over the baseline on the test subset, as summarised in table 6. In the COCO framework, the overall AP is the primary summary metric: it averages
detection performance over a range of IoU thresholds (typically from 0.50 to 0.95), so it rewards models that are not only able to detect objects but also to delineate them accurately across different levels of overlap. A higher AP therefore indicates a globally more reliable segmentation behaviour, both in terms of finding indentations and in terms of matching their true shape.
The individual components AP50 and AP75 provide additional insight. The first measures performance at a relatively loose overlap threshold (IoU ≥ 0.5), reflecting the ability of the model to locate indentations in approximately the right position. AP75, computed at a stricter threshold (IoU ≥ 0.75), is more sensitive to precise contour alignment and boundary quality. In our case, both models already reach perfect AP50, indicating that almost all indentations are detected without gross localisation errors. The advantage of the optimised model emerges at higher IoU and in the global AP: AP75 reaches essentially perfect levels, and the mean AP increases, showing that the optimised network segments indentation contours more accurately rather than merely “finding” them.
Size-specific metrics APs, APm and APl further characterise the behaviour across different indentation sizes, grouping small, medium and large imprints, respectively. Improvements in APs and AP m are particularly relevant here, because smaller and medium-sized indentations are more susceptible to noise, contrast variations and polishing artefacts. The optimised model achieves higher AP s and APm, indicating more robust performance on these more difficult cases, while APl also increases, confirming that large, well-defined imprints are segmented with very high fidelity.
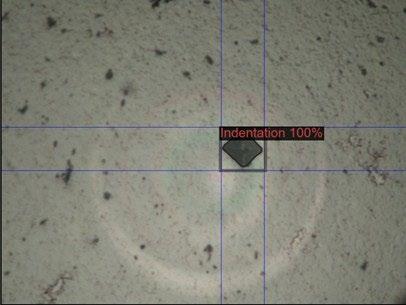
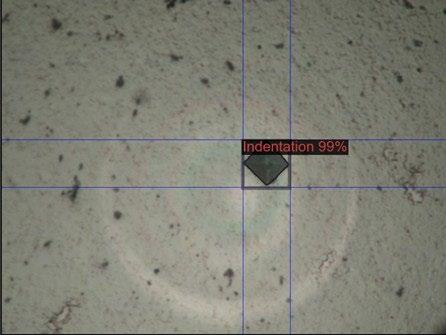
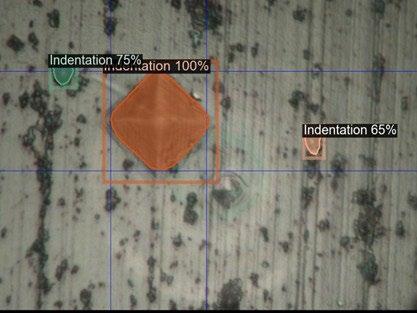
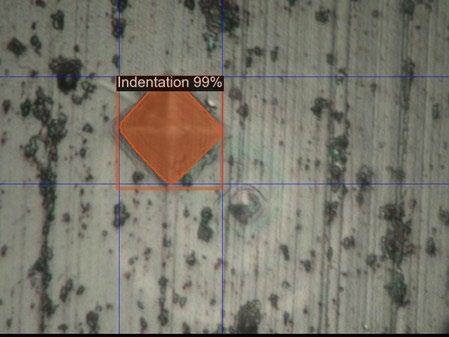
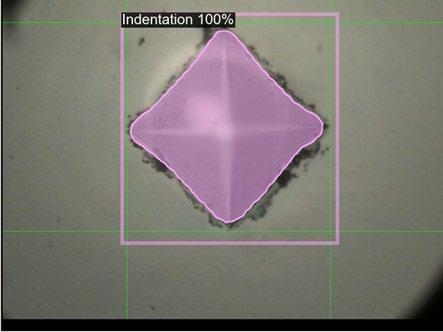
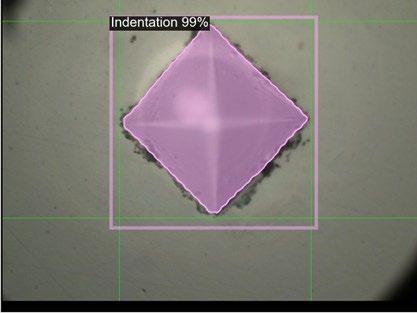
Fig.4-Qualitativecomparisonofsegmentationresults:toprow-baselinemodel;bottomrow-optimised model.
Tab.6-Comparisonofsegmentationperformancebetweenthebaselineandoptimisedmodelsonthetest subset
Baseline and Optimal on test subset
RunsegmAP [%]AP50 [%]AP75 [%]APs [%]APm [%]APl [%]
The agreement between automatic and manual diagonal measurements is consistently high and remains stable across the full range of indentation sizes. As shown in the scatter plots (fig. 5), the predicted diagonal lengths follow the ground-truth values almost perfectly, with no evident scale-dependent deviations from the identity line. This linear behaviour is confirmed quantitatively by the determination coefficients (R² > 0.998 for both d1 and d2; tab. 7), demonstrating that the model generalises effectively across different magnifications and indentation sizes rather than regressing toward an average value learned from the training set. The error distribution relative to practical tolerances is
reported in table 8. Approximately 70% of all indentations fall within a strict ±2% relative error, while relaxing the tolerance to ±5%, a range often cited as the inter-operator variability band in manual Vickers testing [4, 32], raises the acceptance rate to about 94% for d1 and ≈88% for d2. Beyond ±10%, the method essentially saturates, covering more than 99% of cases. The low median relative error (≈1.2–1.3%), compared with the slightly higher mean relative error (≈1.8–2.0%), indicates a mildly right-skewed distribution: typical predictions are highly accurate, and the mean is affected primarily by a small number of challenging images rather than by systematic model drift.
Tab.7 - Summary of diagonal-measurement accuracy for the best-performing model. Metrics are averaged across repetitions and reported with standard deviations. MAE, median absolute error (MEDAE) and P95 refer to relative errors; R² quantifies the agreement between predicted and reference diagonals; Bland–Altman statistics are reported as mean bias and limits of agreement (LOA), expressed in both pixels and relative terms.
Diagonal Measurement Accuracy (Absolute & Relative Errors, Correlation, Bland–Altman)
Tab.8 - Fraction of predicted diagonals falling within ±2%, ±5% and ±10% of the manual reference, averaged across.
The Bland-Altman analysis (fig. 5) clarifies the nature of these deviations. The mean bias is negligible (about +1 pixel for d1 and approximately 0 pixels for d2), showing that the segmentation step does not consistently enlarge or shrink the indentation outlines. The limits of agreement remain roughly constant across the full range of diagonal lengths (on the order of ± 6-8 px), meaning that the magnitude of the errors does not systematically increase for larger or smaller indentations. This behaviour indicates that most discrepancies arise from local, pixellevel uncertainty at the indentation edges rather than from any scaling distortion or drift in the geometric fitting. Because this pixel-level uncertainty is essentially constant, its relative impact is naturally higher for very small indentations, which explains the few outliers in the error distribution.
A modest asymmetry is observed between the two diagonals: d1 consistently shows slightly narrower limits of agreement than d2. Nevertheless, both diagonals achieve extremely high linear agreement, and the correlation for d2 remains above R² = 0.998, fully consistent with the behaviour observed for d1.
Finally, given that Vickers hardness is inversely proportional to the square of the diagonal, the observed error magnitudes (MAE(d1) = 2.3±0.3 px; MAE(d2) = 2.7±0.3 px) translate into modest and well-bounded variations in the computed HV. In practical terms, the automatic system delivers a measurement repeatability that matches, and in many cases may exceed, the consistency of manual microscopic readings.
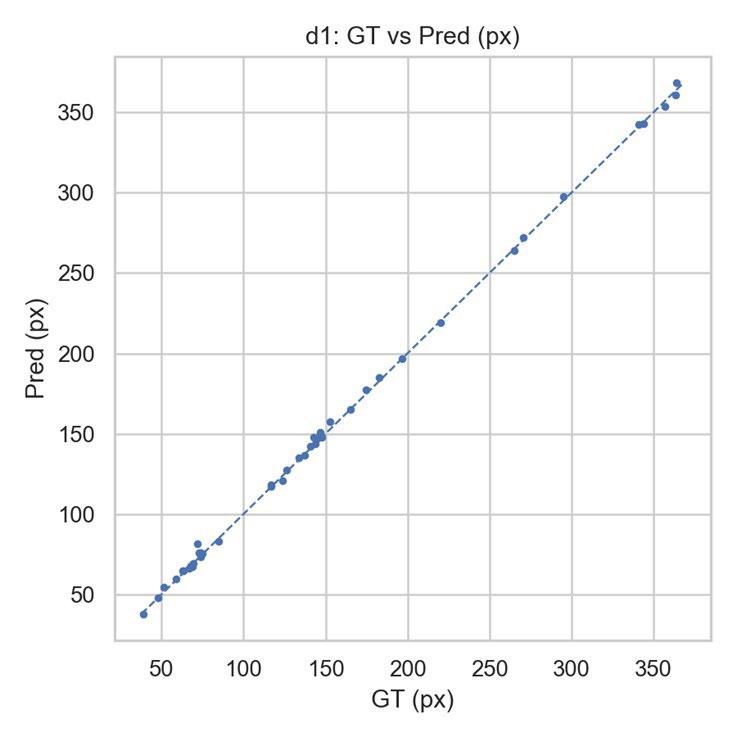
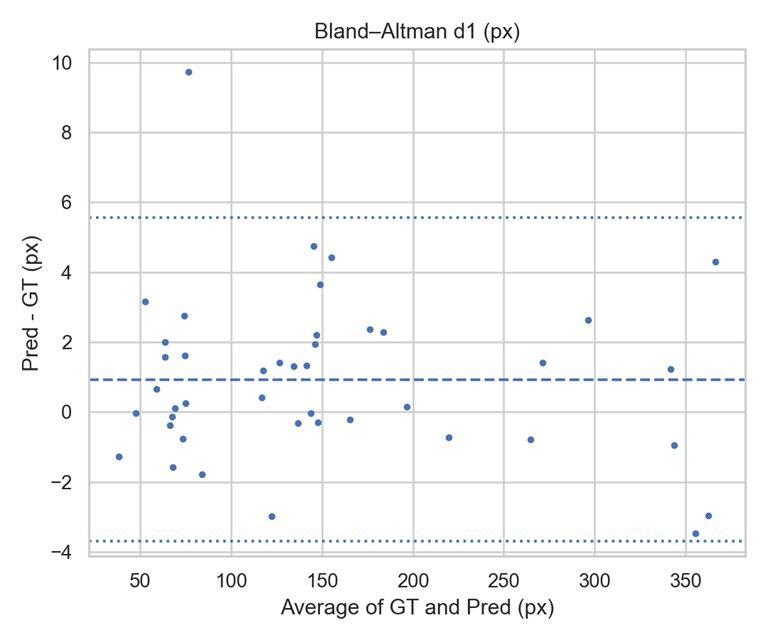
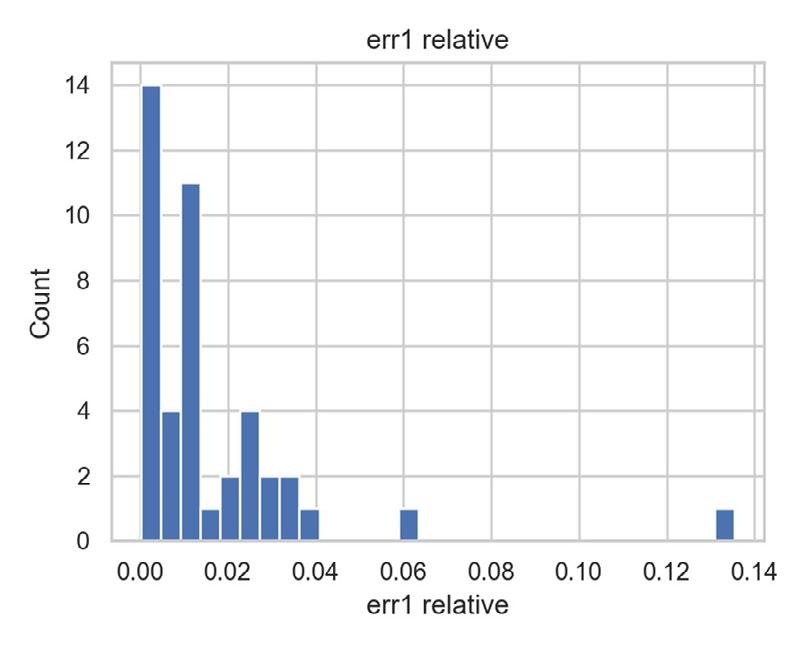
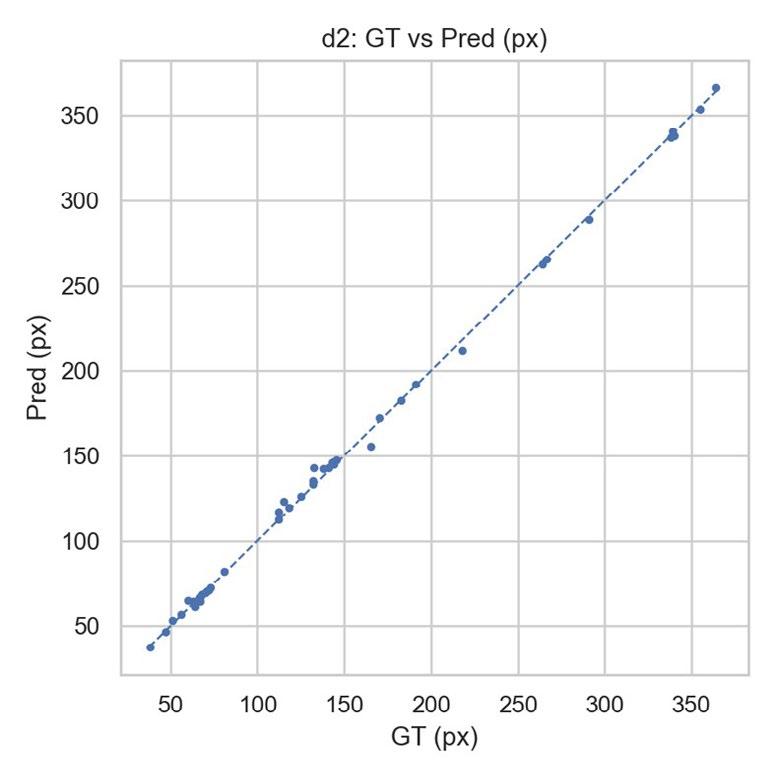
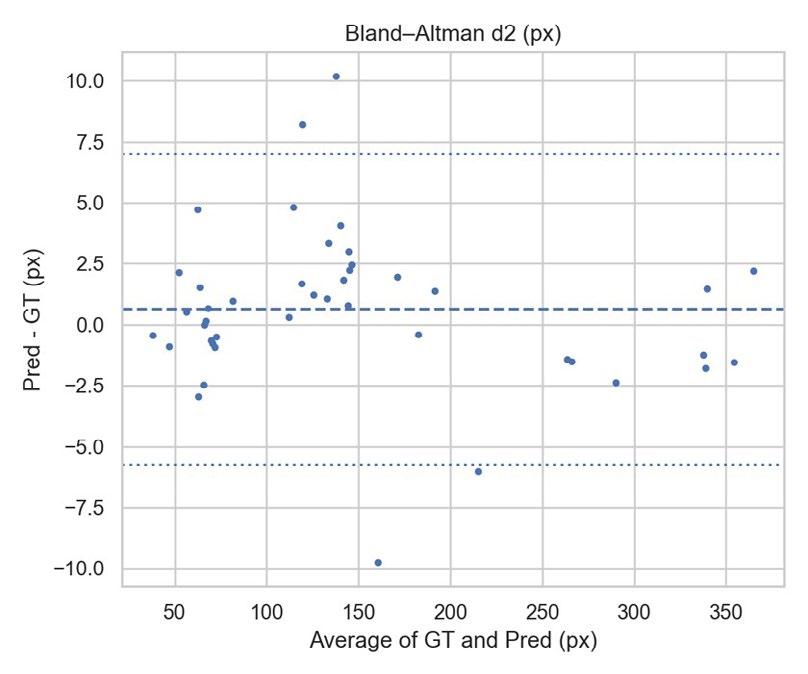
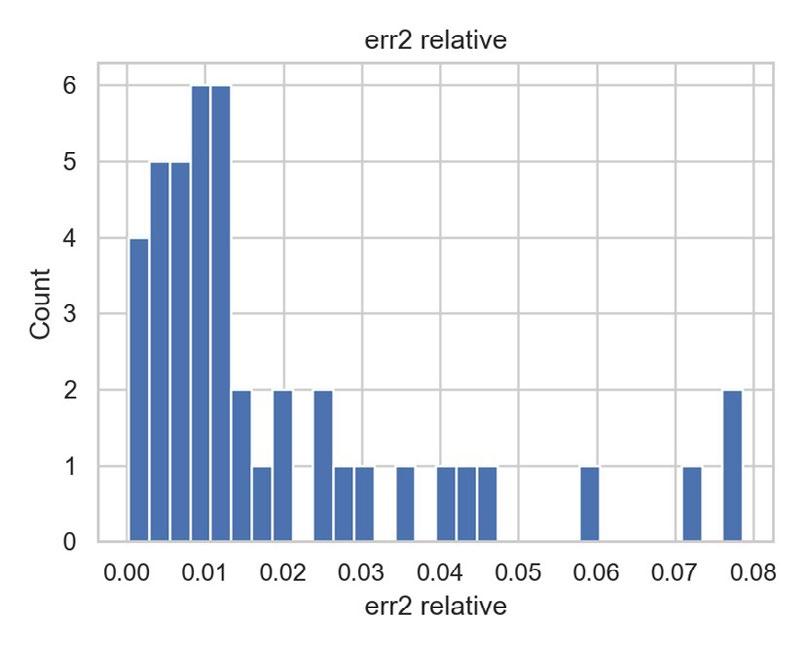
Fig.5 - Metrological validation of the diagonals for a single repetition (seed 65). (Top) Scatter plot comparing the automatic predictions against the manual ground truth measurements. (Middle) Bland–Altman plot displaying the measurement differences against the average of the two methods, indicating the systematic bias (dashed line) and limits of agreement (dotted lines). (Bottom) Histogram showing the frequency distribution of the relative errors.
Implementation example
To demonstrate the model’s capability in a realistic metallurgical workflow, the pipeline was tested on an optical micrograph of a MIG soldering pool in S355 steel. The image was acquired from a polished crosssection without etching, and it exhibits marked surface heterogeneity, including polishing scratches and strong phase/reflectivity contrast. In this demonstrative case only,
the pixel-to-micron conversion was obtained manually from the image scale bar and provided as input to compute hardness values in HV units. As illustrated in figure 6, the system successfully detected all four indentations, effectively distinguishing the imprints from background artefacts that typically confound standard thresholding or edge-detection algorithms. The quantitative comparison between the hardness values obtained by automated (HV_ AI) and manual (HV_GT) indentation detection is detailed
in table 9. The system maintained high metrological accuracy even in this complex landscape, with relative errors ranging from -0.99% (ID 01) to -3.98% (ID 03).
The observed Δ% values (≈1–4%) are consistent with the diagonal error distributions reported in the tables 7-8. These results indicate that the segmentation network is sufficiently robust to handle the optical noise and texture variations inherent to routine metallographic inspections of industrial alloys.
Tab.9 - Vickers hardness values calculated by the AI model (HV_AI) compared to the ground truth (HV_GT) manually measured for the indentations in figure 6 and the respective percentage variation.
HV comparison
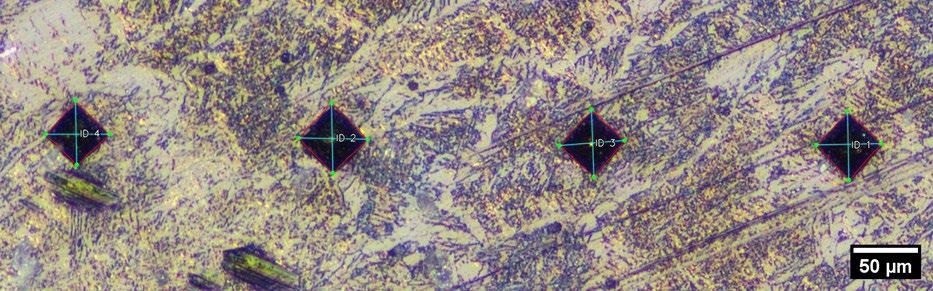
Fig.6 - Example of ML-backed indentations detection and Vickers hardness analysis performed on a multiphasic microstructure with multiple indentations and surface defects.
This work presented a robust, deep learning-based framework for fully automated Vickers hardness indentation detection and values calculation, effectively addressing the limitations of subjectivity and low throughput inherent to manual testing. By integrating a Mask R-CNN architecture with a rigorous Taguchi-
based hyperparameter optimisation, the system achieved precise instance segmentation even under challenging imaging conditions. The experimental analysis showed that training duration and non-maximum suppression thresholds are the critical factors driving segmentation performance, whereas the model proved relatively insensitive to minor variations in learning rate.
Metrological validation against manual ground truth confirmed the system’s high accuracy and reliability. The automated diagonal measurements exhibit relative errors consistently confined within narrow industrial tolerances (±5% for most cases). Importantly, the pipeline demonstrates scale invariance and robustness against surface defects, effectively bridging the gap between academic computer vision and practical laboratory requirements.
The code developed and the dataset used for this study are not publicly available at this time, as they constitute the basis for several ongoing and planned research works. The dataset used in this study was collected internally and is therefore not publicly released. Reasonable requests for methodological clarification may be addressed by the corresponding authors.
[1] I. C. Leigh, “Micro-indentation hardness test: The practical realization of a standard,” Ph.D. thesis, University of Surrey, 1983.
[2] “Standard Test Methods for Vickers Hardness and Knoop Hardness of Metallic Materials,” ASTM International E92 −23, pp. 1–28, 2023, doi: 10.1520/E0092-23.2.
[3] L. Brice, F. Davis, A. Crawshaw, “Uncertainty in hardness measurement,” NPL Report (CMAM 87), April 2003. [Online]. Available: https://eprintspublications.npl.co.uk/2615/
[4] G. Barbato, S. Desogus, “Problems in the measurement of Vickers and Brinell indentations,” Measurement, vol. 4, no. 4, pp. 137–147, Oct. 1986, doi: 10.1016/0263-2241(86)90006-0.
[5] A. Maier, A. Uhl, “Robust automatic indentation localisation and size approximation for Vickers microindentation hardness indentations,” ISPA 2011 - 7th Int. Symp. Image Signal Process. Anal., pp. 295–300, 2011.
[6] T. Sugimoto, T. Kawaguchi, “Development of an automatic Vickers hardness testing system using image processing technology,” IEEE Trans. Ind. Electron., vol. 44, no. 5, pp. 696–702, 1997, doi: 10.1109/41.633474.
[7] P. P. R. Filho, et al., “Brinell and Vickers Hardness Measurement Using Image Processing and Analysis Techniques,” J. Test. Eval., vol. 38, no. 1, pp. 88–94, Jan. 2010, doi: 10.1520/JTE102220.
[8] A. P. Fedotkin, et al., “Automatic Processing of Microhardness Images Using Computer Vision Methods,” Instruments Exp. Tech., vol. 64, no. 3, pp. 357–362, May 2021, doi: 10.1134/S0020441221030180.
[9] J. M. R. Puente, J. M. R. Garnica, C. A. G. Isáis, “Measuring Hardness System Based on Image Processing,” 2024 21st International Conference on Electrical Engineering, Computing Science and Automatic Control (CCE), IEEE, Oct. 2024, pp. 1–5. doi: 10.1109/ CCE62852.2024.10771036.
[10] Y. Ji, A. Xu, “A New Method for Automatically Measurement of Vickers Hardness Using Thick Line Hough Transform and Least Square Method,” 2009 2nd International Congress on Image and Signal Processing, IEEE, Oct. 2009, pp. 1–4. doi: 10.1109/CISP.2009.5305653.
[11] M. Gadermayr, A. Maier, A. Uhl, “Active contours methods with respect to Vickers indentations,” Mach. Vis. Appl., vol. 24, no. 6, pp. 1183–1196, Aug. 2013, doi: 10.1007/s00138-012-0478-5.
[12] A. Maier, “Efficient focus assessment for a computer vision-based Vickers hardness measurement system,” J. Electron. Imaging, vol. 21, no. 2, p. 021114, May 2012, doi: 10.1117/1.JEI.21.2.021114.
[13] F. D. Lima Moreira et al., “A novel Vickers hardness measurement technique based on Adaptive Balloon Active Contour Method,” Expert Syst. Appl., vol. 45, pp. 294–306, Mar. 2016, doi: 10.1016/j.eswa.2015.09.025.
[14] J. D. Polanco, et al., “Automatic Method for Vickers Hardness Estimation by Image Processing,” J. Imaging, vol. 9, no. 1, p. 8, Dec. 2022, doi: 10.3390/jimaging9010008.
[15] Y. Tanaka, Y. Seino, K. Hattori, “Vickers hardness measurement by using convolutional neural network,” J. Phys. Conf. Ser., vol. 1065, no. 6, p. 062001, Aug. 2018, doi: 10.1088/1742-6596/1065/6/062001.
[16] Y. Tanaka, Y. Seino, K. Hattori, “Measuring Brinell hardness indentation by using a convolutional neural network,” Meas. Sci. Technol., vol. 30, no. 6, p. 065012, Jun. 2019, doi: 10.1088/1361-6501/ab150f.
[17] Y. Tanaka, Y. Seino, K. Hattori, “Automated Vickers hardness measurement using convolutional neural networks,” Int. J. Adv. Manuf. Technol., vol. 109, no. 5–6, pp. 1345–1355, Jul. 2020, doi: 10.1007/s00170-020-05746-4.
[18] Z. Li, F. Yin, “Automated measurement of Vickers hardness using image segmentation with neural networks,” Measurement, vol. 186,, p. 110200, Dec. 2021, doi: 10.1016/j.measurement.2021.110200.
[19] W. S. Cheng, et al.i, “Vickers Hardness Value Test via Multi-Task Learning Convolutional Neural Networks and Image Augmentation,” Appl. Sci., vol. 12, no. 21, p. 10820, Oct. 2022, doi: 10.3390/app122110820.
[20] D. G. Privezentsev, A. L. Zhiznyakov, Y. Y. Kulkov, “Automation of Measuring Microhardness of Materials using MetalGraphic Images,” 2019 International Russian Automation Conference (RusAutoCon), IEEE, Sep. 2019, pp. 1–5. doi: 10.1109/ RUSAUTOCON.2019.8867750.
[21] E. Jalilian, A. Uhl, “Deep Learning Based Automated Vickers Hardness Measurement,” Computer Analysis of Images and Patterns. CAIP 2021. Lecture Notes in Computer Science(), vol 13053. Springer, Cham, 2021, pp. 3–13. doi: 10.1007/978-3-030-89131-2_1.
[22] K. He, G. Gkioxari, P. Dollár, R. Girshick, “Mask R-CNN,” 2018. [Online]. Available: https://arxiv.org/abs/1703.06870
[23] W. Sukthomya, J. Tannock, “The optimisation of neural network parameters using Taguchi’s design of experiments approach: an application in manufacturing process modelling,” Neural Comput. Appl., vol. 14, no. 4, pp. 337–344, Dec. 2005, doi: 10.1007/s00521005-0470-3.
[24] M. S. Packianather, P. R. Drake, H. Rowlands, “Optimizing the parameters of multilayered feedforward neural networks through Taguchi design of experiments,” Qual. Reliab. Eng. Int., vol. 16, no. 6, pp. 461–473, Nov. 2000, doi: 10.1002/1099-1638(200011/12)16:6<461::AIDQRE341>3.0.CO;2-G.
[25] T. Hastie, R. Tibshirani, J. Friedman, “The Elements of Statistical Learning,” Springer Series in Statistics. New York, NY: Springer New York, 2009. doi: 10.1007/978-0-387-84858-7.
[26] G. S. Peace, Taguchi Methods: A Hands-On Approach. Addison-Wesley, 1992.
[27] G. Bradski, “The OpenCV Library,” Dr. Dobb’s J. Softw. Tools, 2000.
[28] G. Borgefors, “Distance transformations in digital images,” Comput. Vision, Graph. Image Process., vol. 34, no. 3, pp. 344–371, Jun. 1986, doi: 10.1016/S0734-189X(86)80047-0.
[29] G. J. Grevera, “The ‘dead reckoning’ signed distance transform,” Comput. Vis. Image Underst., vol. 95, no. 3, pp. 317–333, Sep. 2004, doi: 10.1016/j.cviu.2004.05.002.
[30] W. E. Lorensen, H. E. Cline, “Marching cubes: A high resolution 3D surface construction algorithm,” ACM SIGGRAPH Comput. Graph., vol. 21, no. 4, pp. 163–169, Aug. 1987, doi: 10.1145/37402.37422.
[31] S. Van Huffel, J. Vandewalle, “The Total Least Squares Problem,” Society for Industrial and Applied Mathematics, 1991. doi: 10.1137/1.9781611971002.
[32] G. F. Vander Voort, G. M. Lucas, “Microindentation Hardness Testing,” Mechanical Testing and Evaluation, ASM International, 2000, pp. 221–231. doi: 10.31399/asm.hb.v08.a0003272.
ulti-plant knowledge sharing in decision supportfor electric steelmakingand beyond
P.Kannisto, B. Kleimt, A. Chandgude, N. García, I. Guardiola, R. Lazcano, C. Perea, S. Dettori, A.Zaccara, L. Vannini, V. Colla, D. Blazquez, B. Fernandez, I. Garcia
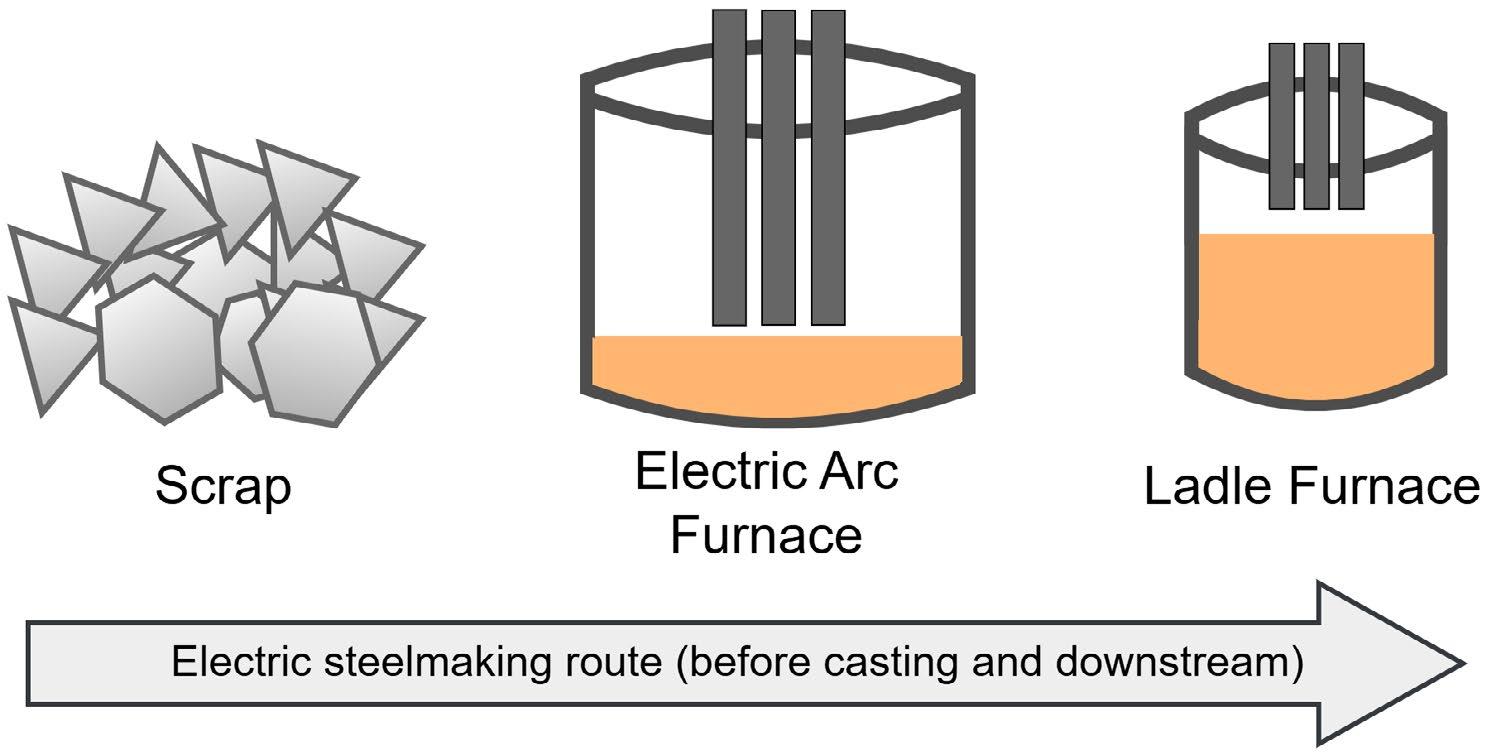
The processes of electric steelmaking are complex and difficult to control to achieve sustainable production. To strive towards competitiveness and green transformation, steelmakers apply the Electric Arc Furnace (EAF) to circulate scrap into new products. This saves resources compared to iron-ore-based production, enabling both circular economy and green energy sources. However, efficient EAF operation faces difficulties in state monitoring and control decisions. Fortunately, the control can be facilitated with optimization based on Artificial Intelligence (AI) and Digital Twins (DT). Still, DT accuracy can suffer from input data fluctuation or coverage limitations in development and validation datasets. The fluctuation stems from the environment-related variation, especially the scattering and not-exactly-known chemical composition of secondary raw materials. For decision support, this work suggests a DT framework with Federated Learning (FL) for multi-plant schemes, focusing on electric steelmaking. The framework can deliver both historical data and message-oriented online data to the DTs. It builds upon a container orchestration system (Kubernetes) for software lifecycle management and resource scaling. Importantly, the framework implements FL to exploit network-wide knowledge. That is, the DTs share knowledge with a centralized server that aggregates a global model distributed to the participants, broadening data diversity. Still, all data remain local, which preserves privacy.
The framework applies FL for two types of process DTs, EAF and the subsequent Ladle Furnace (LF). FL can optimize EAF parameters although EAF is not AI but a dynamic model. Conversely, the LF model is composed of a set of neural networks. The results from a prototype system with actual data prove the concept. Firstly, the DTs accurately estimate process variables online, such as the chemical composition and temperature. Secondly, FL experiments indicate potential for model parameter optimization and enhanced performance. Besides, the framework concept is applicable for even more DTs and across industries.
KEYWORDS: DATA-DRIVEN SYSTEMS, ARTIFICIAL INTELLIGENCE (AI), PROCESS INDUSTRY;
The processes of electric steelmaking are difficult to control in an optimal way [1], which makes it beneficial to share controlrelated knowledge between multiple plants within the same enterprise. The optimization can occur with Digital Twins (DT) and optimization models, based on Artificial Intelligence (AI) or other techniques. Because the coverage of measurement data has inevitable limitations, it is advantageous to share the related knowledge between plants. This can occur possibly within the same enterprise or co-operating partners if their production processes have similarities.
Petri Kannisto, Bernd Kleimt, Akhilesh Chandgude
BFI (VDEh-Betriebsforschungsinstitut), Düsseldorf, Germany
Nicolás García, Irene Guardiola, Raquel Lazcano, Carmen Perea
EVIDEN, Madrid, Spain
Stefano Dettori, Antonella Zaccara, Lorenzo Vannini, Valentina Colla
Scuola Superiore Sant’Anna, Pisa, Italy
David Blazquez, Bárbara Fernandez, Irene Garcia
Celsa Group, Barcelona, Spain
To enable knowledge sharing between production plants, this article presents a DT framework with Federated Learning (FL) to let the local optimization models of each plant to learn from the others. In FL, the participating parties share their local model with a centralized service that creates global weights, effectively isolating the local datasets and models yet enabling network-wide benefits [2]. The framework has received its motivation from electric steelmaking, but the concept is generalizable across process industries and other domains, such as manufacturing. The research has been carried out as a collaboration between multiple partners within the research project ALCHIMIA.
The research question of this article is: What kind of framework can operate Digital Twins and optimization models, including AI, for data-driven purposes to enable Federated Learning for network-wide benefits between industrial plants when multiple organizations develop the software components?
Earlier, the same topic has been discussed in a conference presentation [3]. This article is an extension to the conference abstract and presentation.
The structure of this document is based upon the method Design Science Research (DSR), which aims to build solutions based on tangible, relevant requirements, contributing to the scientific rigour [4]. The next section surveys the state of art, setting the scientific background. Then come the requirements for the framework, followed by the design and the related proof of concept. Finally, the results are discussed and concluded.
Earlier projects have aimed to increase the intelligence level of industrial process control with AI and related technologies. For instance, DTs can be a part of a system that forms cognitive capabilities for production optimization, as shown in CAPRI [5] and COGNITWIN [6].
On the other hand, AI systems can develop autonomous Self-X functionality with the help external supporting entities, such as the Autonomic Manager as shown in s-X-AIPI [7]. In similar cases, FL would enable sharing the knowledge of the optimization models. Regarding FL, most earlier manufacturing- or process-
industry-related works have focused on the mathematical aspects instead of information-system-level questions with production plants and DTs. As an exception, a system design, not only a structure but also operational workflows, has been proposed related to industrial asset data [8]. Additionally, another system design has been proposed for algorithms in condition monitoring [9]. Across domains, the recently identified FL challenges include scalability and resource constraints, privacy preservation, heterogeneity as well as FL applications in new sectors [10]. Generally, the FL framework suggested in this work, concretely integrated with production plants and DT, is situated in a research gap.
General functional requirements
The main purpose of the system is to provide decision support for process optimization. That is, there is a Human in the Loop to apply their final judgment instead of any direct process control by the models. The decision support relies on the measurement data available from the actual processes.
Particularly in this work, the focus is on two-unit processes: the Electric Arc Furnace (EAF) and Ladle Furnace (LF). These are a part of the common production route in electric steelmaking (see Figure 1). Within the context of the relevant research project ALCHIMIA, multiple scraphandling-related aspects were considered as well. These include, for instance, scrap mix optimization and scrap processing, but these are out of scope. Additionally, any steps from casting onwards remain as future work.
The system should apply FL to generate benefits within an ecosystem of participating production plants. The framework should enable this for any optimization model as long as there are similar models in the ecosystem and the principles of the model itself do not prevent FL. Concretely, FL is inapplicable if the source data is too heterogeneous between the plants or if the underlying principle of the model applies no learning of any kind. For instance, the scrap data in electric steelmaking typically differs considerably between plants. Besides, FL is typically applied to Machine Learning models, and an explicitly developed model can be inapplicable.
The system should follow DevOps and MLOps [11] principles to enable automatic or close-to-automatic, iterative, cyclic development with early feedback about error. These principles enable the developer team to deploy without relying on a separate operations team with possibly conflicting priorities (such as the avoidance of repeated updates). Despite the name, the MLOps cycle can validate and optimize a variety of models regardless of the technology, not only to Machine Learning. Concretely, the systems should be deployed with the Infrastructure as Code (IaC) principle to avoid manual installation. Technologies, such as Docker and Kubernetes, enable this by letting the developer define textual manifest files. These will be interpreted by the
infrastructure, which automatically sets up the system based on the developer’s definition instead of a manual installation and configuration for each component. This enables a unified, cloneable environment to increase productivity.
Security is paramount in any modern information system. A professional security approach builds upon a risk assessment, and the so-called CIA triad (confidentiality, integrity, and availability) is the basis for all information security. Additionally, the related term cyber security widens the scope to protecting the environment, people and assets instead of mere information.
Scalability is another key factor, even in industrial plants, due to the high amount of data generated as well as unforeseen technological developments. That is, the design must consider a scenario where the system grows in size, complexity and data volume. Concretely, any centralized tools, such as message brokers and software infrastructure, should support load balancing and encourage the elimination of direct point-to-point dependencies between software components.
Heterogeneity is an inevitable feature in industrial data. There is a variety of processes, equipment types and software components, and these can come from multiple manufacturers. Besides, new technologies will introduce unforeseen data-related needs. This means that the
system must enable diverse platforms and technologies, preferably applying standards or other well-established methodsfordataintegration.
Figure 2 illustrates the logical structure designed for
the Digital Twin and Federated Learning framework. The following paragraphs will explain these aspects, starting from the overarching security, end user goals and raw data and leading to the optimization models and FL.
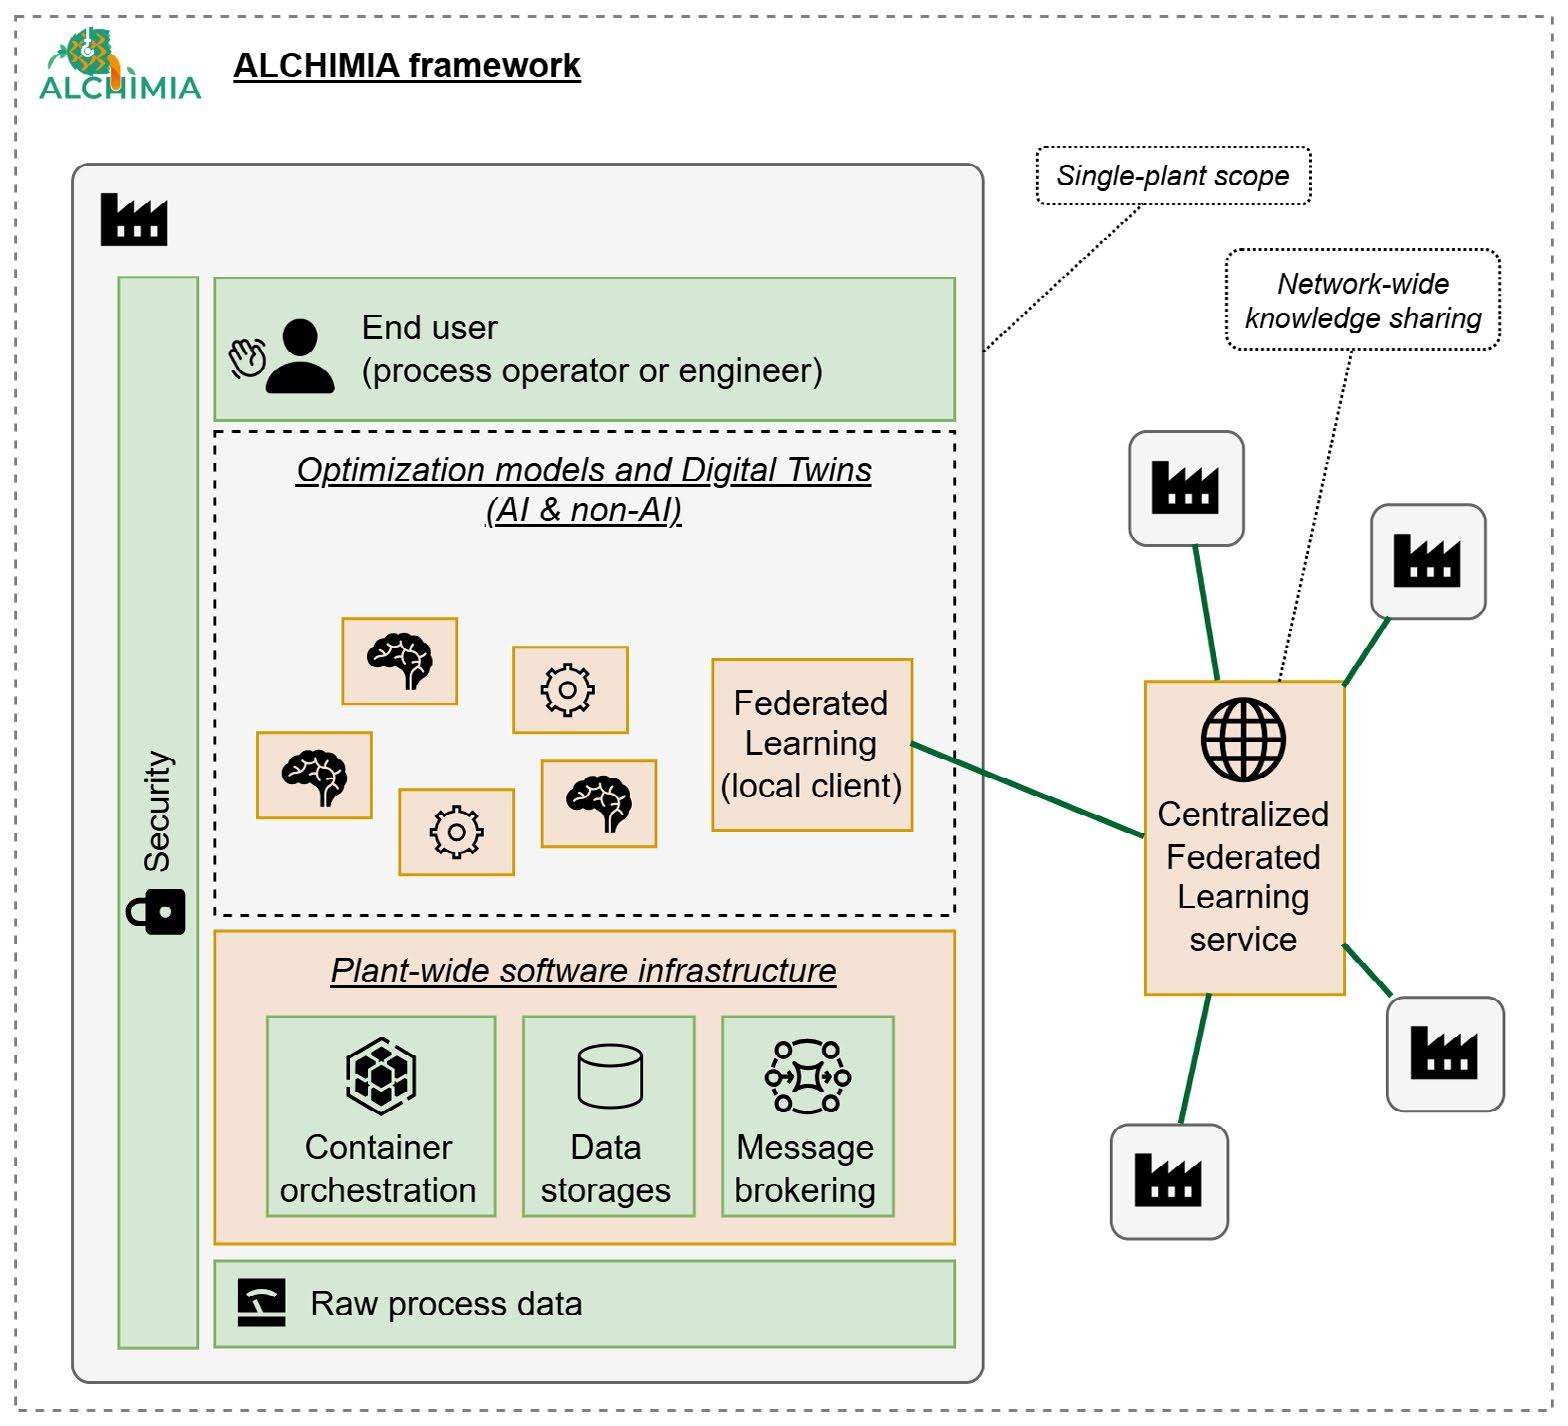
While the concrete security measures depend on the security policy of each participating plant, certain elements are generic. In the user and developer scope, each person is authenticated upon accessing the end user interface or the developer interfaces. In the software component level, each network endpoint enforces user authentication and access control. Many components provide built-in authentication mechanisms for state-of-art tools, such as single signon and Lightweight Directory Access Protocol (LDAP) to authenticate against existing credentials. Additionally, the users can have finer-grained permissions to assign
administrator, developer and end user roles, possible on the level of a certain unit process or software component. Besides user authentication, security zones and domains are in place. The defence-in-depth principle creates layers of security, and the decision support systems should be physically separated from production systems. Additional mechanisms are applicable for availability and consistency. In error situations, data loss can be avoided with backup systems. In case of an unauthorized use or erroneous software, logging enables activity tracking. More mechanisms are to be deployed as indicated by a continuously active security assessment process.
From the framework viewpoint, the “end user” aspect refers to the various decision support interfaces created for the DTs. In the steelmaking context, the end user should receive benefit thanks to stable recommendations, improved temperature predictions and reduced guesswork.
To emphasize that these are DTs rather than Digital Shadows, there can be optimization functionality to let the operator define setpoints. For instance, in relation to the EAF process, the setpoints can include the tapping temperature, the target carbon content and the target meltdown degree to trigger each scrap basket addition. Thanks to web technologies, the user interfaces can potentially be accessed from anywhere, but practically the access is likely restricted to control rooms or at least to the domain of the enterprise.
The measurement data from the processes in the foundation of the DTs, and the framework places no restrictions related to the physical data sources or formats. Concretely, the data sources can be databases, control systems, Manufacturing Execution Systems (MES), sensors or anything available at the plant.
The infrastructure provides a layer of services to supply data for the DTs in a suitable format. For historical data, databases are applied. Respectively, any event-based, message-oriented data are best supplied with a message broker, such as Apache Kafka or a product compliant with Message Queueing Telemetry Transport (MQTT). For example, historical data can describe scrap additions and past calculations for the process states. On the other hand, the actual event of scrap addition can be notified with a message describing the scrap types and masses. Because any data delivery necessitates preprocessing, the infrastructure includes appropriate components, referred to as Extract-Transform-Load (ETL).
Additionally, the infrastructure provides an execution environment with IaC for remote deployments to facilitate software development in external organisations. For IaC, Kubernetes provides the foundation. This enables the
developers to build their components, such as optimization models and the user interfaces, as microservices using textual manifest files. This eliminates the need to manually install and configure each software component as well as facilitates the setup of testing environments that resemble the actual production environment. This automation enables DevOps and MLOps to increase the automation degree of software updates. Additionally, the container orchestration system provides a physically separated network, which isolates the software from the outside world, facilitating the configuration of the security measures. Finally, Kubernetes promotes scalability now that load balancing is built-in feature in the platform, and the software component instances (referred to as “pods”) can be configured for mutual load balancing. These benefits apply to each optimization model and user interface.
The optimization models and DTs operate on the data from the ETL and generate decision support for the end user. The concrete functionality depends on the use case, but a usual approach is to create at least one DT or model for each unit process being optimized. In this work, this refers to EAF and LF.
FL enables enterprise-wide or even ecosystem-wide benefits depending on the connected organizations (see figure 3). In this scheme, each participant shares its local model with the centralized service, which will generate global weights for the participants. That is, no source data is shared within the network, and only the centralized service sees the properties of the local models. Thus, in principle even competing organizations could participate in the same network. On the other hand, even if a single enterprise operates all the plants, the scheme reduces concerns related to data sharing by restricting the scope.
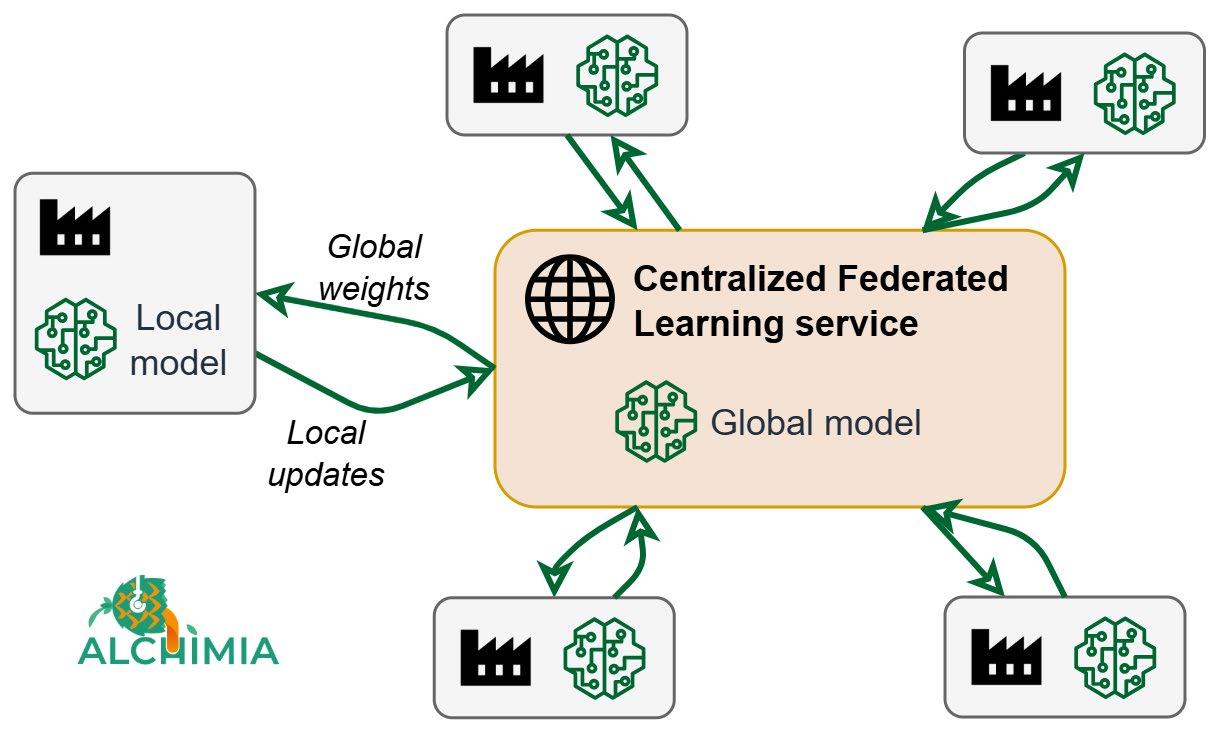
Fig.3 - In Federated Learning, the global model enables the local models to be improved.
In ALCHIMIA, each participating plant operates a client to send its local updates to the central server and receive global weights to learn from the others. Despite the asymmetries between the plants, such as the computational infrastructure, the physical processes and the scrap types, the steelmaking processes share the same properties and measures, which enable FL. ALCHIMIA applies FL to improve the performance of EAF and LF optimization models.
Software infrastructure and components
For the proof of concept, the software infrastructure was built on top of Kubernetes. In this case, it is shared between three plants within the same enterprise. With Kubernetes, the software development can occur with any language and environment as long as this can be packaged into a suitable virtualized software image. In practice, the developers applied Docker to build their images and then push these into a remote image registry. Then, the software was deployed with Kubernetes manifests that define the address of the image in the registry as well as the configuration of the environment. This includes but is not limited to network addresses, user credentials to
1 https://github.com/smart-data-models/dataModel.IndustrialProcess
other applications (such as databases) and volumes for persistent data.
The data integration occurred with two main tools depending on the needs. Firstly, any historical data was stored in Structured Query Language (SQL) databases that operated in the Kubernetes environment. Secondly, any event-based, message-oriented data were brokered with Apache Kafka. Kafka enables topic-based publishsubscribe communication, designed to be scalable even when the number of data consumers is high and the amount of data traffic varies. On the other hand, message-oriented communication makes it straightforward to re-use existing, possibly standardized, data models. ALCHIMIA created three so called Smart Data Models for the FIWARE ecosystem, grouped into the subject IndustrialProcess1 in the domain Smart Manufacturing. This covers three message structures generic within process industry and especially batch processes: MaterialAddition, ProcessChemicalAnalysis and ProcessEvent (such as the end of a heat). Related to data, all processing followed the privacy and confidentiality policies of each plant.
For the models referred to in this document, the multiple Kubernetes components (or pods) were necessary. These are summarized in table 1. Both EAF and LF necessitate
multiple components now that the models and user interfaces are separate. Additionally, the EAF model stores its results into a database. For both EAF and LF, the components were installed for the three participating plants.
Pod API
EAF web application
EAF model
HTTP (user interface)
Persistent data
Configuration
None (only client towards others) None
EAF model results database SQL
LF web application
HTTP (user interface)
Calculated EAF state; model logs
Configuration; historical data
LF model HTTP Configuration
Life Cycle Assessment (LCA) web service HTTP Configuration
The EAF decision support system includes three main views, two of which display results from the DT during online operation. First, a diagram displays the evolution of the calculated steel temperature and meltdown degree as well as the measured steel temperature (see figure 4). The same view shows suggestions when to add scrap baskets
and when to end burner operation as well as the remaining electrical energy and oxygen inputs. Second, another view shows the calculated carbon and oxygen content along with the actual measured values. Third, there is a view to browse historical heat information, calculated by the DT, to observe past measures and performance. Additional screenshots were presented in [3].
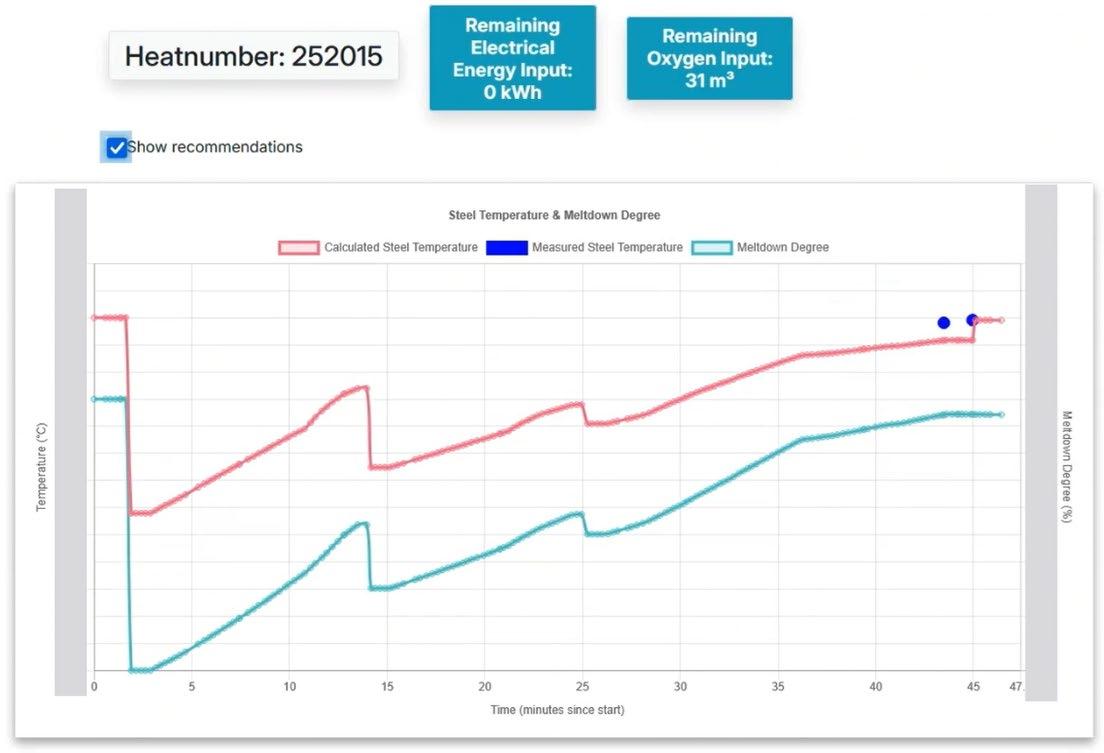
- One of the views in EAF decision support, currently in endpoint control stage (some data hidden due to the corporate privacy and confidentiality policy).
Additionally, the operator can set control targets for the meltdown degree for the scrap basket addition and burner shutdown, the tapping temperature as well as the target carbon and oxygen content. This makes the DT an active, adaptable optimization tool for the Human in the Loop. Technically, the DT has been developed in Python. Model consists of multiple submodels that can be parametrized (see [1] for more information). The web application technology is Flask.
The LF decision support system comprises four main views for the operators. First, the dashboard shows the current chemical composition, steel weight and tapping temperature. The second shows the initial and final chemical composition (see figure 5). The third view shows the initial and final steel temperature and an overview of the added materials. Finally, the fourth view summarizes a Life Cycle Assessment (LCA) evaluation of the operation. Additional screenshots were presented in [3].
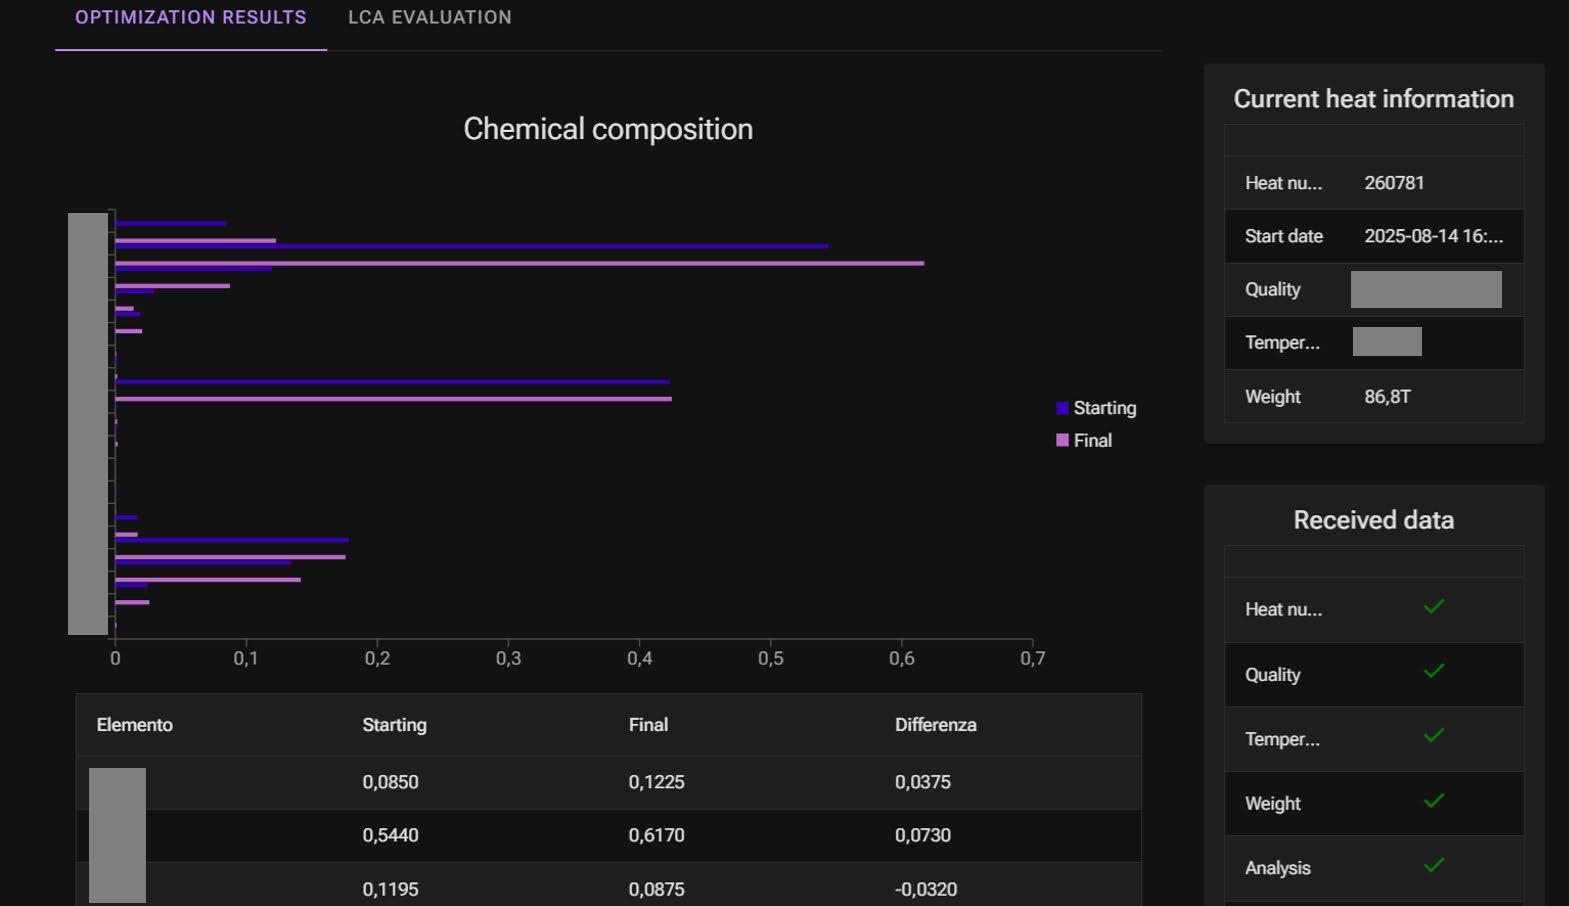
Fig.5 - A part of LF optimization view, depicting the initial and final chemical composition (some data hidden due to the corporate privacy and confidentiality policy).
Besides, the DT enables optimization by letting the operator to define prices for the added materials as well as electrical energy. The material additions include, for instance, carbon, magnesium oxide, calcium oxide and silicon manganese. Besides, the operator can define ferroalloy additions. With these inputs, the DT generates recommendations.
The DT has been developed in Python. The underlying model is a feedforward neural network, the backend technology is FastAPI, and the user interface builds upon Dash.
The FL functionality, while integrated with online data for LF, was proven with offline data for both LF and EAF. The FL subject was the temperature model for both as well as the chemical composition model for LF. For each model, FL was applied between multiple plants within the same enterprise. Because the LF model is a neural network, an FL application was straightforward due to the origin in Machine Learning applications. Conversely, the application on EAF was less conventional because this model is physical or analytical (i.e., based on equations),
which means that the model lacks an adaptability similar to neural networks. However, FL proved applicable when the plants share knowledge related to model parametrization, which is a novel opening and promising for future research.
In our EAF implementation, the FL architecture comprised two plants and a server that aggregated locally optimized parameters each round using weighted FedAvg. In this approach, the server aggregates the updates from the clients with client-specific weights, so some clients have a greater influence on the global model than others. The parameters were obtained by running a non-linear least squares algorithm. Promising results were reached with two sufficiently high-quality datasets, representing two separate model instances and plants. Due to the asymmetric coverage in a third dataset, it was necessary to exclude this to prevent the Mean Absolute Error (MAE) of one model from growing. This suggests that the FL principle works but depends on data quality, coverage, and symmetry or homogeneity. Concretely, problematic heterogeneity can result from differences in measurement availability, sensor outputs and the data quality. The LF study involved both temperature and chemical
composition models, both including a model instance from three separate plants and a server that aggregated locally trained weights using FedAvg. In both cases, the results showed an improvement in two models instances, the third indicating a similar or a lowered performance. Table 2 shows the results for the temperature model, indicating that plants 1 and 3 improved, whereas plant 2 maintained its R2 score but degraded in Mean Squared Error (MSE). Plant 1 had the smallest dataset, while plant 3 had the lowest data quality and contained more than twice the samples of the other two. Therefore, improvements for these plants were expected, as they benefited from the other plants’ data. In contrast, plant 2, which had the strongest training dataset, did not improve due to the imbalance in the datasets caused by plant 3’s larger and lower-quality data. Again, it appears that FL performance can suffer from asymmetric or low-quality datasets, but a clear improvement is still possible. However, the federated LF temperature model meaningful enhances the performance for plants 1 and 3 and does not significantly worsen performance for plant 2.
Tab.2 - FL improved two of the three LF temperature models: plant 1 and 3.
Lessons learned
For future efforts, multiple remarks were made during the work. The results are promising, but the proposed framework operated in a complex environment with multiple organizations, which does not come without challenges.
Kubernetes can have a steep learning curve, and if managed remotely, the overhead increases. Some of its
mechanisms can surprise due to primitiveness compared to a plain container virtualization environment (such as Docker). This is especially related to the persistent volumes to keep data when a component restarts or is reinstantiated. On the other hand, the importance of security policies increases when the environment is accessed remotely, which adds overhead to both developers and administrators. Still, now that most components ran
in one environment, it was straightforward to enforce security policies compared to a network of distributed, heterogeneous infrastructures. In the experiment, the sole external component was the central FL service. When models receive data in an event-driven fashion, the importance of workflows and functional interoperability increases. Clearly, the models cannot operate properly –if at all – if an essential message arrives too late or drop completely. In any case, in an asynchronous, eventdriven world, the models must be robust to operate even in exceptional situations. Additionally, any implications on the model and application state must be considered in case of inconsistencies in earlier data. For instance, when a heat starts and the earlier data have been incomplete, the objective should still be to generate clean results for the new heat.
It was observed that the success of FL directly depends on the availability of models and data from the clients. The data must be sufficient in quality and volume, and there must be multiple plants integrated. If this condition is not met, delays and problems will occur. On the other hand, asymmetry in data coverage can lead to no benefit from FL in a plant. These factors and risks must be considered when planning for the investment. During operation, it is advisable to monitor FL performance continuously in each participating plant.
In summary, two main factors were identified. First, data quality and availability are paramount. Second, the stages of any event-driven workflows must be harmonized early.
The platform presumably has an effect on the society, economy of the industrial plants, and the environment. These influences are elaborated in the following paragraphs.
Considering the society, industrial enterprises are core actors by providing workplaces, resources and revenue, but AI introduces another ethical dimension. This has been captured within the AI Act [12], considering possible AI-related factors, such as physical human interaction, general-purpose applicability, medical aid and the processing of personal data. Considering the AI Act, ALCHIMIA framework appears to pose no special
requirements beyond ensuring the AI literacy of the end users. Still, this can potentially change if ALCHIMIA’s is extended in the future.
Furthermore, ALCHIMIA can contribute to the economic performance of industrial enterprises. First, the DTs included help enterprises directly in optimizing their production activities. Second, FL improves the performance of the included DTs. This applies both to the related electric steelmaking use case and ALCHIMIA framework in general, providing re-usable methods and structures for industrial use cases. We expect similar to be reachable in any use case with DTs, especially if multiple production plants are involved with the same FL network. Finally, ALCHIMIA framework helps heavy industries in reducing their environmental footprint. Although economic efforts often align with factors, such as energy and resource savings, LCA can be integrated for explicit environmental objectives. This is already available for the LF model, and a similar tool could be integrated into the EAF model. With more extensive LCA efforts, ALCHIMIA could host an entire environmental toolkit, providing online decision support.
The suggested DT framework brings novelty especially related to FL. It is among the first ones to suggest an FL framework for industrial plants. As far as is known, there have been no earlier research to either create an FL framework in metallurgy or to parametrize a physical or analytical optimization model. The framework is significant as it applies AI for the competitiveness of European steel industry, helping to maintain jobs and the domestic production of critical resources. It improves the applicability of AI technologies in the industrial scope even when the data sources are heterogeneous yet share the same principles. Additionally, this work developed AI applications towards the green transformation, a key overall goal in modern industry. Certain limitations exist. Only a few plants were included in the experiment, and this numerically evaluates FL improvements only with offline data (although the FL system was integrated with online data and models). Besides, it is limited to upstream processes in electric steelmaking. There could be a wider study regarding the
benefits of the DT and FL framework, including more enterprises and production processes.
For the future work, multiple opportunities remain. The advantages of FL could be explored further, and there could be more focus on Continual Learning to react to any degradations in model performance. The concept could be expanded to larger enterprise networks, and more of steel production processes could be included. The advantages of the concept could be explored in other metallurgical industries as well as process industries in general (such as chemical or pulp and paper) and manufacturing. On the other hand, as the software solutions come from multiple developers and even separate organizations, certain challenges arise. Thus, the advantages of the Data Mesh [13] could be researched now that these can enforce common interoperability and security policies as well as reduce the danger of bottlenecks in data integration tasks. In larger multi-actor business ecosystems, there could be a coordinating non-profit entity to decide on the rules, as earlier suggested for industrial partner networks [14]. Finally, as the current system focuses on models to optimize single unit processes, there could be FL for the plant-wide optimization problems [15].
This document introduces a DT framework that operates optimization models, including AI, and exploits enterprise-wide knowledge with FL. The design of the framework is based on industrial requirements, and it has been proven with actual data. The results suggest that the concept is applicable in industrial environments. The results have indicated that the DT platform, along with FL, can improve the performance of production processes in electric steelmaking. FL has proven to be effective even in the industrial context as demonstrated for both EAF and LF. Although the reported experiments are restricted to a certain steelmaking route, we can expect similar benefits in other industrial FL applications.
A clear challenge in industrial FL is the data heterogeneity between plants. Even the plants that operate similar processes can vary considerably in the availability of the measurements. This not only adds difficulty but also effectively prevents certain application areas, such as scrap characterization now that scrap suppliers and qualities are
fundamentally different between plants. Additionally, as noticed with EAF, an inferior data quality or coverage can hamper benefits at least in a single plant.
Considering the research question presented in the introduction, we can summarize that DTs and FL in datadriven industrial use cases necessitate special attention on the local data infrastructure in plants. A scalable environment should include services for data storage, data delivery and messaging, and container orchestration to be used in co-operation between the component developers. It is essential to preprocess data to fit for the network-wide requirements, or otherwise the plant cannot benefit from FL. In any case, only the local infrastructure can guarantee FL suitability for the plant.
This work has been supported by the project “Data and decentralized Artificial intelligence for a competitive and green European metallurgy industry” (ALCHIMIA), which has received funding from the European Union’s Horizon Europe research and innovation programme under grant agreement No. 101070046. Views and opinions expressed are however those of the authors only and do not necessarily reflect those of the European Union. Neither the European Union nor the granting authority can be held responsible for them.
Additionally, the authors want to thank all project partners for their cooperation, particularly mentioning EVIDEN colleagues Diego Esteban for project coordination, Vera Peiss from BFI for various software development contributions, and EXUS’ colleagues Giorgos Nomikos, James Lloyd, and Marcos Varveris for setting up components for data integration and preprocessing.
[1] B. Kleimt, W. Krieger, D. Mier Vasallo, A. Arteaga Ayarza, I. Unamuno Iriondo, “Model-Based Decision Support System for Electric Arc Furnace (EAF) Online Monitoring and Control,” Metals, vol. 13, no. 8, p. 1332, 2023. https://doi.org/10.3390/met13081332
[2] J. Wen, Z. Zhang, Y. Lan, Z. Cui, J. Cai, W. Zhang, “A survey on federated learning: challenges and applications,” International Journal of Machine Learning and Cybernetics, Bd. 14, pp. 513-535, 2023. https://doi.org/10.1007/s13042-022-01647-y
[3] P. Kannisto, B. Kleimt, A. Chandgude, N. García Crespo, I. Guardiola Luna, S. Dettori, V. Colla, B. Fernandez, “Framework with Digital Twins and Federated Learning for Decision Support in Multi-plant Schemes for Electric Steelmaking and Beyond,” in DTMI 2025International Workshop Carlo Longaretti on Digital Tools for the Metallurgical Industry, Bergamo, Italy, 2025.
[4] A. R. Hevner, “A Three Cycle View of Design Science Research,” Scandinavian Journal of Information Systems, vol. 19, no. 2, pp. 8792, 2007. https://aisel.aisnet.org/sjis/vol19/iss2/4
[5] A. Salis, A. Marguglio, G. De Luca, S. Razzetti, W. Quadrini and S. Gusmeroli, “An Edge-Cloud based Reference Architecture to support cognitive solutions in Process Industry,” Procedia Computer Science, vol. 217, pp. 20-30, 2023. https://doi.org/10.1016/j. procs.2022.12.198.
[6] S. T. Johansen, P. Unal, Ö. Albayrak, E. Ikonen, K. J. Linnestad, J. Sudi, A. K. Srivastava, B. T. Løvfall, “Hybrid and cognitive digital twins for the process industry,” Open Engineering, vol. 13, no. 1, p. 2022-0418, 2023. doi: 10.1515/eng-2022-0418
[7] P. Kannisto, Z. Kargar, G. Alvarez, B. Kleimt, A. Arteaga, “Resilient, Adaptive Industrial Self-X AI Pipeline with External AI Services: A Case Study on Electric Steelmaking,” Processes, vol. 12, no. 12, p. 2877, 2024. https://doi.org/10.3390/pr12122877
[8] T. Hiessl, D. Schall, J. Kemnitz and S. Schulte, “Industrial Federated Learning - Requirements and System Design,” in Highlights in Practical Applications of Agents, Multi-Agent Systems, and Trust-worthiness. The PAAMS Collection, 2020. https://doi. org/10.1007/978-3-030-51999-5_4
[9] R. Kanagavelu, Z. Li, J. Samsudin, S. Hussain, F. Yang, Y. Yang, R. S. M. Goh, M. Cheah, “Federated Learning for Advanced Manufacturing Based on Industrial IoT Data Analytics,” in Implementing Industry 4.0: The Model Factory as the Key Enabler for the Future of Manufacturing, Springer International Publishing, vol. 202, pp. 143-176, 2021. https://doi.org/10.1007/978-3-030-672706_6
[10] T. Z. Sana, S. Abdulla, A. Nag, A. Das, M. M. Hassan, Z. Z. Fiza, A. Karim, S. R. R. Kabir, “Advancing Federated Learning: A Systematic Literature Review of Methods, Challenges, and Applications,” IEEE Access, vol. 13, pp. 153817-153844, 2025. doi: 10.1109/ ACCESS.2025.3605165
[11] S. Moreschini, F. Lomio, D. Hästbacka, D. Taibi, “MLOps for evolvable AI intensive software systems,” in 2022 IEEE International Conference on Software Analysis, Evolution and Reengineering (SANER), Honolulu, HI, USA, pp. 1293-1294, 2022. doi: 10.1109/ SANER53432.2022.00155
[12] “Regulation (EU) 2024/1689 of the European Parliament and of the Council of 13 June 2024 laying down harmonised rules on artificial intelligence and amending Regulations”, 2024.
[13] Z. Dehghani, Data Mesh: Delivering Data-Driven Value at Scale, O’Reilly Media, Inc., 2022.
[14] P. Kannisto, D. Hästbacka, A. Marttinen, “Information Exchange Architecture for Collaborative Industrial Ecosystem,” Information Systems Frontiers, vol. 22, no. 3, pp. 655-670, 2020. https://doi.org/10.1007/s10796-018-9877-0
[15] P. Kannisto, D. Hästbacka, T. Gutiérrez, O. Suominen, M. Vilkko, P. Craamer, “Plant-wide interoperability and decoupled, data-driven process control with message bus communication,” Journal of Industrial Information Integration, vol. 26, p. 100253, 2022. https://doi. org/10.1016/j.jii.2021.100253
S. Bazri, C. Mapelli, D. Mombelli, R. Nemfardi, R. Bedini, G. Zucchelli
This paper presents a novel, physically informed machine learning (ML) framework for the accurate modeling and visualization of steel microstructure evolution during annealing. Utilizing a chained support vector regression (SVR) architecture with optimized hyperparameters, the model sequentially predicts key microstructural states, ensuring metallurgical consistency. The process begins by forecasting recrystallization fraction (RF) kinetics, which is critically constrained by the classical Johnson–Mehl–Avrami–Kolmogorov (JMAK) model. The resulting JMAK-corrected RF then serves as a fundamental input to subsequent SVR models, which forecast the average grain size (AGS) and, finally, essential image-based microstructural features (mean and standard deviation of pixel intensity). This chained approach inherently prioritizes physically sound outputs, avoiding the consistency issues of isolated predictions. A unique visualization methodology is introduced, which selects and maps the closest experimental inverse pole figure (IPF) maps to the predicted states. This robust, multi-stage framework establishes a powerful, data-driven tool for simulating complex material evolution, thus minimizing the need for extensive experimental operations in materials design and process optimization.
KEYWORDS: MACHINE LEARNING, MICROSTRUCTURE, STEEL, SVR MODEL, JAMK, RECRYSTALLIZATION, MATERIALS DESIGN;
The drive to accelerate materials design demands a shift from costly, time-consuming experimental programs to efficient, data-driven computational methods (Gupta et al., 2026). While ML has proven transformative across materials science, successfully predicting static properties such as strength and hardness, the accurate modeling of microstructure evolution during thermomechanical processing, which dictates the properties, remains a critical, unresolved challenge (Ghaffari Farid et al., 2025; Tiexu et al., 2024; Bruno et al., 2024). This challenge is rooted in the complex, sequential, and interdependent nature of phenomena like recrystallization (RX) and grain growth, where the progression of one state directly dictates the kinetics of the next (Bazri et al., 2023; Song et al., 2024).
Conventional ML models often fail in this domain because they treat microstructural features (like recrystallization fraction and grain size) as independent outputs, neglecting the inherent physical and kinetic laws (e.g., Avrami kinetics) that govern their relationship (SharafEldin et al., 2025; C. Wang et al., 2025; X. Wang et al., 2025; Gao et al., 2025). This results in “black-box” predictions that, while
Shahab Bazri, Carlo Mapelli, Davide Mombelli
Department of Mechanical Engineering, Politecnico di Milano, 20156 Milan, Italy
Renato Nemfardi, Roberto Bedini, Giorgio Zucchelli
Eure Inox srl, Via Leonardo Da Vinci, 2, 20068 Peschiera Borromeo MI, Italy
numerically accurate within the training domain, frequently yield physically inconsistent or unrealistic results when simulating the evolution over time or extrapolating to new conditions. A need exists for a robust framework that explicitly embeds metallurgical principles to ensure the physical integrity of its predictions (Lertkiatpeeti et al., 2024; Suzuki et al., 2024; Gupta et al., 2023).
This paper introduces a novel chained SVR-JMAK framework designed to overcome these limitations. The central hypothesis is that by integrating a classical JMAK kinetic constraint into a sequential SVR architecture, the predictions that are highly accurate, physically consistent, and fully interpretable would be achievable. The framework operates as a chain, where the JMAKcorrected prediction of RF acts as a critical, physicallyinformed input for the subsequent prediction of AGS and key image-based features. The unique contribution is further cemented by a visualization methodology, offering metallurgists a practical, powerful simulation tool for process optimization.
Dataset and feature engineering
The models were trained using a comprehensive dataset
derived from annealing experiments on ferritic stainless steel (FSS), encompassing various annealing soaking temperatures (AST), annealing incubation times (AIT), and prior deformation conditions. The target microstructural features of RF, AGS, and image characteristics, were extracted from electron backscatter diffraction (EBSD) IPF maps. input features for the ML models included the processing parameters (AST, AIT) alongside measured prior state features such as the initial grain size. To be exact, the experimental dataset of the samples include different conditions, from the as-received specimen, 88C with RF of 0.1%, and (as the equivalent circular diameter also denoted by d) AGS of 58.24 μ m, to different annealed states, including 50C (RF=2.96%, AGS=43.30 μ m), 53C (RF=46.0%, AGS=32.36 μ m), 55C (RF=74.9%, AGS=42.74 μ m), 64C (RF=4.03%, AGS=48.16 μ m), 67C (RF=60.0%, AGS=40.11 μ m), 68C (RF=91.1%, AGS=41.81 μ m), 78C (RF=9.3%, AGS=53.57 μ m), 80C (RF=40.0%, AGS=38.45 μ m), and 82C (RF=93.1%, AGS=45.98 μ m). These specimens had undergone the AST values of 0.65, 0.68, and 0.71, as the homologous temperature (a temperature ratio between the annealing temperature over melting point (abbreviated as TRAM)) and within various AITs.
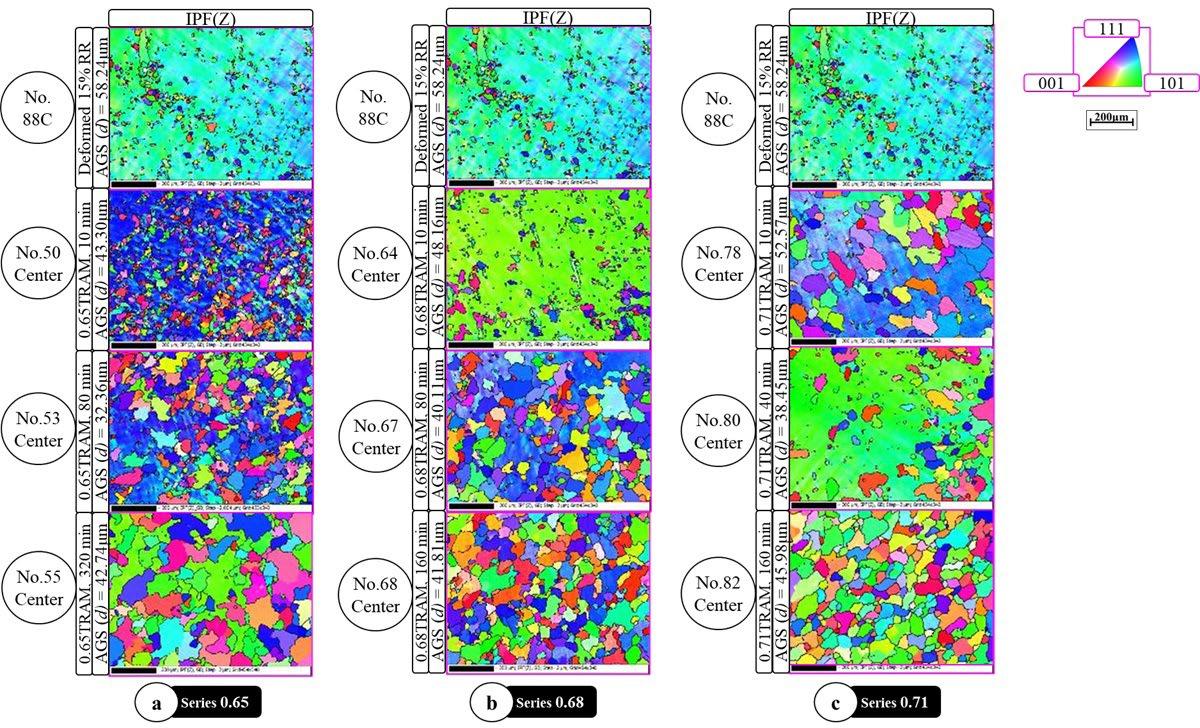
Fig.1 - Representative experimental IPF maps showcasing the microstructure evolution for different annealing conditions. Each series (a, b, c) corresponds to a different initial EBSD-post-processing calculated RF and displays the grain structure and AGS at various annealing times.
The chained SVR-JMAK prediction framework
To address the limitations of conventional ML models that ignore physical interdependencies, a chained SVR architecture, explicitly linking predictions across sequential stages of microstructural evolution, was employed. The SVR model, which utilizes a Gaussian
(Radial basis function (RBF)) kernel, was selected for its robustness in handling complex, non-linear regression tasks on limited, high-dimensional materials datasets. The framework operates in a four-stage, sequential manner, as elaborated below and according to figure 1.
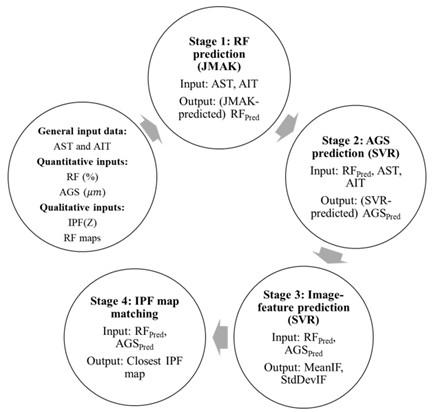
Fig.2 - Schematic representation of the chained SVR-JMAK framework for microstructure prediction and visualization.
As for stage 1 of the initial RF prediction (JMAK constraint), the JMAK kinetic model is employed first. Using the non-linear least squares method, the JMAK equation is fitted directly to the experimental RF data based on AIT and AST. This step ensures the RF prediction strictly adheres to known metallurgical transformation kinetics, guaranteeing physical consistency. The JMAK-modeled RF is the physically-consistent output of this first stage. Regarding stage 2 of AGS prediction, the JMAKpredicted RF is used as a critical, physically-informed and metallurgically-consistent input feature for the second SVR model. This SVR then predicts the AGS. This explicit
link ensures that the predicted grain size is consistent with the predicted extent of recrystallization. About stage 3 and image feature prediction, the final stage of the SVR chain uses both the predicted RF and predicted AGS as inputs to forecast key image-based features of the microstructure, specifically the mean and standard deviation of pixel intensity. These numerical features serve as the critical proxy for the visual state of the microstructure. At stage 4 as the IPF map visualization and validation, the predicted image features from stage 3 are used to generate a visual representation of the final microstructure. This is achieved by searching the experimental dataset to identify the IPF
map whose measured features are numerically closest to the model’s predictions.
All SVR models within the chain were subjected to a rigorous Bayesian optimization process. This approach efficiently searches the hyperparameter space (specifically the regularization parameter C, the kernel coefficient γ, and the epsilon parameter ϵ ) to minimize the RMSE on a dedicated validation set. This systematic tuning ensures high prediction accuracy and optimal generalization capability for each stage.
Predictive performance of the chained SVR framework
The sequential, chained architecture demonstrated exceptional performance in predicting the interdependent microstructural features. The rigorous
Bayesian optimization ensured that each SVR model achieved optimal hyperparameters, leading to highly accurate predictions on the held-out test set. About the recrystallization kinetics through stage I, the JMAKpredicted model for RF kinetics achieved the highest predictive performance, with a correlation coefficient (R 2) consistently exceeding 0.97 and a low RMSE. This high accuracy validates the strategy of embedding a physical constraint (JMAK) within the ML architecture, resulting in physically sound evolution curves. The robust fit of the JMAK model to experimental data and its reliable extrapolation capabilities are further illustrated in Figure 3, which shows the predicted RF evolution over varying AITs for different initial recrystallization states (AST series). The solid lines represent the JMAK model’s extrapolation, while the markers denote the original training data, confirming the model’s ability to accurately capture and extend the kinetic trends.
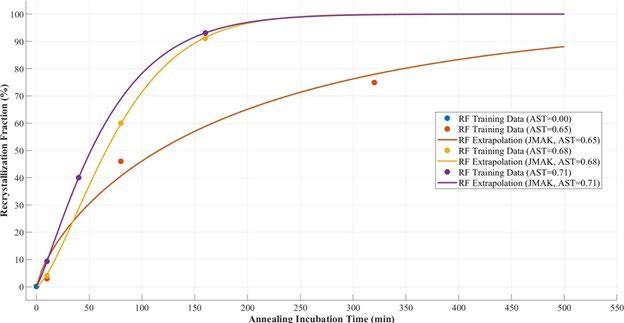
Moreover, regarding the grain size prediction of stage II, the SVR model predicting AGS, which utilizes the predicted RF as a crucial input, also exhibited high fidelity, with R2 values above 0.95. The success here confirms the ability of the chained approach to successfully transfer physically consistent information across stages, preventing the propagation of metallurgical inconsistencies. Figure 4 further supports this, presenting the SVR-predicted AGS evolution as a function of AIT. The curves illustrate the model’s capacity to capture the complex, non-linear changes in grain size across different AST conditions, accurately reflecting the underlying microstructural phenomena. The agreement between the SVR extrapolation lines and the training data points highlights the model’s strong predictive capability for AGS.
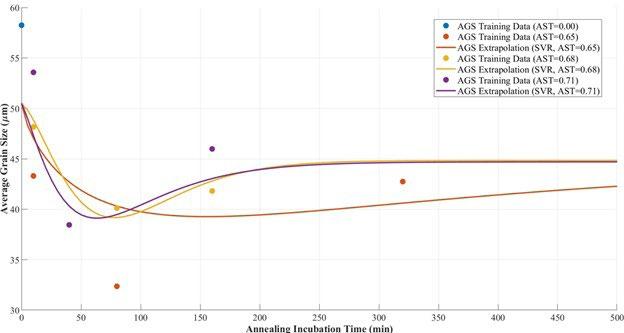
Via stage 3 of the image feature prediction, the final SVR models successfully mapped the predicted RF and AGS to the numerical image features (mean and standard deviation of pixel intensity), achieving high R2 values (>0.94). This confirms the model’s ability to numerically characterize the microstructural state, laying the foundation for accurate visual mapping. Figure 5 represents the SVRpredicted evolution of mean pixel intensity over AIT for
various AST conditions. The accurate prediction of this image feature demonstrates the model’s capability to capture subtle changes in the microstructure’s visual characteristics, which are crucial for the subsequent visualization stage. The strong correlation between the predicted curves and experimental data points highlights the effectiveness of the chained SVR in characterizing complex image-based features.
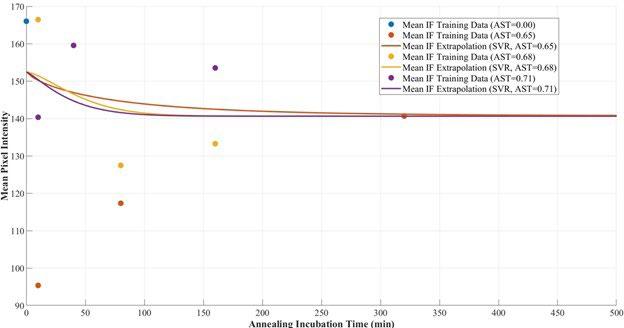
Fig.5 - SVR-predicted evolution of mean pixel intensity.
Likewise, figure 6 illustrates the SVR-predicted evolution of the standard deviation of pixel intensity as a function of AIT. The model accurately predicts the trends and magnitudes of spread in pixel intensity, further validating its capacity to capture comprehensive details
of the microstructure’s texture and heterogeneity. The consistency between the SVR extrapolations and training data points highlights the robustness of the chained approach in predicting complex image-derived features.
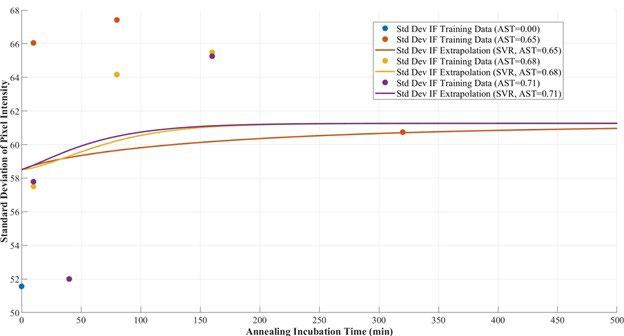
Fig.6 - SVR-predicted evolution of standard deviation of pixel intensity.
The framework’s interpretability is realized through the direct visualization of the predicted microstructural state, achieved by matching the numerical predictions to the closest experimental IPF map. This capability transforms the model’s numerical outputs into a tangible, metallurgically relevant format, offering a clear visual proxy for the predicted microstructure. Figure 7 provides a compelling
demonstration of this visualization capability, displaying examples of the predicted microstructures alongside their closest matching experimental IPF maps for specific annealing conditions. The close visual agreement between the model’s predictions and the actual microstructures validates the framework’s ability to accurately simulate and represent complex microstructural evolution.
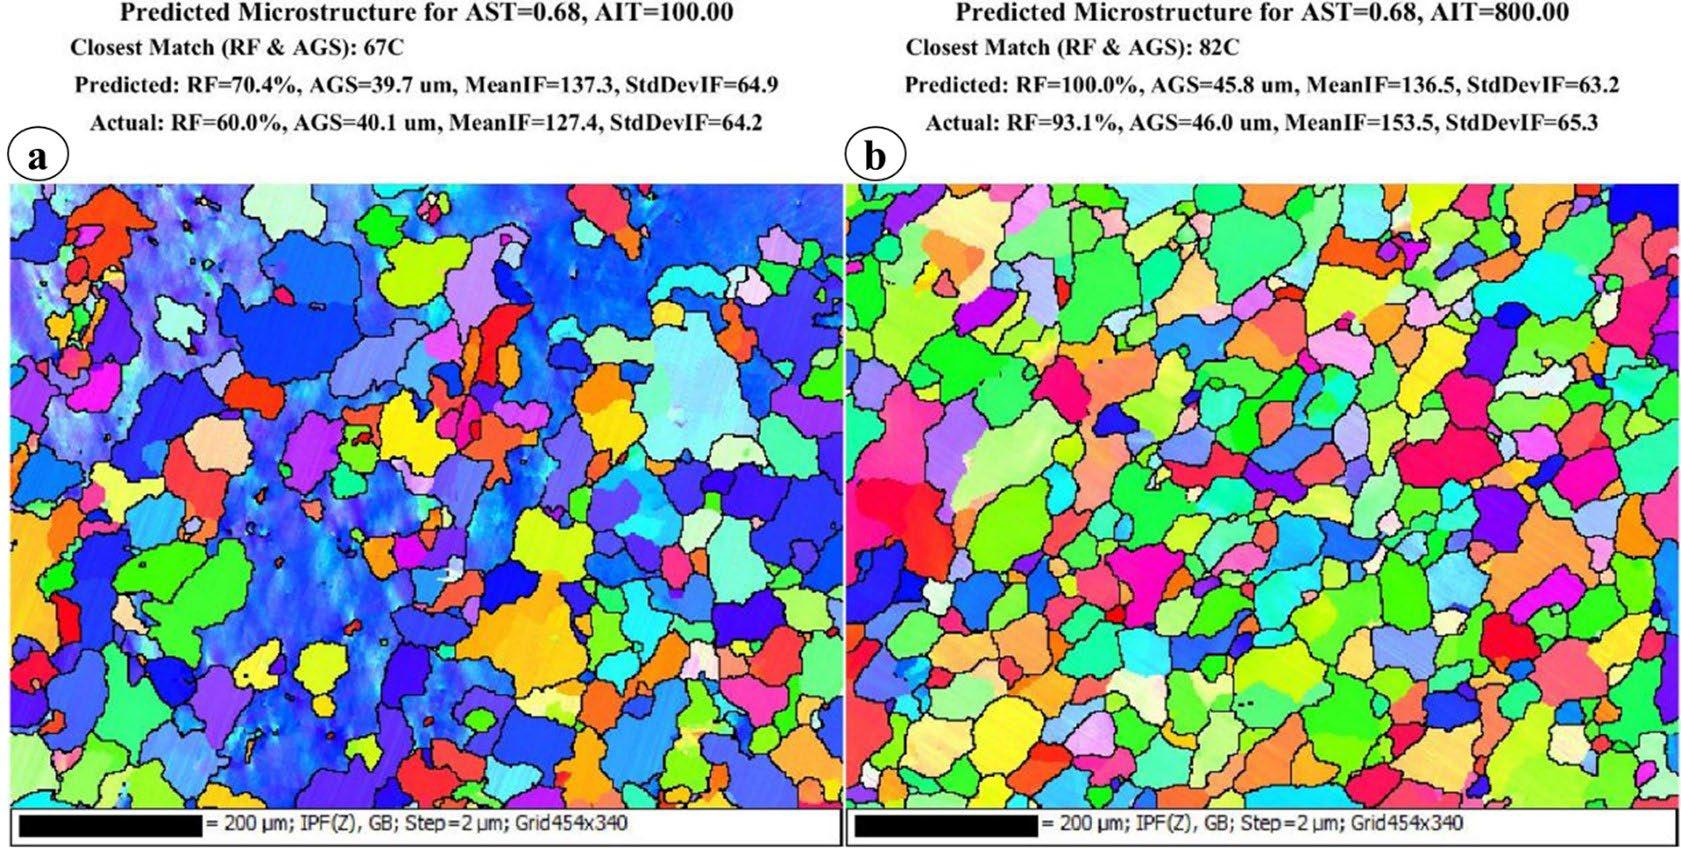
Fig.7 - Examples of predicted microstructures with their closest matching experimental IPF maps for different annealing conditions.
The core benefit of the chained SVR-JMAK architecture is the elimination of metallurgical inconsistencies that often cause independent-output ML models. By enforcing the sequential dependency and the JMAK modeling, the framework ensures that, for instance, a partially recrystallized state (low RF) will not simultaneously be associated with an unrealistically large grain size (high AGS), thereby yielding credible predictions across the entire processing window.
This inherent physical soundness establishes confidence in the framework’s use for process optimization.
This study successfully developed and validated a novel MLenabled, physically-constrained framework for predicting steel microstructure evolution. The core innovation lies in the chained SVR-JMAK architecture, which explicitly integrates metallurgical principles (JMAK kinetics) into a sequential prediction pipeline. The framework achieved superior predictive accuracy, with R2 values exceeding 0.97 for key kinetic parameters, demonstrating that the
integration of physical constraints and data-driven modeling leads to robust and metallurgically sound results. In conclusion, this research provides a powerful, data-driven alternative to extensive experimental testing and complex physical simulations, paving the way for efficient process optimization and accelerated materials design. Future work will focus on expanding the framework to predict mechanical properties and integrating it into a fully digitaltwin simulation environment for various alloy systems.
There are no conflicts of interest.
[1] S. Bazri, C. Mapelli, S. Barella, A. Gruttadauria, D. Mombelli, R. Nemfardi, R. Bedini, G. Zucchelli. “Effect of cold drawing reduction rate on edge-to-center-characterized microstructure and orientation alongside residual stresses in conjunction with magnetic properties of low-carbon high-alloy ferromagnetic steel.” Journal of Magnetism and Magnetic Materials, 591 (February 2024), 171699. https://doi.org/10.1016/j.jmmm.2023.171699
[2] F. Bruno, G. Konstantopoulos, G. Fiore, E. Rossi, M. Sebastiani, C. Charitidis, L. Belforte, M. Palumbo. “A novel machine learning method to exploit EBSD and nanoindentation for TRIP steels microstructures analysis.” Materials and Design, 239 (March 2024), 112774. https://doi.org/10.1016/j.matdes.2024.112774
[3] D. Gao, Z. Shen, K. Chen, X. Zhou, H. Liu, J. Wang, Y. Li, Z. Liu, H. Deng, W. Y. Wang, X. Zeng. “Review of progress in calculation and simulation of high-temperature oxidation.” Progress in Materials Science, 147 (January 2025), 101348. https://doi.org/10.1016/j. pmatsci.2024.101348
[4] M. Ghaffari Farid, H.R. Abedi, R. Ghasempour, A. Taylor, S. Khoddam, P.D. Hodgson. “Predicting the high-strain-rate deformation behavior and constructing processing maps of 304L stainless steel through machine learning and deep learning”. Journal of Materials Research and Technology, 36 (May–June 2025), pp.7507–7518. https://doi.org/10.1016/j.jmrt.2025.05.009
[5] A. Kumar Gupta, S. Chakroborty, S. Kumar Ghosh, S. Ganguly. “A machine learning model for multi-class classification of quenched and partitioned steel microstructure type by the k-nearest neighbor algorithm”. Computational Materials Science, 228 (September 2023), 112321. https://doi.org/10.1016/j.commatsci.2023.112321
[6] A. Kumar Gupta, S. Gupta, S. Kumar Ghosh, S. Ganguly. “Computer vision of ferrite, pearlite, austenite, bainite, and martensite: A deep learning framework toward high-throughput analysis of steel microstructure”. Computational Materials Science, 261 (January 2026), 114319. https://doi.org/10.1016/j.commatsci.2025.114319
[7] K. Lertkiatpeeti, C. Janya-Anurak, V. Uthaisangsuk. “Effects of spatial microstructure characteristics on mechanical properties of dual phase steel by inverse analysis and machine learning approach”. Computational Materials Science, 245 (October 2024), 113311. https://doi.org/10.1016/j.commatsci.2024.113311
[8] K. SharafEldin, B. D. Miller, W. Liu, J. Tischler, B. Anglin, A. El-Azab. “Informed unsupervised machine learning analysis of dislocation microstructure from high-resolution differential aperture X-ray structural microscopy data”. Acta Materialia, 303 (January 2026), 121624. https://doi.org/10.1016/j.actamat.2025.121624
[9] K. Song, H. Ding, C. Zhang, L. Zhang, G. Deng, H. Zheng. “High-resolution simulating of grain substructure in cold rolling and its effects on primary recrystallization in annealing of ferritic stainless steel”. Journal of Materials Research and Technology, 30 (May–June 2024), pp. 40–51. https://doi.org/10.1016/j.jmrt.2024.03.065
[10] M. Suzuki, K. Shizawa, M. Muramatsu. “Deep learning-aided inverse analysis framework to accelerate the exploration of DP steel microstructures”. Materials Today Communications, 41 (December 2024), 110557. https://doi.org/10.1016/j.mtcomm.2024.110557
[11] P.Tiexu, Y. Haoyang, H. Jiaxin, F. Wei, L. Cong, Y. Zitong, Z. Xin, F. Jianhang, J. Puguang, X. Chaoqun, Y. Hui, Y. Fuxing. “Deciphering the composition-microstructure correlation in low-density FeMnAlC steels with machine learning”. Computational Materials Science, 244 (September 2024), 113202. https://doi.org/10.1016/j.commatsci.2024.113202
[12] C. Wang, X. Wei, S. van der Zwaag, Q. Wang, W. Xu. “From creep-life prediction to ultra-creep-resistant steel design: An uncertaintyinformed machine learning approach”. Acta Materialia, 292 (June 2025), 121073. https://doi.org/10.1016/j.actamat.2025.121073
[13] X. Wang, F. Mao, X. Li, K. Miao, R. Shi, Y. Lin, C. Chen, C. Wang, H. Yu, S. Wei. “Machine learning-based prediction of microstructure and mechanical properties for 12Cr2Mo1V large cylindrical forgings”. Materials Today Communications, 47 (July 2025), 112983. https://doi.org/10.1016/j.mtcomm.2025.112983
A. Jadidi, S. M. Abbasi, M. Seifollahi
This study investigates the effect of starter-block geometry, expressed by the diameter-to-height (D/H) ratio, on crystallographicorientationandcreeprupturebehaviorofCMSX-4single-crystalsuperalloys.Directionalsolidification wasperformedusingtheverticalBridgmanprocessataconstantwithdrawalrateof9mm/minwithstarterblocksofD/H= 0.3,0.5,and0.7.Theresultingmisorientationsfromthepreferred[001]directionwere6.3°,21.7°,and3.3°,respectively, indicating that crystallographic orientation does not vary monotonically with the D/H ratio. Complementary thermal simulations performed using ProCAST showed distinct transitions in solidification-front stability across the selected geometries,providingaphysicalexplanationforthenon-monotonictrendinmisorientation Creep rupture life at 850 °C and 560 MPa was measured to be 97.8, 24.6, and 122.6 h for the three samples, demonstrating a strong inverse dependence of creep resistance on crystallographic deviation. Fractographic analyses revealed more severe interdendritic cavitation and porosity coalescence in the highly misoriented specimens, confirming cavitation-dominated failure. In the best-oriented sample (3.3°), EDS measurements near creep cavities showed Re depletion in the γ/γ′ matrix and the formation of Re-rich secondary precipitates, indicating diffusion-drivensegregationandstress-assistedprecipitationduringcreep. Overall, the results show that crystallographic alignment, solidification-front stability, and porosity control are jointly criticalforoptimizingthehigh-temperaturecreepperformanceofCMSX-4singlecrystals.
KEYWORDS: CMSX-4, SINGLE CRYSTAL SUPERALLOY, STARTER BLOCK GEOMETRY, CREEP RUPTURE LIFE, CRYSTALLOGRAPHIC ORIENTATION;
The CMSX-4 single-crystal superalloy was introduced by Cannon Muskegon Foundry in 1991, and by 2004, over 2200 tons of this material had been produced [1]. Its strengthening mechanism is based on solid-solution strengthening by Cr, W, and Ta, and precipitation hardening by Al and Ti through the formation of the γ′ phase [1,2]. Partial substitution of W with Ta was implemented to enhance castability, increase the γ′ volume fraction (up to 68%), improve γ′ strength, oxidationresistance,andcoatingstability.Amongnickelbasedsuperalloys,CMSX-4exhibitsafavorablebalanceof mechanical performance, largely due to its high-volume fraction of coherent γ′ precipitates with a (Ni)₃(Al,Ti) compositionformedduringheattreatment[3,4].
In single-crystal casting, key process variables such as
A. Jadidi, S. M. Abbasi, M. Seifollahi
FacultyofMaterialsandManufacturingTechnologies, MalekAshtarUniversityofTechnology,Iran
mold withdrawal rate, heat transfer rate, and the initial seed position must be carefully controlled to minimize deviation from the [001] crystallographic orientation. Because the matrix phase of nickel-based superalloys has an FCC structure, fewer slip systems are activated when loading is applied along [001]; thus, this direction offers superior creep resistance [5–7]. Misorientation angles below 12–15° are generally acceptable, and the largest deviations typically occur in the upper regions of the casting, farthest from the chill plate [8–10].
The role of early grain selection is crucial in determining the final crystal orientation. Yang et al. [11] reported that alignment between the heat-flow direction and dendrite growth is essential for suppressing stray grains. Carter et al. [12] identified optimal starter-block dimensions for CMSX-4 (D/H = 0.8), while Wang et al. [13] observed lower misorientation when the D/H ratio is close to 0.5. Sadeghi et al. [14] likewise recommended D/H values below 0.6 to stabilize competitive grain growth.
Recent studies have further highlighted that the efficiency of grain selection is highly sensitive to the geometrical characteristics of the selector and starter block. Variations in selector wire diameter, take-off angle, and pitch length can significantly alter the local thermal field, modify dendrite blocking efficiency, and influence straygrain formation, particularly through changes in local undercooling [15]. Phase-field simulations of CMSX-4 have also demonstrated that solidification is accompanied by strong multicomponent segregation: γ′ -stabilizing elements such as Al, Ti, and Ta enrich the interdendritic liquid, whereas refractory γ -stabilizing elements (Re, W, Co) are depleted. These segregation patterns control the formation of eutectic colonies and can influence homogenization behavior and creep response [16].
Given that single-crystal superalloys typically operate above 1000 °C, creep resistance is a critical property. Primary creep in CMSX-4 occurs through the <112>{111} slip system, and alignment with [001] significantly improves rupture life [7]. Orientation strongly affects creep behavior: samples aligned with [110] show shorter rupture lives than those near [100] [17], and even after heat treatment, crystals closer to [011] remain less creep-
resistant [3]. Stress redistribution due to orientation has also been shown to play a decisive role in turbine-blade performance [18,19].
Microstructural evolution during high-temperature deformation introduces additional complexity. It has been shown that refractory and γ′ -stabilizing elements may segregate to regions of high dislocation density, where local chemical perturbations subsequently drive microstructural changes, damage accumulation, and cavity formation during creep [20]. Complementary creep studies indicate that the redistribution of refractory elements (Re, W, Mo) governs the local stability of γ/γ′ microstructures: enrichment in dendrite cores stabilizes dislocation networks, while chemical gradients promote the formation of secondary γ′ structures in mesh regions under high-temperature creep conditions [21].
Based on the above, differing views persist regarding the influence of starter-block geometry (particularly the diameter-to-height ratio) on crystallographic deviation. Competitive grain selection depends not only on nucleation events near the chill plate but also on how geometrical constraints shape the thermal gradient and dendrite competition. Furthermore, the final orientation is dictated by the grain that successfully propagates through the spiral selector, directly affecting high-temperature performance, including rupture life.
Therefore, the objective of this study is to establish a clear correlation between the starter-block diameter-to-height ratio and the resulting crystallographic orientation and creep rupture life of CMSX-4 single crystals, supported by fractographic analysis to elucidate the underlying failure mechanisms.
The chemical composition of the CMSX-4 ingot used for single-crystal casting is listed in table 1. The alloy contains key strengthening elements such as Al and Ti ( γ′ formers), Cr and Co (solid-solution and stability elements), and refractory elements including Ta, W, and Re, with Ni as the balance.
Tab.1 - Chemical composition of the CMSX-4 ingot used in this study.
Trace concentrations of interstitial impurities (O, N, H, S, C) in the refined melt are presented in table 2. The low levels of these elements indicate that the starting material
possessed sufficient purity for high-quality directional solidification.
Tab.2 - Minor element concentrations in the refined ingot.
The 3D model of the casting cluster (including the starter block, a 3D spiral grain selector, a central cylindrical rod, and supporting features) was designed using Rhinoceros 8 software. A schematic of the cluster system is shown in Figure 1. In the grain-selector design, fixed parameters were maintained: a starting angle of 30°, selector diameter
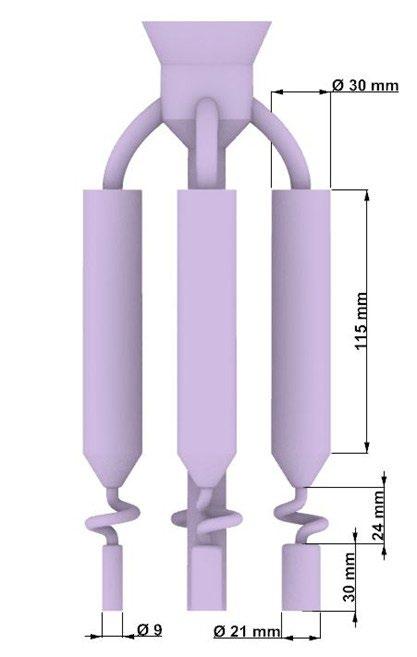
of 3 mm, and a rotation angle of 180°. The starter-block height was held constant at 30 mm, while the diameter was varied to obtain diameter-to-height (D/H) ratios of 0.3, 0.5, and 0.7 (corresponding to diameters of 9, 15, and 21 mm).
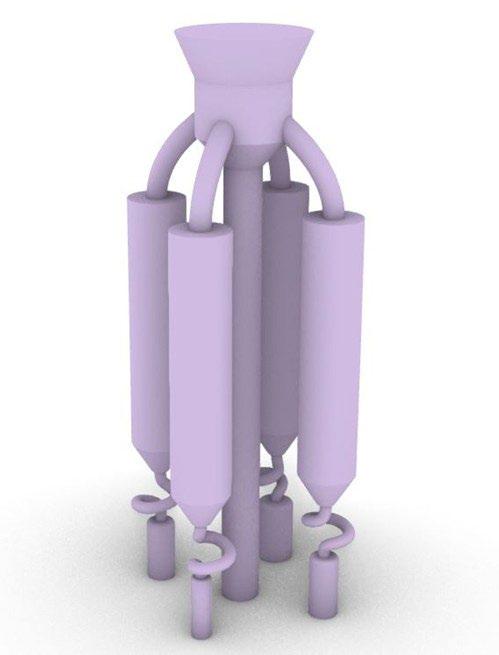
Fig.1 - Schematic of the cluster system designed for the fabrication of ceramic molds used in this study.
After fabrication of the wax components, they were assembled and coated with multiple ceramic slurry layers to form the shell mold. Directional solidification was conducted in an HRS-type vertical Bridgman furnace equipped with a graphite baffle. The pouring and hot-zone temperatures were each set to 1500 °C. A constant mold withdrawal rate of 9 mm/min was used for all castings. After solidification, the ceramic mold was removed, and the castings were sectioned using a wire-cut electrical discharge machine. Samples were ground, polished, and etched using Marble’s reagent (10 g CuSO ₄ ·5H ₂ O, 50 mL HCl, 50 mL distilled water) for 45 s at room temperature. Optical microstructural examinations were performed
using an OLYMPUS DP25 microscope. Quantitative and qualitative analyses of elemental segregation were conducted using a TESCAN MIRA3 field-emission SEM (FE-SEM) equipped with an energy-dispersive spectroscopy (EDS) detector.
Secondary dendrite arm spacing ( λ₂ ) was measured from longitudinal etched sections using the D-method of Vandersluis and Ravindran [22]. ImageJ software was used to measure arm-to-arm distances; each λ₂ value represents the average of ten measurements taken from five micrographs. Primary dendrite arm spacing ( λ₁ ) was obtained from cross-sectional etched images using the area-counting method expressed as:
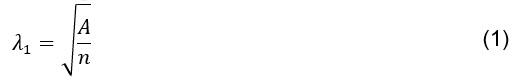
where (A) is the analyzed area ( μ m²) and (n) is the number of primary dendrite cores within that area [23].
Crystallographic orientation deviation from the [001] direction was measured using an X-ray crystal-orientation analyzer (Asenware Ltd.). All samples underwent the standard CMSX-4 heat-treatment schedule prior to creep rupture testing. The specimen geometry and the testing setup (Azar Furnace) are illustrated in figure 2.
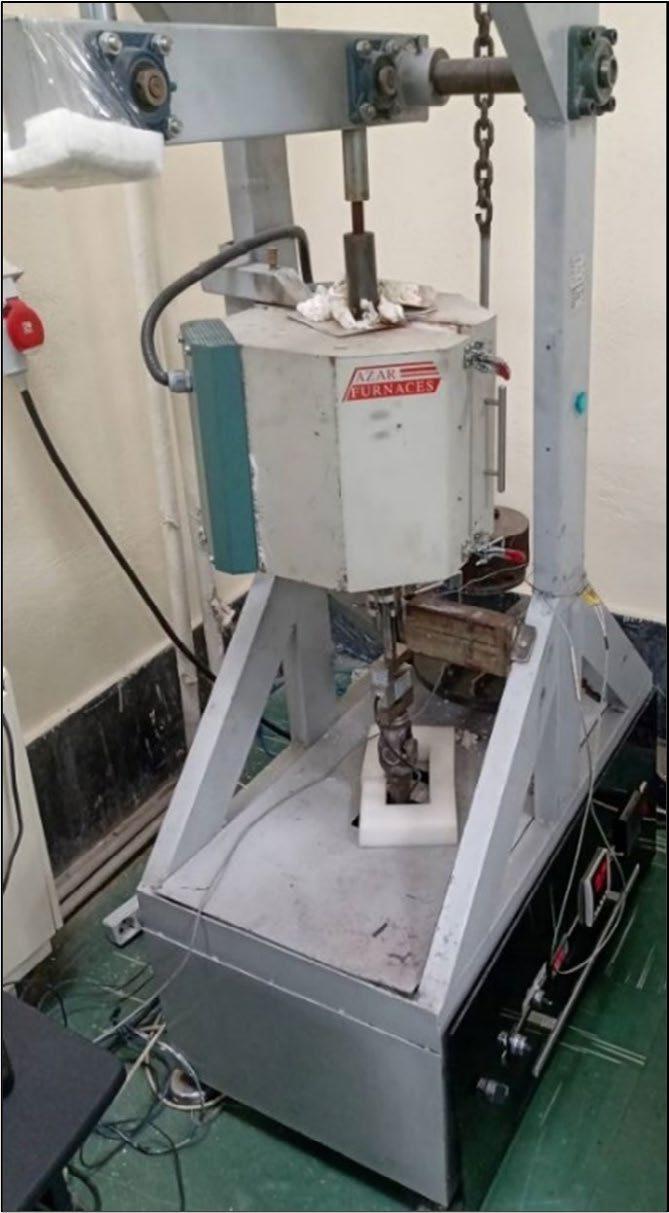

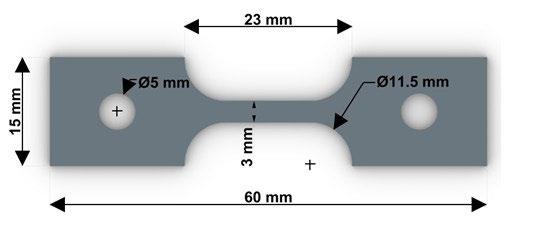
Finite-element thermal simulations were performed using ProCAST to evaluate the solidification behavior within starter blocks of different D/H ratios. The built-in CMSX-4 alloy database was used, and all thermophysical properties (thermal conductivity, density, specific heat, latent heat, and solidus/liquidus temperatures) were taken directly from the software’s material library. The thermal boundary conditions were defined to replicate the experimental directional solidification process. The inner surface of the heating zone was set to 1500 °C, while the chill plate temperature was fixed at 20 °C. Surface emissivities were assigned as follows: 0.85 for graphite components, 0.80 for the ceramic mold, 0.50 for the inner surface of the cold zone, and 0.40 for the thermal insulation layer.
Convective and contact heat-transfer coefficients were applied according to standard Bridgman solidification practice. The heat-transfer coefficient between the cooling medium and the mold was set to 20 W m ² K ¹, and that between the cooling medium and water to 5000 W m ² K ¹. The interfacial heat-transfer coefficient between
the casting and chill plate was temperature-dependent, varying from 196 W m ² K ¹ at 1473 K to 750 W m ² K ¹ at 1773 K. Similarly, the casting–mold interface coefficient was defined as temperature-dependent, increasing from 50 W m ² K ¹ at 773 K to 750 W m ² K ¹ at 1773 K.
The entire casting (including the starter block, spiral grain selector, and cylindrical casting region) was meshed with a uniform 1 mm element size. Coarse meshes of 10 mm were used for the insulation layer and furnace walls to reduce computational cost. The ceramic mold thickness was set to 8 mm, consistent with the experimental fabrication.
Figure 3 shows the as-cast single-crystal specimens together with the grain-selection system after separation from the central runner. The starter blocks used in these castings were produced with diameter-to-height (D/H) ratios of 0.3, 0.5, and 0.7, enabling a direct comparison of how starter-block geometry influences grain competition during directional solidification.
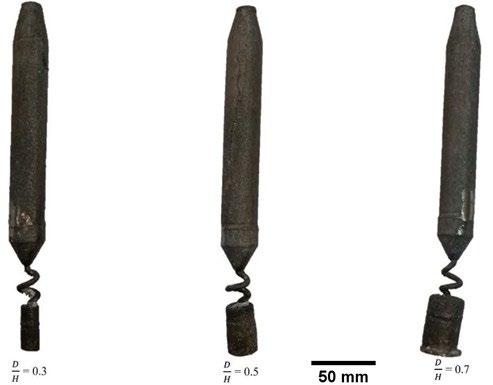
Fig.3 - Single crystal castings with the grain selection system after separation from the central runner. The samples correspond to starter blocks with diameter-to-height (D/H) ratios of 0.3 (left), 0.5 (center), and 0.7 (right).
According to post-casting Laue back-reflection measurements, supported by cross-sectional examination near the upper region of the grain selector, all three specimens were confirmed to be single crystals. The
crystallographic orientation deviations from the preferred [001] growth direction were subsequently quantified using X-ray diffraction analysis, as presented in figure 4.
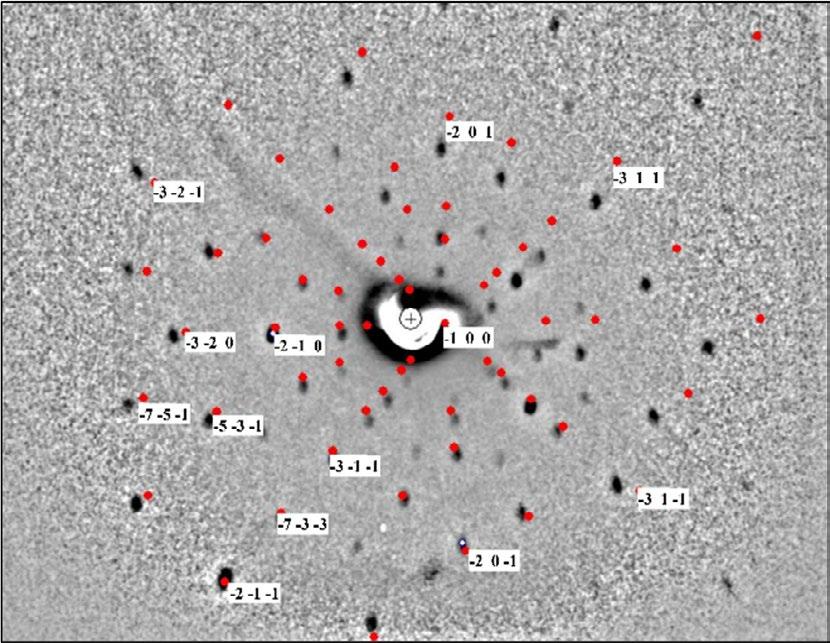
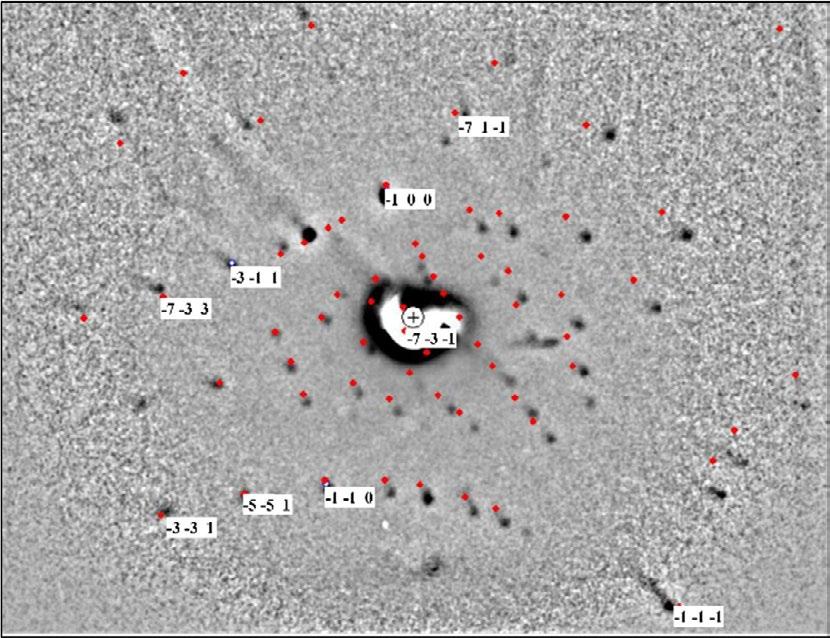
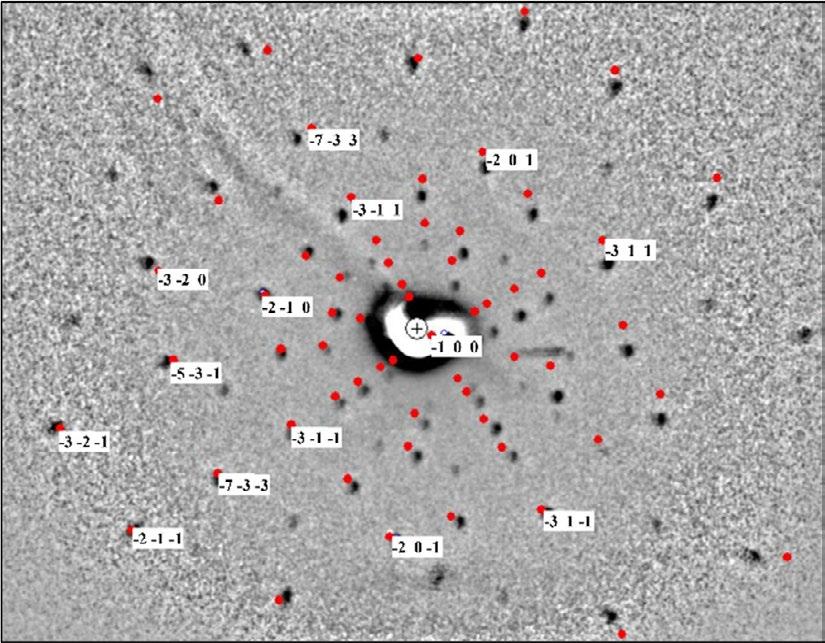
Fig.4- X-ray diffraction patterns obtained from Laue tests for single crystal samples cast with starter block diameter-to-height (D/H) ratios of (a) 0.3, (b) 0.5, and (c) 0.7.
Based on the X-ray diffraction results shown in figure 4, the crystallographic deviations from the preferred [001] orientation were determined to be 6.3°, 21.7°, and 3.3° for the single-crystal samples produced with starter block D/H ratios of 0.3, 0.5, and 0.7, respectively. The absence of a monotonic or linear trend between the D/H ratio and the resulting deviation angle indicates that crystallographic alignment is not governed solely by the geometric ratio of the starter block. Instead, these results suggest a more complex interaction among local thermal gradients, the number of nucleated grains at the chill plate, and competitive dendrite growth within the restricted starterblock volume. Small variations in initial nucleation density or in the orientation of early surviving grains can dominate the final selected grain, leading to non-systematic orientation outcomes even when geometric parameters appear well controlled.
In addition to these factors, it should be noted that the selected D/H ratios (0.3, 0.5, and 0.7) represent relatively large incremental changes (Δ = 0.2), which may obscure the gradual evolution of the solidification mechanism inside the starter block. At a D/H ratio of 0.3, the reduced crosssection limits heat extraction through the starter block walls, resulting in a noticeably lower thermal gradient and a slower advancement of the solidification front. Under such conditions, thermal filtering becomes less effective and the solid–liquid interface remains insufficiently constrained, allowing misoriented grains to survive longer during competitive growth. This environment increases the likelihood of stray-grain formation. As the D/H ratio increases, heat extraction becomes more efficient, the thermal gradient strengthens, and the solidification front advances more steadily. These improvements enhance competitive grain selection and promote the
suppression of unfavorably oriented grains. This gradual shift in interface behavior across the examined D/H ratios providesaplausiblephysicalexplanationfortheobserved differences in stray-grain formation and clarifies why the final[001]deviationdoesnotfollowalinearormonotonic trend with D/H. These experimentally inferred thermal behaviors were further verified through numerical simulation.
Finite-element thermal simulations (ProCAST) further clarifiedwhytheexperimentallyobservedmisorientations did not follow a monotonic trend with starter-block geometry. As also reflected in the longitudinal-section observations of figure 5, the isothermal-velocity maps demonstrated that at D/H = 0.3 the solidification front exhibits relatively high isotherm velocities and an unstable progression, indicating weak thermal gradients and inefficient heat extraction. Under these conditions,
thermal filtering inside the starter block becomes ineffective, enabling the survival of misoriented grains. Increasing the ratio from 0.3 to 0.5 reduced isotherm velocitybutdidnotfullystabilizetheinterface,suggesting thatthisintervalcorrespondstoatransitionregimewhere the dominant solidification mechanism remains partially unstable. In contrast, the change from D/H = 0.5 to 0.7 resulted in a marked drop in isotherm velocity and the development of a flat, well-anchored solidification front with significantly stronger thermal gradients; consistent with the absence of stray grains in figure 5 and with the minimal [001] deviation measured at D/H = 0.7. These simulation-supported trends explain why small geometric changes do not produce proportional orientation changes and why the 0.5 sample shows the largest misorientation despite having an intermediate geometry.
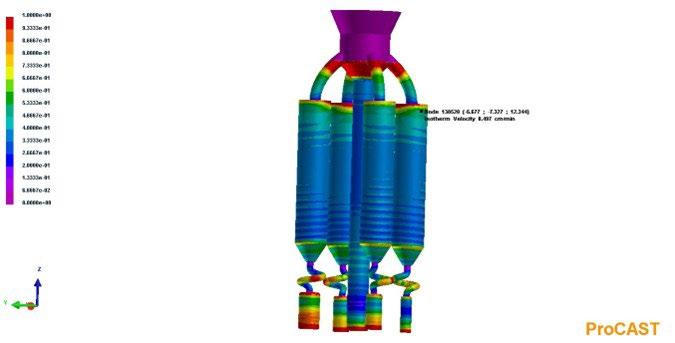
Fig.5 - Isotherm-velocity contours from ProCAST simulations for starter blocks with different D/H ratios, corresponding to steady-state conditions after initial thermal equilibration.
Recent numerical analyses of grain selectors have shown thatsmallgeometricalmodificationscansignificantlyalter the local thermal field and the degree of undercooling, thereby affecting competitive dendrite growth and the stability of grain selection. These observations are consistent with the trends observed in the present ProCASTsimulations,wherechangesinthestarter-block geometry modified the isotherm velocity and interface stability[15].
The longitudinal sections presented in figure 6 further illustratetheinfluenceofstarter-blockgeometryongrain selection. Stray grains were observed in the castings
with D/H ratios of 0.3 and 0.5, predominantly located in the upper region of the starter block and adjacent selector zone. These misoriented grains likely arise from insufficient thermal filtering and reduced competitive growth efficiency when the starter block does not impose enough lateral constraint on early dendrite growth. This interpretation is consistent with earlier findings in the literature: Yang et al. [11] demonstrated that inadequate thermal alignment within the starter block facilitates the survival of misoriented grains, while Carter et al. [12]and Wang et al. [13] showed that the efficiency of thermal filtering and competitive grain selection
is strongly governed by starter-block geometry, with suboptimal D/H ratios increasing the likelihood of straygrain formation. Sadeghi et al. [14] further confirmed that variations in the D/H ratio directly influence the stability ofthesolidificationfrontandtheprobabilityofstray-grain generation.IncontrasttotheD/H=0.3and0.5specimens, the casting produced with a D/H ratio of 0.7 exhibited no detectablestraygrainsintheexaminedsection,indicating a more effective suppression of competitive grains and strongerselectionofadominantdendrite. It should be noted, however, that figure 6 represents
a single longitudinal plane from each casting. Given the inherently three-dimensional nature of dendritic growth and competitive grain selection, the spatial distribution and volume fraction of stray grains may vary in other sections of the same specimen. Nonetheless, the consistent presence or absence of stray grains across both D/H = 0.3 and 0.5 samples provides strong qualitative evidence that starter-block geometry influences grainselection stability, even if it does not uniquely determine the final [001] deviation angle.
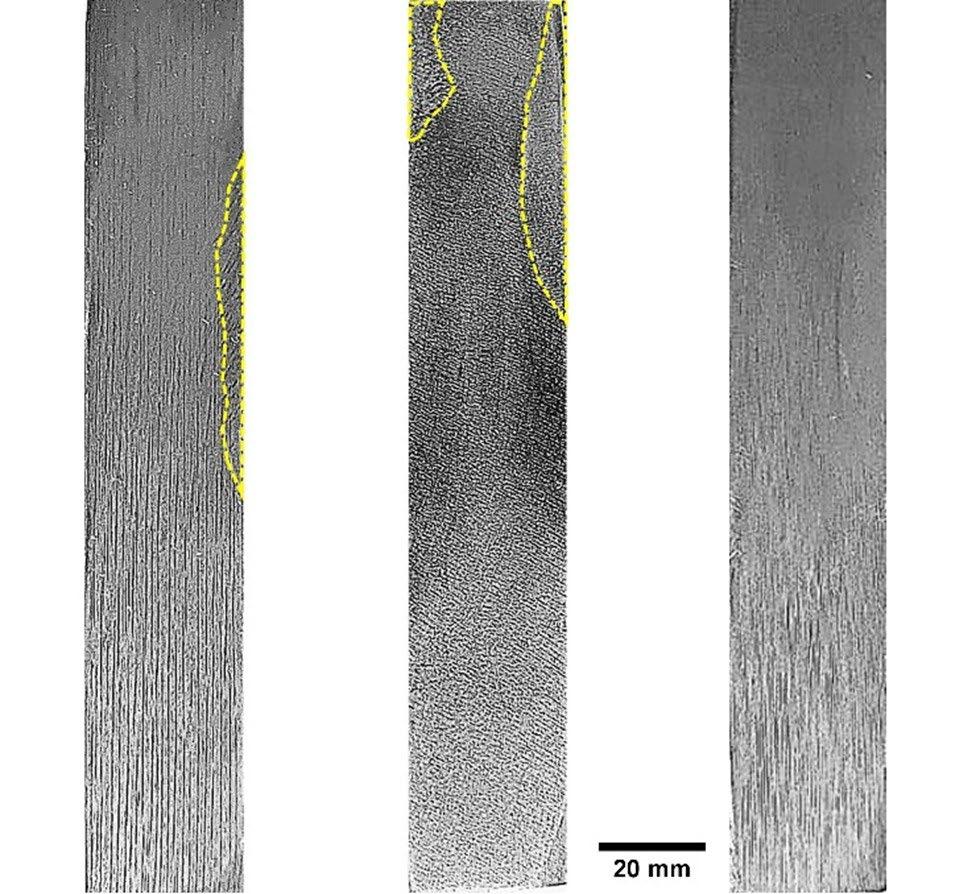
Fig.6- Macroscopic images of the longitudinal sections of single crystal castings after etching, corresponding to starter block diameter-to-height (D/H) ratios of (a) 0.3, (b) 0.5, and (c) 0.7. Stray grains are highlighted as dotted regions.
Figure 7 shows the cross-sectional microstructures of the single-crystal castings produced with different starter block D/H ratios. The contrast differences among the images (particularly the darker appearance in (b)) arise from variations in the local dendrite orientation relative to the [001]growth direction, which affects the way the etched surface reflects light. Tertiary dendrite arms are clearly visible in all samples and fill the interdendritic regions. These branches form once the primary dendrites exit the selector and enter the wider mold cavity, where sufficient lateral space is available for full dendritic development. In contrast, dendrite branching inside the starter block is
noticeably restricted due to the limited cross-sectional area and intense competitive growth among neighboring grains, which suppresses the formation of secondary and tertiary arms during the early stages of solidification.

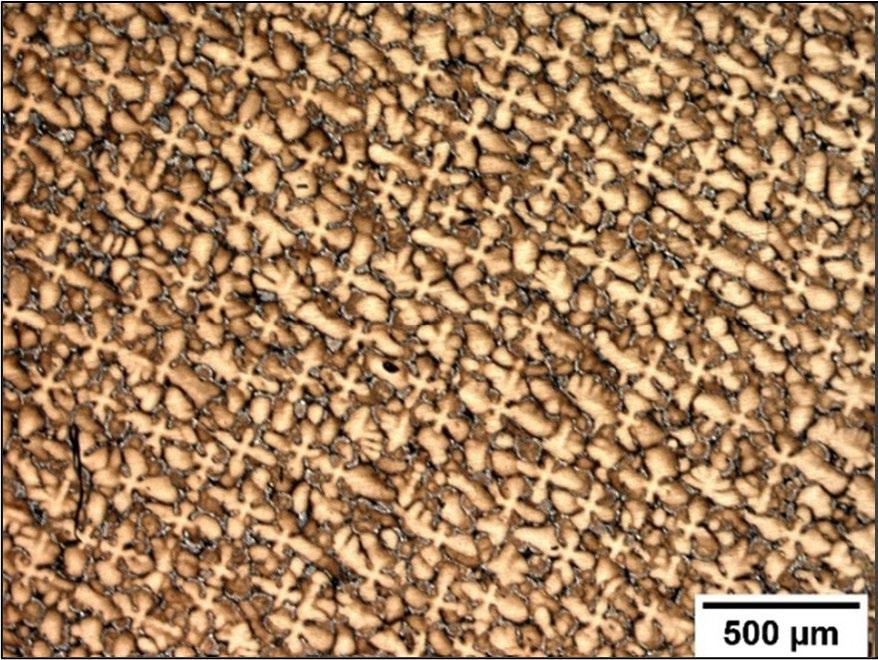
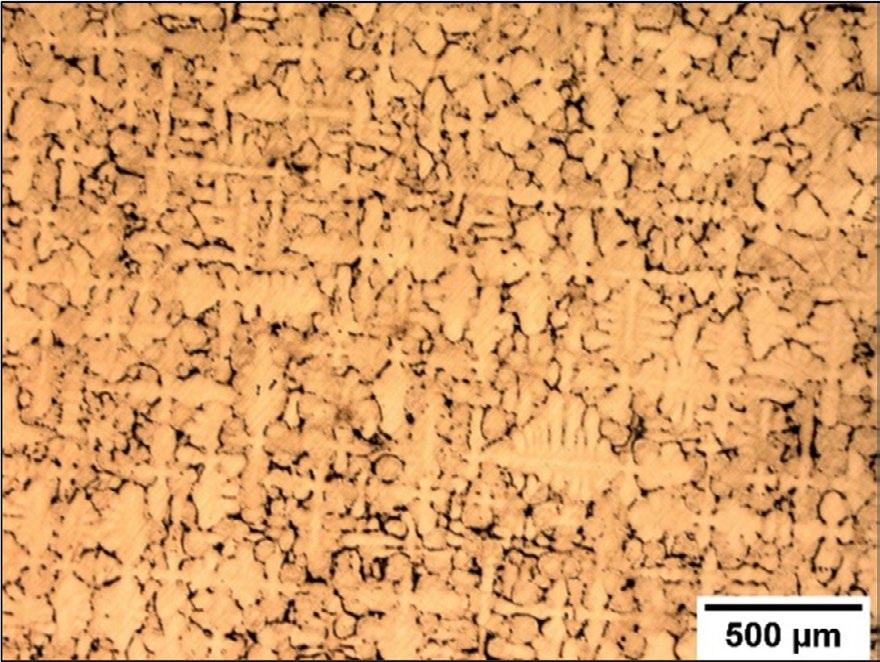
Fig.7-Opticalmicrographsofthecross-sectionalareasofas-castsinglecrystalsamplesafteretching, correspondingtostarterblockdiameter-to-height(D/H)ratiosof(a)0.3,(b)0.5,and(c)0.7.
The average primary dendrite arm spacing ( λ₁ ) was calculated using Equation 1 based on dendrite core counting in the cross-sectional micrographs. The measured λ₁ values for the samples with starter block D/H ratios of 0.3, 0.5, and 0.7 were 226.4 μ m, 232.4 μ m, and 241.6 μ m, respectively. Although a slight increasing trend is observed, the differences fall within the typical measurement uncertainty for this method and are therefore not considered significant. This limited variation is expected, as λ₁ is primarily governed by the local thermal gradient and solidification rate in the mold cavity; parameters that remained nearly constant across all castings due to the identical withdrawal rate and furnace conditions used in the process.
The average secondary dendrite arm spacing ( λ₂ ) for the samples with starter block diameter-to-height (D/H)
ratios of 0.3, 0.5, and 0.7 was measured to be 41.3 μ m, 36.7 μ m, and 39.3 μ m, respectively. Although λ₂ shows a slight decrease from D/H = 0.3 to 0.5 followed by a modest increase at D/H = 0.7, these fluctuations lie within the expected range of experimental and image-based measurement uncertainty. Consequently, no systematic or physically meaningful correlation between λ₂ and the starter-block geometry can be established. This behavior is consistent with the fact that λ₂ is predominantly controlled by the local cooling rate in the selector exit and mold cavity; parameters that remained essentially unchanged because all castings were produced under identical furnace conditions and a constant withdrawal rate. The longitudinal micrographs used for λ₂ measurements are not reproduced here to avoid redundancy with previous studies employing the same methodology.
This lack of sensitivity of λ₁ and λ₂ to the starter-block D/H ratio is consistent with previous findings by Carter et al. [12], Wang et al. [13], and Sadeghi et al. [14], who reported that dendrite arm spacings are primarily controlled by the local cooling rate and thermal gradient in the mold cavity, and are largely unaffected by variations in starter-block geometry when the withdrawal rate and furnace conditions remain constant.
Figure 8 illustrates the rupture life of the heat-treated single-crystal samples tested at 850 °C and 560 MPa, plotted as a function of their deviation from the preferred [001]crystallographic orientation. A clear inverse relationship is observed: increasing the deviation from
3.3° to 6.3° reduces the rupture life from 123 to 98 h (~20%), and a further increase to 21.7° results in a drastic drop to 25 h, representing an ~80% reduction relative to the best-aligned specimen. This systematic and strong degradation trend reflects the strong sensitivity of CMSX4 to crystallographic misalignment, as deviation from the <001>axis increases the resolved shear stress on critical slip and climb systems, promotes earlier γ′ shearing or rafting in unfavorable directions, and accelerates cavity nucleation and coalescence during creep. Thus, even modest deviations from the ideal growth direction have a pronounced detrimental effect on creep rupture life.
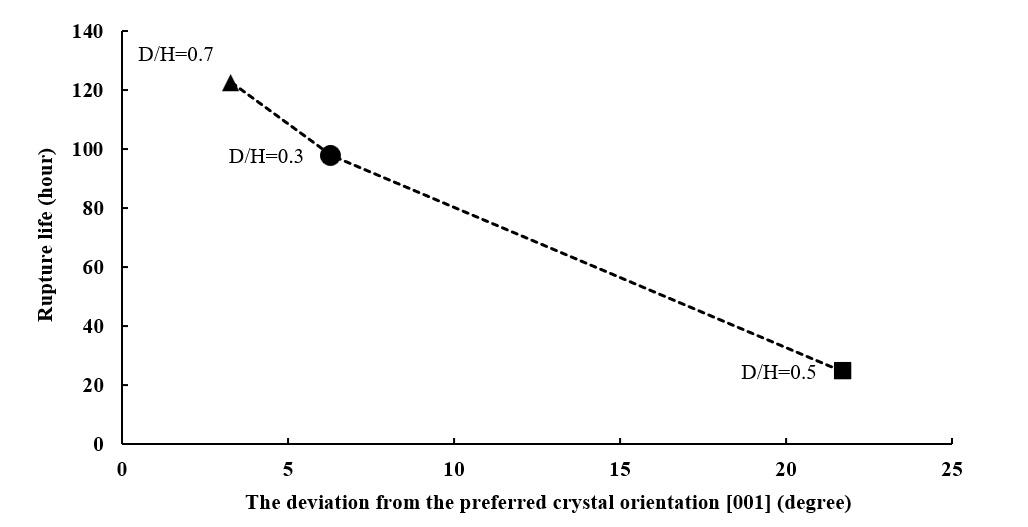
Fig.8-Rupturelifeofsamplespreparedfromsinglecrystalcastingswithdifferentdiameter-to-height(D/H) ratios,asafunctionofdeviationfromthepreferred[001]crystallographicorientation.Allsamplesweretestedat 850°Cand560MPaafterstandardheattreatment.
This strong inverse dependence between misorientation and rupture life is consistent with previous reports showing that even moderate deviations from the <001> axis increase the activation of non-preferred slip systems and accelerate creep damage in CMSX-4 and other nickel-based single crystals [3,7,17–19]. However, the magnitude of the reduction observed in this study is more pronounced, which can be attributed to the combined effects of crystallographic misalignment and castinginduced porosity under the relatively high withdrawal rate used.
Literature reports for CMSX-4 show that single crystals tested at 850 °C and 560 MPa with near-ideal [001]
alignment typically exhibit rupture lives of 150–170 h [24]. In contrast, the highest rupture life obtained in the present study was 123 h for the specimen with only 3.3° misorientation. This reduction cannot be explained solely by the slight orientation deviation; instead, it is primarily associated with the relatively high mold withdrawal rate used during directional solidification (9 mm/min). Such a withdrawal rate decreases the local thermal gradient and increases solidification velocity, conditions known to promote interdendritic porosity formation. The residual pores were not fully eliminated during the standard heattreatment cycle and subsequently acted as preferential nucleation sites for creep cavitation. Their presence
accelerated cavity growth and damage accumulation, thereby reducing the rupture life even in the best-oriented sample.
Fractographic examination of all tested specimens revealed the presence of interdendritic cavities, indicating that residual casting porosity played an active role in creep damage evolution. These cavities frequently showed signs of symmetric damage initiation on opposing faces, a characteristic feature of cavitationcontrolled rupture in single-crystal superalloys. Such
morphology suggests that cavity nucleation occurred preferentially at pre-existing pores, followed by stressassisted growth and coalescence during creep. Figure 9 illustrates a representative example from the sample with a 21.7° deviation, where a pronounced double-lobed cavity structure is clearly visible near the fracture surface, consistent with advanced cavitation and localized stress concentration.
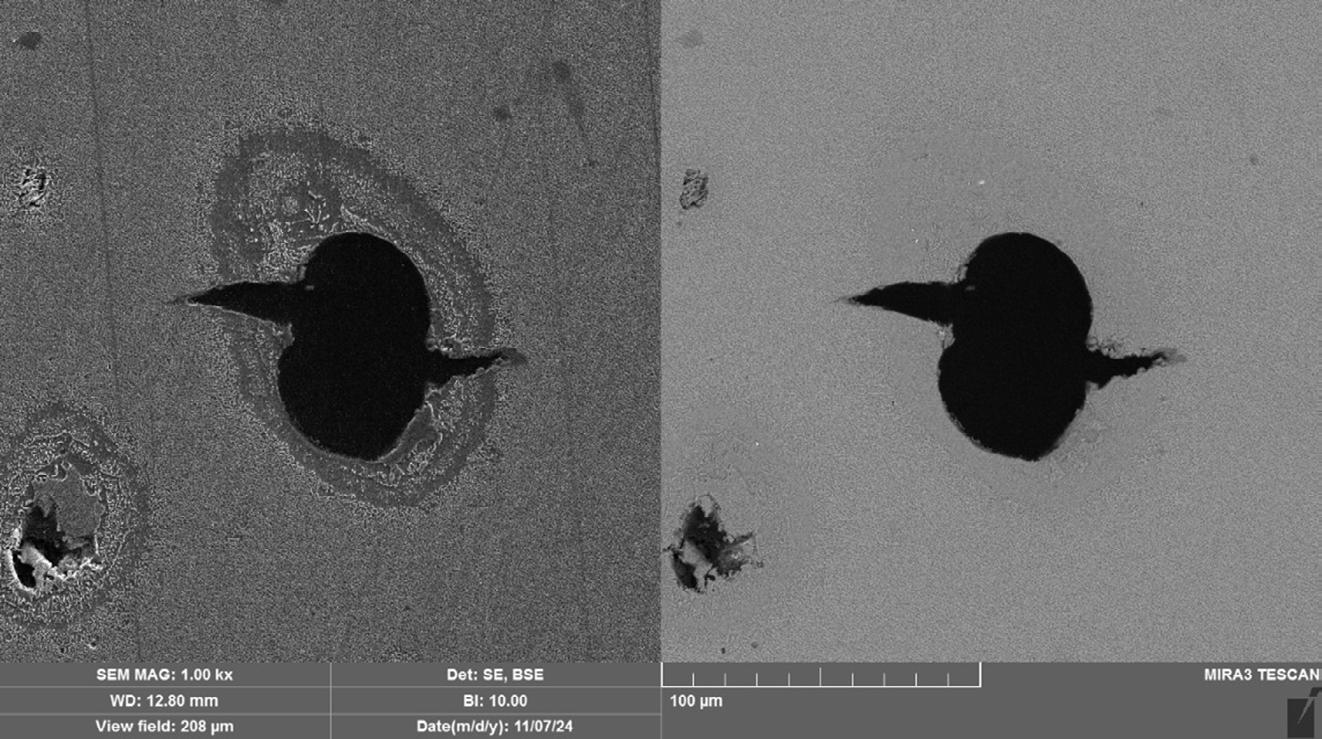
To further interpret the results presented in Figure 8 (where a pronounced reduction in rupture life was observed with increasing deviation from the [001] crystallographic orientation) a comparative fractographic analysis was conducted. The objective of this analysis was to identify the underlying microstructural damage mechanisms responsible for the variation in creep performance among the samples. By examining the fracture surfaces, it was possible to assess the role of casting-induced porosity, cavitation behavior, and deformation-induced microstructural features, thereby establishing a direct link between crystallographic misalignment and the dominant creep damage pathways.
Figure 10 presents SEM images of the fracture surfaces of the single-crystal samples produced with starterblock D/H ratios of 0.3, 0.5, and 0.7. All micrographs were captured at the same magnification (70 × ) to enable
a direct comparison of cavity morphology and failure characteristics. The specimen with the lowest deviation from the [001] direction (3.3°, D/H = 0.7) exhibits a relatively uniform and fine-scale fracture surface, with limited evidence of cavity nucleation or coalescence. In contrast, the sample with the highest misorientation (21.7°, D/H = 0.5) shows a markedly rougher fracture surface containing numerous irregular and coalesced cavities, consistent with the progression of severe creep damage prior to rupture. The intermediate specimen (6.3°, D/H = 0.3) displays fracture features between these two extremes, presenting a mixture of isolated cavities and partially coalesced voids. This systematic transition in fracture morphology reinforces the observed trend in rupture life, indicating that increasing crystallographic deviation promotes more aggressive cavitation-driven damage accumulation.
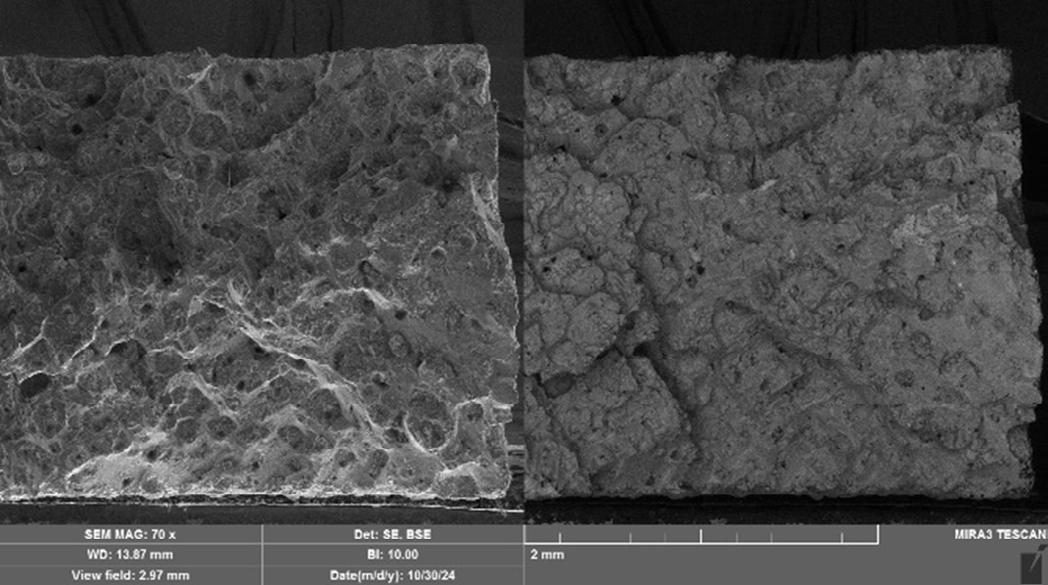
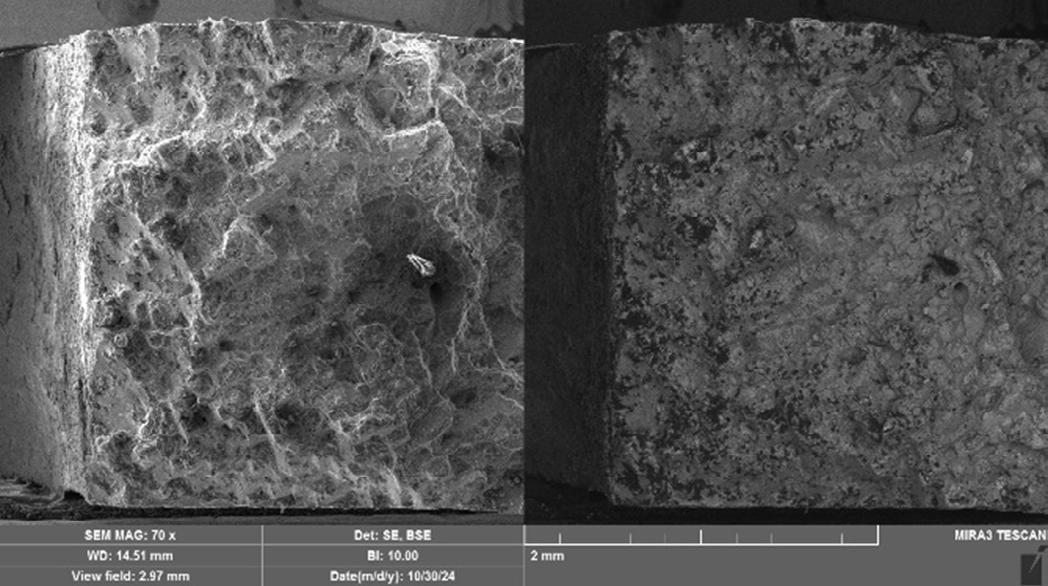
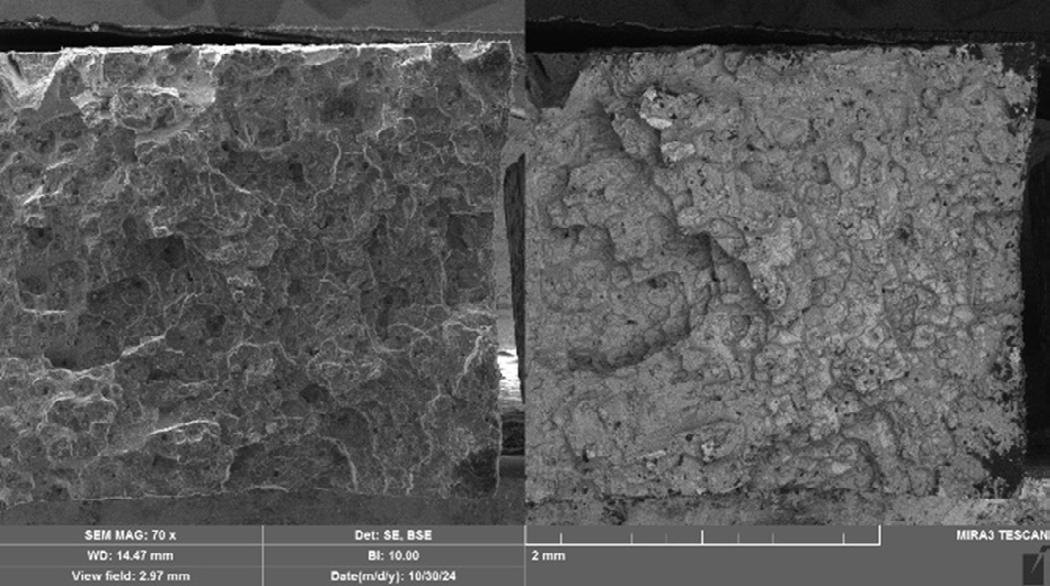
Fig.10 - SEM images of the fracture region for single crystal samples with different starter block diameter-toheight ratios: (a) 0.3, (b) 0.5, (c) 0.7.
The higher-magnification images presented in figure 11 provide further confirmation that cavitation-mediated damage is the dominant creep-rupture mechanism in all samples. Interdendritic cavities, microvoids, and earlystage coalescence features are visible throughout the fracture surfaces, consistent with creep deformation occurring preferentially along interdendritic regions. However, clear differences emerge in the extent and morphology of these damage features. The specimen with the largest crystallographic deviation (21.7°) exhibits
extensive cavity coalescence, larger void clusters, and more irregular cavity networks, indicating accelerated damage accumulation and reduced resistance to creep deformation. In contrast, the samples with lower deviations (including the 3 3° specimen) show smaller, more isolated cavities with limited linkage, reflecting a slower progression of void growth. This systematic variation in cavity morphology strongly supports the correlation between increasing misorientation from the [001] axisandtheseverityofcavitation-drivenrupture
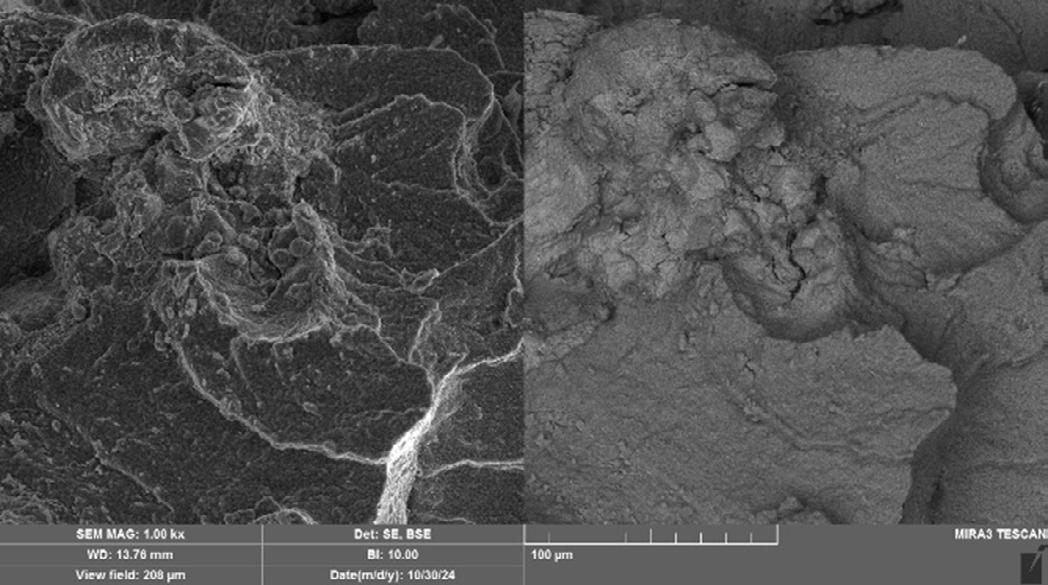
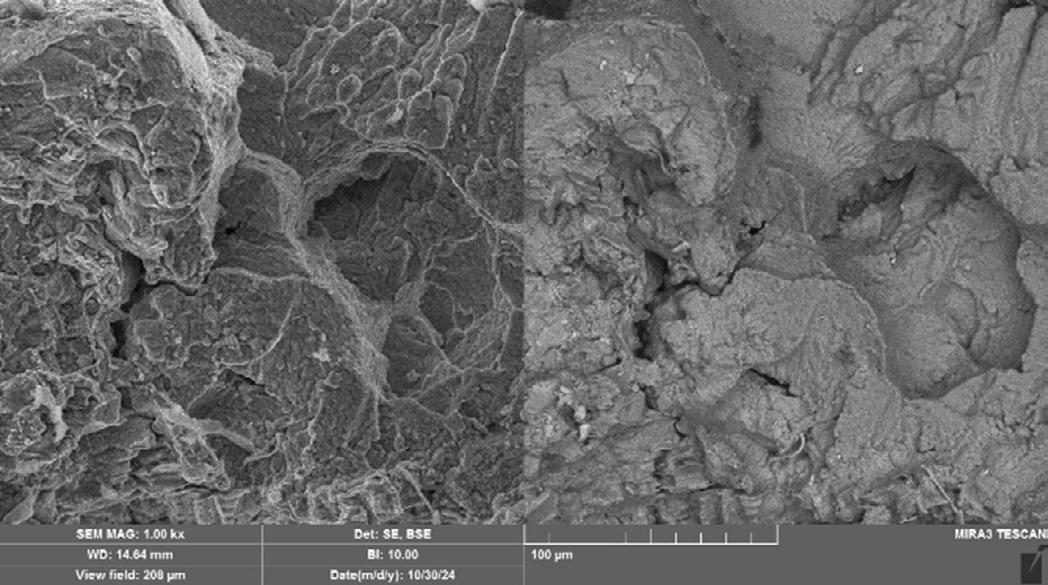
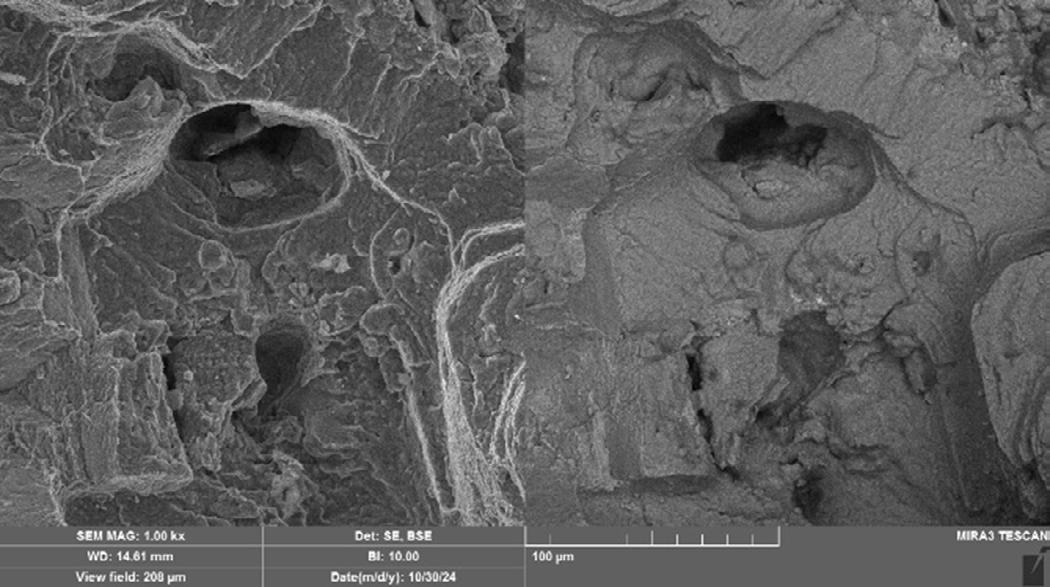
Fig.11 - High-magnification SEM images (1000 × ) of the fracture surfaces of single crystal samples with different starter block diameter-to-height ratios: (a) 0.3, (b) 0.5, (c) 0.7.
In summary, the fracture ‐ surface analysis confirms that cavitation is the dominant mechanism governing creep rupture in CMSX-4 single crystals under the present testing conditions. Although all specimens exhibited interdendritic cavities, clear differences in cavity size, morphology, and degree of coalescence were observed as a function of crystallographic deviation from the [001]orientation. Samples with larger misorientations displayed more irregular and extensively coalesced cavities, reflecting enhanced local stress concentrations and accelerated void growth. Conversely, specimens with lower deviation exhibited smaller, more isolated cavities, indicating a slower progression of creep damage. These fractographic trends are fully consistent with the rupture-life results, demonstrating that misorientation increases the activation of non-preferred slip systems, thereby amplifying the detrimental effects of castinginduced porosity. Collectively, the findings show that
both accurate crystallographic alignment and effective porosity control are essential for achieving optimal creep performance in single-crystal superalloys.
To further assess the microstructural integrity of the bestperforming specimen, SEM imaging was carried out on the fracture region of the single-crystal sample with the smallest deviation from the [001] crystallographic direction (3.3°). Figure 12 presents a representative backscatteredelectron micrograph in which two locations were selected for EDS analysis.
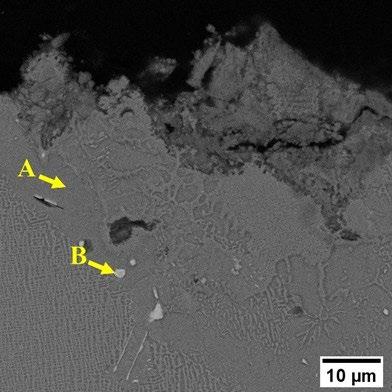
- SEM image of the fracture region in the 3.3° deviation sample, showing the locations of points A (matrix adjacent to cavity) and B (precipitate-like region).
The elemental compositions measured at the two analyzed locations are summarized in figure 13. Point A (situated adjacent to the halo-like region surrounding a creep cavity) exhibits elevated Al and Ti contents, reflecting the γ′ -rich matrix where local redistribution has occurred during creep. Point B, taken from the bright precipitatelike feature visible in the backscattered image, shows pronounced enrichment in heavy refractory elements, particularly Re. This compositional contrast confirms that
stress-assisted, Re-rich secondary precipitates form in the vicinity of creep damage, accompanied by measurable depletion of refractory elements in the surrounding matrix. The simultaneous occurrence of matrix depletion at Point A and heavy-element enrichment at Point B provides strong evidence for diffusion-driven segregation processes that promote cavity nucleation and accelerate damage evolution, even in the sample with near-ideal crystallographic orientation.
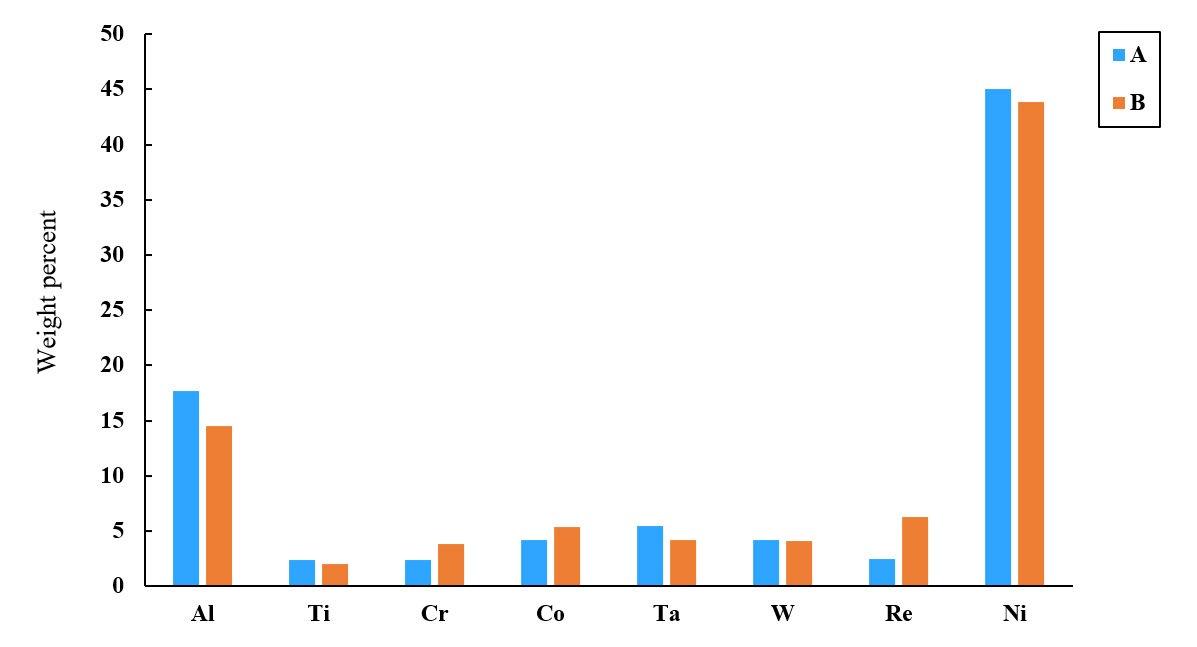
Fig.13 - Weight percent of selected elements at points A (adjacent to cavity) and B (Re-rich precipitate) in the fractured region of the 3.3° deviation sample.
Overall, these results demonstrate that elemental segregation and the formation of Re-rich secondary precipitates occur even in the single crystal with the smallest crystallographic deviation. The pronounced enrichment of Re and other heavy refractory elements within stress-assisted precipitates, together with their measurable depletion in the adjacent γ/γ′ matrix, reflects an active diffusion-controlled redistribution during creep. This localized chemical imbalance reduces matrix stability and facilitates cavity nucleation and growth. Consequently, the findings show that accurate crystallographic alignment (while beneficial) cannot fully compensate for the detrimental effects of diffusioninduced segregation and residual porosity on the creep performance of CMSX-4 single crystals. Although the formation of Re-rich secondary phases and their direct association with cavity nucleation have not been explicitly reported in the cited literature, the observed diffusion-controlled segregation is consistent with previously described creep-damage mechanisms in CMSX-4 and related single-crystal alloys [3,7,17–19], where local stress concentrations and refractory-element redistribution contribute to microstructural degradation during high-temperature deformation.
CMSX-4 single crystals were directionally solidified using starter-block D/H ratios of 0.3, 0.5, and 0.7, resulting in misorientations of 6.3°, 21.7°, and 3.3°, respectively, with no monotonic dependence on block geometry. ProCAST thermal simulations demonstrated that the 0.3 → 0.5 interval corresponds to an unstable solidification regime with high isotherm velocities, whereas the transition to D/H = 0.7 produces a stable, well-anchored front, explaining the presence of stray grains at low ratios and the minimal deviation at 0.7. Creep rupture testing showed a strong inverse relationship between misorientation and creep resistance, with rupture life decreasing sharply as deviation from the [001] direction increased. Microstructural evaluations revealed only minor variations in λ₁ and λ₂ , confirming that dendrite spacing was not a critical factor in the performance differences. Fractography and EDS analysis identified interdendritic porosity, cavity coalescence, and diffusiondriven segregation of refractory elements as the dominant contributors to damage evolution. Together, these results demonstrate that both crystallographic alignment and porosity control (governed by starter-block design and solidification stability) must be optimized to achieve superior creep performance in CMSX-4 single crystals.
[1] K. Harris, J. B. Wahl, “Improved single crystal superalloys, CMSX-4 (SLS)[La+ Y] and CMSX-486,” Superalloys, 2004, pp. 45-52. Doi:10.7449/2004/Superalloys_2004_45_52
[2] A. Basak, D. Suman, “Effect of heat treatment on the microstructures of CMSX-4® processed through scanning laser epitaxy (SLE),” International Solid Freeform Fabrication Symposium, University of Texas at Austin, 2017.https://api.semanticscholar.org/ CorpusID:210920054
[3] K. Harris, G. L. Erickson, R. E. Schwer, “Directionally solidified and single-crystal superalloys,” Metals Handbook, 1990, Vol. 1, pp. 995-1006.
[4] Z. Li, J. Xiong, Q. Xu, J. Li, B. Liu, “Deformation and recrystallization of single crystal nickel-based superalloys during investment casting,” Journal of Materials Processing Technology, 2015, Vol. 217, pp. 1-12.
[5] C. T. Liu, X. M. Li, B. Wang, Z. M. Ren, J. Y. Zhang, “Effect of Simulation Conditions on Grain Selection during Solidification of Single Crystal Casting,” Advanced Materials Research, Trans Tech Publications, 2011, Vol. 146, pp. 829-833.
[6] L. W. Jiang, S. S. Li, M. L. Wu, Y. F. Han, “Grain Competition Mechanism of a Ni3Al-based Single Crystal Superalloy IC6SX,” Materials Science Forum, Trans Tech Publications, 2013, Vol. 747, pp. 797-803.
[7] D. W. MacLachlan, G. S. K. Gunturi, D. M. Knowles, “Modelling the uniaxial creep anisotropy of nickel base single crystal superalloys CMSX-4 and RR2000 at 1023 K using a slip system based finite element approach,” Computational Materials Science, 2002, Vol. 25, pp. 129-141. https://doi.org/10.1016/S0927-0256(02)00257-4
[8] B. Chmiela, M. Sozańska, “Analysis of high angle boundaries in directionally solidified turbine blade made of CMSX-4® superalloy,” IOP Conference Series: Materials Science and Engineering, 2011, Vol. 22, No. 1, p. 012008 Doi: 10.1088/1757-899X/22/1/012008
[9] A. Onyszko, “Gamma Prime Crystal Lattice Orientation of Turbine Blades of the Single Crystal Nickel Based CMSX-4 Superalloy,” Solid State Phenomena, Trans Tech Publications, 2013, Vol. 203, pp. 169-172.
[10] M. H. Raza, A. Wasim, S. Hussain, M. Sajid, M. Jahanzaib, “Grain Selection and Crystal Orientation in Single‐ Crystal Casting: State of the Art,” Crystal Research and Technology, 2019, Vol. 54, p. 1800177.
[11] X. Yang, D. Ness, P. D. Lee, N. D’Souza, “Simulation of stray grain formation during single crystal seed melt-back and initial withdrawal in the Ni-base superalloy CMSX4,” Materials Science and Engineering: A, 2005, Vol. 413, pp. 571-577.
[12] P. Carter, D. C. Cox, C. A. Gandin, R. C. Reed, “Process modelling of grain selection during the solidification of single crystal superalloy castings,” Materials Science and Engineering: A, 2000, Vol. 280, pp. 233-246.
[13] N. Wang, L. Liu, S. Gao, X. Zhao, T. Huang, J. Zhang, H. Fu, “Simulation of grain selection during single crystal casting of a Ni-base superalloy,” Journal of Alloys and Compounds, 2014, Vol. 586, pp. 220-229.
[14] F. Sadeghi, A. Kermanpur, E. Norouzi, “Optimizing Grain Selection Design in the Single‐ Crystal Solidification of Ni‐Based Superalloys”, Crystal Research and Technology, 2018, Vol. 53, p. 1800108.
[15] X. Zhu, F. Wang, D. Ma, “A Study of Grain Selection in Two-Dimensional (2D) Grain Selectors during the Investment Casting of Single-Crystal Superalloy,” Materials, 2023, Vol. 16(11), p. 4112.
[16] M. Uddagiri, O. Shchyglo, I. Steinbach, M. Tegeler, “Solidification of the Ni-based superalloy CMSX-4 simulated with full complexity in 3-dimensions,” Progress in Additive Manufacturing, 2024, Vol. 9(4), pp. 1185-1196.
[17] Q. Z. Chen,D. M. Knowles, “Mechanism of <112>/3 slip initiation and anisotropy of γ′ phase in CMSX-4 during creep at 750° C and 750 MPa,” Materials Science and Engineering: A, 2003, Vol. 356(1-2), pp. 352-367.
[18] D. Dye, A. Ma & R. C. Reed, “Numerical modelling of creep deformation in a CMSX-4 single crystal superalloy turbine blade,” Superalloys, 2008, Vol. 911, e919.
[19] Y. Liang, S. Li, C. Ai, Y. Han and S. Gong, “Effect of Mo content on microstructure and stress-rupture properties of a Ni-base single crystal superalloy,” Progress in Natural Science: Materials International, 2016, Vol. 26, pp. 112-116.
[20] P. Kontis & T. M. Smith, “A Review on the Partitioning of Solutes Along Dislocations and Stacking Faults in Superalloys,” Metallurgical and Materials Transactions: A, 2024, Vol. 55(12), pp. 4723-4741.
[21] W. Xia, X. Zhao, Q. Yue, L. Yue, J. Wang, Q. Ding, H. Bei, Z. Zhang, “Formative and controlled mechanisms of nano-sized γ′ precipitates with local phase-transition within dislocation networks of nickel-based single crystal superalloys,” Acta Materialia, 2021, Vol. 206, p. 116653.
[22] E. Vandersluis, C. Ravindran, “Comparison of measurement methods for secondary dendrite arm spacing,” Metallography Microstructure and Analysis, 2017, 6(1), 89-94.
[23] S. Kostić, A. Golubović, A. Valčić, “Primary and secondary dendrite spacing of Ni-based superalloy single crystals,” Journal of the Serbian Chemical Society, 2009, Vol. 74(1), pp. 61-69.
[24] R. C. Reed, “The superalloys: fundamentals and applications,” Cambridge University Press, 2008.
As an integral element of the event, the Conference will feature an exhibition, that will enable excellent exposure for products, technologies, innovative solutions or services. At this opportunity the Organizers will set an area strategically located as regards the main Conference rooms. Companies will be able to reinforce their participation and enhance their corporate identification by taking advantage of benefits offered to them as Contributing Sponsors of the Conference. More information will be soon available at the Conference website. For any further information please contact Siderweb - The Italian Steel Community: commerciale@siderweb.com tel. +39 030 2540006 Organised by


Corso di base modulare Corrosione webinar (zoom) - 27-28 gennaio, 10-11-24-25 febbraio, 5-19 marzo 2026
>> SCOPRI DI PIÙ
Corso
Failure Analysis
>> SCOPRI DI PIÙ Eventi AIM / AIM
Milano e Monza c/o OMECO, 4-5-12 febbraio 2026
>> SCOPRI DI PIÙ
International Journal of the Italian Association for Metallurgy
Giornata di Studio Ingegneria delle superfici per il settore alimentare Campogalliano (MO) - 17 febbraio 2026
Master MasterinProgettazionestampi Itinerante, febbraio-luglio 2026
>> SCOPRI DI PIÙ
Corso
Gli acciai inossidabili XII edizione Milano - 3-4-10-11-17-18 marzo 2026
>> SCOPRI DI PIÙ
n. 6 giugno 2020 Organo ufficiale dell’Associazione Italiana di Metallurgia. Rivista fondata nel 1909


Giornata di Studio Innovazione, efficienza e sostenibilità negli impianti di laminazione a caldo Legnano/Cuggiono (MI) - 6 marzo 2026
>> SCOPRI DI PIÙ
Corso Il disegno dei getti in leghe di alluminio Codesign e definizione dei sistemi di colata Kilometro Rosso Innovation District (Bergamo) - 10 marzo 2026
>> SCOPRI DI PIÙ
Giornata di Studio Tra resistenza a fatica e tenacità. La risposta delle leghe metalliche agli sforzi dinamici Milano c/o Centro Congressi FAST - 12 marzo 2026
>> SCOPRI DI PIÙ
EEC 2026 - EMECR 2026 Conferences - siderweb FORUM 4th European Electric Steelmaking conference, 5th International Conference on Energy and Material Efficiency and CO2 Reduction in the Steel Industry and the 2nd edition of the biennial event organised by siderweb to discuss the present and future of Italian and European steel Milano - 11-13 May 2026
>> MORE INFO
Summer school “Environmental Assisted Cracking” Milazzo (ME) - 5-9 July 2026
>> MORE INFO


WCCM 2026
The 4th World Congress on Condition Monitoring Milano, Italy - 25-28 August 2026
>> MORE INFO
41° Convegno Nazionale AIM
Progettiamo il futuro tra ricerca e innovazione Brescia - 9-11 settembre 2026
>> SCOPRI DI PIÙ
5th International Conference on INGOT CASTING, ROLLING & FORGING
Bardolino, Verona - 13-15 October 2026
>> MORE INFO
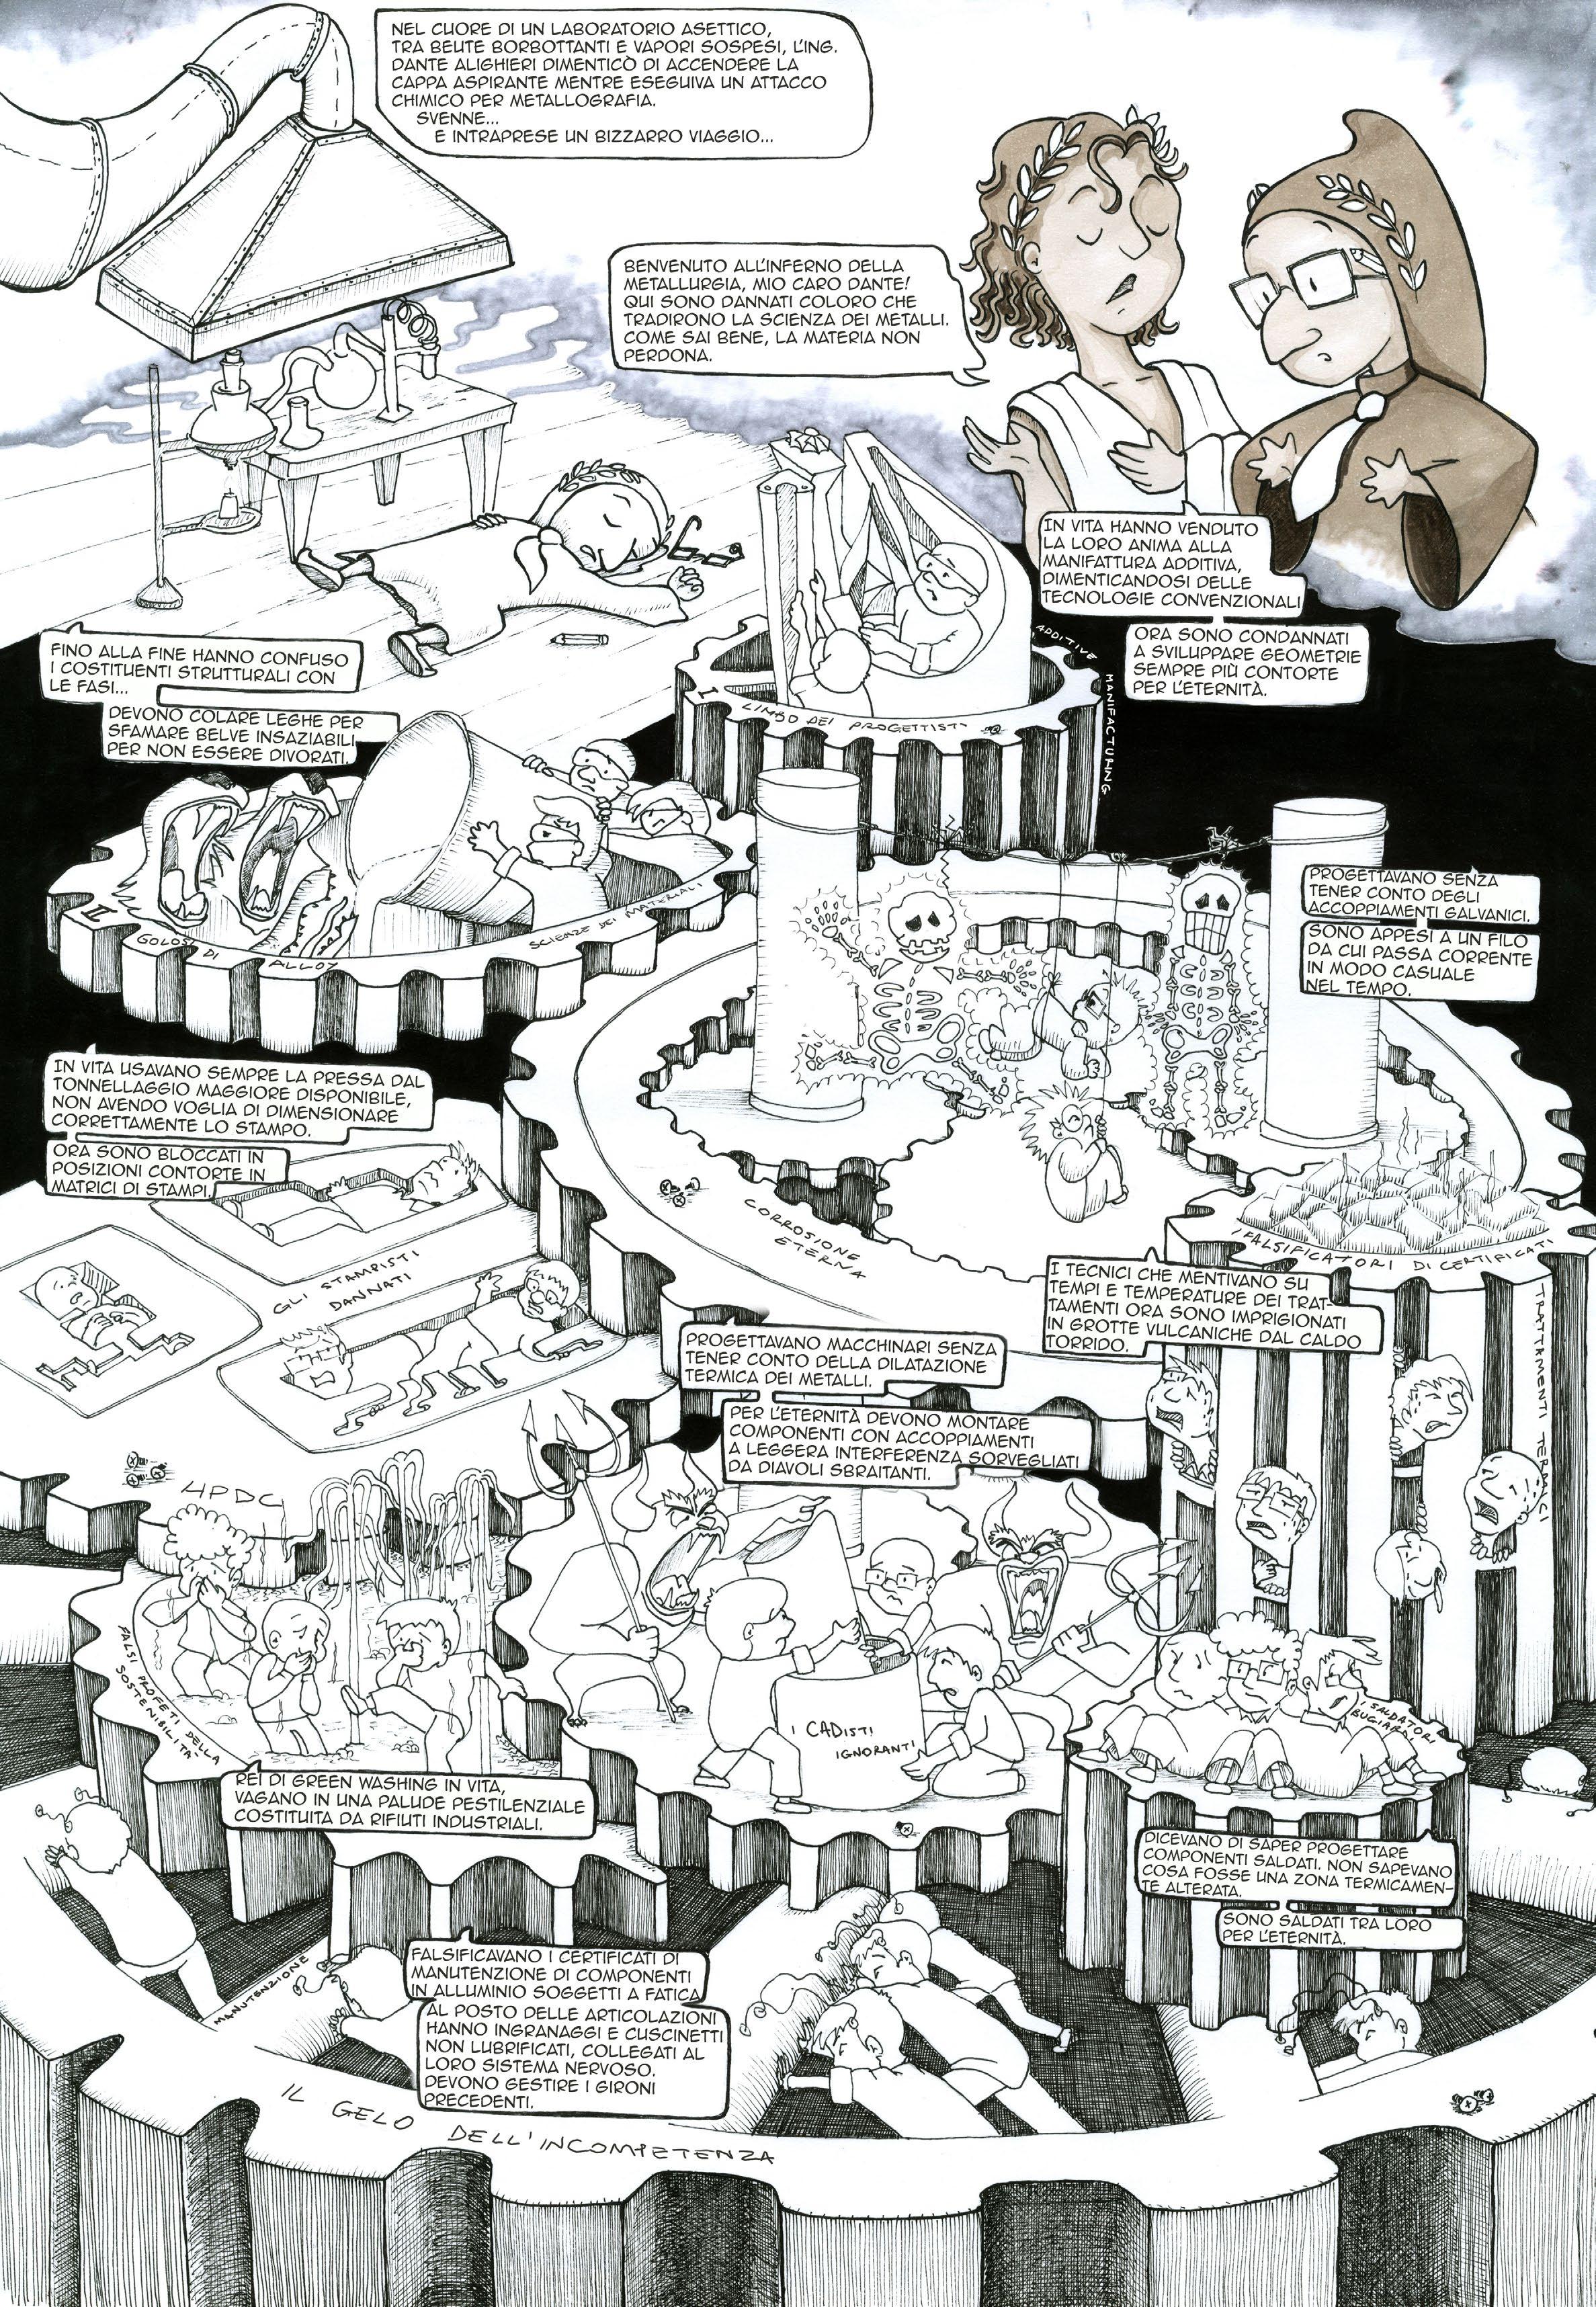
Si è tenuta durante il Consiglio direttivo AIM del 20 novembre 2025 la premiazione della prima edizione del concorso “Metallurgia a Fumetti” indetto dall’Associazione. Questo contest è stato pensato per avvicinare anche i non addetti ai lavori al mondo della metallurgia, affidandosi al linguaggio universale del fumetto e dell’illustrazione, con il fine ultimo di premiare la creatività e il talento al servizio della divulgazione tecnico-scientifica.
Data l’alta qualità delle numerose opere presentate, scegliere i primi classificati è stato difficile; l’Associazione ci tiene a ringraziare le artiste e gli artisti per l’accoglienza calorosa del concorso e per la loro preziosa partecipazione.
A partire da questo numero de La Metallurgia Italiana, verranno pubblicate le tavole vincitrici e le opere ritenute di maggior interesse dalla commissione valutatrice.
Vincitori edizione 2025
1° classificato: Luca Marchini, “L’inferno della Metallurgia”
2° classificato: Claudio Tegoni, “Ciclo imperiale”
3° classificato: Enzo Emilio Parente, “Metallurgia: dal fuoco alle stelle”

Luca MarchinieClaudioTegonidurantelapremiazionedel20novembre 2025insiemealdirettoredeLaMetallurgiaItalianaMarioCusolito.
A sinistra, “L’Inferno della Metallurgia”di Luca Marchini, Primo classificato della prima edizione del concorso “Metallurgia a fumetti” 2025 L’autore dell’opera ringrazia Elena Secchi Villa per il supporto alla realizzazione.
Normativa / Standards
Norme pubblicate e progetti in inchiesta (aggiornamento al 31 dicembre 2025)
Norme UNSIDER pubblicate da UNI nel mese di dicembre 2025
UNI EN 18035:2025
Acciai da precompressione – Trefoli cerati e inguainati per applicazioni nel settore delle costruzioni.
Norme UNSIDER pubblicate da CEN e ISO nel mese di dicembre 2025
EN ISO 5014:2025
Dense and insulating shaped refractory products – Determination of modulus of rupture at ambient temperature (ISO 5014:2025)
EN ISO 10059-1:2025
Dense shaped refractory products – Determination of cold compressive strength - Part 1: Referee test without packing (ISO 100591:2025)
EN ISO 8894-2:2025
Refractory materials – Determination of thermal conductivity - Part 2: Hot-wire method (parallel) (ISO 8894-2:2007)
EN ISO 26203-1:2025
Metallic materials – Tensile testing at high strain rates - Part 1: Elastic-bar-type systems (ISO 26203-1:2025)
EN 10342:2025
Magnetic materials – Classification of surface insulations of electrical steel sheet, strip and laminations
EN 10242:2025
Threaded pipe fittings in malleable cast iron
EN 10284:2025
Malleable cast iron fittings with compression ends for polyethylene (PE) piping systems
EN 10253-2:2021+A1:2025
Butt-welding pipe fittings - Part 2: Non alloy and ferritic alloy steels with specific inspection requirements
ISO 26203-1:2025
Metallic materials – Tensile testing at high strain rates - Part 1: Elastic-bar-type systems
ISO 24203:2025
Oil and gas industries including lower carbon energy – Bulk material for offshore projects –Schedule for architectural doors
ISO 21224:2025
Evaluation of centerline segregation of continuously cast slabs
Progetti UNSIDER messi allo studio dal CEN (Stage 10.99) – gennaio 2026
prEN ISO 19904-1 rev
Petroleum and natural gas industries including lower carbon energy – Floating offshore structures - Part 1: Ship-shaped, semi-submersible, spar and shallow-draught cylindrical structures
prEN ISO 12135
Metallic materials – Unified method of test for the determination of quasistatic fracture toughness
prEN 10303 rev
Thin magnetic steel strip and sheet for use at medium frequencies
prEN 10106 rev
Cold rolled non-oriented electrical steel strip and sheet delivered in the fully processed state
Progetti UNSIDER in inchiesta prEN e ISO/DIS – gennaio 2026
prEN – progetti di norma europei
prEN ISO 16440
Oil and gas industries including lower carbon energy – Pipeline transportation systems –Design, construction and maintenance of steel cased pipelines (ISO/DIS 16440:2025)
prEN ISO 15156-1
Oil and gas industries including lower carbon energy – Materials for use in H2S-containing environments in oil and gas production - Part 1: Materials and materials processing requirements (ISO/DIS 15156-1:2025)
prEN ISO 15156-2
Oil and gas industries including lower carbon energy – Materials for use in H2S-containing environments in oil and gas production - Part 2: Service environment assessment and material selection (ISO/DIS 15156-2:2025)
prEN ISO 15156-3
Oil and gas industries including lower carbon energy – Materials for use in H2S-containing environments in oil and gas production - Part 3: Verification, qualification and balloting requirements (ISO/DIS 15156-3:2025)
EN 13480-4:2024/prA1
Metallic industrial piping - Part 4: Fabrication and installation
EN 13480-5:2024/prA1
Metallic industrial piping - Part 5: Inspection and testing
EN 13480-2:2024/prA1
Metallic industrial piping - Part 2: Materials
ISO/DIS – progetti di norma internazionali
ISO/DIS 18991
Oil and gas industries including lower carbon energy – Drilling and production equipment –Top drive systems
ISO/DIS 15355
Steel and iron – Determination of chromium content – Indirect titration method
ISO/DIS 15156-1
Oil and gas industries including lower carbon energy – Materials for use in H<sub>2</
sub>S-containing environments in oil and gas production - Part 1: Materials and materials processing requirements
ISO/DIS 15156-2
Oil and gas industries including lower carbon energy – Materials for use in H<sub>2</ sub>S-containing environments in oil and gas production - Part 2: Service environment assessment and material selection
ISO/DIS 15156-3
Oil and gas industries including lower carbon energy – Materials for use in H<sub>2</ sub>S-containing environments in oil and gas production - Part 3: Verification, qualification and balloting requirements
ISO/DIS 12106
Metallic materials – Fatigue testing –Axial-strain-controlled method
ISO/DIS 5133
Oil and gas industries including lower carbon energy – Protective system requirements for fired equipment
Progetti UNSIDER al voto FprEN e ISO/ FDIS – gennaio 2026
FprEN – progetti di norma europei
FprEN ISO 14720-2
Testing of ceramic materials – Determination of sulfur in non-oxidic ceramic raw materials and ceramic materials - Part 2: Inductively coupled plasma optical emission spectrometry (ICP-OES) or ion chromatography (IC) after burning in the oxygen flow (ISO/FDIS 14720-2:2025)
FprEN ISO 14720-1
Testing of ceramic materials – Determination of sulfur in non-oxidic ceramic raw materials and ceramic materials - Part 1: Infrared measurement methods (ISO/FDIS 14720-1:2025)

SOTTOSCRIVI