A Second Chance, The Colonial City 54 4. The Grand Tour and other Early Travel Maps 76 5. Great Asian City Plans 88 6. The Frontier Capital – Gold Rushes and More 114 7. Industrial Revolution / Age of Rail 138
8. The Modern Administrative Plan 156 9. The Pictorial City 188
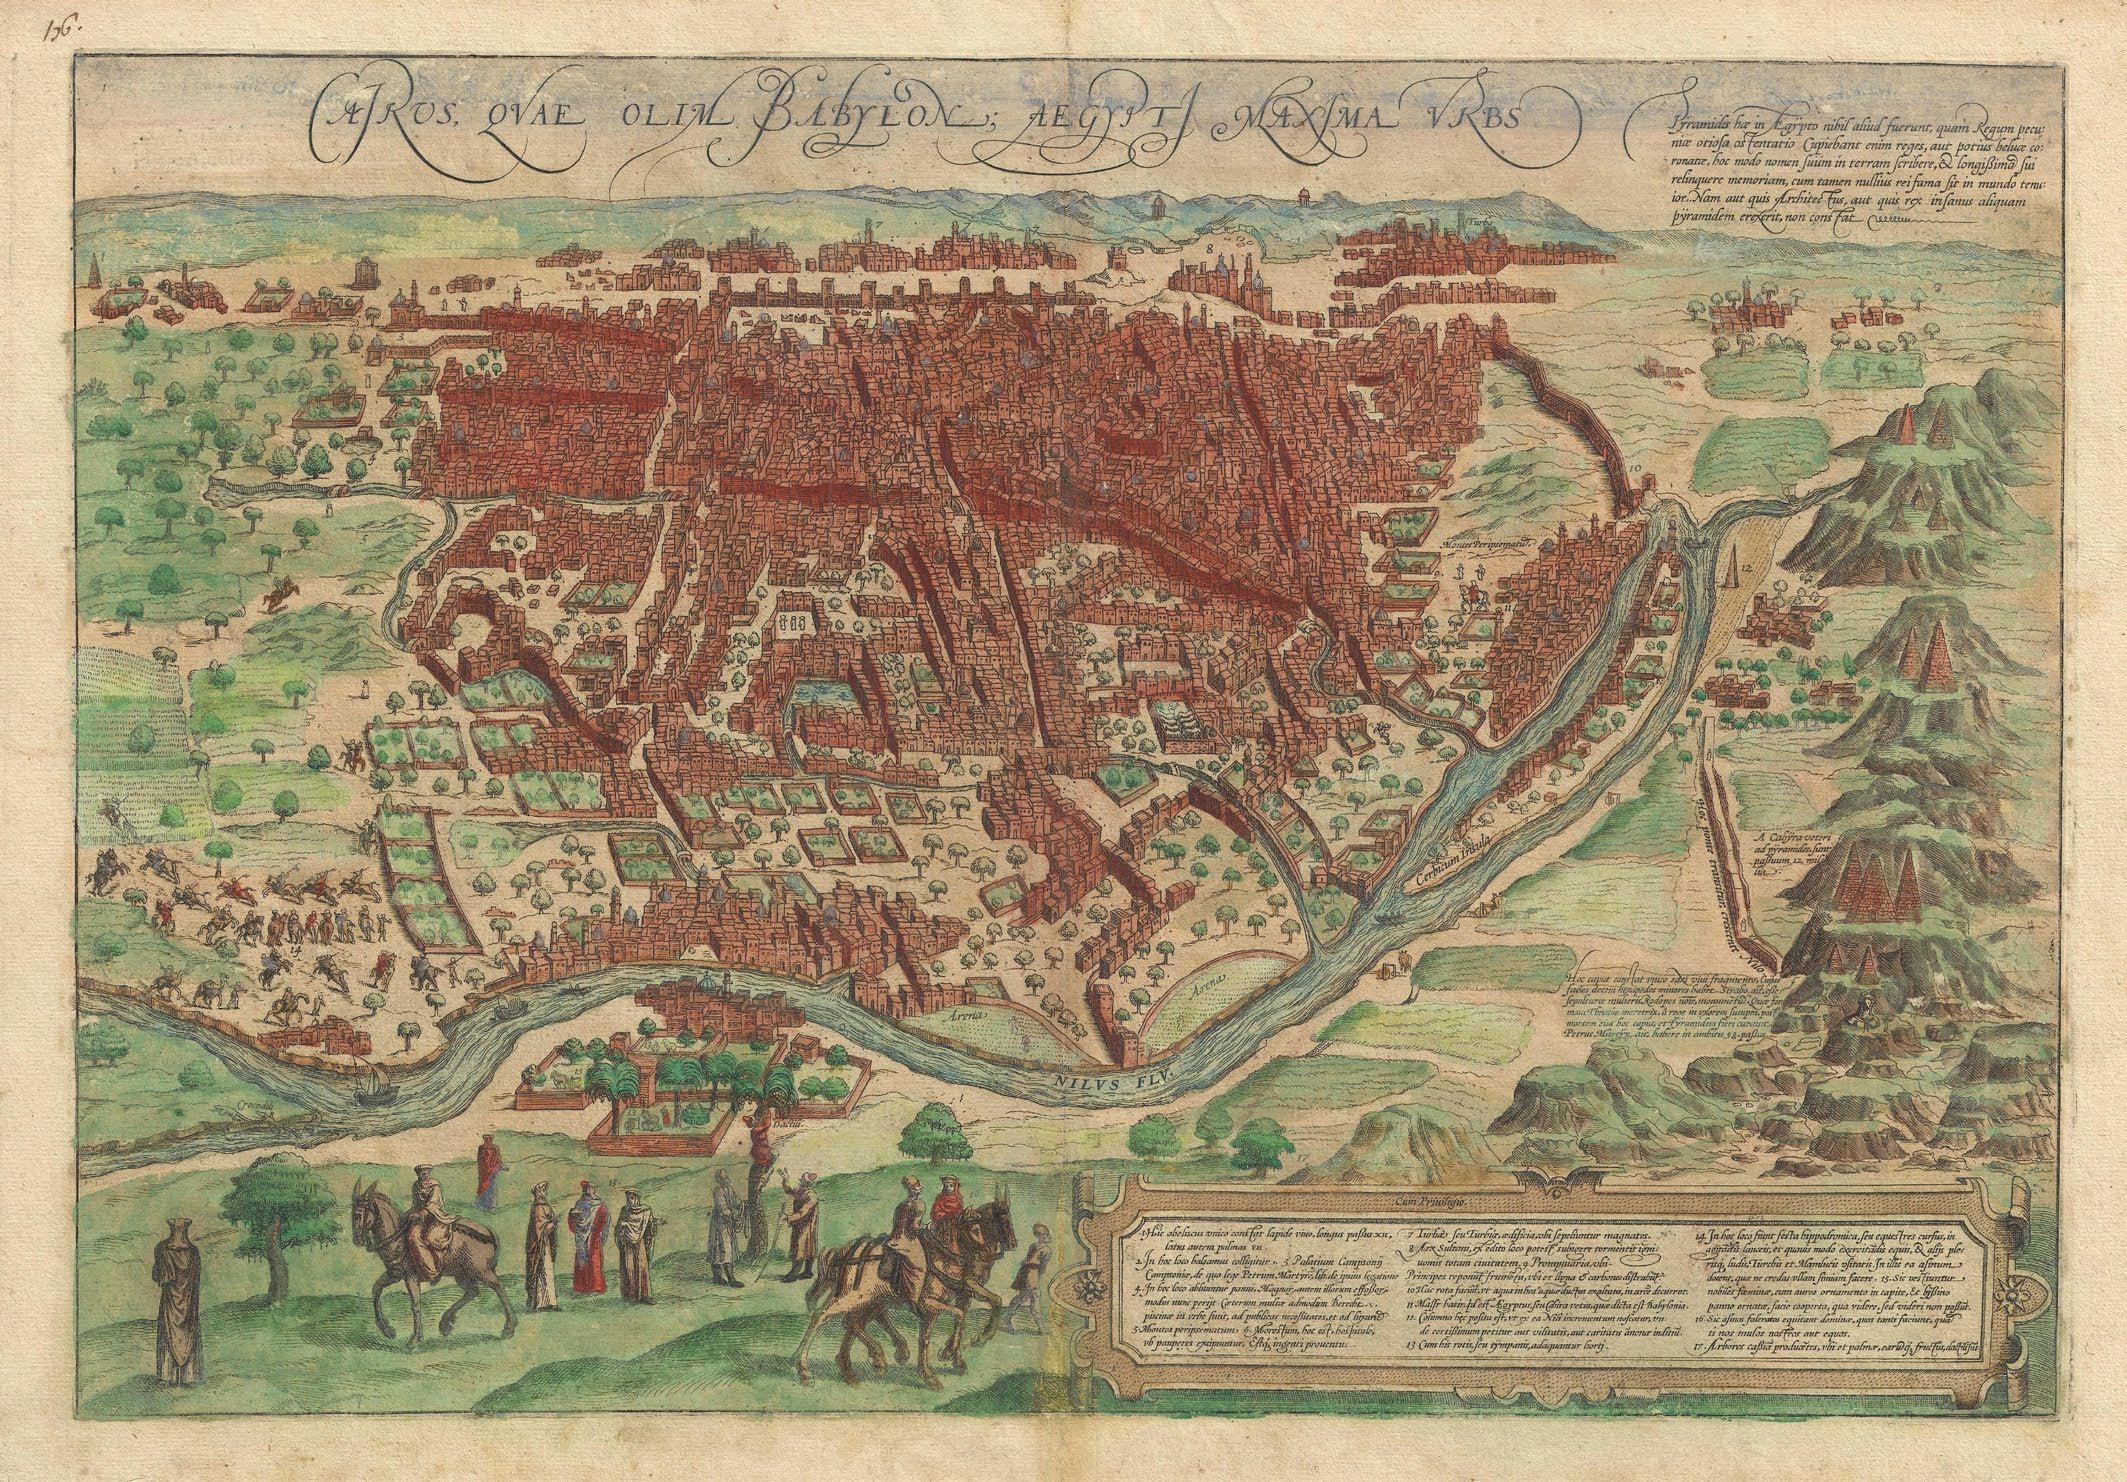
Cairus, quae olim Babylon; Aegypti Maxima Urbs
When Braun and Hogenberg drew this historic 16th century city map and view, Cairo, with roots in antiquity, was already one of the largest cities in the world. Some estimate its population in the late 16th century at well over a million people despite nearly 100 years of repeated outbreaks of the bubonic plague.
The present map illustrates Cairo during the Ottoman period. Cairo is presented looking to the southeast from the right bank of the Nile. The famous Pyramids of Giza and the Great Sphinx are evident on the right, although in a highly stylized form revealing the fact that few Europeans had, at this point in history, actually seen them. The city itself is idealized with a counter-factual uniform rectilinearity of buildings interspaced with imposing fortresses and soaring minarets.
Heavy annotation throughout describes Cairo as an intriguing synthesis of heathen decadence and ancient wonder - a combination that proved alluring to Europeans whose fascination with the orient would only grow in the coming centuries. Quoting from the map itself,
Cairo is said to number 30,000 houses altogether. There are very many princely palaces and temples here, but also many hospices, schools and baths and large buildings containing the tombs of important persons. The streets contain such a throng of people, horses and mules that it is not possible to pass without obstacle. [...] The women, too, wear trousers, made of silk, trimmed with pearls and precious gems, like the men. The men are also allowed to have several wives. (author’s translation)
Some might be curious about the title of the map, which references Babylon. This refers not to the historic Mesopotamian city, but rather to the fort of Babylon, a citadel near what is today Coptic or Old Cairo that traditionally marked the dividing point between Lower and Middle Egypt.
Cartographers
George Braun (1541-March 10, 1622) was a German Catholic deacon, viewmaker, and cartographer based in Cologne. Along with Franz Hogenberg, Braun is best known for his publication of the important city atlas and view book Civitates Orbis Terrarum. In compiling the famous view book, Braun took on the role of editor while most of the engraving work was completed by Franz Hogenberg. Braun died, as he was born, in Cologne.
Franz Hogenberg (1535-1590), often called ‘Master Franz,’ was a Flemish engraver best known for his work with George Braun in compiling the Civitates Orbis Terrarum. Hogenberg was born in Mechelen, where he trained under the cartographer H. Terbruggen. He also engraved for the preeminent Dutch cartographer of his day, Abraham Ortelius.
Gentilmente concessa da Barry Lawrence Ruderman Rare Maps
Courtesy of Paulus Swaen
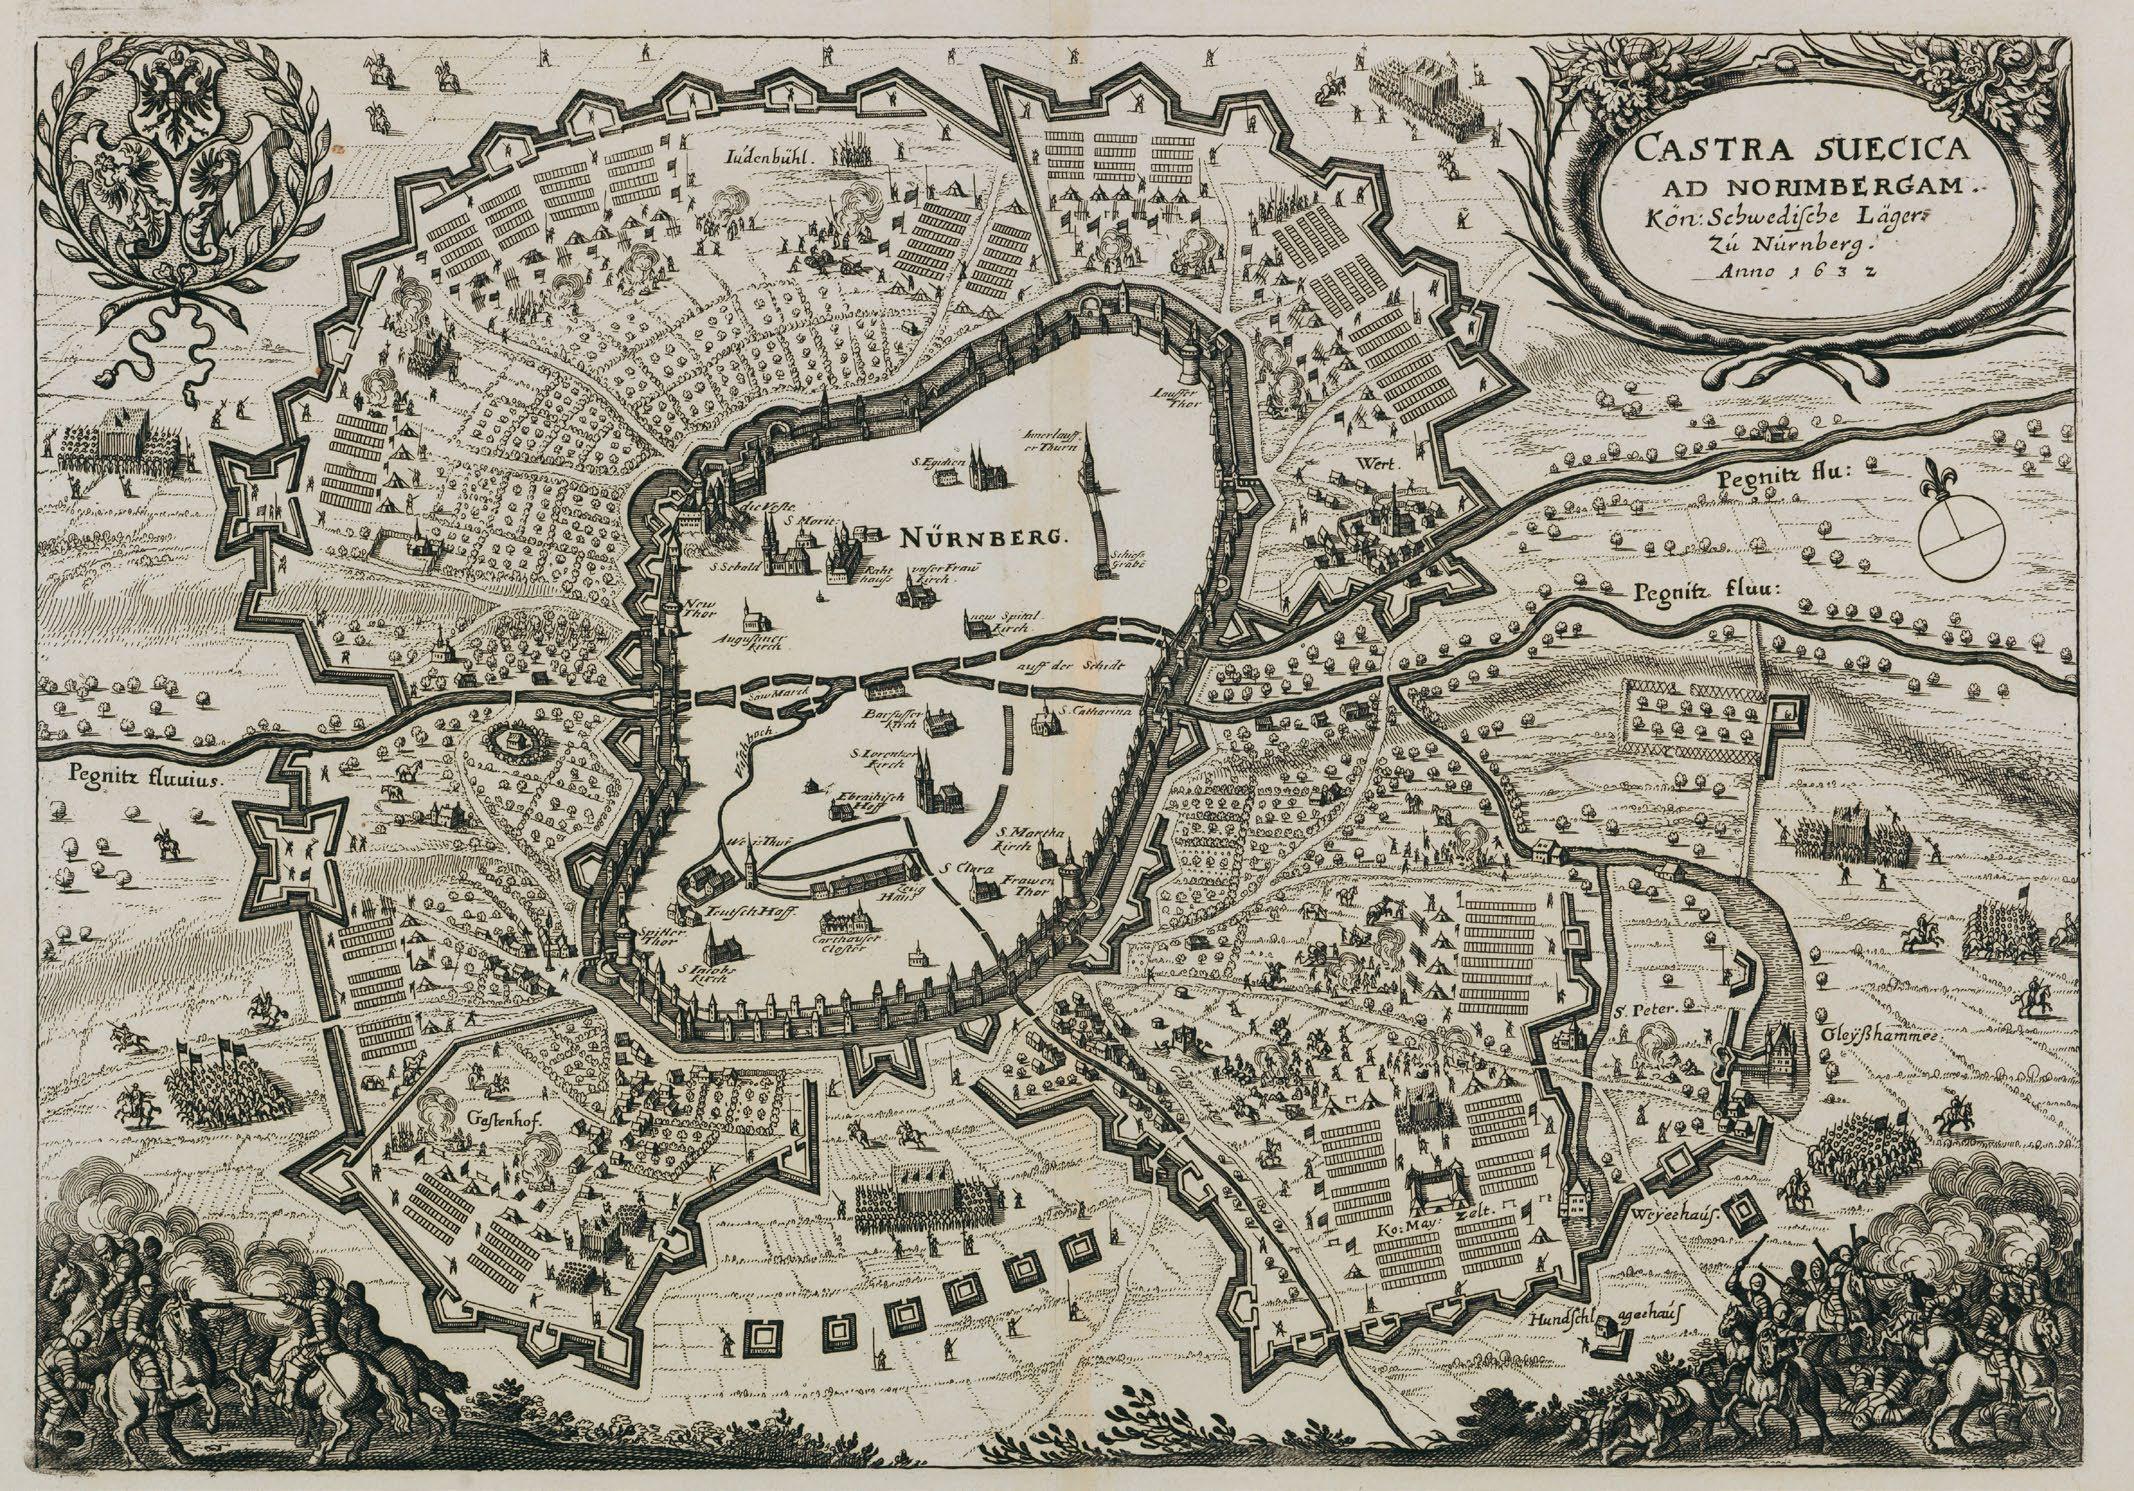
Castra Suecica ad Norimbergam. Kön. Schwedische Läger zu Nürnber
This 1632 map depicts the Bavarian city of Nuremberg during the Thirty Years’ War (1618-1648), at the height of its Renaissance glory and on the cusp of its great decline. Throughout the 16th and into the early 17th century, Nuremberg was the center of the German Renaissance and a hub for regional trade. The city’s fortunes declined with the war and it did not fully recover until the modern era.
This unusual 1632 city plan, published by Matthäus Merian in Frankfurt, attempts to illustrate the 1632 Siege of Nuremburg. The siege began when the Swedish King Gustavus Adolphus, called the ‘Lion of the North,’ staged a strategic retreat into Nuremburg rather than face the numerically superior Holy Roman Imperial forces led by Bohemian Albrecht von Wallenstein. Nuremburg, with strong city walls and a large castle, was then one of the best fortified cities in Europe. Gustavus Adolphus, seeking to make the defensive network even stronger, ordered the construction of a more modern bastion wall around the city.
Merian here illustrates the new Adolphus fortifications and the events of the 1632 siege. The old core of the city, surrounded by a moat and the 16th century wall, is at center strikingly blank, lacking street level detail and instead illustrating only important buildings - doubtless Merian made the map like this to save time as it was issued only weeks after the events depicted. The map takes on more detail between the old city walls and Adolphus’ bastion wall, where we can see active fighting and military encampments on both sides.
The siege lasted roughly 11 weeks, during which about 10,000 Nuremberg residents died along with some 20,000 Swedish and allied forces. Between the siege, the subsequent economic decline, and other events, Nuremburg lost nearly half of its citizenry and did not fully recover until the 18th century, when it once again became a hub of industry and manufacturing - including mapmaking through the work of Johann Baptiste Homann and others.
Cartographer
Matthäus Merian (September 22, 1593-June 19, 1650) was a prolific Swiss mapmaker and engraver of the 17th century. Merian was born in Basel and mastered engraving under masters in Zurich, Strasbourg, Nancy, and Paris. He moved to Frankfurt, then the center of German publishing, to partner with the publisher Johann Theodor de Bry. In addition to jointly issuing numerous maps, Merian married De Bry’s daughter Maria Magdalena, ultimately leading to his inheritance of the de Bry firm and printing plates. His sons, Matthäus the Younger (1621-1687) and Caspar (1627-1686), jointly inherited the family business after their father’s death in 1650.
Gentilmente concessa da Barry Lawrence Ruderman Rare Maps
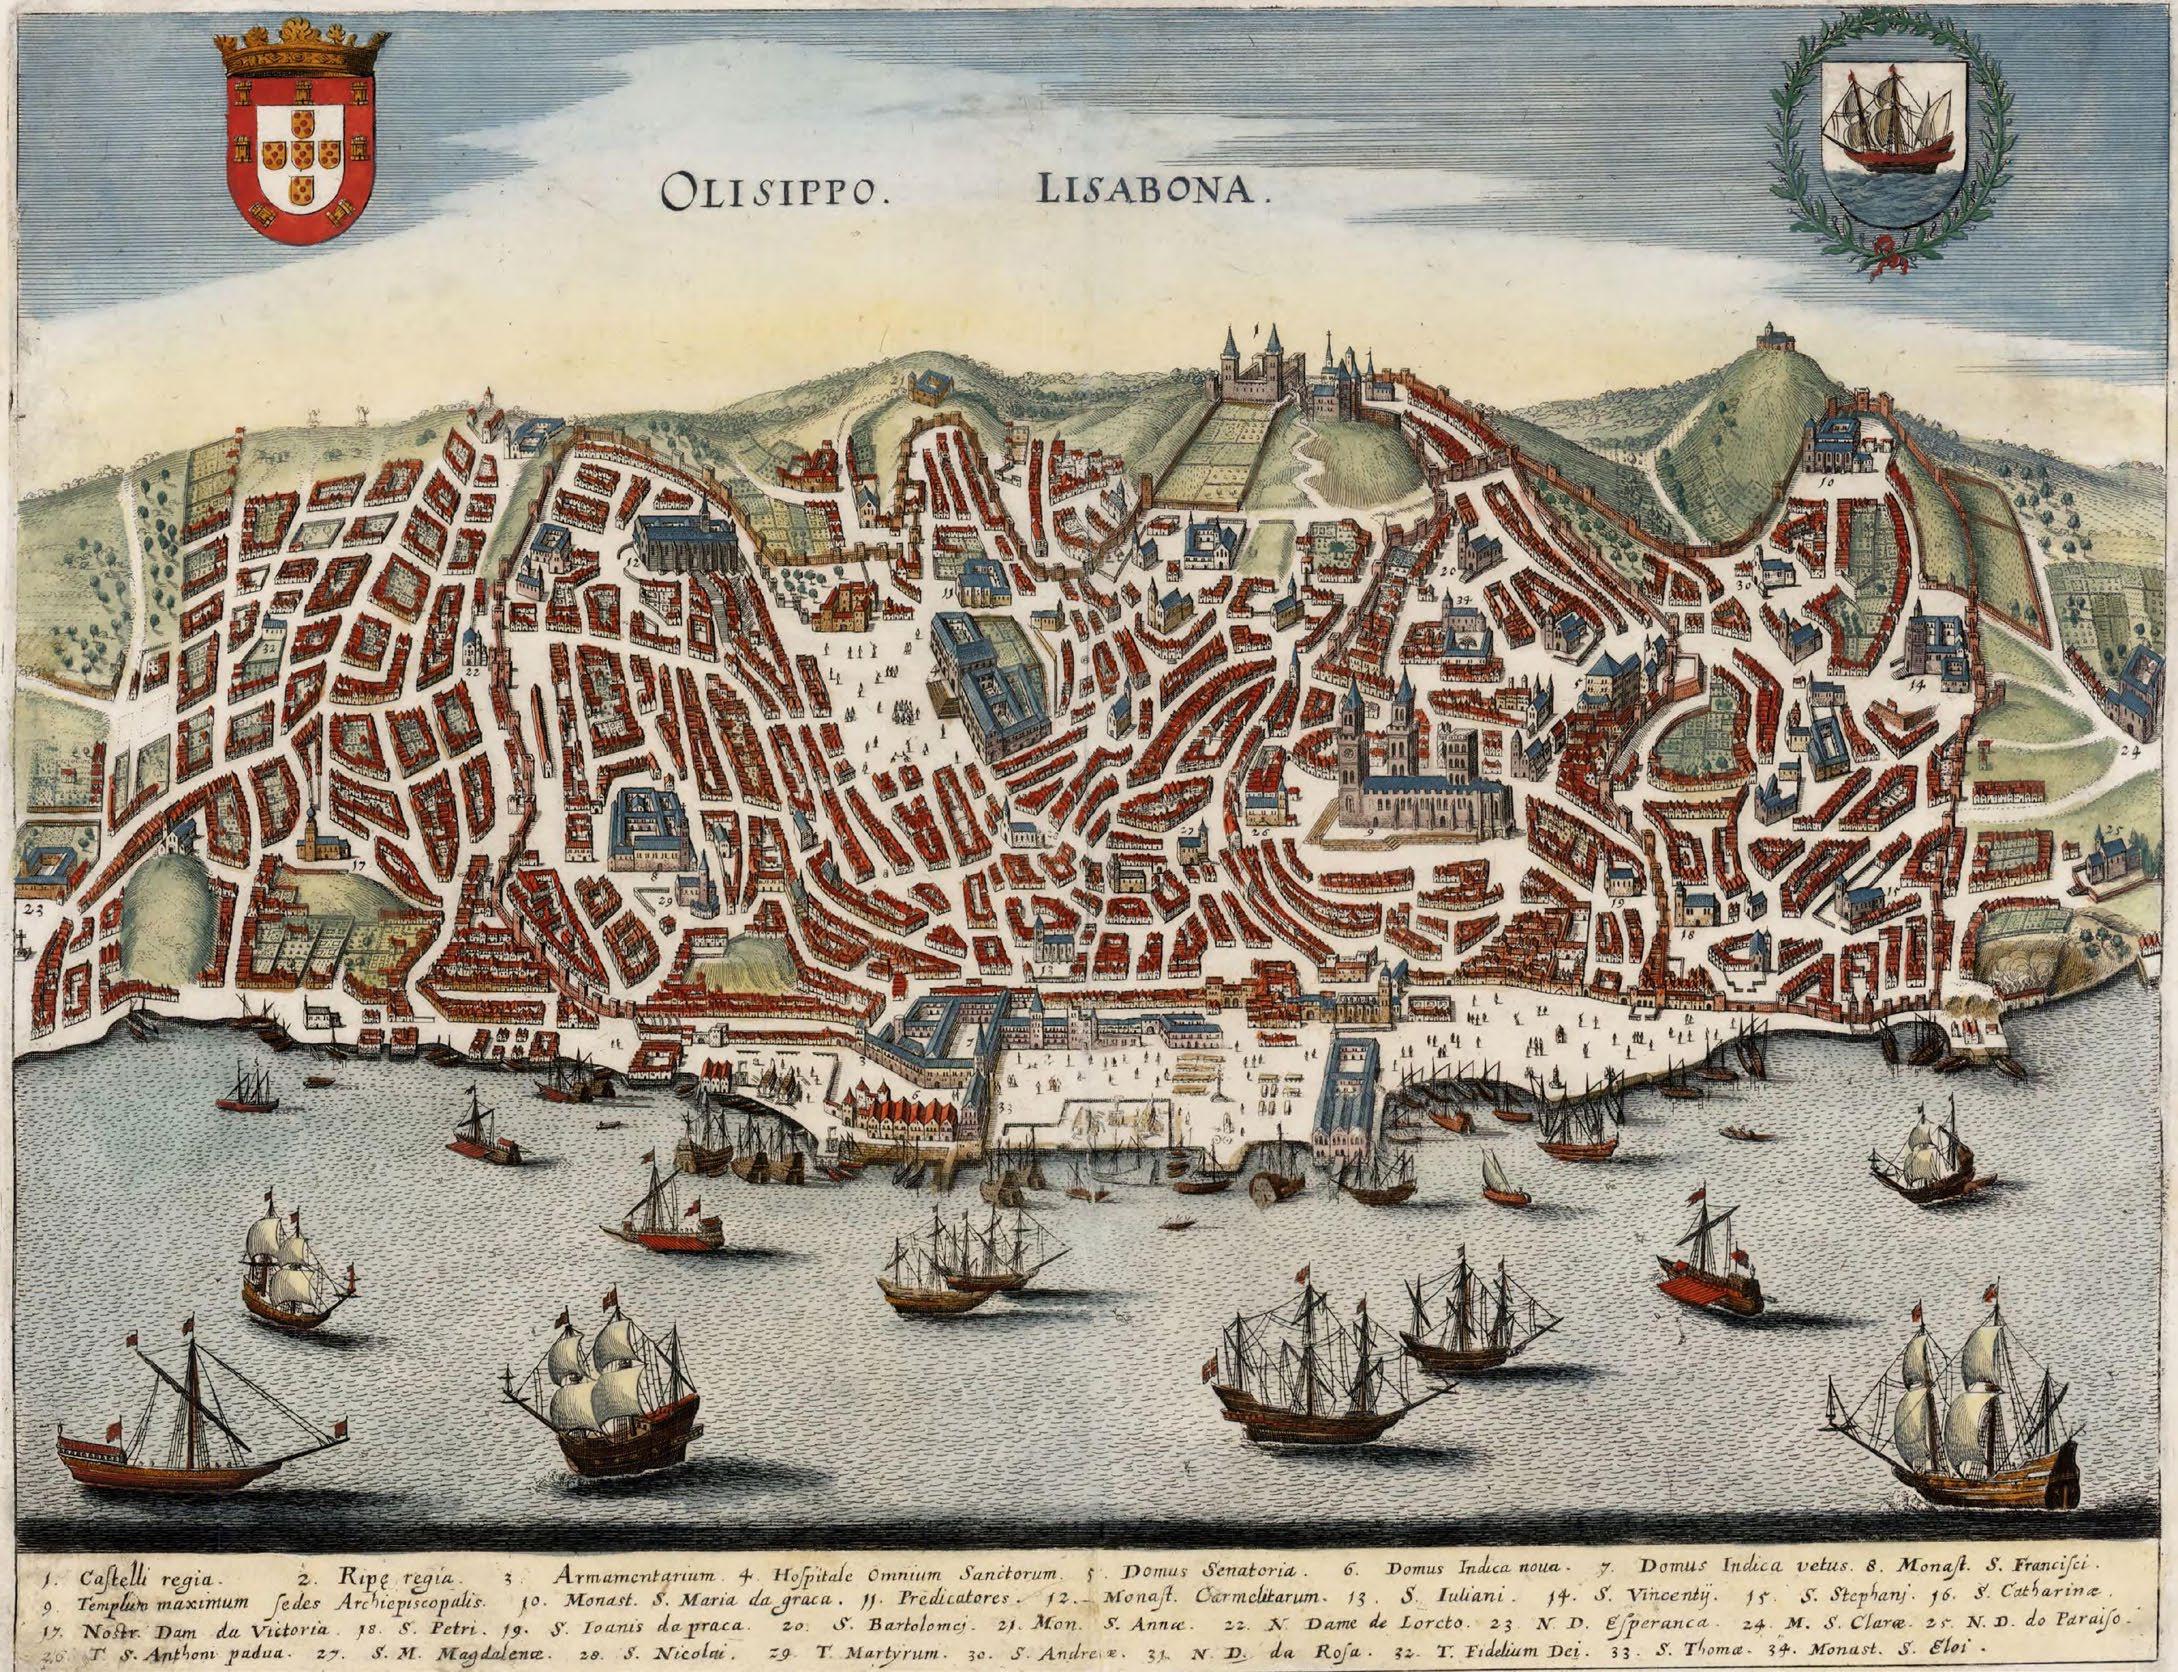
Olisippi. Lisabona
The map looks on Lisbon from the southwest, across the Tagus River, which is filled with ocean-going ships, illustrative of the city’s lively trade. It depicts Lisbon toward the end of Portugal’s golden age when it was called ‘The Mistress of the Seas.’ During the 15th century, Portuguese navigators pioneered lucrative trade routes around Africa to the wealthy markets of Asia, becoming the primary suppliers of exotic silks, spices, and other luxury goods throughout Europe. The Portuguese colonization of Brazil led to even greater wealth, fattened by the vast gold deposits discovered in Minas Gerais and an increasingly profitable sugar trade.
This 1636 map of Lisbon by Matthäus Merian combines the functions of a view with those of a map. The city center itself is rendered planimetrically, and although the individual buildings appear in a faux axonometric style, giving the impression of three-dimensionality, the map is overall more city-plan than cityview. This changes beyond the limits of the urban center, where the surrounding countryside is illustrated in a landscape painting tradition, with grand castles and monasteries perched atop bucolic hills. Lisbon’s golden age led to the construction of grand palaces, renowned universities, enormous churches, and lavish merchant estates - all of which are evident here.
That situation was not to last. Already by the 17th century, when Merian drew this map, Lisbon was on the decline. Dutch, Spanish, and English rivals were pressuring Portuguese maritime trade and alternate routes to the East Indies developed. Lisbon, nonetheless remained significant until the ultimate disaster. On November 1st of 1755, All Saints Day, one of the most powerful earthquakes in recorded history struck, followed by a horrific tsunami, destroying nearly two-thirds of Lisbon and killing 60,000 citizens. The Lisbon depicted in this image was no more, lost forever. Although reconstruction began in earnest, the city never fully recovered is Golden Age glory.
Cartographer
Matthäus Merian (1593-1650) was a Swiss-born engraver and cartographer. Born in Basel, he studied engraving in Zurich, Strasbourg, Nancy and Paris. His wife, Maria Magdalena, was the daughter of the Flemish cartographer Johann Theodor de Bry, and when De Bry died in 1632, he inherited the family business. Merian produced a substantial corpus of work that included not only cartography but engraved prints of all types. When his died his business was inherited by his two sons, Matthäus II and Caspar Merian.
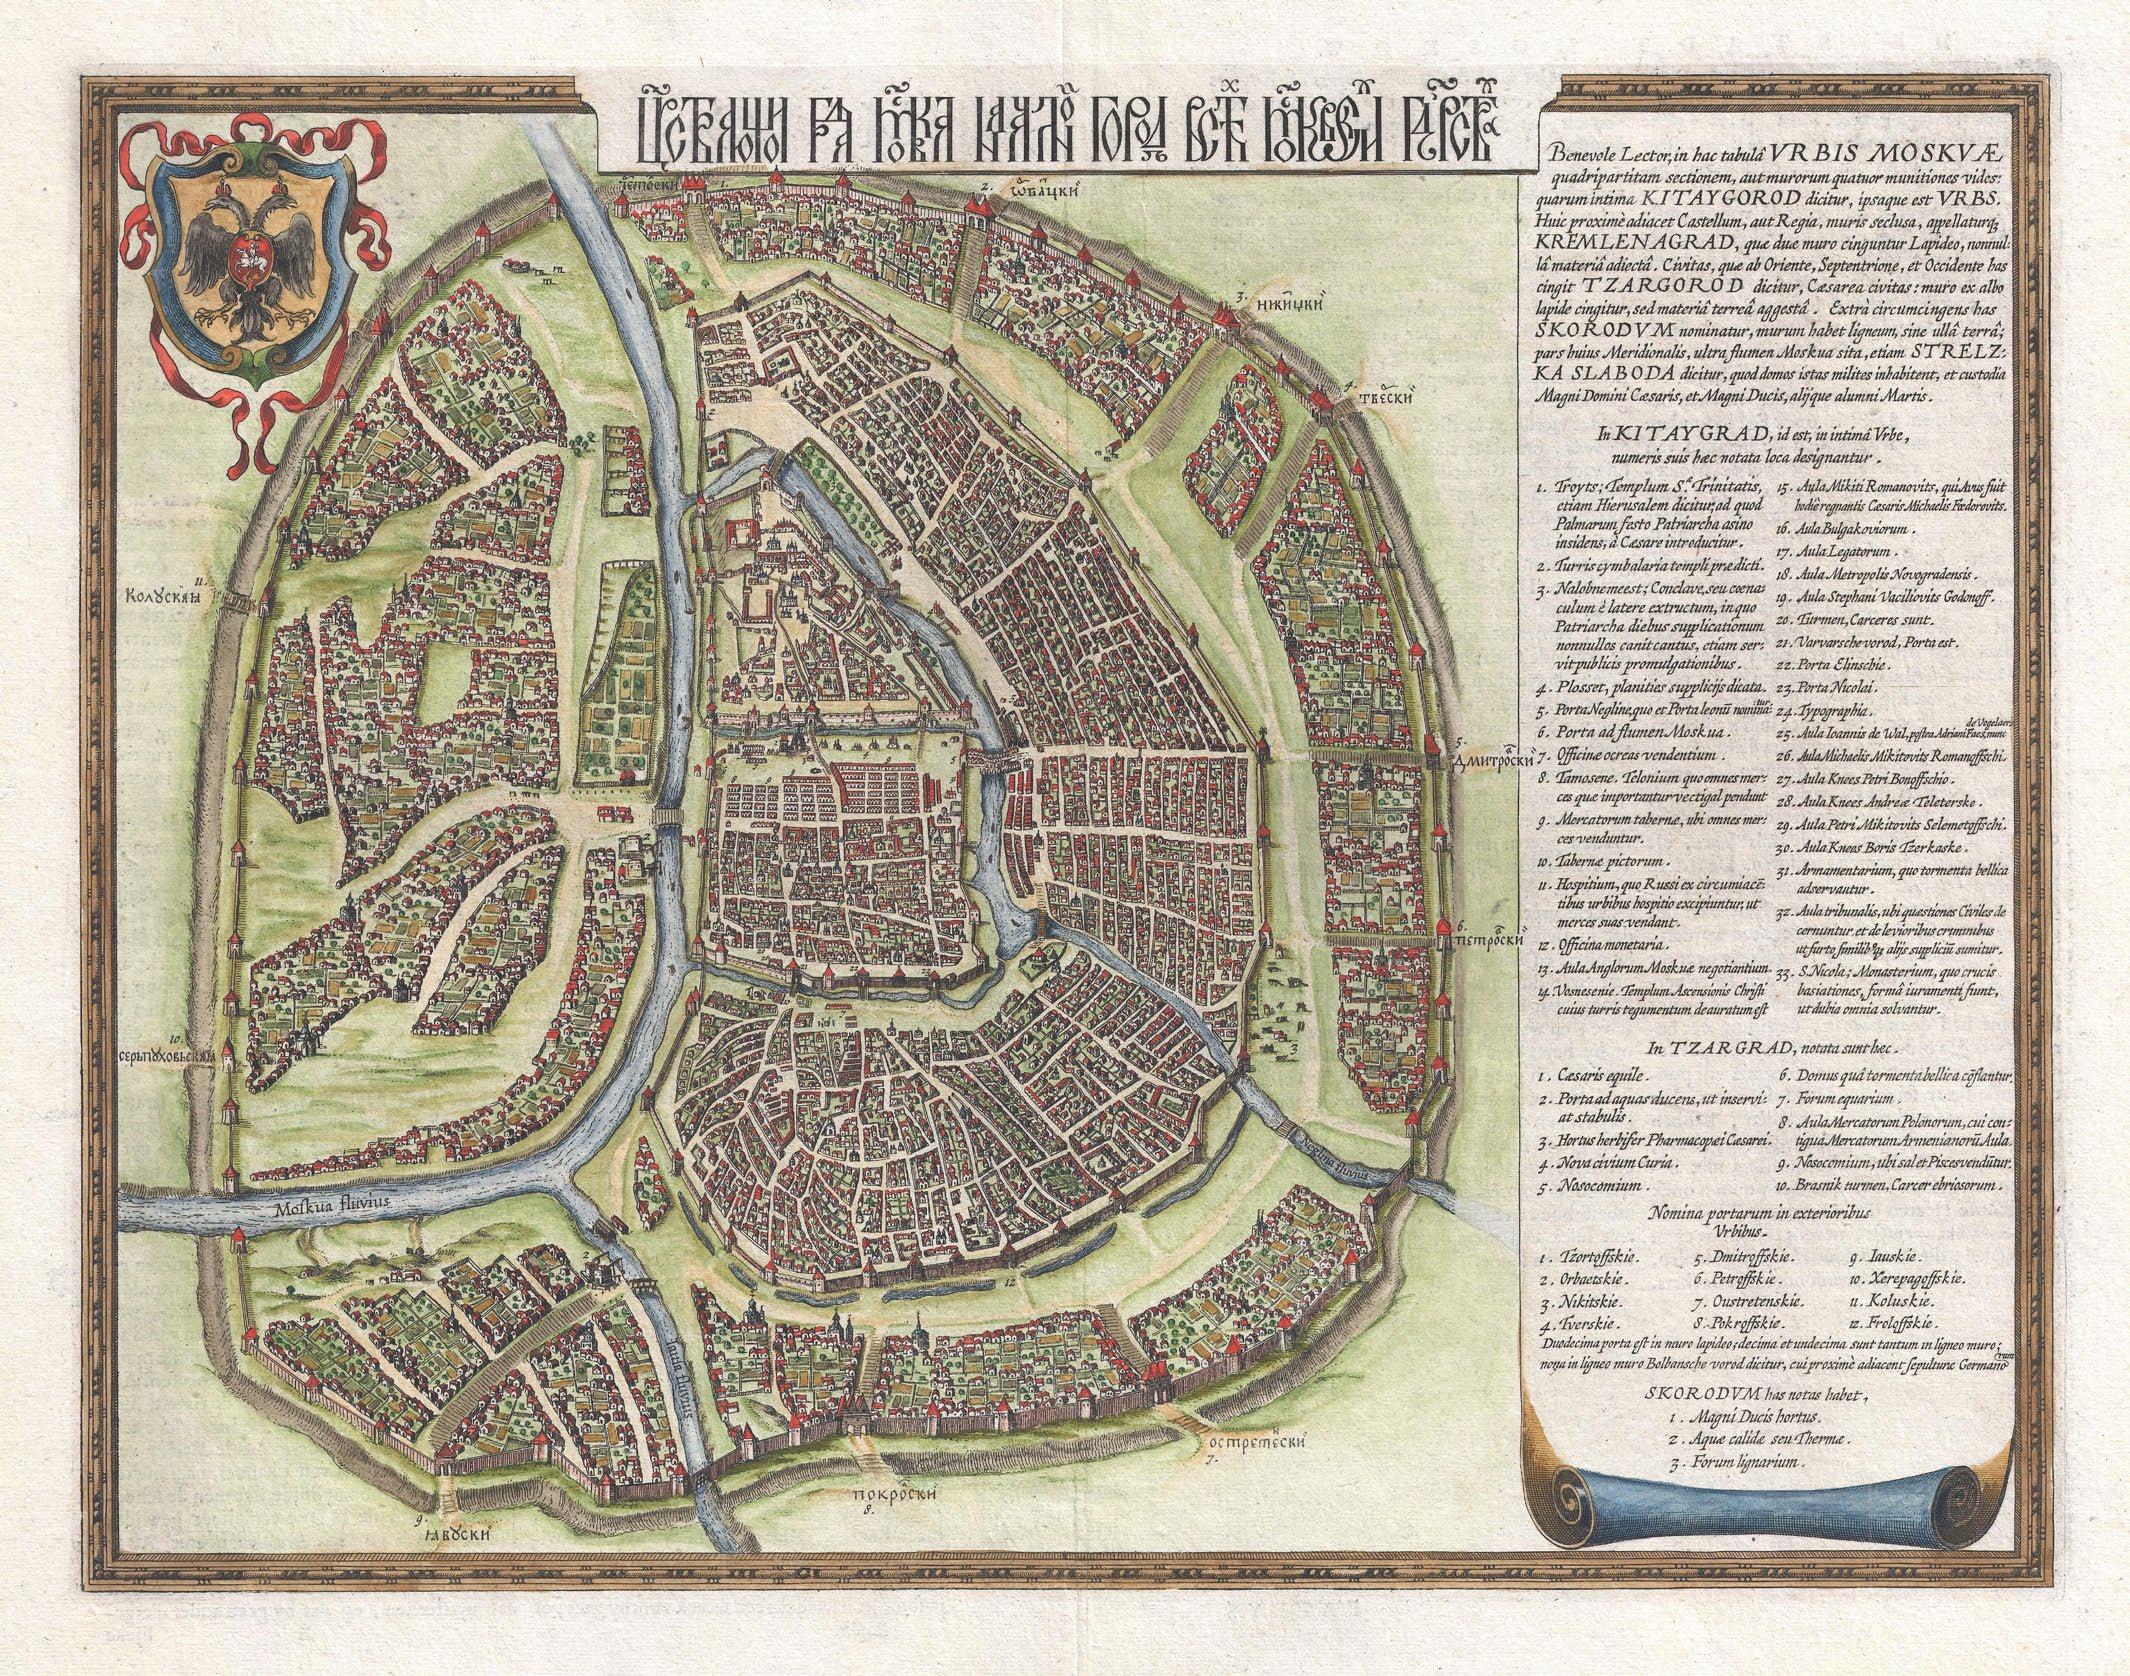
Carstvajušc�oi grad Moskva
nac �alo I gorod všeh Moskovech I carstvach. Urbis Moskvae.
Astunning 1642 map of Moscow at the height of the Tsardom (1547-1721) by Hessel Gerritsz. The map is oriented to the north and centered on the Kremlin - the fortified mini-city occupying the northern part of the central island. Although published in Amsterdam in 1646, the map is based upon a survey ordered by Boris Fyodorovich Godunov (1551-1605). Godunov ruled as de facto regent for Tsar Feodor I from 1585 to 1598 and then as the first non-Rurikid Tsar from 1598 to 1605. It was Godunov who ordered the architect Fyodor Savelyevich Kon to construct the Smolensk Kremlin (1597-1602) and the Bely Gorod (1585-1593) wall. Consisting of 50 forts and 11 gates, the Bely Gorod, here illustrated as the city’s primary line of defense, was one of the most impressive fortification ever constructed. The original survey that this map is based upon, now lost, was most likely completed by Kon in preparation for the construction of the Bely Gorod. The construction of the Bely Gorod was a response to the sacking of Moscow in 1571 by the Crimean Tartars. With the exception the Kremlin itself, the entire city was burnt to the ground. Records suggest that, when the Tartars arrived, Moscow had a population of approximately 200,000, when they departed, only 30,000 remained. Godunov understood that the construction of a more comprehensive defensive system was critical to the long-term survival of the city and the Tsardom. The massive construction project began in 1585 and proceeded with all haste. Fortunately, the walls were mostly completed by 1591 when the Crimean Tartars returned. This time, their siege was stymied by Kon’s masterpiece.
The map exhibits a combination of cartographic styles that place it somewhere between an architectural city plan and a pictorial map like the 1742 Turgot plan of Paris. It commonly appears with a partner plan detailing the Kremlin in the same style, but both seem to have been issued separately. The Kremlin plan begins appearing in editions of Braun and Hogenburg’s 16th century Civitates orbis terrarium, but there is no record of this companion map until the publication of Blaeu’s Tooneel des Aerdrycks in 1642.
Cartographer
Hessel Gerritsz (1581-September 4, 1632) was a Dutch cartographer and engraver. Gerritsz apprenticed under the Dutch Golden Age cartographer Willem Jansz Blaeu (1571-1638). In 1617, he became the first official cartographer of the Vereenigde Oost-Indische Compagnie (Dutch East Indian Company) or VOC. With unprecedented access to cartographic information from the VOC’s trading missions, Gerritsz was able to publish some of the most sophisticated and advanced maps of the 17th century.
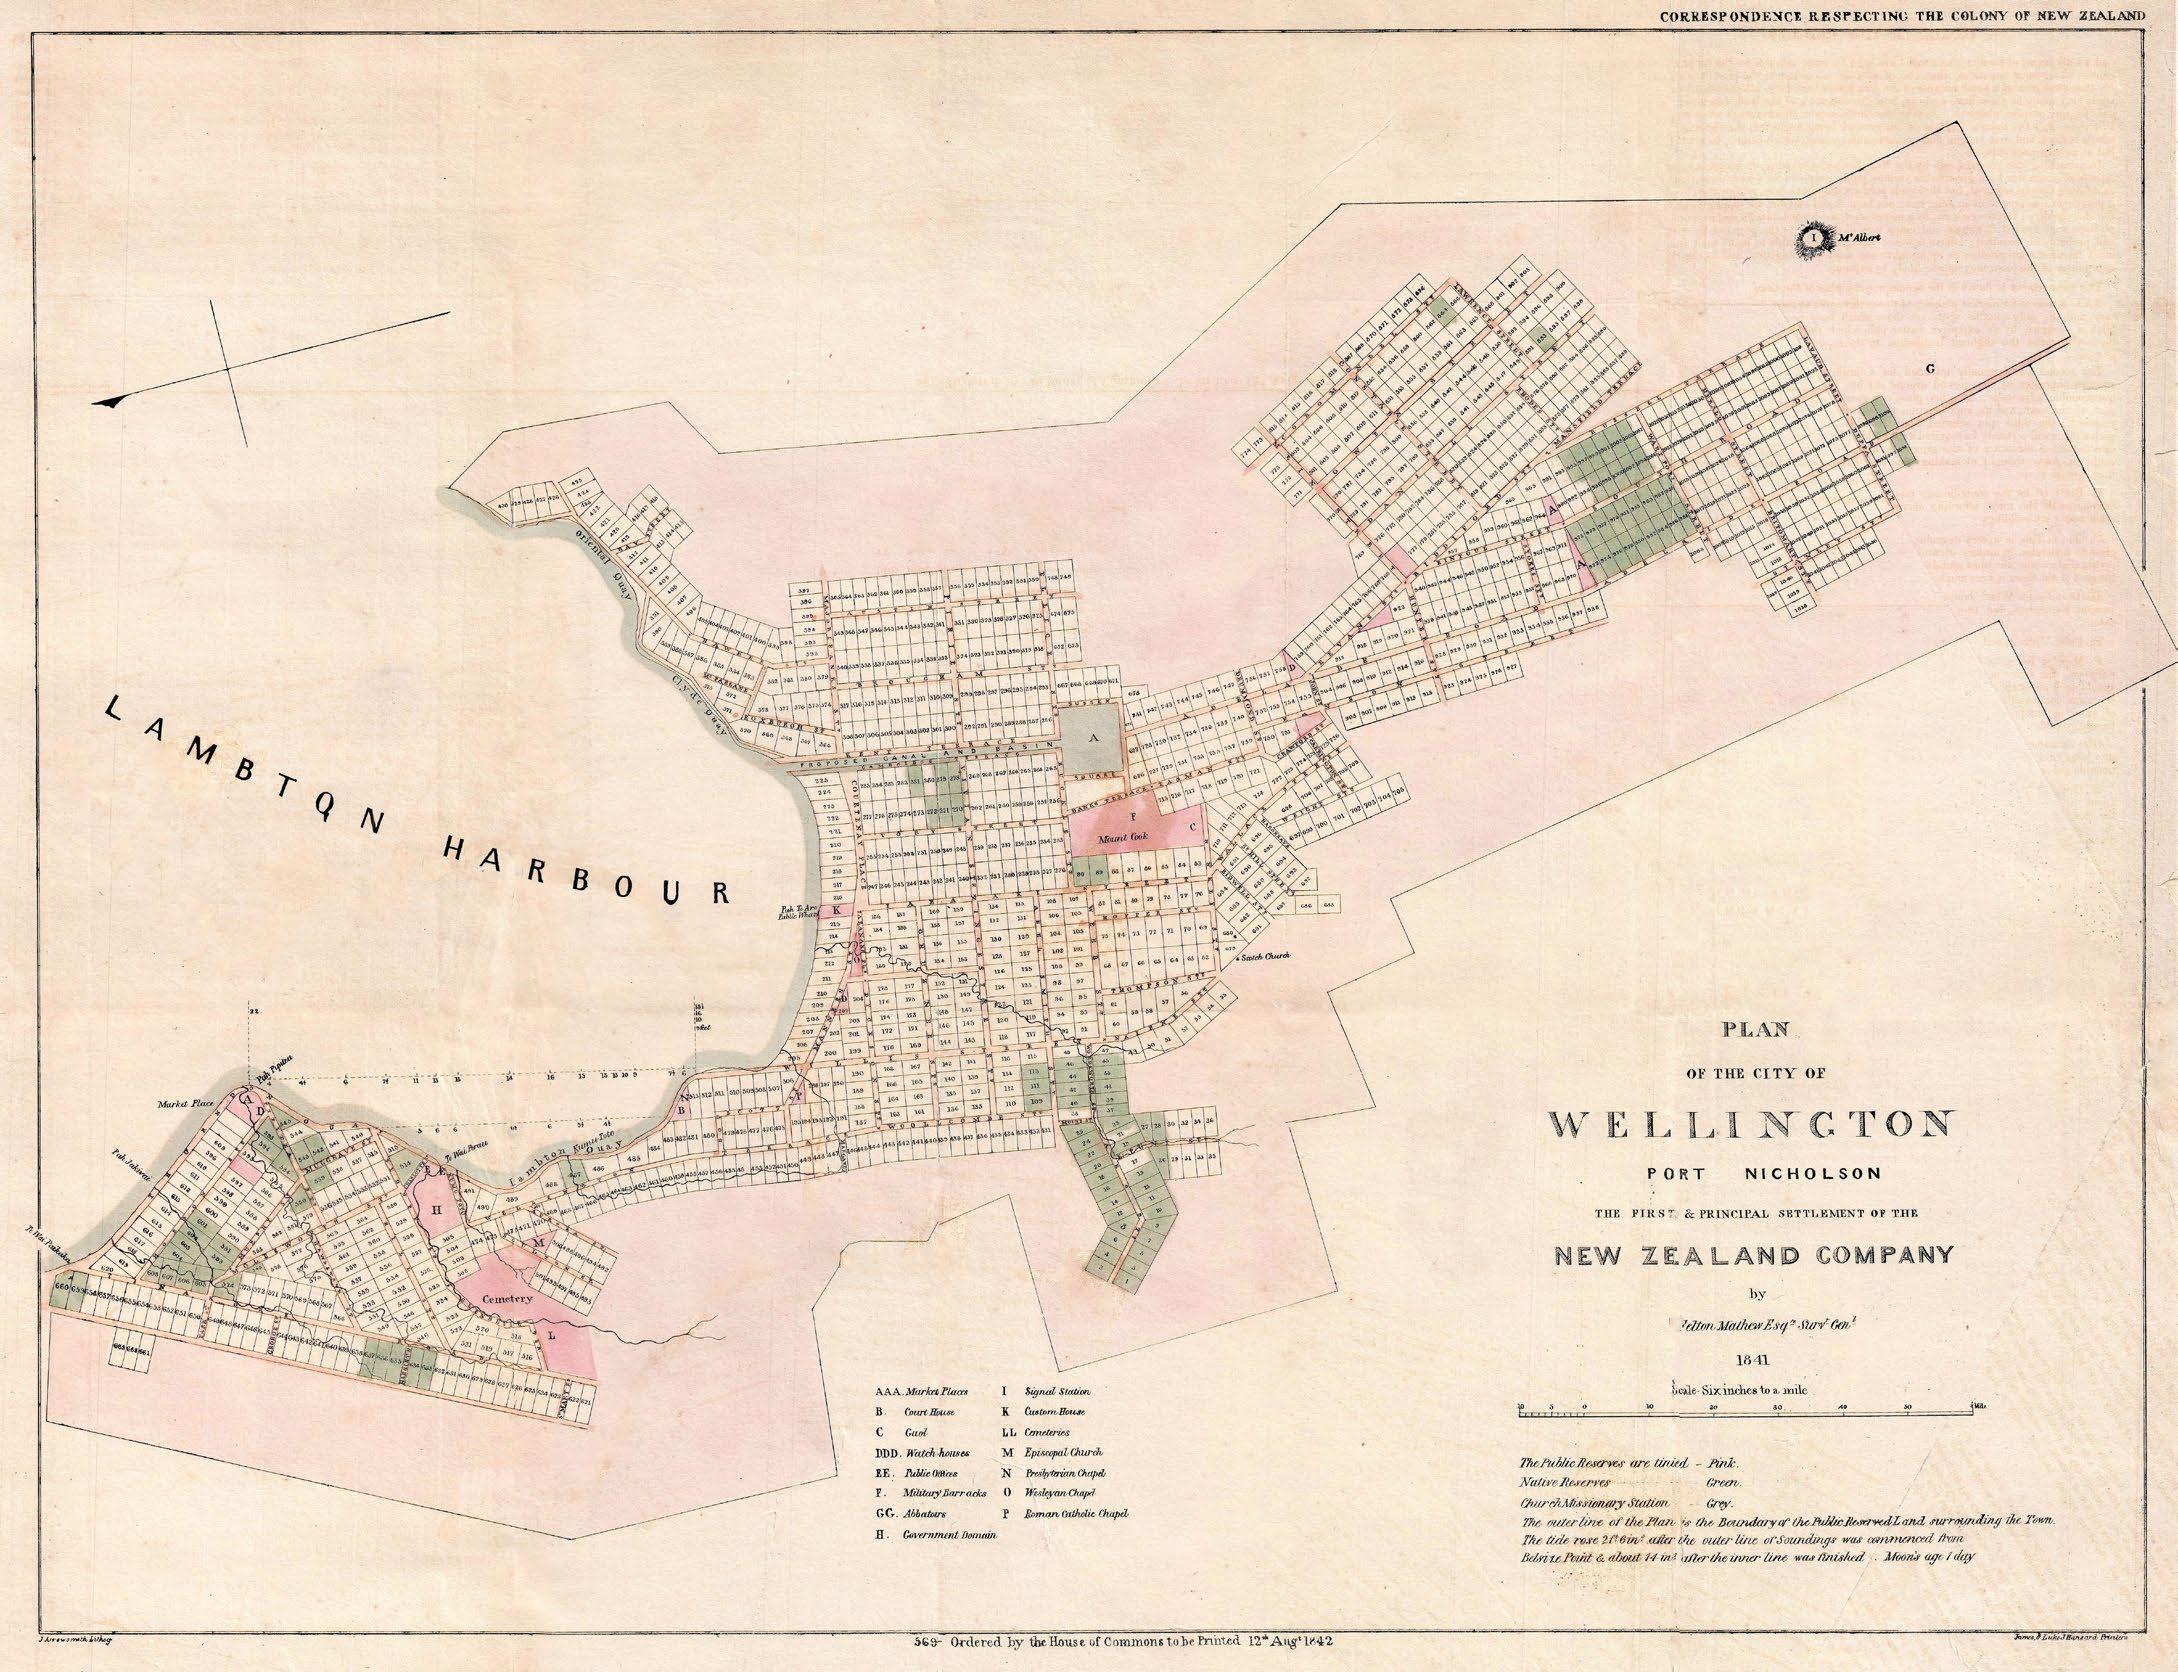
Plan of the City of Wellington Port Nicholson the First & Principal Settlement of the New Zealand Company
In the 18th and 19th centuries most colonization efforts were undertaken not by governments, but rather by privately funded land speculation companies. The city of Wellington, now the capital of New Zealand, was founded in 1840 to be the “first and principal settlement” of the New Zealand Land Company.
The NZLC was formed in 1825, but colonization did not begin in earnest until the company merged with William Wakefield’s New Zealand Association in 1837. Under Wakefield, the New Zealand Land Company began to systematically survey and colonize New Zealand. This process began with the lawful acquisition of lands from the indigenous Maori peoples. Under the regulations of the British Colonial Office, lands for settlement in New Zealand needed to be purchased cleanly from the Maori, complete with proper ‘British’ contracts. It was the responsibility of the Land Company to guarantee that the chiefs they were negotiating with had the authority to speak on behalf their communities and fully understood that by agreeing to the purchase, they were giving up all rights to the land. The intent behind this regulation was not fairness, but avoidance of future conflict.
Eager to begin settlement, the Land Company ignored many of these provisions. Instead, they purchased lands from an ambitious young chief hoping to leverage negotiations with the British to increase his own standing within the Maori community. In the case of the Wellington land purchases, that chief, Te Wharepouri, lacked true authority. The more significant elder chiefs were excluded and unaware of the transaction. This led to countless altercations as British surveyors and settlers began setting up shop in the middle of established Maori communities!
The Colonial Office called for an investigation under the attorney William Spain. Spain ultimately recognized the Wellington purchases, but ruled that the NZLC be required to provide the Maori grants by lottery amounting to 1/10th the land surveyed. Those grants, shaded green here, were in commutable and in alienable, to prevent their sale to land speculators. The hope was, in the words of Wakefeild’s son, Jerningham, that proximity to the British colonists would cure the Maori of their ‘rude and uncivilized habits.’
The present map of Wellington, one of the earliest, was prepared for the Spain Commission. It is based upon the work of New Zealand’s first Surveyor-General Felton Mathew. The plan is oriented to the east and covers the modern-day historic core of Wellington, including Thorndon, Pepitia, Te Aro, Newtown, and Berhampore.
Cartographer
The cartographer is unknown.
Gentilmente concessa da Barry Lawrence Ruderman Rare Maps
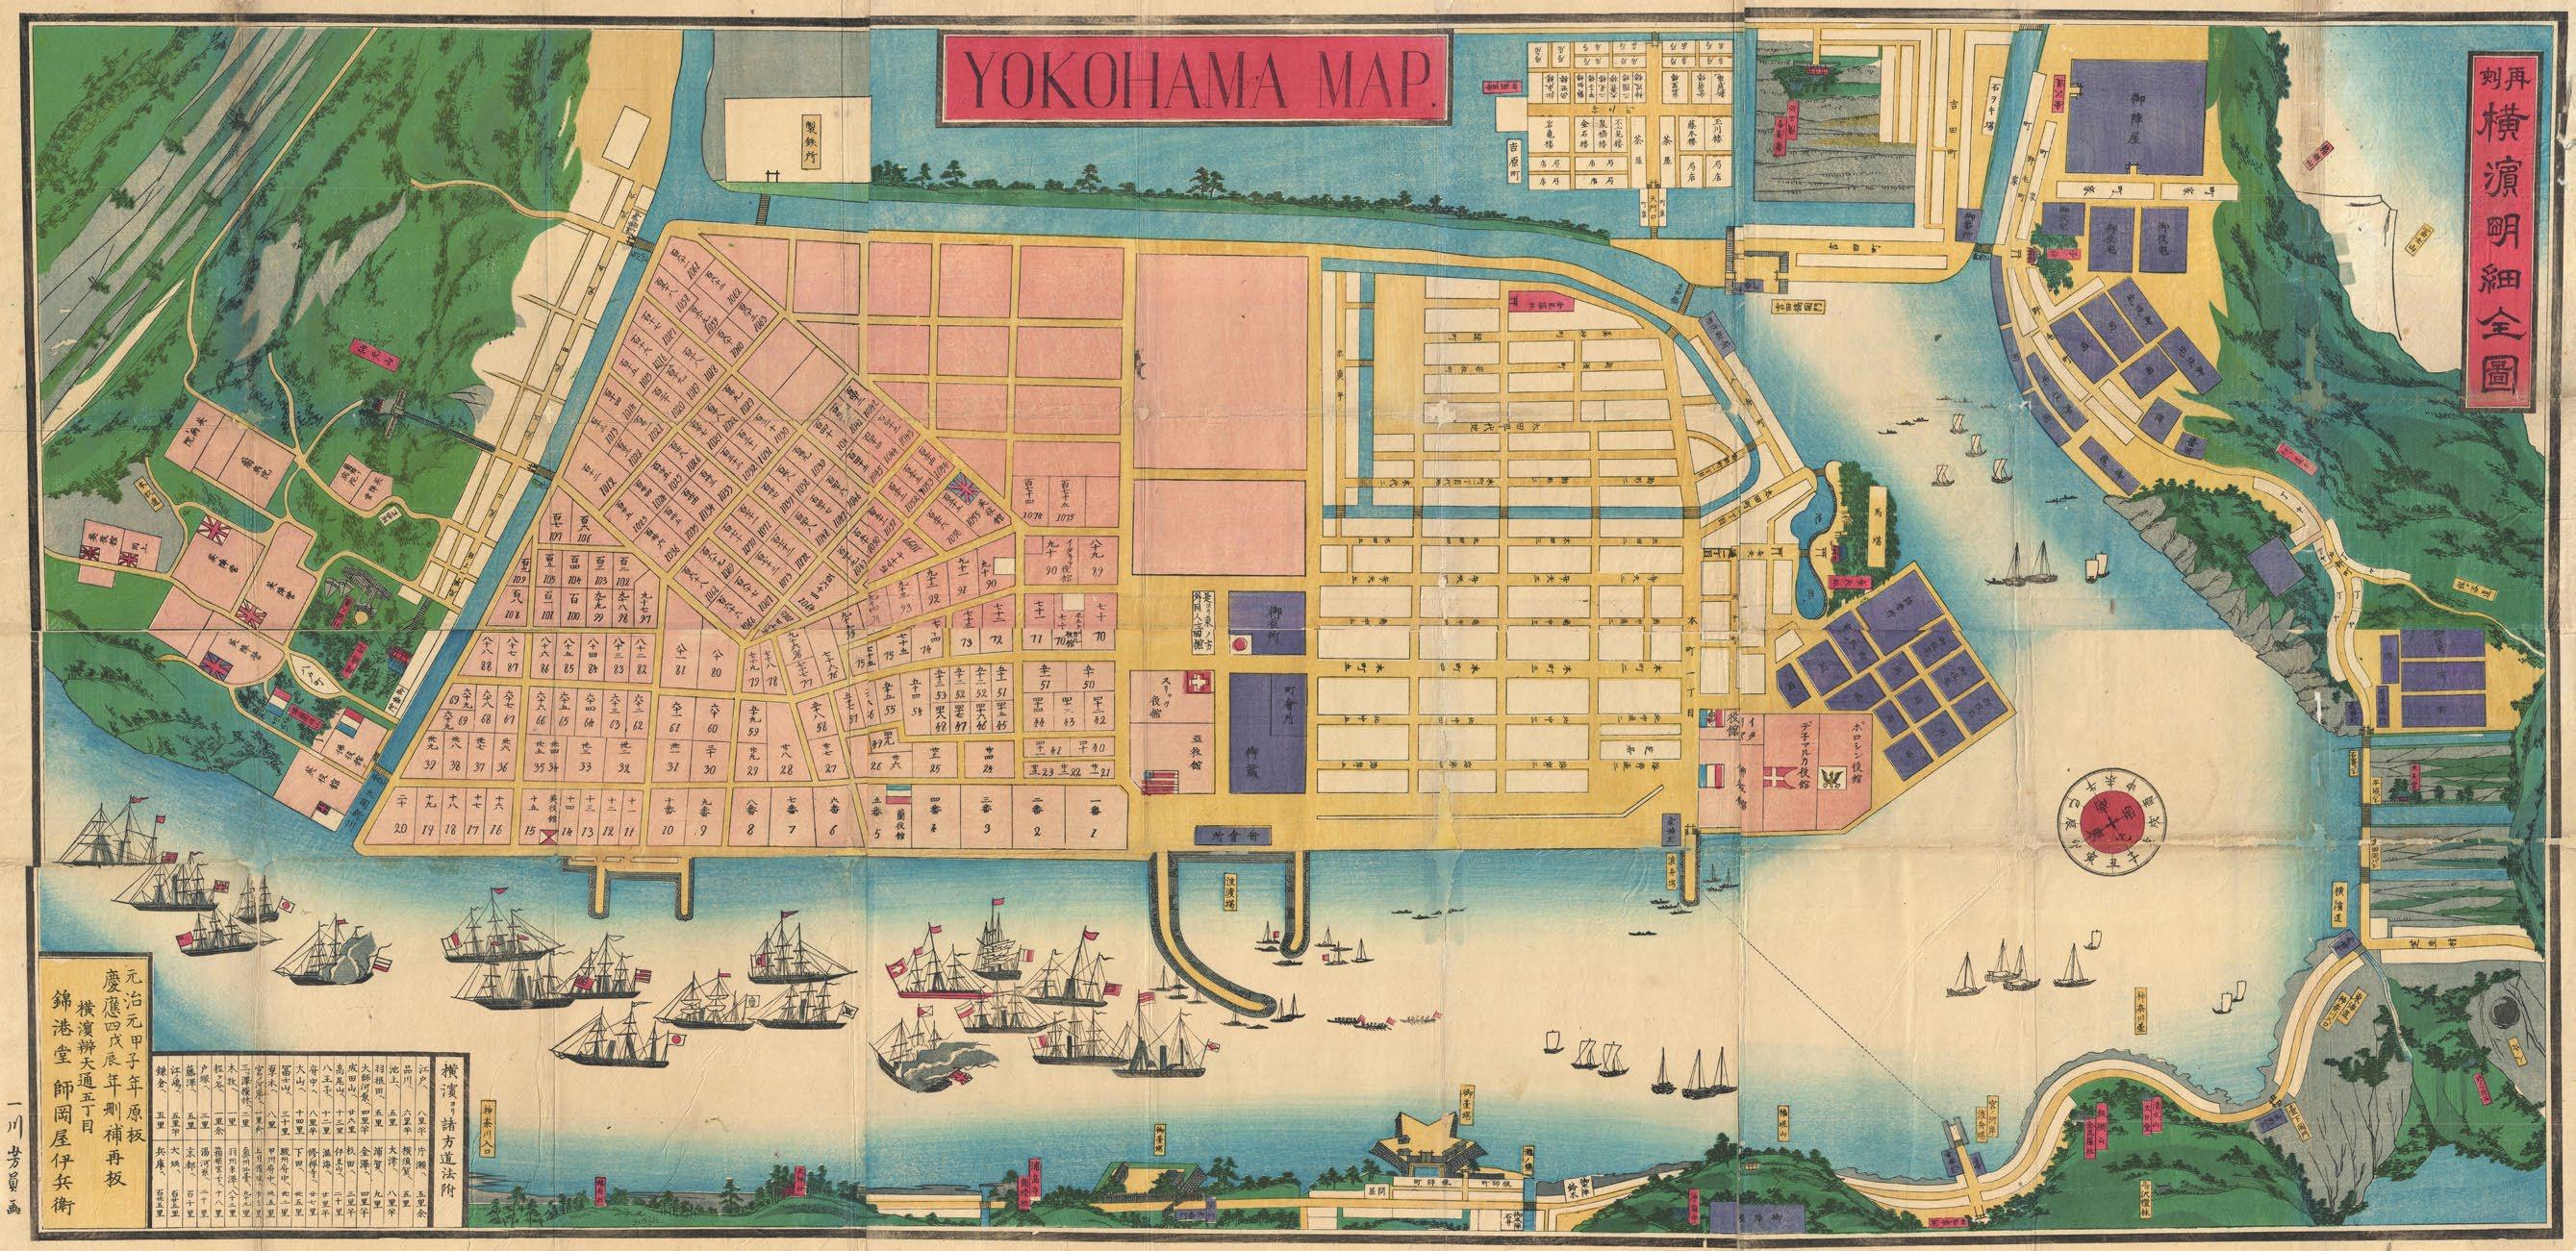
Yokohama Map. / 橫濱明細全圖
Morookaya Ihei (
Cartographer
) (fl. c. 1850-1880) was a Japanese painter and printmaker specializing in Yokohama-e ukiyo-e Japanese woodblock prints and maps. He worked out of 5 Chome Bentendori, Yokohama.
Commodore Matthew Perry arrived in Japan in 1853 and through boldness and hard-nosed gunboat diplomacy forced the ultra-conservative Tokugawa Shogunate to open Japan to foreign trade after nearly 200 years of state administered isolation. The subsequent Japan-US Treaty of Peace and Amity opened several treaty ports to foreign trade, chief among them the newly constructed port of Yokohama in Kanagawa Prefecture, which officially opened to foreign trade in June of 1859. By the time this 1868 or Keio - 4 map was issued by the Japanese printmaker Morookaya Ihei, Yokohama was well on its way to becoming a major city. The map is oriented to the southwest, with north at the bottom right - reflecting the direction by which ships of trade would approach the city. The developed central zone of Yokohama is presented on a strict cadastral grid in the style of European city plans. The surrounding countryside, however, is illustrated in a more traditional Japanese Uki-e style and is center weighted around the cadastral core. While most of the textual content is Japanese, city streets are identified in English by number. The map thus features a unique synthesis of scientific, cultural, and artistic modes of expression, bringing together European trigonometrical cartography, Japanese Ukiyo-e style woodblock printing, and Uki-e perspective work. American, Dutch, English, French, Italian, Prussian, Swiss, and Japanese businesses are identified, underscoring just how incredibly cosmopolitan Yokohama had become by the mid-1860s. Today, Yokohama is one of the worlds’ largest cities and the largest city in Japan by population. It continues to be a major port.
Gentilmente concessa da Barry Lawrence Ruderman Rare Maps
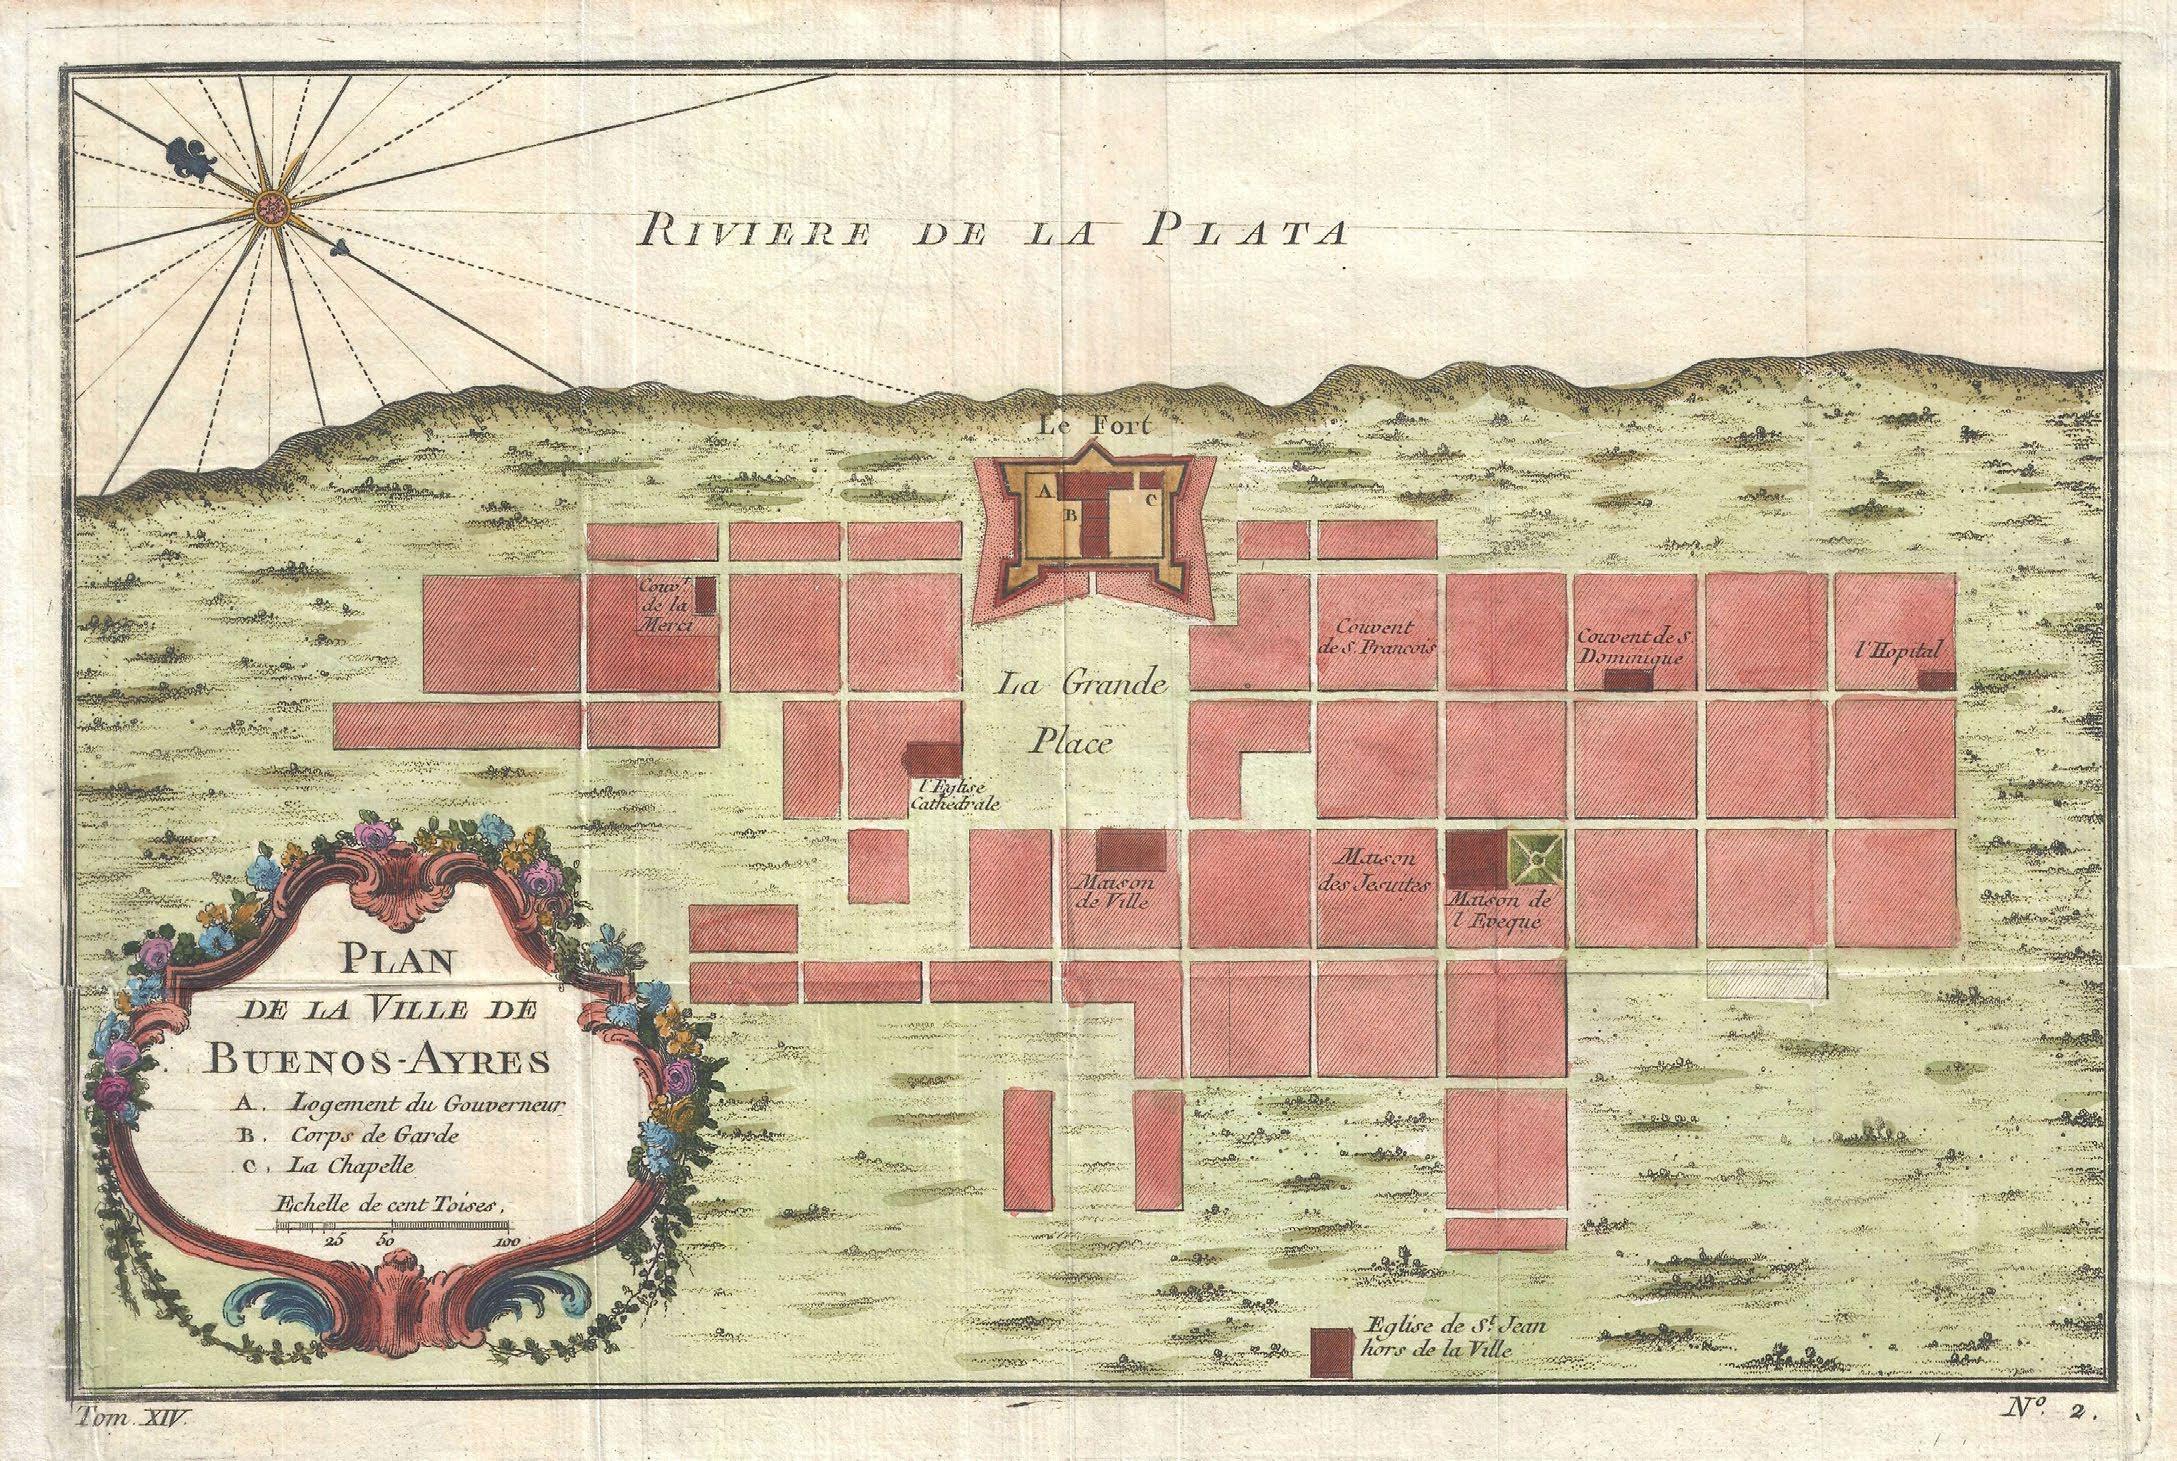
Plan de la Ville de Buenos-Ayres
Although Buenos Aires, today the capital of Argentina, was founded in 1536 by the Spanish explorer Pedro de Mendoza, development of the city was slow. Attacks by indigenous tribes in the region forced its abandonment in 1542 until it was resettled in 1580 by Juan de Garay. Like many frontier cities, from its earliest days Buenos Aires had an antagonistic relationship with the colonial authorities in distant Spain.
With its shipping plagued by piracy, Spain introduced a convoy system to guarantee the safety of its ships to and from the South American colonies. From Sevilla, Spain, ships would cross the Atlantic, eventually making their way to the customs house in Lima, Peru. It was only from Lima that goods could be further distributed to other South American colonial cities. Geographically, Buenos Aires is just about as far from Lima as possible while remaining in South America. As a result, goods both took a long time to arrive, and when they did, they were predictably prohibitively expensive. Buenos Aires thus became haven of smugglers more than happy to circumvent Spain’s draconian regulations and trade with the nearby Portuguese in Brazil, and, often, the pirates themselves.
When the French cartographer Jacques Nicholas Bellin drew this map in 1756, Buenos Aires was still a relatively small city at the very limits of Spanish colonial influence. The map is oriented to the northwest, with the city facing the Rio de La Plata. The defensive fort and the Grand Plaza just to the west take front and center. The Cathedral, which was built just two years earlier in 1752, is also evident.
As the city grew, the Spanish kings, now of the Bourbon dynasty, initiated the Bourbon Reforms, among them a 1778 edict declaring Buenos Aires a free port. A prolonged period of prosperity and growth followed which lasted until the wars of independence in the early 19th century.
Cartographer
Jacques-Nicolas Bellin (1703-March 21, 1772) was a French cartographer in the employ of the Dépôt des cartes et plans de la Marine. Bellin is considered one of the most important and prolific cartographers of the 18th century. His work defined the conventions of his era with a focus on accuracy and practicality over decorative embellishment. Despite his success, Bellin’s correspondence, in which he describes his work as ‘long, unpleasant, and hard’ suggests he may not have enjoyed his life as a cartographer.
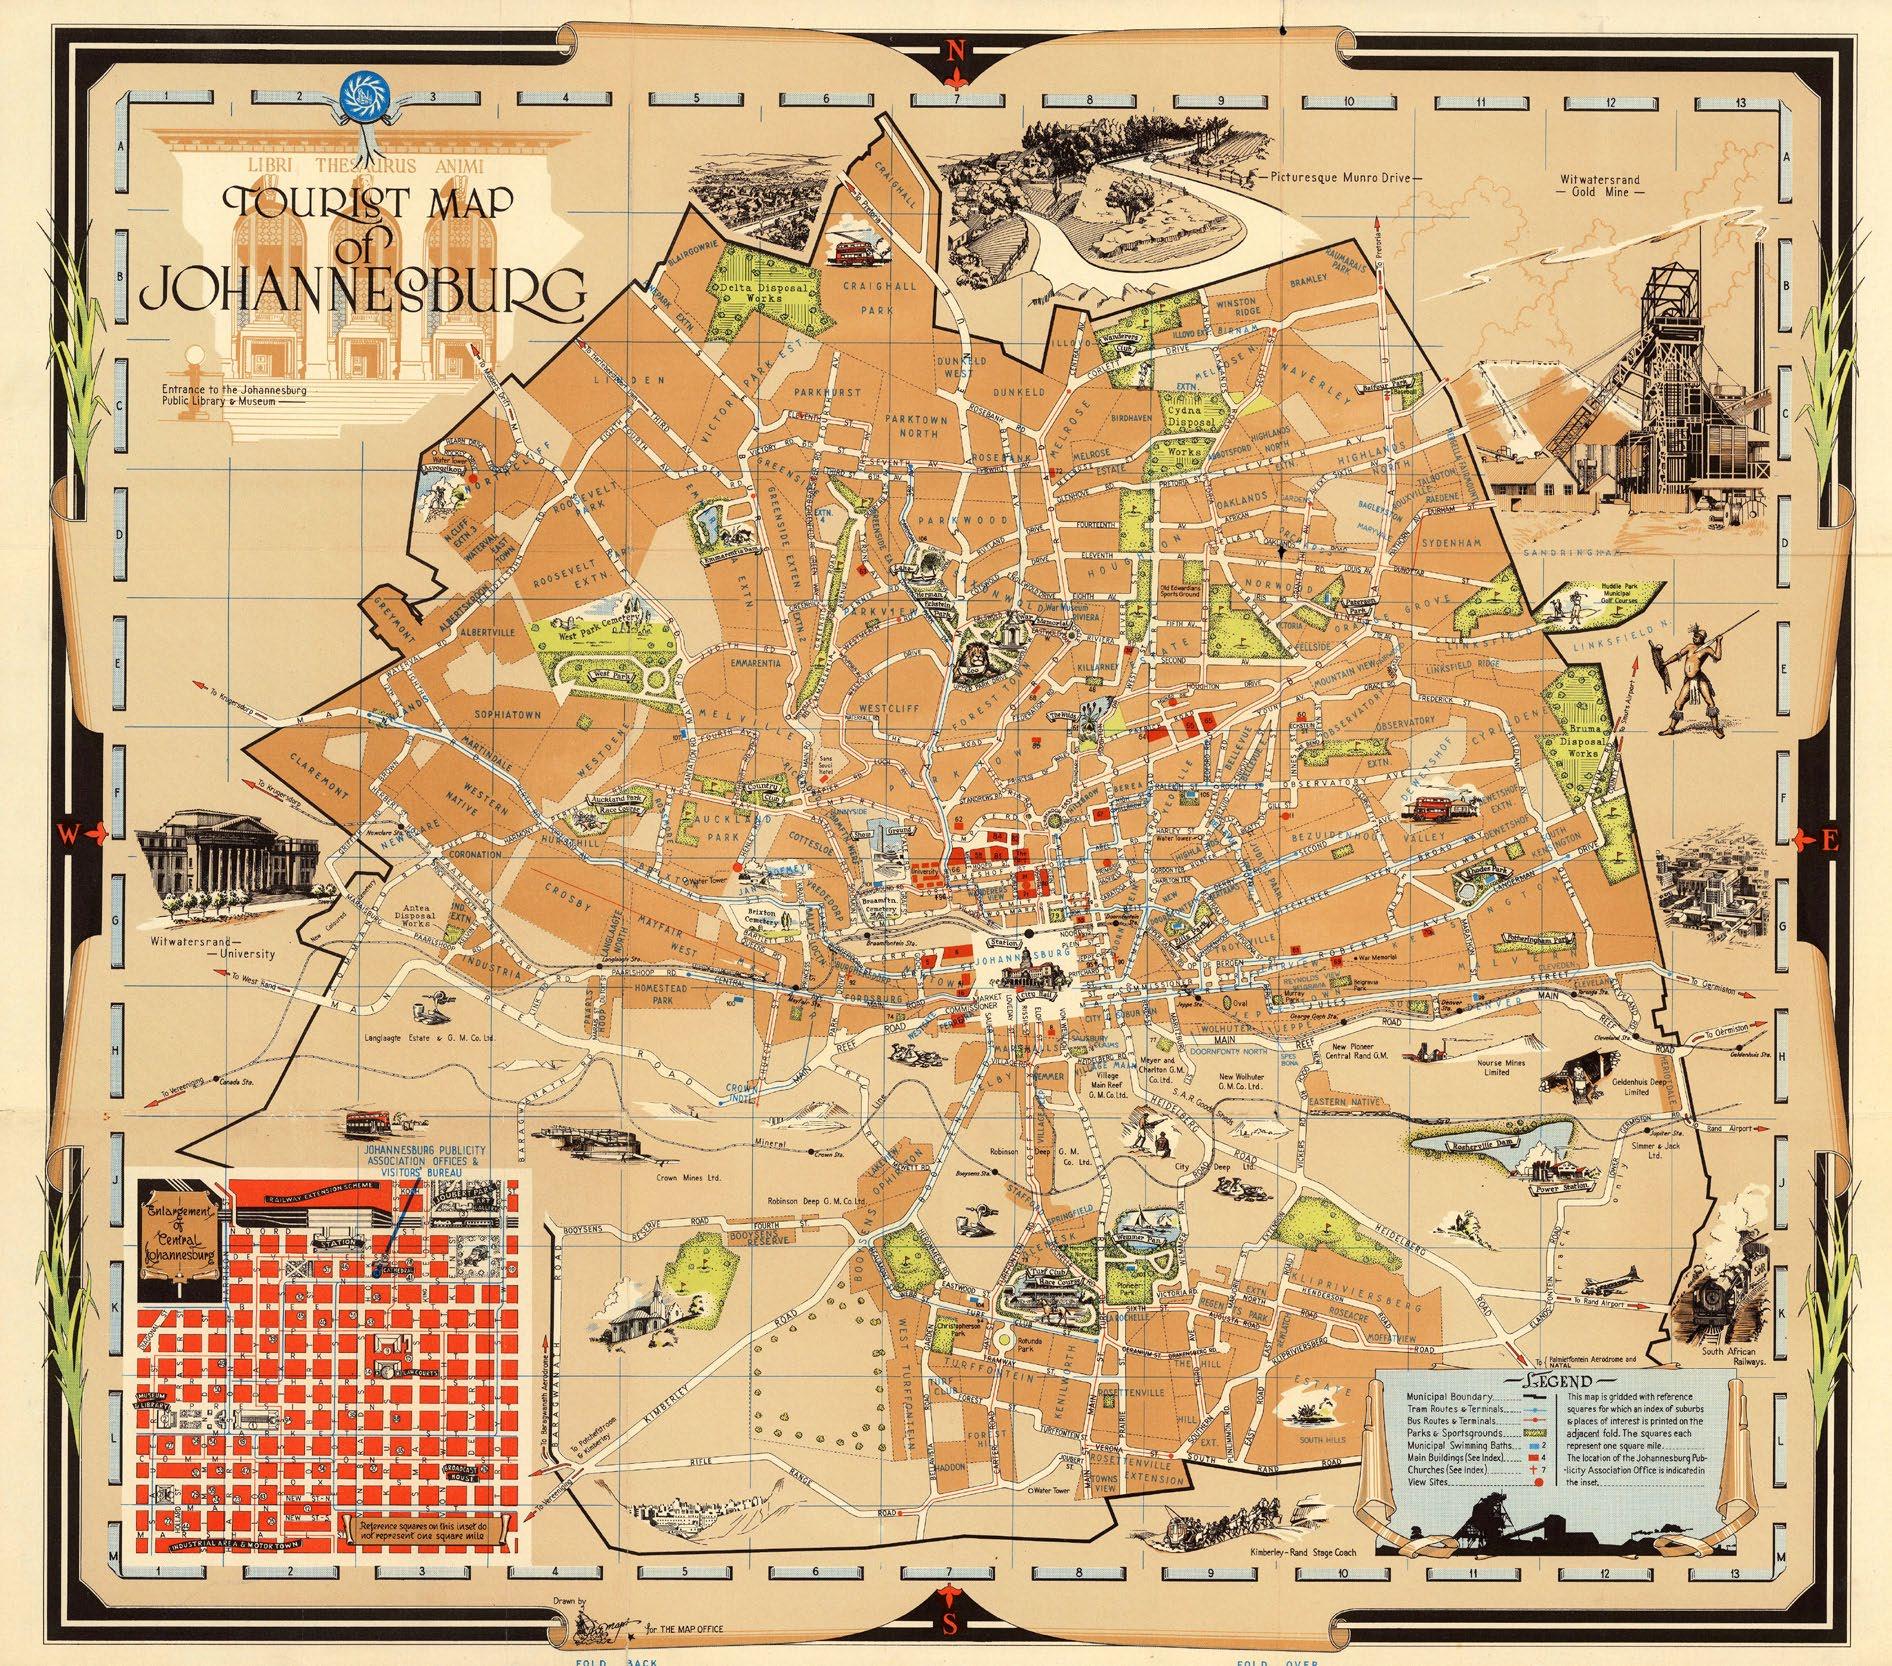
Tourist Map of Johannesburg
As the title suggests, this 1951 map of Johannesburg was created for the South African tourist market. With bright colors and attractive illustrations, Johannesburg appears welcoming to all, featuring a zoo, spacious city parks, race tracks, and other attractions. This cheery image is, unfortunately, a façade. In 1948, just a few years earlier, the white supremacist National Party emerged victorious in the general election and implemented an extreme Apartheid of racial segregation.
Apartheid, meaning “apartness” or “separateness” in Afrikaans, was a system of institutionalized racial segregation that lasted from 1948 until the early 1990s. By the time of this map was drawn, what had been a de facto system of racial segregation in South Africa, and Johannesburg in particular, had become law. Downtown Johannesburg, which appears in a detailed inset in the lower left corner, was generally off-limits to black South Africans. By the 1950s, blacks, Indians, and other minorities had been systematically removed from the city center and the surrounding area and forced to live in poorly serviced suburbs. The myriad streets, parks, country clubs, and other locations noted on the map were not, after all, intended for all, but for the few. There was but one notable exception. The Johannesburg Zoo, founded in 1904, along with the neighboring park, was one of the very few public spaces not segregated under Apartheid, due to the terms of the Deed of Gift under which the land was donated.
ìOnly one passing reference is made to Johannesburg’s colonial history, and that is in the form of a vignette of the Witwatersrand Gold Mine in the upper right corner. After the discovery of the Witwatersrand gold reef by Jan Gerritt Bantjes in 1884, prospectors and fortune seekers from all over the world began flocking to the region, creating first a mining camp which soon exploded into a full-fledged town which became Johannesburg. Within ten years, Johannesburg has surpassed Cape Town as the largest city in South Africa.
ìJohannesburg, and the South African Republic (now the Transvaal region of South Africa), became an independent nation in 1852 when the British recognized the independence of 40,000 Boers living north of the Vaal River. The discovery of gold, as it does, changed much, leading the British to reannex the independent nation. The South African Republic would fight a bloody insurrection and two scorched-earth wars, the First and Second Boer Wars, against the British Cape Colony. Ultimately, the South African Republic was annexed by the British at the end of the bloody Second Boer War.