REVIEW OF LITERATURE
Sugarcane Production in the Philippines
Sugarcane industry is one of the largest agro-based industries in the country, next to rice and corn, where higher investment has been made and has brought about desirable changes in social, economic, educational and political life in rural areas (BAR, 2010). The industry in the last decade was boosted further with the implementation of The Biofuels Act of 2006 (RA 9367). RA 9367 expanded the mandate of the Sugar Regulatory Administration (SRA) to develop and implement policies supporting the Philippine Biofuels Program and ensure increased productivity and sustainable supply of biofuels feedstock (i.e. sugarcane primary and secondary products).
Philippine raw sugar output in Market Year (MY) 2018/19 (December/November) was adjusted downwards from 2.225 MMT to 2.1 MMT. This is partly due to unfavorable weather conditions in some sugarcane-producing areas resulting in reduced tonnage but with higher yield/purity (Ang, 2019). Weather conditions, in particular the amount and timing of rainfall, strongly affect sugarcane output since about 80 percent of all sugarcane fields are rain-fed and have no irrigation. Similar to other countries, the decline in production is also a result of increased fertilizer prices and scarcity of supplies of the necessary soil nutrient inputs. Moreover, the contraction in sugarcane areas in CY2018/19 as reported by the Sugar Regulatory Administration (SRA) also contributed to the production decline. Farm productivity as measured by the quantity of cane output per unit area significantly decreased to 58 Tons Cane/Hectare (TC/ha) in 2017/18 compared to the recorded 66 TC/ha from the previous year, while yield improved from 1.75 50-kg bags/TC to 1.89 50-kg bags/TC. Although the milling season for crop year (CY) 2018/19 may end somewhat earlier than expected due to a lack of cane, industry contacts believe that the Philippines will still hit its lower production estimate of 2.08 MMT.
In the Philippines, 73 percent of domestic sugar production comes from the Visayas region with Negros Island alone contributing 64 percent of total output. This is followed by Mindanao at 17 percent and Luzon at 10 percent. Luzon’s share is down from 15 percent the previous year (2018) due to land conversion and a shift in crops planted. Approximately 90 percent of total nationwide production comes from four sugar planter
federations and three miller associations. In totality, there are 27 sugar mills and 8 sugar refiners in the country. There are 7 mills situated in Luzon, 12 in Negros Island, 3 in Panay, 2 in Eastern Visayas, and 4 in Mindanao. The sugarcane industry is also an important player in the production of bioethanol. There are currently 12 operating bioethanol distilleries and 6 power-generating plants (Ang, 2019).
According to SRA, there are about 65,000 sugarcane farmers in the country and this number is increasing due to the Comprehensive Agrarian Reform Program. About 80 percent have landholdings less than five hectares in size and less than 1 percent have farms greater than 100 hectares. As a plantation crop, productivity increases with increasing area of production (Hartemink, 2005). In the country, farms of more than 100 hectares have an average productivity of 7.34 MT/ha, while smaller farms of less than 5 hectares have an average productivity of 5.03 MT/ha. The sugar industry contributes about P87 billion ($1.74 billion, $1=P50) to the national economy, with more than 700,000 workers and 5 million of their dependents.
However, studies conducted by Paningbatan & Llanto (2004) and Mendoza, (2017) reported that the decrease in area planted to sugarcane challenged farmers to produce high cane and sugar tonnage per hectare. They also added that high yielding varieties, good soil condition, appropriate climatic condition, and good management strategies are important considerations to address this concern. Nevertheless, soil fertility is a big factor that contributes to high production. The crop depends on the nutrients in the soil for its physiological processes, growth, and sugar synthesis. Thus, proper nutrient management of soils planted to sugarcane is of utmost importance.
Nitrogen in Sugarcane Nutrition and Production
Nitrogen (N) fertilizer application is one of the important contributors to productivity in sugarcane production, ensuring sufficient N availability for the crops to achieve optimum and/or potential yields. When other sources of nitrogen in the soil are inadequate, nitrogen fertilizer must be added to sustain its nutrition and productivity. However, applying N fertilizer also increases losses of N to the environment, and so intensive production face the challenge of maintaining productivity while minimizing environmental impacts (Brown et al., 2012). The harmful effects of increasing N loading on water quality have long been recognized (Eickhout et al.,2006), and there
are now additional concerns with N applications enhancing emissions of the potent greenhouse gas nitrous oxide (Bouwman et al., 2002).
Intensive sugarcane production is presently experiencing tensions between productivity and environmental impacts from N use (Cheesman 2004; Brodie et al. 2008). Sugarcane as a plantation crop yields large quantities of biomass (70-90 t/ha, fresh weight), and this is often associated with substantial amount of N fertilizer applications (Roy et al., 2006). In some sugarcane growing countries like Columbia, China, and India, recommended applications of N can be as high as 300 kg/ha (Delgadillo-Vargas, 2016; Roy et al. 2006; Kostka et al., 2009). Other countries have lower recommendations which are in the range of 150-200 kg ha-1 (Guatemala, Perez et al. 2010; Mexico, Salgado García et al. 2010; Australia, Schroeder et al. 2010; South Africa, Meyer and Wood 1994; parts of USA, Anon 2001, Wiedenfeld and Enciso 2008), while in the Philippines, N recommendations ranges from 160-240 kg/ha according M. Guevarra (personal communication, March 2016). The practice of high N applications to sugarcane is often associated with N contamination of surface (Mitchell et al. 2001; Bramley and Roth 2002) and ground waters (Thorburn et al. 2003), which would likely be detrimental the nearby ecosystems (Brodie et al. 2008).
Sugarcane production is also gaining interest in the last decade due to the implementation of the Biofuels Act of 2006 (RA 9367). The industry promised as a good potential source of feedstock for biofuel production because of its potentially positive energy balance (Renouf et al. 2008; Smeets et al. 2009). However, sugarcane production may produce more GHGs (i.e. nitrous oxide, carbon dioxide) than many other plantation crops (Thorburn et al. 2010). Thus, without proper N fertilizer application management, the advantages of biofuel production from sugarcane could not offset the magnitude of GHG emissions from high N input (Crutzen et al. 2008; Smeets et al. 2009).
Crop production goals evolved from maximizing crop yields to achieving economic optimum while balancing the environmental and production goals. Accordingly, N fertilizer recommendations also advances towards judicious levels of N applications. The practice of having a general recommendation is replaced with systems based on inherent capacity of the soil to supply N to crops from sources other than fertilizers (e.g. mineralization of organic N) and/or target yields which define the
amount of N the crop needs (Neeteson, 1995; Paningbatan & Llanto, 2004). Similar with other annual crops, sugarcane yields are hard to predict because of seasonal climate variability (Everingham et al. 2007). And significant climate variation presents serious problems on sugarcane productivities. However, farmers always want to achieve higher yields, hence they apply large amounts of N relative to the crop requirements (Meyer et al. 2007). Studies have shown that N fertilizer recommendation systems that are based on target yields tend not to meet environmental goals (Johnson et al. 2002; Beaudoin et al. 2005; Derby et al. 2009). Thus, it is imperative to establish innovative protocols for determining N fertilizer requirements in sugarcane production to help address environmental challenges.
One common approach in establishing N fertilizer recommendation is the simpler input-output balance approach, where N fertilizer is applied to replenish the nitrogen that is removed from the system during harvest as well as environmental losses (Janssen and de Willinen 2006). This method considers the soil N reserves (organic and inorganic) to supply the N needs of the crop while keeping the balance of N in the soil. Thus, the method represents a complete view of soil N cycling as opposed to recommendation systems, which mainly focus on N mineralization (Meyer et al. 2007; Schroeder et al. 2010). Thorburn et al. (2004) proposed that the N replacement system would maintain productivity and reduce environmental losses of N as compared to more traditional approaches.
Increasing total N supply via fertilizer N applications will lead to greater plant N content and productivity (Fortes et al., 2011; Mariano et al., 2015). In many studies conducted, sugarcane N use efficiency (NUE; ratio between the amount of fertilizer N taken up by the crop and the amount of fertilizer N applied) is usually low with less than 40% of the fertilizer N applied recovered within ~12 months after its application (Ambrosano et al., 2005; Fortes et al., 2011; Franco et al., 2011; Vieira-Megda et al., 2015). While several research studies evaluated cane yield response to N fertilization for both plant cane and ratoon crop cycles in the Philippines (Paningbatan & Llanto, 2004), limited information is available related to plant growth dynamics, N use efficiency, and plant nutrient content through time. Seasonal plant growth and nutrient content dynamics can assist in providing new insights on the plant nutrient demand at varying phenological stages (Ciampitti et al., 2013). Thus, new strategies should be pursued to concurrently increase NUE, reducing the environmental footprint of
agriculture (reducing fertilizer N rates, lowering N2O emissions and NO3− leaching, saving inputs, etc.), and minimizing costs, leading to more productive, sustainable, and profitable sugarcane production systems.
Potassium in sugarcane nutrition and production
Potassium is an essential plant nutrient and is required in large amounts for proper growth and reproduction. Potassium is second to nitrogen when it comes to nutrients needed by plants. The deficiency of this nutrient will affect the plant shape, size, color, and taste and other measurements attributed to healthy produce. Pants absorb potassium in its ionic form K+. Research regarding Nitrogen (N) and Phosphorous (P) fertilization has been successfully studied, however, potassium is being ignored. Mengel (2016) mentioned that potassium is essential in plant life and development, Cavalcante et al. (2015) added that potassium is particularly important in sugar production as it facilitates many other biochemical and physiological process.
The study of El-Tilib, Elnasikh, & Elamin (2004) mentioned that the application of potassium fertilizer (86 kg K2O/ha) showed a significant effect on the stalk height at 10 months old towards all stages of growth for ratoon. The group of de Almeida et al. (2015) also mentioned that the stalk height of sugarcane increases quadratically reaching to a maximum height of 89 cm with the application of 111 kg K2O/ha. The increase of stalk height in both studies mentioned were a result of having genotypic and varietal differences. The presence of potassium will promote P and N uptake resulting in increased the growth rate by ensuring the appropriate balance of nutrients (Uyovbisere & Lombim, 1991). Stalk height had also been found to by potassium deficiency (Chatterjee et al., 1998).
Moreover, several studies have proven the effects of potassium on the yield of sugarcane. An increase of yield was found out in Vietnam with the application of fertilizer with an increase of 18.5 -31.5% in Khan Hoa and 9.2 -26.8% in Gia Lai compared to farmers practice and they found out that a dosage of 350-400 kg K2O -1ha is the economic optimal K (Tran Duc Toan et al., 2016). In India, a yield increase of 15.2% (74.1 t/ha) was noted through the application of 66 kg K2O with irrigation water (K fertigation) as compared to no irrigation and no K application (Shukla, Yadav, Singh, & Singh, 2009). When it comes to timing of application, the group of Vijay et al., (2009)
concluded that the application of potassium at 50 kg K2O -1ha at the time of planting or preparing for ratoon increased the cane yield for both plant and ratoon crop as compared to no potassium application in Haryana, India.
Potassium is an enzyme activator in plant metabolism such as photosynthesis, protein synthesis, starch formation and translocation of proteins and sugars (Filho, 1985). The application of potassium to sugarcane can result in increased sugar content. The study of de Almeida et al. (2015) found out that the application 86 kg K2O/ha promotes a quadratic increase in sugar content for a variety of SP81-3250 grown in dystrophic Red Yellow Latosol (dRYL). In addition, an increase of sugar content from 8-11% to 11-12% was observed in the study of Tran Duc Toan et al. (2016) in the application of 200 kg K2O/ha in Vietnam. A similar result was also observed in the study of Vijay et al. (2000) wherein sugar content also increased with the application of 50 and 75 kg K2O/ha.
Despite all the well-documented study on the effects of potassium application towards stalk height, yield and sugar content still, there have been limited studies conducted in the Philippines. Nevertheless, results shown were all site-specific and often not applicable to other soils types, climate, and varieties. With the high demand for potassium of sugarcane, it is indeed imperative to conduct studies to determine the appropriate potassium doses and sufficient potassium availability to update recommendations on potassium application especially with the rapidly changing climate.
Phosphorus in Sugarcane Nutrition and Production
Phosphorus plays a critical role in plant growth and is considered one of the 16 essential elements. As a component of adenosine diphosphate (ADP) and adenosine triphosphate (ATP), P takes part in most biochemical processes including photosynthesis, respiration, protein and nucleic acid synthesis, and nutrient transport through the plant’s cells. Insufficient P in plants thus affects overall production and crop propagation. P deficiency manifests as delayed maturity, reduced quality of produce, and decreased disease resistance (IPNI, 1999). In sugarcane, P deficiency specifically causes reddening in young leaves and short and slender stalks (Mccray et al., 2013).
In soils, P is present in solid and dissolved forms, with the latter composing 0.1 percent of total P and is the form of P available for plant uptake. Solid P exists either in organic or inorganic forms. Inorganic P is associated with the surfaces and mineral matrices of soil particles, while organic P is bound to soil organic matter, microorganisms, and plant materials. Different forms of P may also be partitioned into soluble, labile, and non-labile P (Figure 1). Soluble and labile P become available for plant uptake as orthophosphate through dissolution in water or weak salt, while nonlabile P is encapsulated within soil minerals and can only be released by very strong treatments (Bomans et al., 2005). It has been identified that P availability mainly depends on factors including soil P status, organic matter content, and the presence of Fe-Al oxides or Ca-carbonates (Bomans et al., 2005; Daly, 2000)
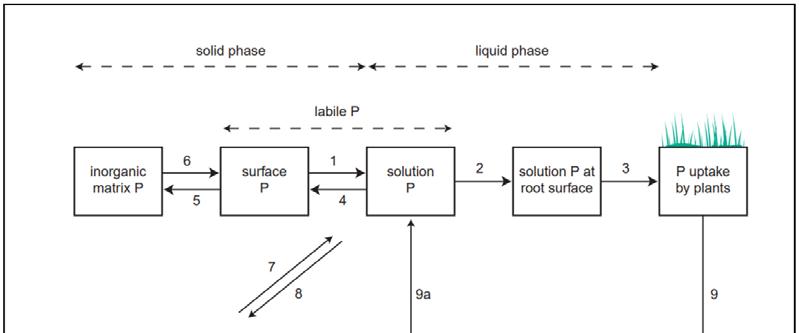
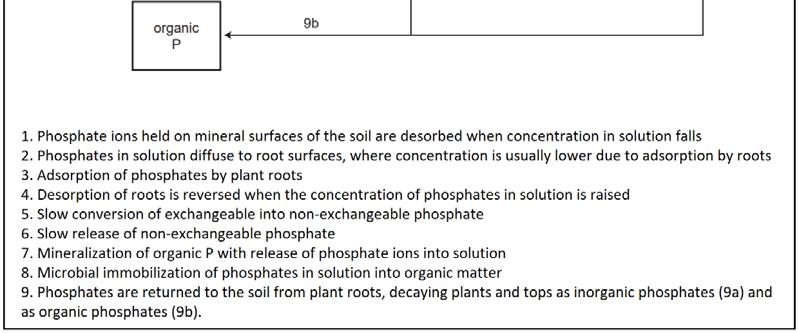
Figure 1. Transfer of phosphate between soil, plant and water (Wild, 1998 cited in Brogan et al., 2001)
While insufficient supply in available P causes adverse effects on plant growth, overabundance in P neither affects crop production nor the quality of produce. Losses
in P in soils is also not significant in agronomic terms. However, P run-off to susceptible freshwater bodies may cause eutrophication. As such, P application management must be implemented not only to optimize yields and minimize cost but to prevent adverse ecological effects as well. Practices designed to increase productivity of agricultural soils almost invariably increase the biological productivity of waters draining these soils and may accelerate eutrophication (Bomans et al., 2005).
In non-amended soils, soil P in solution is usually low for sufficient production. To maintain economically viable crop yields (Bokhtiar & Sakurai, 2003; Perez & Melgar, 1998), P application has been a practice in agricultural systems. The efficiency of P fertilizers is normally low due to the complex dynamics of P in the soil (Zambrosi et al., 2014). In tropical soils, where sugarcanes are mostly grown, soil P availability is also poor due to the ability of these soils to fix plant-available forms of P (Landell et al., 2003; Perez & Melgar, 1998). As a solution to these challenges and to keep up with the demand in sugar and biofuel production, high rates of P application in sugarcane plantations has become a widespread practice. However, different sugarcane varieties respond differently to P fertilizer application in terms of efficiency (Zambrosi et al., 2014), and different soil types also have different P sorption and desorption capacities (Daly et al., 2006). To achieve accurate P management for sugarcane nutrition and production, sufficient data must be obtained regarding the effects of P application on relevant varieties and soil conditions.
Fertilizer Use Efficiency
Fertilizer use efficiency (FUE) is a very important concept for evaluating crop production systems and can be greatly impacted by fertilizer management as well as soil- and plant-water relationships (Baligar and Duncan, 1990). FUE indicates the potential for nutrient losses to the environment from cropping systems as managers strive to meet the increasing societal demand for food, fiber and fuel. FUE is considered to be quite low on average in conventional agricultural systems around the world (Raun and Johnson, 1999), including developed nations (Sharma & Bali, 2017). Worldwide, fertilizer use has increased drastically. However, world crop yields have hardly increased in proportion to the fertilizer applied to crops. This demonstrates a vast inefficiency of fertilizer use (Raun and Johnson, 1999; Cassman et al, 2002; Abebe and
Feyisa, 2017). These examples, and there are many more that could have been cited, serve to illustrate the growing importance of improving the fertilizer use efficiency in the nutrition of sugarcane for profitable and sustainable production.
The best fertilizer management practices can be established for each crop by carrying out field experiments under different environmental conditions. Therefore, in practice, a series of carefully designed field experiments, in several representative locations are carried out over a period of time for estimating the effect of fertilizer placement, timing and source of fertilizer materials on crop nutrient uptake. Yield, particularly agronomic and economic yield, is generally the most important criteria for the farmer but it is equally important that this yield is obtained with a minimum of fertilizer investment (minimum cost).
Isotope Tracer and Related Techni ques for Nutrient Management
In N fertilizer experiments involving both environmental and agronomic aspects, the isotope 15N has been extensively used as a tracer incorporated in nitrogenous materials to levels much above the natural 15N abundance. Isotopically labelled fertilizer tracer is widely used to examine the fate of nutrients (Choi et al. 2004). Alternatively, elemental tracer techniques can be used to estimate gross nutrient transformation rates in the soil by measuring the isotopic dilution of a product pool (Griffin, 2007; IAEA, 2001). Isotopes of Nitrogen (15N) Phosphorus (32P) and Potassium (40K) were used as tracer nutrients for efficiency studies and appropriate fertilizer recommendations (IAEA, 2001; Zapata and Hera, 1997; Hera, 1995; Zapata and Axmann, 1991). The method provides a direct and quick means to obtained needed information that is valuable for the design of better fertilizer strategies as well as for the provision of sound recommendation in the application of fertilizers. Utilizing the advantages of using such techniques may offer several advantages to find solutions on the extensive problems in cane production such as over and under fertilization, leaching losses and washing by run-off causing eutrophication in the receiving water bodies.
Studies have shown the potential of 15N as an important tracer to delineate mineralization of soil organic matter N, plants/crops nitrogen use efficiency, soil losses by nitrate leaching (Accoe et. al. 2004; Burger and Jackson 2003; Bengtsson et. al. 2003; Perakis and Hedin 2001, Nadelhoffer et. al. 1999). Isotope tracer technique though
relatively expensive compared to non-isotope methods, provides precise and quantitative data on the fertilizer use efficiency (Sturm and Adu-Gyamfi, 2009).
Nutrient use efficiency (NutUE) is usually low and is aggravated by poor production systems. In several studies employing 15N isotope tracer in sugarcane, NutUEs reported are about half of the total amount applied (~50%) (Martinelli and Filoso, 2008; Franco et al. 2011; Vieira-Megda et al. 2015). However, Vallis and Keating (1994) reported lower values ranging from 20 to 30%. Cantarella (2007) also showed similar results using compiled 15N data for cereal crops. However, N recovery may be even lower under certain management conditions. Fan et al. (2004) reported that the average N fertilizer recovery in Poaceae was 30–35% and that more than half of the applied nutrients are lost to the environment. Comparable results were also obtained by Cassman et al. (2002) and Bruulsema et al. (2004) showing about 37% nitrogen recovery. The on-farm experiments conducted in the Philippines for various soil test values based on conventional crop-response method generated a very wide range of recommendations: 40-300 N kg/ha, 40-280 P2O5 kg/ha, and 120-360 K2O kg/ha (Paningbatan & Llanto, 2004). However, in the advent of new more accurate techniques and precise instrumentation, this problem of inefficiency can be minimized if not avoided.
Nuclear analytical techniques have accounted significant contribution in increasing water and nutrient use efficiencies in agricultural production of sugarcane through improved management of irrigation water, improved understanding of the interaction between nutrient and water use efficiency, and application of both conventional and isotopic techniques to partition different input sources.
THE CONVENTIONAL METHOD OF FERTILIZER USE EFFICIENCY MEASUREMENT
Conventional method is most commonly defined as the difference in nutrient uptake in plant between the fertilized and unfertilized crop relative to the quantity of nutrient applied. Simply, the method measures the biological response or the effect of increasing fertilizer rates on crop yield. It is assumed that the nutrient uptake of the control plot measures the amount of nutrient available from the soil, whereas that of the fertilized treatments, the amount of nutrients available from soil and fertilizer (Bruulsema et al, 2004). This method furthermore assumes that all nutrient
transformations i.e. mineralization, immobilization, and other processes in the case of nitrogen, are the same for both fertilized and unfertilized soils. In this method, nitrogen uptake of growing crop from fertilizer and soil cannot be separated from soil N as both are made of 99.63% stable 14N. It is often the preferred FUE expression by scientists studying the nutrient response of the crop. It can only be measured when a plot without nutrient has been implemented on the site, but in addition requires measurement of nutrient concentrations in the crop. FUE in this approach, when computed from annual response data, will often underestimate long-term FUE.
MEASUREMENT BASED ON NUTRIENT UPTAKE THROUGH TRACER TECHNIQUE
The only direct means of measuring nutrient uptake from the applied fertilizer is through the use of isotopes. The ability of isotope techniques to determine the different nutrient source in crop tissues, and the historical water availability will allow researchers to directly determine fertilizer recovery and the nutrient/water availability. Thus, recommendation on best fertilization-irrigation scheme can be generated easily.
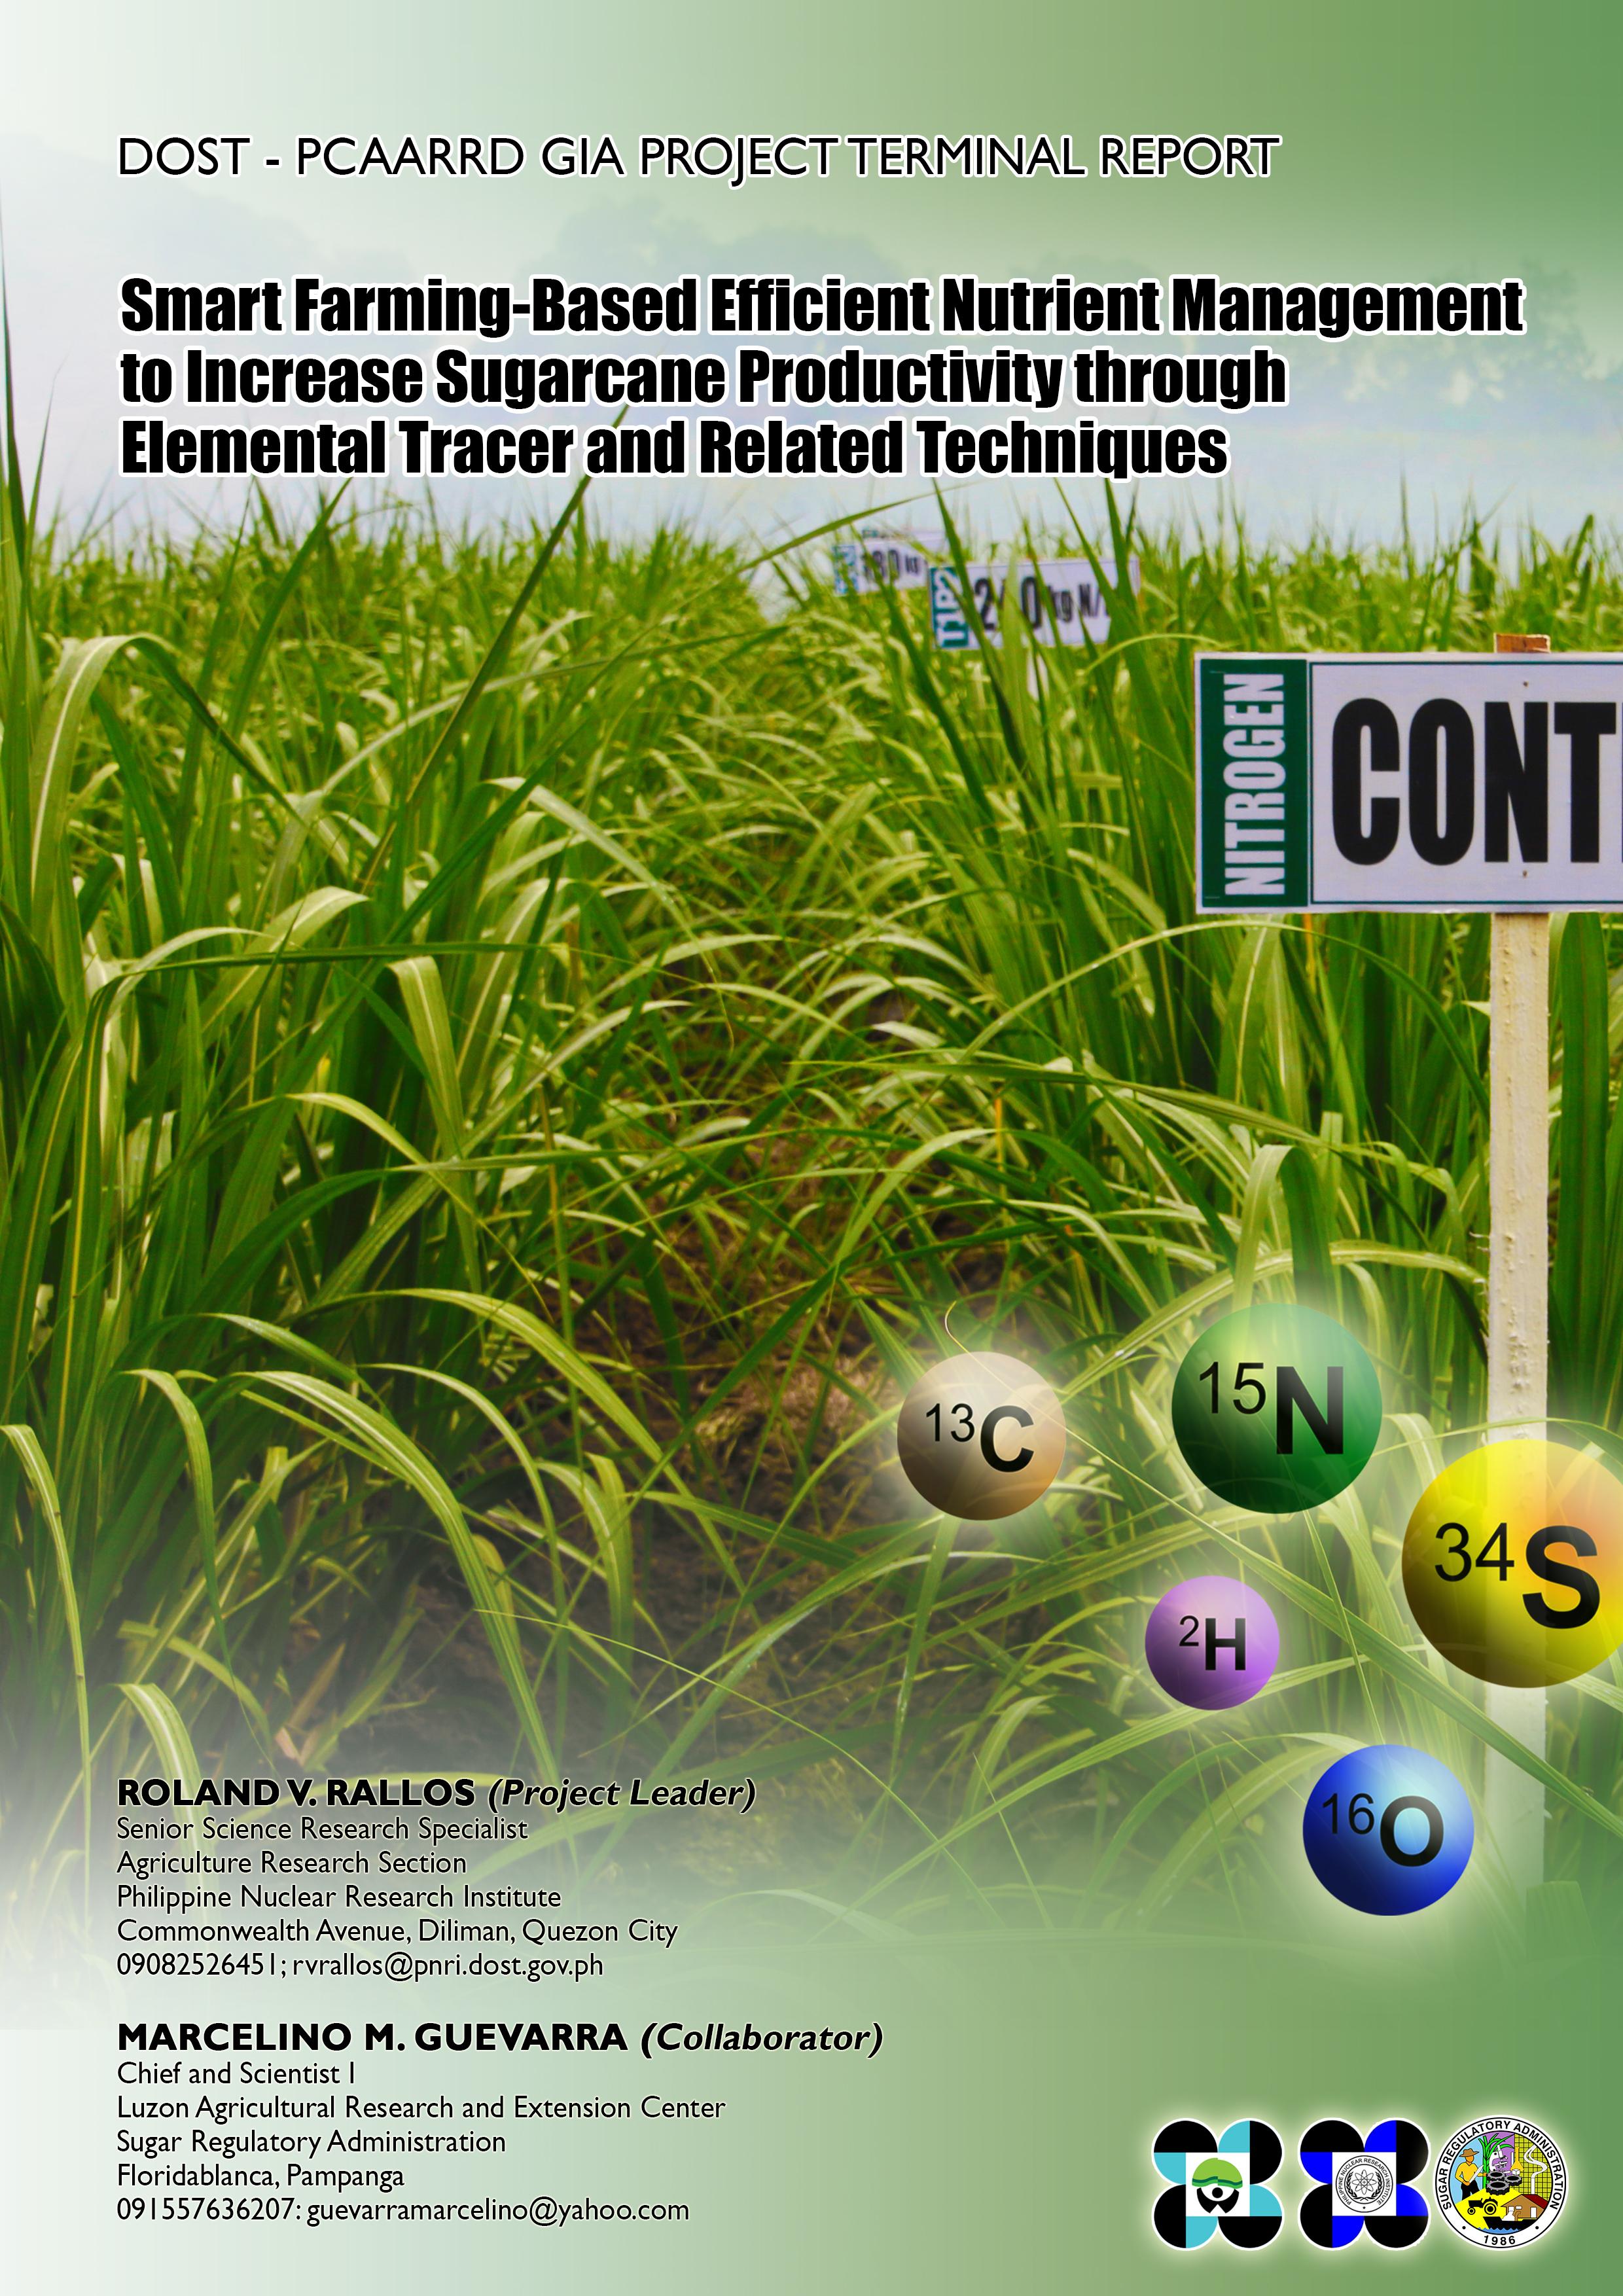
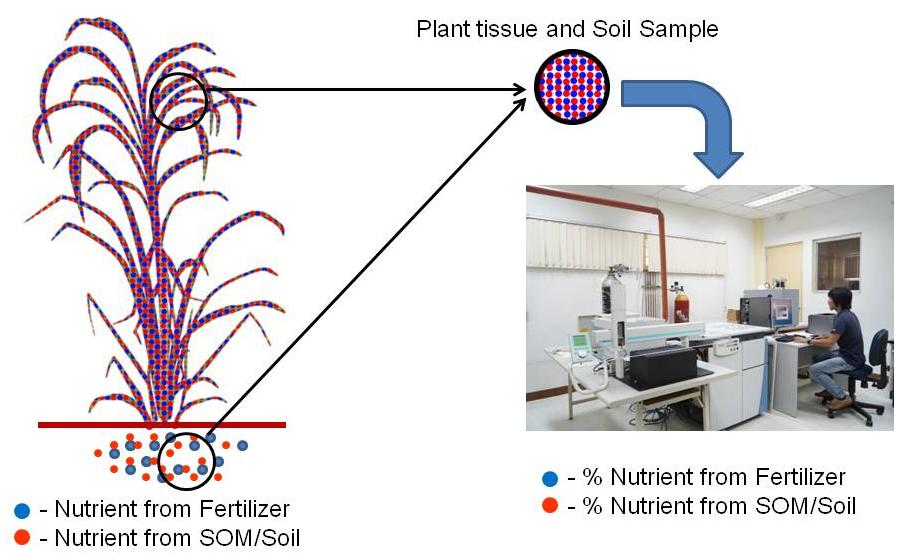
Isotopically labeled fertilizers afford distinction between different sources of nutrients and allow researchers to directly determine fertilizer nutrient recovery; hence its alternative name “direct method” (IAEA, 2001) (Figure 3). Moreover, tracer techniques can be used to estimate gross transformation rates of the fertilizer added in the soil by measuring the isotopic dilution of a product pool (Griffin, 2007; IAEA, 2001). Studies had shown the potential of 15N as an important tracer to delineate mineralization of soil organic matter N, crops nitrogen use efficiency, and soil losses by nitrate leaching (Accoe et al. 2004; Burger and Jackson 2003; Bengtsson et al. 2003; Perakis and Hedin 2001, Nadelhoffer et al. 1999). Hence, utilizing the advantages of using such technique offers several advantages to solve the extensive problem on managing fertilizers in sugarcane production systems.
The adoption of nuclear based technologies like 15N labeling technique in soil, water and nutrient management system showed potential results in previous research studies conducted at PNRI in food crops (Rosales et al. 1998, 2001, 2004). Thus, the advantage of utilizing nuclear technology may lead to the development of appropriate fertilization-irrigation scheme in sugarcane production systems best suited for Philippine condition.
PRINCIPLE OF TRACER TECHNIQUE
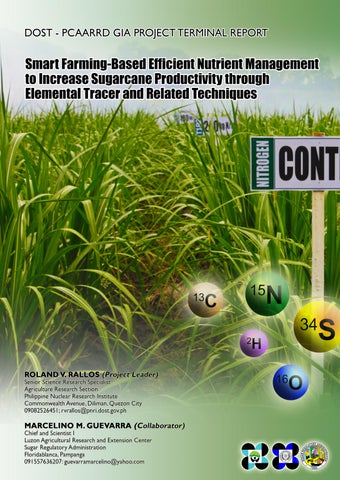
Isotopically labelled N fertilizer, source of 15N stable isotope, added to the soil during the experiment will serve as the source of fertilizer N. Another source of N will be the natural N coming from the soil. Plant will take up both the nitrogen from the labelled fertilizer and soil as it grows (Figure 2). The labelled fertilizer has a different N isotopic composition compared to nonfertilizer N from the soil. Using the Isotope Ratio Mass Spectrometers (IRMS) the two N isotopes can be fractionated from each other and can be quantified separately from the samples. From this data, N derived from fertilizer (NDFF) or the actual fertilizer N uptake of the plant as well as fertilizer nitrogen use efficiency (FNUE) can be calculated.
Figure 2. Application of fertilizer tracer (15N isotope) in sugarcane during plant nutrient uptake and assimilation.
Figure 3. Tracing the sources of nutrient by elemental tracer technique.
The adoption of nuclear based technologies like 15N labeling technique in soil, water and nutrient management system showed potential results in previous research studies conducted at PNRI in food crops (Rosales et. al. 1998, 2001, 2004). Thus, the advantage of utilizing nuclear technology may lead to the development of appropriate fertilization scheme in sugar production systems best suited for Philippine condition.
METHODOLOGY
Site location and characteristics
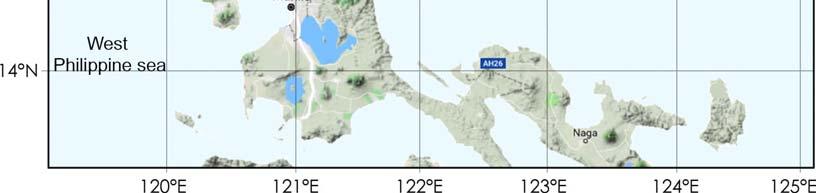
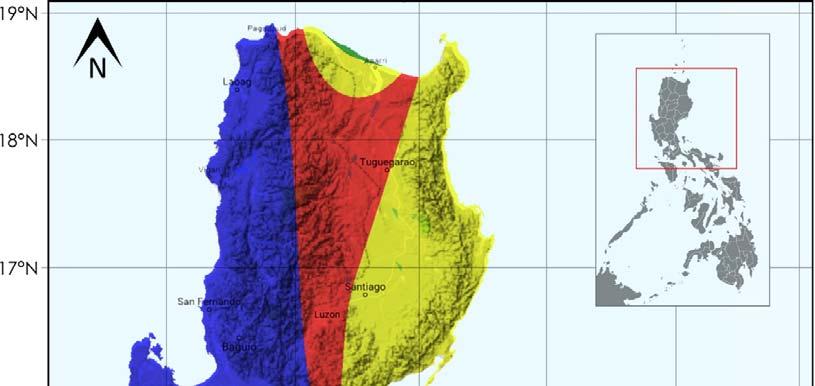
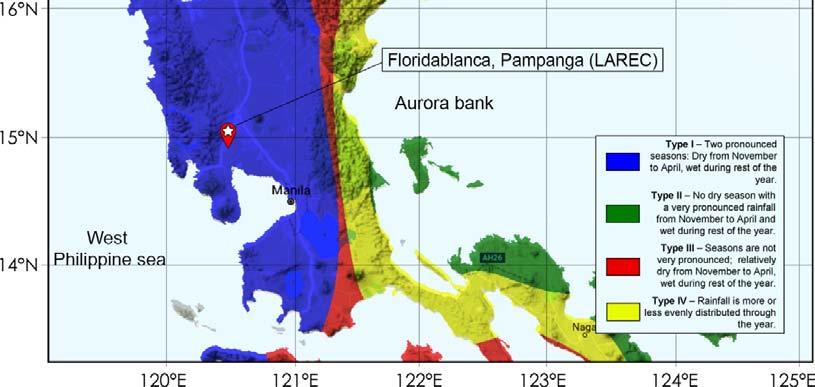
Field experiments were conducted for two consecutive croppings, namely plant crop (PC) and first ratoon (RN) from February 2015 to April 2016 at the Sugar Regulatory Administration – Luzon Agricultural Research and Extension Center, Floridablanca, Pampanga (14.992377 N, 120.528726 E) (Figure 4). Three study fields were identified for nitrogen, phosphorus and potassium fertilizer response experiments. Generally, based on the modified Coronas climate classification system, Floridablanca is under Type I climate with pronounced dry season from November to April and wet during the rest of the year (Figure 5).
Soils in the study area are classified as Angeles series (Typic Ustipsamment) with a light sandy texture and isohyperthermic temperature regime (>22°C). It is a
young soil with only slight development which the properties are determined largely by the parent material. Site soils are structureless with gravels present throughout the profile, have rapid permeability, poor water holding capacity and is subject to seasonal flooding. Soil pH ranges from 6-6.5 with low inherent fertility especially for the three macro nutrients N, P and K. Some other selected physico-chemcial characteristics are presented in Table XX.
Agrometeorological data (ambient temperature, sun hours, cloudiness, relative humidity, and rainfall data) were obtained in the installed weather station (Hobo, Australia).
Based on modified Coronas Climate Classification(1951-2003)
4 . Map showing the locations of the experimental site.
Figure
Figure 5 . Map showing the climatic condition of the experimental site.
Land preparation
Around 1.5 ha of land were cleared from weeds and residues from previous sugarcane croppings. The areas for N, P, and K experiments were plowed and harrowed following the established protocols for land preparation (Philippine Recommends for Sugarcane, 2010). The soils were further cultivated 2 times with a tractor mounted cultivator to a depth of 10-12 cm followed by leveling. Thereafter, trenches were made by use of a ridger plow and spaced 1.3 m apart. Sugarcane variety Phil99-1793 was planted on 3 March 2014 for the first year and ratooned on 25 March 2016 for the second year. Seed rate of 72,000 double budded setts per ha was used and it was planted end to end in single rows within the trenches.
Experimental design and field layout
The experiments were laid out following the Randomized Complete Block Design (RCBD) with four replications (Figure 6A). Each replication for N and P were divided into seven (6) treatment plots, each plot measuring 58.5 m2 (9 m x 6.5 m) with 5 furrows per plot (Figure 6B). In the case of K, each replication was divided into five (7) treatment plots. Treatment levels for N, P and K experiments are presented in Table 1. Except for the treatment element, rates of nitrogen (N) were applied at 240 kg ha-1, phosphorus (P) at 180 kg ha-1 and potassium (K) at 600 kg ha-1 in trenches at the time of planting in the form of urea, SSP (Single Super Phosphate) and MOP (Sulfate of Potash) respectively. To facilitate farm operations, management, and data gathering, the replication and treatment plots were separated by 2 m and 2.5 m alleyways.
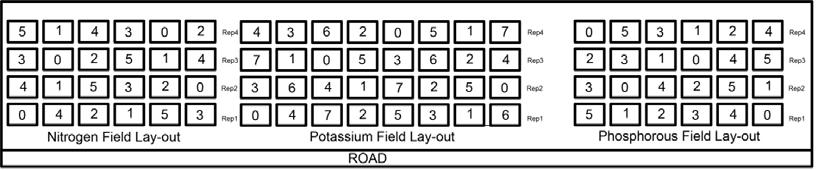
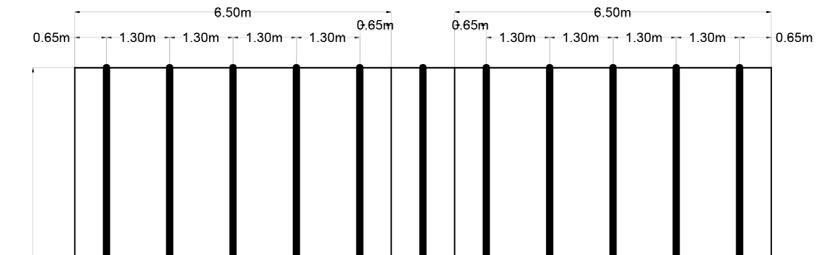

Figure 6. Field experimental layout showing the randomization of the different plots (6 levels for N, 6 levels for P and 8 levels for K experiments) (A) and treatment plot lay-out showing the location of the microplot (B). 15 N Tracer Microplot
Table 2. Treatment levels for N, P (P2O5) and K (K2O).
Isotope tracer plots, 15 N labeling and fertili zer application for Nitrogen, Phosphorus and Potassium experiments
Isotope tracer plots measuring (1.3 m x 7.0 m) were established on designated treatment plots. A labelled 15N urea fertilizer of 2.00 atom % was applied in accordance with the amount designed in the treatments. The labeled fertilizer was distributed evenly in the isotope plots at the same time with the application of ordinary commercial fertilizers.
All the required P2O5 and K2O, together with the N requirement for the first application were applied in the furrows and covered with soil after the germination period. Moreover, after 45 days from planting, the remaining N was side- dressed and covered by hilling up the soil with plow.
Fertilizer application for phosphorus and potassium experiments were applied using solophos (0-18-0) and muriate of potash (0-0-60), respectively. Levels of application for phosphorus and potassium were calculated based on their oxidal forms of P2O5 and K2O. Application of both fertilizers were done only once after the germination period (around 21 days from planting).
Care and Maintenance
A weed-free condition was maintained up to the maximum tillering stage of the crop. Weeds were controlled by tractor driven implements for off-barring, and hillingup. Off-barring and hilling-up operations were done accordingly when necessary. Irrigation was done accordingly based on the soil moisture data obtained using the 10HS soil moisture profiler (Decagon, USA) to avoid crop moisture stress. Sprinkler irrigation was used to minimize fertilizer contamination amongst the various treatments. Detrashing was also done when necessary to remove senesced leaves to avoid the risk of accidental fires.
Harvesting and Data Gathering
Harvesting was done 12 months after planting when the brix reading and sugar content were within the optimal range. Yield data were collected by weighing the
cleaned stalk in the four inner rows of the treatment plots. Total number of cane stalks was counted at 8 months of sugarcane cane age. At harvest, 10 millable stalks were sampled from the middle four furrows and the following parameters were measured: stalk length, stalk girth, stalk weight and estimated recoverable sucrose (ERS). Sugar yield was calculated from cane yield and ERS. Furthermore, juice quality parameters such as brix, pol, and purity were also taken.
Plant morphological monitoring and soil nutrient (NPK) content
Plant tissue nutrient monitoring was undertaken at monthly interval. Similarly, monthly morphological monitoring was also conducted evaluating the changes in plant height (biweekly), stalk weight, and stalk moisture content (monthly). To obtain the plant above-ground biomass, the stalks were cut close to the soil surface. The plant samples were then washed with tap water and rinsed with distilled water, damp-dry with paper towel and weighed. The shoots and stalks were placed separately in properly labeled paper bags and were air-dried. Subsequently, plant samples were dried in a forced draft oven set at 70° C until no further changes in dry weight was noted. The oven dried samples were weighed and ground in Wiley Mill grinder to a particle size less than 1 mm. Prior to weighing plant samples for analysis, the ground plant tissue samples were placed again in a forced draft oven set at 70° C to ensure dryness.
Soil samples were collected from surface (0-20 cm) and subsurface (20-40 cm) using soil auger. About one-half kilogram of composite soil sample was obtained from three soil sub-samples collected from replicate plots. Soil samples were air dried, ground using a wooden mallet, sieved to pass a 2-mm mesh for routine wet lab analyses and 0.425 µm mesh for C and N analyses. Prepared samples were stored in a properly labeled plastic containers and sealed tightly.
Laboratory analysis of soil and plant tissue samples
The laboratory analysis for soil and plant tissue samples were based on the established laboratory methods and instrumentations. All analyses are reported on an oven-dry basis at 60°C for plant tissues and 105°C for soil samples using a forced convection oven (Biobase Ltd. China).
SOIL pH
This was determined using potentiometric method with 1 to 2.5 soils to diluent ratio and with distilled H2O respectively (PCARR, 1980). Ten grams of soil that was passed through a 2-mm sieve or no. 10 mesh screen will be putted into a 50ml beaker. The samples were added with 25 mL distilled water and was stirred thoroughly and allowed to stand for 15 min after mixing. Immediately before placing the electrode of calibrated pH meter, the soil suspension was stirred again thoroughly. The pH meter was calibrated using the standard buffer solution of pH 4.0 and 7.0. The pH was determined to the nearest 0.1 unit. The electrode was rinsed with distilled water and blot dried with paper towel before proceeding to the next sample.
TOTAL N, C AND 15 N ANALYSIS
Total N, C, and isotope ratios were analyzed using flash combustion elemental analyzer following the method of (Gremaud and Hilkert, 2008). Briefly, 12-15 mg of soil samples or 4-5 mg for plant tissue samples were weighed and placed in tin capsules. The tin capsules which contains the sample were introduced from the autosampler into the combustion reactor maintained at 1020°C where an instantaneous and complete oxidation process took place. This instantaneous combustion was achieved by the optimum timing for the introduction of a pulse of ultra-high purity oxygen gas (99.999%) when the tin capsule reaches the hot zone in the combustion reactor. The carbon and nitrogen contained in the sample was converted to CO2 and NOX respectively. The reactions were facilitated by the presence of the catalyst, Cr2O3, which was used as a packing material in the combustion reactor.
Following combustion, the resulting gaseous products were allowed to pass through a reduction furnace maintained at 650°C. The reduction column contained high purity copper where the excess oxygen was scavenged by the reduced copper and NOX was reduced to N2. An additional water trap was set up to remove the water produced from the combustion process before the final dry gaseous products enter the chromatographic column with the help of ultra-high purity helium (99.999%) as the carrier gas. The separated gases were eluted at different retention times and, if required, were diluted before their introduction into the isotope ratio mass spectrometer (IRMS) for final quantification of total N, C and corresponding isotopic ratios.
SOIL EXTRACTABLE P
This was determined according to Bray #2 method (Bray and Kurtz, 1945). Using <2 mm soil samples, a 2.5 g of soil was weighed and added with 25 mL extracting solution (0.1 N HCl and 0.03 N NH4F) and was shaken for 5 minutes using a reciprocating shaker at 180 oscillations per minute. Filtrate was collected by filtering the solution through Whatman no. 42 filter paper. From the filtrate, 2 mL aliquot was added with Reagent C [mixture of 200 mL Reagent A (Ammonium molybdate and potassium antimony) and 800 mL Reagent B (Ascorbic acid)], mixed using vortex mixer and was allowed to stand for 15-20 minutes for the blue color development (Murphy and Riley, 1962). Absorbance was read using spectrophotometer at 880 nm wavelength. The same procedure of quantification for blank and working standards (0.2, 0.4, 1.0, 2.0, 4.0, 6.0, and 8.0 µg P L-1) was done. A blank was prepared in the same way as the unknowns but without soil.
PLANT TISSUE TOTAL P AND K
Total P and K of plants were determined through dry ashing followed by UV-Vis spectrophotometric measurement for P and Atomic Absorption Spectrophotometric analysis for K. Briefly, 0.5 g of oven-dried plant tissue sample was placed in a crucible. The crucible with sample was then placed in the muffle furnace set at 550°C for about 5 hours until white ash was formed. The ash was dissolved by concentrated HCl, the solution was then transferred and volume to 100mL using volumetric flask. The solution was then filtered and was read through AAS for total potassium content. For P analysis, the solution was then added with reagent A (ammonium molybdate and potassium antimony) and reagent B (Ascorbic acid), mixed using vortex mixer and was allowed to stand for 15-20 min. for the blue color development (Murphy and Riley, 1962). Solution absorbance was read using UV-Vis spectrophotometer.
SOIL EXCHANGEABLE K
The exchangeable K was extracted using the Ammonium Acetate method (PCARR, 1980) and will be quantified using the Atomic Absorption Spectrophotometer (AAS). A 2.5 g of soil was weighed and placed into a 125 mL Erlenmeyer flask. The soil was added with 25 mL 1 N NH4OAc, pH 7.00 and shaken for 5 minutes in reciprocal shaker at 180 oscillations per minute. After shaking, the soil suspension was allowed to stand for 1 hour. The soil and the supernatant was transferred to a funnel fitted with no.
42 Whatman filter paper where the filtrate was collected using plastic receivers. The collected filtrate was analyzed through Atomic Adsorption Spectrometry (AAS) for the quantification of exchangeable K.
ISOTOPIC TRACER DATA AND N RECOVERY EFFICIENCY (RE)
The atom % of 15N excess was calculated as the difference between the 15N atom % in plants and its natural abundance (0.3663%). Nitrogen uptake was determined by multiplying the dry matter yield by the N concentration in the corresponding plant tissues (Equation 1).
Equation 1. N yield kg ha DM of plant x %N /100
Where DM is the dry matter yield.
The contribution of fertilizer N to sugarcane N, Nitrogen derived from fertilizer Ndff(%) was calculated as follows (Equation 2):
Equation 2. Ndff % % % x 100
Estimated fertilizer N remains in the soil (FNS) was calculated as follows (Equation 3)
Equation 3. FNS % % x amount N applied
Fertilizer nitrogen yield (FNY) was measured as follows (Equation 4):
Equation 4. FNY kg ha N yield kg ha x Ndff % /100
Fertilizer nitrogen recovery (RE) of sugarcane from the applied nitrogenous fertilizer was calculated using the following formula (Equation 5):
Equation 5. RE % FNY/Rate of N Application x 100
Measuring Phosphorus and Pota ssium Fertilizer Use Efficiency
Nutrient use efficiency indices have a different interpretation value, thus fertilizer research should include measurements of several indices to understand the factors governing nutrient uptake and fertilizer efficiency, to compare short-term nutrient use efficiency in different environments, and to evaluate different management
strategies. In this study, P and K fertilizer nutrient use efficiencies were calculated based on differences in crop yield divided by the fertilizer rates (Good et al., 2004; Thorburn et al., 2017; Equation 6). This method is simple and cost-efficient, which makes it particularly suitable for on-farm research with long duration crop such as sugarcane.
Equation 6. PUE or KUE
Estimating Optimum Fertilizer Recommendations based on Mitscherlich’s
Crop Response Model
Selection of the most appropriate rate of fertilization is a major decision affecting the profitability of sugarcane production and the impact of agriculture on the environment. In this study, the modified Mitscherlich’s crop response model was used to identify the measurable crop response to nutrient addition. A detailed procedure and mathematical derivations of the model has been discussed by (Paningbatan and Llanto, 2004). Based on the established treatments, the model can effectively predict the inherent availability of soil nutrients N, P and K or P2O5 and K2O equivalents (Nikoli, Matsi, & Barbayiannis, 2016; J. Singh et al., 2016). The model was modified to incorporate actual nutrient recovery (nutrient efficiency function) of the crops obtained from isotope tracer and conventional plant tissue analyses. Moreover, the model can detect the coefficients of sugarcane yield response to nutrient availability expressed as the proportion of the maximally attainable production that has been realized by means of fertilizer additions, hence can generate optimal fertilizer recommendations. For the three major nutrients tested, N, P and K, this model can be expressed mathematically as follows (Equation 7):
Equation 7.
Y A 1 e ∗
Where Y is the yield or primary biological production at prevailing values of N, P, and K, expressed in (kg/ha), �� as the maximum attainable yield of the crop which variety and age specific, �� is the base of natural logarithm, �� represents the curvature of the response function or proportionality constant, �� is the inherent soil nutrient availability, �� is the added nutrients from fertilizer inputs, and u is the efficiency function of added nutrients from the fertilizer. For nitrogen experiments �� were based on the tracer data, while �� and �� were obtained through nutrient difference approach
and from available literatures. Added nutrients can either be expressed as elemental forms (N, P and K) or in an oxide basis as P2O5 or K2O.
Statistical analysis
Statistical analysis was performed in all obtained data using the SPSS software package (SPSS Inc., Chicago, IL, version 20.0). Sites and blocks were considered as random factors, and treatments as fixed variables. Data were subjected to analysis of variance (ANOVA). Subsequently, the significance of differences between the treatment means were determined by using the Tukey’s HSD test (P < 0.05). Furthermore, the correlative and regression analysis was performed to determine the behavior of the variables in response to the applied doses of the mineral fertilizers using the Curve Expert software (Microsoft Corporation, USA, version 1.34).
RESULTS AND DISCUSSION
Soil Analysis Data
Results showed that the soils used in the study had similar fertility characteristics and suitability in terms of sugarcane production (Table 3). Sites for N, P and K experiment had a sandy clay loam texture which may enhance diffusion of gases and movement water in the soil. The light texture of the soils in the site may have increased the losses of applied nutrients especially during high water infiltration on rainy seasons. The leaching of nutrients in these soils are also expected as it contained low to very low amount of organic matter (0.94% - 2.18%). Organic matter can act as cementing agent in particles to form stable aggregates and as a chelating agent for micronutrients (Rashid et al., 2016).
Soil pH values revealed the favorable conditions for nutrient availability especially for micronutrients in N and P sites. However, soils in K site showed a slightly acidic condition especially in points 3 and 4 (pH 4.67 -5.59). Acid soil condition could readily solubilize Al and Mn complexes to release Al and Mn ions, which accumulates and become toxic to plants (Shi & Zhu 2008) and inhibit microbial activity (Craswell & Pushparajah 1989). Generally, soils in the studied area showed low amount of available P which may limit soil productivity and crop production if not augmented by fertilizer application. Similarly, total N and exchangeable K in the soils were very low based on Landon (1991) soil fertility classifications. Though some researchers expressed doubt on the level of soil exchangeable K as a single value to formulate a sound basis for forecasting sugarcane K fertilizer requirements (Wood & Meyer, 1986; Hunsigi and and Srivastava, 1981). This uncertainty arises as some soils exhibit a greater response to applied K fertilizer than others even under similar climatic conditions and the same level of exchangeable K.
The low fertility of the soil in the area may have resulted from the continuous use of the area for sugarcane production together with the low inherent fertility characteristics of lahar-laden soils and less sustainable nutrient management practices.
Table 3. Selected initial soil physico-chemical characteristics of the sites.
Rainfall Data
In any field trials of agricultural production rainfall is of fundamental importance. Among the various individual climatic parameters which influence the growth characteristics of sugarcane in the Philippines the most important is considered to be amount of precipitation. Limitations in precipitation directly affects water availability which is frequently a restrictive factor in plant development (Dry & Loveys 1999). Water is essential for the maintenance of physiological and chemical processes within the plant, acting as an energy exchanger and carrier of nutrient food supply in solution (Roy et al., 2006).
Rainfall data were obtained from a Hobo automatic weather station installed in the experimental site and is presented in Figure 7. It can be observed that in the experimental location, dry season is from January to May and wet season is from June to December. In general, the driest condition was observed in the months February to April while the wettest conditions occurred in months of July and August. In the experimental area, this rainfall pattern gives an upper limit to the area’s sustainable agricultural potential with regards to biomass production if other factors (e.g. light, temperature, topography, soils) are not limiting. Thus, gathering monthly rainfall information serve as an important tool in describing the temporal water availability and potential need for irrigation of the area.
7. Monthly rainfall data (mm) in the study sites from 2015-2017.
Figure
Soil Moisture Profiles and Effective Rooting Depth
Soil moisture is the major component of the soil in relation to plant growth. If the moisture content of a soil is at the optimum levels, plants can readily absorb soil water. Soil moisture data from first year (2015-2016) to second year (2016-2017) cropping are shown in Figure 8-13. Data showed that the upper 60 cm was very dynamic and fluctuated easily with time. This may explain that the effective rooting depth (ERD) of sugarcane crops falls on this depth. ERD is the upper portion of the root zone where sugarcane plants get most of its water. Likewise, it can be considered that ERD is also the zone of active nutrient absorption by the roots. Additionally, considerable fluctuations occur at the upper 20 cm from the soil surface. Moisture fluctuations in near surface soils were observable in both first and second cropping and showed increased depletion of soil water in the surface soil. This may be due to the active water absorption of sugarcane roots wherein majority of the root volume is concentrated at this dept. Typically, around 50% of root biomass occurs in the top 20 cm of soil and 85% in the top 60 cm (Blackburn, 1984). In addition, soil water near the soil surface is actively withdrawn through evaporative loss caused by energy exchange from the surrounding atmosphere. Similar findings have been reported by Inman- Bamber et al., (2003) that moisture depletion occurred in soil at more shallow depths. For both cropping periods, soil water status below 80 cm is less dynamic and almost nonfluctuating, this is expected as the ERD is only at the upper 80 cm. Similar findings were also reported that most root biomass for sugarcane is found close to the surface and then declines approximately exponentially with depth (Smith et al., 2005).
In monitoring soil moisture and water availability, two limits are usually considered the field capacity (FC) and permanent wilting point (PWP). FC is the soil water content after the force of gravity has drained or removed all the water it can, usually 1 to 3 days after rainfall, while PWP is the soil water content of which healthy sugarcane plants can no longer extract water from the soil at a rate fast enough to recover from wilting. The permanent wilting point is considered the lower limit of plantavailable water.
In both cropping periods, generally conducive soil moisture levels were observed. However, at the early months during the second year plants did suffer nominal amount of moisture stress by which in certain periods soil water content level drops below the permanent wilting point.
Figure 8. Soil moisture profile during the first cropping (plant crop) 2015-2016 in Nitrogen experiment.
9. Soil
profile during the second cropping (first ratoon) 2016-2017 in Nitrogen experiment.
Figure
moisture
10. Soil moisture profile during the first cropping (plant crop) 2015-2016 in Phosphorus experiment.
Figure
11. Soil moisture profile during the second cropping (first ratoon) 2016-2017 in Phosphorus experiment.
Figure
Figure 12. Soil moisture profile during the first cropping (plant crop) 2015-2016 in Potassium experiment.
13. Soil moisture profile during the second cropping (first ratoon) 2016-2017 in Potassium experiment.
Figure
Leaf Chlorophyll Content
Chlorophyll content is an important indicator of plant health and nutrition. The chlorophyll meter also known as Soil Plant Analysis Development (SPAD) was used to reliably assess the chlorophyll content of the crops in all treatments. The response of different N fertilizer level on chlorophyll content of sugarcane was measured 7 months after fertilizer application and at harvest. Chlorophyll content in sugarcane varies with levels of fertilizer application. Generally, for both PC and RN sugarcane chlorophyll content in leaves increased with increasing N level on the seventh month after planting (7 MAP) (Table 4). For PC sugarcane, the plants applied with 240 and 300 kg N/ha significantly obtained the highest chlorophyll content as compared to other treatments. Contrastingly, for RN sugarcane, application of 60 to 300 kg N/ha did not show any significant difference in terms of chlorophyll content. Similar to PC sugarcane, control plants which did not receive N addition showed the lowest chlorophyll content. Similar observation was noted by other researchers, where the SPAD value increased with N application (Qudsieh et al., 2002); Huang et al. 2013; Peng et al. 2010). Some studies have shown that SPAD value varies with the amount of N applied (Yang et al., 2014); Maiti and Das, 2006); Scharf et al., 2006). However, for both PC and RN sugarcane, leaf chlorophyll content showed no significant differences among treatments during harvest period. The relatively similar values and declining chlorophyll content during maturity and harvest period could be attributed to nitrogen remobilization towards leaf senescence. Similar finding was also observed by Yang et al. (2014) where they observed the lowest values for SPA readings in old and senesced leaves.
Similar to N, the varying levels of P also showed some effects to chlorophyll content especially in PC sugarcane. Plants applied with 300 kg P/ha had significantly obtained highest chlorophyll content (Table 5). On the other hand, application of 60 kg P/ha showed the lowest chlorophyll content among the amended N plants. Hence, it can be somewhat deduced that availability of P can also affect sugarcane N uptake. Though this effect was not observed during the second cropping in RN sugarcane. Similar with N experiment, during the harvest period, leaf chlorophyll content showed no significant differences among P treatments in both PC and RN sugarcanes.
The application of different rates of potassium did significantly affect the chlorophyll content of the sugarcane (
Table 6). In PC sugarcane applied with 700 kg K2O/ha had the highest chlorophyll content but were comparable to plants applied with 300, 400, 500, and 600 kg K2O/ha. Plants applied with 100 and 200 kg K2O/ha were comparable, while control plants showed the lowest chlorophyll content. For the RN sugarcane, the trend in chlorophyll content was not the same. Plants applied with 600, 500, 200 kg K2O/ha had the highest chlorophyll content during the 7th month, followed by the control and 100 kg K2O/ha treatment. RN sugarcanes applied with 400 and 300 kg K2O/ha had the lowest chlorophyll content. Similar with N and P experiments, results in terms of chlorophyll content of sugarcane leaf during harvest period showed no significant differences.
Table 4. Chlorophyll content of sugarcane grown under varying Nitrogen levels during the 7th month.
Chlorophyll Reading (SU)
Treatment (kg N/ha)
Means with common letter(s) within the same column and treatment group are not significantly different at 5% level of significance based on Tukey’s HSD.
Table 5. Chlorophyll content of sugarcane grown under varying Phosphorus levels during the 7th month.
Chlorophyll Reading (SU)
Treatment (kg P2O5/ha)
Means with common letter(s) within the same column and treatment group are not significantly different at 5% level of significance based on Tukey’s HSD.
Table 6. Chlorophyll content of sugarcane grown under varying Potassium levels during the 7th month.
Means with common letter(s) within the same column and treatment group are not significantly different at 5% level of significance based on Tukey’s HSD.
Stalk Moisture Content
Moisture content is a critical aspect of sugarcane plants that is related to the quality and quantity of juice that can be extracted at harvest. Across all experiments and treatments (Figure 14-19), including the ratooned plants, sugarcane moisture content was not significantly different (p > 0.05). Moisture content rapidly increased during the first four months of the vegetative growth of sugarcane and it peaked during the fifth month at about 85%. After the succeeding months, sugarcane moisture content gradually and consistently decreased until the harvest stage to about 70-75%. These findings were consistent with a previous report (Qudsieh et al., 2001) which found a positive correlation between sugarcane juice yield and maturity stage for the first five months and a negative correlation for the succeeding months.
During the months (fourth to seventh months) wherein moisture content was highest, the total soluble solids or Brix content of sugarcane stabilizes (Qudsieh et al., 2001). It is also during this stage where other qualities such as acidity and chlorophyll content of sugarcane juice stabilizes (Qudsieh et al., 2002). During these months, a rapid increase in dewlap height of plant crops (Figure 20Figure 25) were also observed, and this could indicate a stage in sugarcane rapid vegetative growth where water availability is critical.
Based on the study by Lonsdale and Gosnell (1974), a 70-75% moisture content in sugarcane contains the highest concentration of sucrose. This indicates that harvesting sugarcane within the last two months of the cropping period could produce the highest sugar yield.
Plant Moisture (%)
N Expt (plant crop)
Actual Cubic R2 = 0.94
2nd3rd4th5th6th7th8th9th10th11th
Months
Figure 14. Monthly stalk moisture content of sugarcane in N experiment during the first cropping (PC).
N Expt (ratooned)
Actual Cubic R2 =0.85
2nd3rd4th5th6th7th8th9th10th11th
Figure 15. Monthly stalk moisture content of sugarcane in N experiment during the second cropping (RN).
Plant Moisture (%)
P Expt (plant crop)
Actual Cubic
R2 = 0.94
2nd3rd4th5th6th7th8th9th10th11th
Months
Figure 16. Monthly stalk moisture content of sugarcane in P experiment during the first cropping (PC).
P Expt (ratooned)
Plant Moisture (%) Months
Actual
Cubic
R2 =0.87
2nd3rd4th5th6th7th8th9th10th11th
Figure 17. Monthly stalk moisture content of sugarcane in P experiment during the second cropping (RN).
Plant Moisture (%)
K Expt (plant crop)
Actual
Cubic
R2 = 0.89
2nd3rd4th5th6th7th8th9th10th11th
Months
Figure 18. Monthly stalk moisture content of sugarcane in K experiment during the first cropping (PC).
K Expt (ratooned)
Plant Moisture (%)
Cubic
Actual R2 =0.80
2nd3rd4th5th6th7th8th9th10th11th
Months
Figure 19. Monthly stalk moisture content of sugarcane in K experiment during the second cropping (RN).
Millable Stalk and Stalk Diameter
The number of tillers (millable and non-millable) is well documented and accepted index for estimating the overall sugarcane yield at harvest. The application of different level of N and K fertilizers on sugarcane did not show any significant differences in the number of millable tillers (Table 7-12). On the other hand, application of P showed a significant increase in the number of millable stalks. This may be due to P limitations in the studied soil, hence significant crop response in terms of sugarcane tillering capacity was observed with the addition of P fertilizer.
At harvest, the application of different levels of N, P, and K did show significant differences in terms of sugarcane stalk diameter. Generally, sugarcane stalks are significantly thicker in plants applied with higher levels of N, P and Kfertilizer applications, while control plants showed the thinnest stalk diameter. The effect of increase stalk diameters (base, middle and top) is observed to be more pronounced in K experiments than in N and P. Varying the N application at RN sugarcane did not show significant differences in the measured stalk diameter. Contrariwise, in K experiment, the consistent increase in stalk diameter was found in the application of 300 - 700 kg K2O/ha. For amended plants in N and P experiments for both PC and RN sugarcane, the lowest stalk diameter was noted in treatment with 60 kg N and P/ha, while for K experiment it is within 100-300 kg K2O/ha. Generally, it was observed that increasing the level of fertilizer application also increases the plant stalk diameter. These findings of increased stalk diameter were all similar to the reported effect of N fertilization (Dechassa, 2014), P applications (Caione et al., 2015), and K applications (El-Tilib, 2004) in their sugarcane experiments.
Table 7. Yield and yield components data of plant crop sugarcane as affected by N levels.
Means with common letter(s) within the same column and treatment group are not significantly different at 5% level of significance based on Tukey’s HSD.
Table 8. Yield and yield components data of ratooned sugarcane as affected by N levels.
Table 9. Yield and yield components data of plant crop sugarcane as affected by P levels.
Means with common letter(s) within the same column and treatment group are not significantly different at 5% level of significance based on Tukey’s HSD.
Table 10. Yield and yield components data of ratooned sugarcane as affected by P2O5 levels.
Means with common letter(s) within the same column and treatment group are not significantly different at 5% level of significance based on Tukey’s HSD.
Table 11. Yield and yield components data of plant crop sugarcane as affected by K2O levels.
Means with common letter(s) within the same column and treatment group are not significantly different at 5% level of significance based on Tukey’s HSD.
Table 12. Yield and yield components data of plant crop sugarcane as affected by K2O levels.
Means with common letter(s) within the same column and treatment group are not significantly different at 5% level of significance based on Tukey’s HSD.
Tonnage
Cane tonnage varied across N, P, and K experiments and cropping years (Table 7-12). Highest sugarcane tonnage during the first cropping (207.43 tons/ha) was observed in plants applied with 700 kg K2O/ha coupled with 200 kg N and P2O5/ha but is comparable in plants applied with 600 kg K2O/ha. In contrast, the lowest observed cane tonnage (141.58 tons/ha) was observed in control plants at P experiment. Specifically, for the N experiment, high tonnage was obtained with the application of 120, 180, 240, and 300 kg K2O/ha. This indicates that the application of 120 kg N/ha is the least amount of nitrogen necessary to achieve optimal sugarcane yield. This effect of N of enhanced tonnage with N application, however, was not observable during the second cropping where no differences among treatments were observed. This finding implies that ratooned sugarcane behaves differently from the plant crop sugarcane in terms of nutrient requirement and utilization pattern. This finding is very important in considering management change between plant crop and ratooned sugarcanes.
The varying application of P fertilizer showed significant differences in sugarcane yield. Application of 300 kg P/ha resulted in significantly higher yield compared to other treatments and was only comparable with plants applied with 240 kg P2O5/ha. Moreover, the application of 240 kg P2O5/ha down to control plants showed no significant differences. This results can simply be interpreted that the sufficiency level for optimum sugarcane yield can be achieved at the application of around 240 kg P2O5/ha. Similar to N, the trend was not observed during the second cropping. This further implies that ratooned sugarcane requires different nutrient management practices including timing of fertilization for maximum fertilizer-use efficiency.
Different level of K fertilizer resulted in significantly different in sugarcane yields. The application of 600 and 700 kg K2O/ha to sugarcane resulted in the highest obtained yield. However, the yield obtained with the application of 600 kg K2O/ha was not significantly different with that of 400 and 500 K2O/ha. Applying 100 to 300 kg K2O/ha to sugarcane showed an increase in sugarcane yield but were not statistically different over that of the control plants (Table 7).
Generally, for all experiments, PC sugarcane obtained higher tonnage (~35% more) compared to RN sugarcane. The lowered production for both cane tonnage and sugar yields in RN sugarcane can be attributed to the increased crop age, being a second stubble sugarcane or ratooned (Lofton et al., 2012). Johnson and Richard (2005) have shown that sugarcane yield typically decreased with increasing age. In addition, the lowered cane tonnage for RN sugarcane could be attributed to a high lodging rate due to winds associated with high rainfall events during the onset of rapid vegetative growth as can be seen in the rainfall data (Figure 7). This high lodging rate can contribute to low harvest efficiency.
Sugar Content and Sugar yield
Lkg/TC (50 kg sugar per ton cane) is the measure of the relative productivity status of sugarcane in terms of sugar produced per stalk tonnage. In general, there were no observed significant differences in terms of Lkg/TC for all experiments except during the second cropping (RN) in P experiment (Table 7-12). Although P addition resulted in significantly different sugar yield, the is no observable trend with regards to treatments (i.e. control plants obtained higher values than plants applied with 60 kg P2O5/ha). On the average, for N experiment, sugar content is 1.89 Lkg/TC, for P experiment is 1.97 Lkg/TC while for K experiment is 1.86 Lkg/TC.
The ultimate goal of sugarcane production is to increase sugar yield per unit area, hence, the use of this parameter as basis for crop response and fertilizer recommendation is imperative. Generally, for all experiments, Lkg/ha (50 kg sugar per hectare) increased significantly with the application of fertilizers and the effects were more pronounced in PC than RN sugarcane. During the first cropping, the application of 300 kg N/ha obtained the highest sugar yield, however it was not statistically different with the plant applied with 60 – 240 kgN/ha. Likewise, in P experiment the addition of 300 kg P2O5/ha obtained the highest sugar yield. However, these were not significantly different with 180 and 240 kg P2O5/ha. For both N and K experiments, sugar yields showed no significant differences among treatments during the second cropping (RN). Furthermore, in K experiment, the highest sugar yield was obtained in plants applied with 700 kg K2O/ha but is comparable with the plants applied with 600 kg K2O/ha. Moreover, the addition of 600 kg K2O/ha did not significantly differ with the application of 400 and 500 kg K2O/ha, and that both are comparable with 300 down to control plots.
However, during the second cropping (RN), the application of 100 kg K2O/ha obtained similar sugar yield with applications of 200-600 kg K2O/ha and control plants obtained the lowest yield.
Results of the study showed that increasing the level of nutrient application increases also the sugar yield but at diminishing rate. The trend suitably follows the law of the minimum which is associated with the linear response and plateau production functions, also called von Liebig models (Hennessy, 2009; Boyer et al., 2015). In accordance with this function, sugar production grows linearly until the fertilizer reaches a critical dose and, after this point, yield remains constant maintaining a plateau. Thus, to attain the most profitable sugarcane production finding the critical dose of sugarcane plant sufficiency threshold for the nutrient (N, P and K) is very crucial. Likewise, results have shown the optimal amount of the three major nutrients N, P and K to achieve the maximum sugar yield for both PC and RN sugarcane.
In the analysis of sugar yield from the entire experiments, it is observable that sugar yield levels did not differ among treatments during second cropping (RN) with average values of about ~35% less than during the first cropping (PC). This result corroborates with the finding of Malik (1997) that around 35% of the sugar productivity is lost due to ratooning. In many cases, the productivity of ratoon is 10-30% less than the plant crop of sugarcane (Bashir et al., 2012). Low yield of ratoon crop is mainly due the low and differential ratooning potential of cultivars and suboptimal crop management. Moreover, the yield decline from the plant crop to successive ratoon harvests has been attributed to reduced growth and vigor of the ratoon crop root system which was said to become increasingly superficial with increasing numbers of ratoons and increased soil penetration resistance (Ohashi et al., 2015; Otto et al.,2011; BallCoelho et al., 1992). It has also been stated that after the first sugar cane harvest the original root system quickly becomes non-functional and dies (Singh, 2018), while others suggest that roots remain functional for longer periods of time (Bacchi, 1983). Though sugar yields remained on the profitable levels, the considerable reduction in yield necessitates changes in management from plant crop to ratoon. Apparently, ratoon sugarcane needs much higher attention and care in the present scenario to boost its overall productivity.
Growth Performance
In plant crop (PC) and ratooned (RN) sugarcanes, the applications of different levels of N, P, and K fertilizers showed no significant effect in terms of crop’s height based on the last dewlap measurements (Figure 20-25). Differences in growth performance is very noticeable between the PC and RN sugarcane. RN sugarcane are relatively taller than PCs. During the first cropping, in all three experiments (N, P and K) it was noticed that around 27th week the sugarcane almost reached its maximum height and it’s started to plateau until reaching maturity on the 42nd week. Contrariwise, during the second cropping, sugarcane growth was continuous until ripening stage and follows a logistic trend during the early stage and more of curvilinear trend towards middle stage to maturity. For both the first and second cropping, while differences in plant height were not significant, plants in control plots were consistently shortest in all three experiments.
Sugarcane cane growth and biomass accumulation were observed to have major three phases excluding the germination phase (Figure 26-31). The growth accumulation could be easily fitted and characterized following the sigmoid logistic model and have been extensively used to model sugarcane growth (Molijn et al., 2018; Bajpai et al., 2012; dos Santos Simões et al., 2005; Simões et al., 2005; Coale, 1993; Mcmartin, 1979). The first or the initial phase can be considered as the lag-phase in which the plant follows a slow growth and is still in the establishment stage where roots and shoots start to grow. The lag-phase occurs from the start of germination to around 100 days after germination. The slow growth of the plants on this phase is also noticeable in terms of biomass accumulation. In this phase, the biomass of the growing sugarcane only represents around 15% - 20% relative to biomass at maturity. The second phase or the linear growth occurs around 90-200 days after germination. The linear growth of the sugarcane height on this phase is due to the establishment of several fully functional photosynthetic leaves from the growing tillers. The massive accumulation of photosynthates from active leaves and rapid tillering likely explain the resulting linear increase in biomass which could account to around 60% - 70% of the biomass at maturity. The third phase is stationary-phase where there is reduced growth, biomass accumulation on the final phase could represent around 15% - 20% of the biomass at maturity. As observed, both PC and RN sugarcanes followed the three major phases of growth, however, it was more pronounced in PC than in RN sugarcane. The lag-phase
in RN sugarcane was shorter; the linear-phase was longer; and the final reduced growth phase was also shorter. This slowdown in growth is commonly referred to as the reduced growth phenomenon (RGP). In certain instances, this phenomenon appears to be related to the timing of crop initiation and harvesting period (Van Heerden et al., 2010). The differences in the growth pattern and durations of the growth phases may imply different strategies for nutrient management. Growing periods are synonymous to nutrient uptake and physiological utilizations. Mariano et al. (2016) and Leite et al. (2016) have observed the same growth patterns in their sugarcane experiments and have used a similar model for fitting the seasonal plant growth, biomass and nutrient content in plants as influenced by fertilizer levels. These noticeable patterns of PC and RN sugarcane growths have deduced a practical series of managements for both water and nutrient to increase the biomass yields and utilization efficiencies of the crop. Park et al. (2005) reported that in order to increase sugarcane biomass yield it would be necessary to increase inputs (water, fertilizer, etc.) or ensure better use of available resources by the crop. To warrant increase in resource use efficiency, the alternative management should include the proper timing of fertilizer application and irrigation scheduling to support the critical establishment period or the lag-phase, enhancement of availability of nutrients by fertilizer splitting and provide sufficient soil moisture during the rapid vegetative growth, and limiting the amount of moisture to trigger ripening of the stalks and increase sugar accumulation towards maturity stage.
N expt (plant crop)
Control
60 kg/ha
120 kg/ha
180 kg/ha
240 kg/ha
300 kg/ha
Weeks after planting
Figure 20. Biweekly sugarcane dewlap height at N experiment during first cropping (PC).
N expt (ratooned)
0 kg/ha
60 kg/ha
120 kg/ha
180 kg/ha
240 kg/ha
300 kg/ha
Weeks after planting
Figure 21. Biweekly sugarcane dewlap height at N experiment during second cropping (RN).
P Expt (plant crop)
0 kg/ha
60 kg/ha
120 kg/ha
180 kg/ha
240 kg/ha
300 kg/ha
Weeks after planting
Figure 22. Biweekly sugarcane dewlap height at P experiment during first cropping (PC).
P expt (ratooned)
0 kg/ha
60 kg/ha
120 kg/ha
180 kg/ha
240 kg/ha
300 kg/ha
Figure 23. Biweekly sugarcane dewlap height at P experiment during second cropping (RN).
K Expt (plant crop)
0kg/ha
100kg/ha
200kg/ha
300kg/ha
400kg/ha
500kg/ha
600kg/ha
700kg/ha
Weeks after planting
Figure 24. Biweekly sugarcane dewlap height at K experiment during first cropping (PC).
K expt (ratooned)
0 kg/ha
100 kg/ha
200 kg/ha
300 kg/ha
400 kg/ha
500 kg/ha
600 kg/ha
700 kg/ha
Weeks after planting
Figure 25. Biweekly sugarcane dewlap height at K experiment during second cropping (RN).
N Expt (plant crop)
Above‐ground biomass (g)
Actual
Logistic
R2 = 0.99285
2nd3rd4th5th6th7th8th9th10th11th
Months
Figure 26. Monthly above-ground biomass accumulation during the first cropping (PC) in N experiment.
N Expt (ratooned)
Above ground biomass (g)
Logistics
Actual R2 = 0.88
1st2nd3rd4th5th6th7th8th9th10th11th12th
Months
Figure 27. Monthly above-ground biomass accumulation during the second cropping (RN) in N experiment.
P Expt (plant crop)
Above‐ground biomass (g)
Actual
Logistic R2 = 0.99211
2nd3rd4th5th6th7th8th9th10th11th
Months
Figure 28. Monthly above-ground biomass accumulation during the first cropping (PC) in P experiment.
P Expt (ratooned)
Above ground biomass (g)
Logistic Actual R2 = 0.99
1st2nd3rd4th5th6th7th8th9th10th11th12th
Months
Figure 29. Monthly above-ground biomass accumulation during the second cropping (RN) in N experiment.
K Expt (plant crop)
Above‐ground biomass (g)
Actual
Logistic R2 = 0.9746
2nd3rd4th5th6th7th8th9th10th11th
Months
Figure 30. Monthly above-ground biomass accumulation during the first cropping (PC) in K experiment.
K Expt (ratooned)
Above ground biomass (g)
Logistics
Actual R2 = 0.98
1st2nd3rd4th5th6th7th8th9th10th11th12th
Months
Figure 31. Monthly above-ground biomass accumulation during the second cropping (RN) in K experiment.
Nutrient Accumulation Dynamics
Nutrient concentrations in the above ground parts of the sugarcane were also monitored monthly and are presented in Figure 32-35. Measurements of plant tissue concentrations is essential in assessing soil fertility and nutrient availability (Binkley and Vitousek 1991). Nutrient concentrations have been previously found to be responsive to fertilizer applications (Thorburn et al., 2017; Muchow et al., 1996; Wood et al., 1996). However, at maturity stage of the crop, in all treatments similar nutrient concentrations were observed. This lack of correlation between cane nutrient concentrations and fertilizer treatments likely reflects the minimal treatments effects on yields differences at all experiments. In general, the nutrient concentrations of sugarcane were observed to decrease with age. In PC sugarcane the N concentration in the early stage of growth ranges from 1.2-1.4%, while on the linear phase the N content ranges from 0.6-0.8% and decline further to 0.2-0.3% at maturity stage. Similar findings are also observable to both P and K concentration in the above ground parts. P concentrations in the initial phase ranges from 0.16-0.25% and 0.05-0.10% at maturity. For K content, values were 1.8-2.7% during the initial phase and 0.35-0.50% at maturity. These trends of declining concentration are due to the leaching of K from leaf tissues, losses of structurally bound P due to detrashing of leaves and N losses through foliar emissions of ammonia during the senescence phase (Epstein and Bloom, 2005; Park and Inman-Bamber, 2005; Farquhar et al., 1980). These findings are very similar to the reported declines of nutrient content in plants with advancing maturity resulting in a decrease in protein levels and an associated increase in the amount of complex structural carbohydrates such cellulose and lignin (Thorburn, et al., 2011; Flyman and Afolayan, 2007). The continuous plant uptake of minerals from the soil can trigger mineral depletion in the effective rooting soil volume which may limit the uptake, hence also heightened the decline of nutrient content with plant age. Marles (2017) also reported that the decline of nutrient content in plant with age is due to the dilution effect of mineral concentrations with plant biomass accumulations. Simply, the increased of carbohydrate and or sugar in the above ground parts is not accompanied by proportional increases in minerals hence, a “dilution effect”. Furthermore, a decline in nutrient content, inhibition of photosynthesis due to the potential initiation of sugar-mediated source–sink feedback, and increased rates of maintenance respiration that occur during
sugarcane development and maturation appear to be likely factors contributing to the decline in nutrient uptake and growth.
Total stalk N (%)
Stalk N Content (N Expt)
Actual Logistic R2 = 0.9812
2nd3rd4th5th6th7th8th9th10th11th12th
Month
Stalk N Content (P Expt)
Actual Logistic R2 = 0.9956
Total stalk N (%)
2nd3rd4th5th6th7th8th9th10th11th12th
Month
Stalk N Content (K Expt)
Actual Logistic R2 = 0.9839
2nd3rd4th5th6th7th8th9th10th11th12th
Months
Figure 32. Monthly nitrogen content of sugarcane stalk during the first cropping (PC).
Nitrogen Expt
Phosphorus (%) Months
Actual Logistic R2 = 0.98281
2nd3rd4th5th6th7th8th9th10th11th12th
Phosphorus Expt
Phosphorus (%) Months
2nd3rd4th5th6th7th8th9th10th11th12th
Potassium Expt
Phosphorus (%) Months
Actual Logistic R2 = 0.94787 0.00 0.05
Actual Logistic R2 = 0.90576
2nd3rd4th5th6th7th8th9th10th11th12th
Figure 33. Monthly phosphorus content of sugarcane stalk during the first cropping (PC).
Potassium content (%)
Nitrogen Expt
Actual Logistic
Potassium content (%)
2nd3rd4th5th6th7th8th9th10th11th12th
Months
Phosphorus Expt
Actual Logistic
Potassium content (%)
2nd3rd4th5th6th7th8th9th10th11th12th
Months
Potassium Expt
Actual Logistic
2nd3rd4th5th6th7th8th9th10th11th12th
Months
Figure 34. Monthly potassium content of sugarcane stalk during the first cropping (PC).
S = 0.22285327 r = 0.93312889 Months
S = 0.27362765 r = 0.91362440
S = 0.15410736 r = 0.78634002
35. Monthly total nitrogen (A), total phosphorus (B), and total K (C) of sugarcane stalk during the second cropping (RN).
Figure
The total nutrient uptake in PC and RN sugarcane varies with age though both have more or less similar total amount utilized at maturity stage (Figure 36-41). Similar with plant height and biomass, nutrient accumulation in the above ground parts starts with a lag-phase followed by a linear phase or rapid nutrient accumulations and declines towards maturity. Previous reports indicate the same trend in nutrient uptake especially those of macronutrients (e.g. N, P and K) and biomass accumulation and growth, with three phases present during the cropping cycle for both PC and RN sugarcane (Machado et al., 1982; Gava et al., 2001; Franco et al., 2011; Oliveira, 2011; Mariano, 2016).
Previous studies showed that in the first phase (lag phase), sugarcane grows slowly after sprouting from the cut cane or stubble, since root system needs to be established and new tillers are produced (Inman-Bamber et al., 2002; Allison et al., 2007; Oliveira, 2011). Moreover, for the second phase (linear phase), plant growth and nutrient content changes rapidly in concurrence with maximum tillering and active photosynthetic activities induced by favorable weather conditions. Thus it is imperative to correctly established the location-specific planting calendar so that the rapid vegetative growth of the sugarcane falls between the transition of rainy to dry season having high ambient temperatures, solar radiation, and soil moisture from irrigation and or precipitation (Allison et al., 2007; van Heerden et al., 2010). The third phase (stationary phase) is characterized by slower plant growth and nutrient content rates. The latter occurs in association to the increase in sucrose production and storage in the stalks as result of cane maturity (van Heerden et al., 2010; Cardozo and Sentelhas, 2013). The decrease in nutrient accumulation from fertilizer on the later periods can be related to immobilization of fertilizer nutrients in the soil system, making part of the fertilizer unavailable to the plants. Meier et al. (2006) also reported similar findings for sugarcane cultivated under tropical conditions in Australia. Clearly, based on the gathered data on sugarcane growth performance and nutrient accumulations patterns, it is desirable to design a specific nutrient management for both plant crop (PC) and ratooned (RN) sugarcane to increase fertilizer use efficiencies and overall productivity.
Comparing the N accumulation trend, PC N uptake presented a continuous increase in accumulation from 2nd month up to 7th month period and plateaued before slightly declining towards maturity. In contrary, RN N accumulation only increased rapidly starting from the 4th month and reached its maximum on the 11th month after which it starts to plateau (Figure 36Figure 37). The latter can be explained as a result of
remobilization of highly mobile N from the stubble left from previous cropping including the previously well-established root system and rhizomes. Likewise, the increase of N accumulation in above ground biomass from the initial to linear phase could be related to sugarcane root system development (Otto et al., 2009). The root system development in this period may have favored the uptake of available N from both fertilizer and soil.
K uptake follows similar pattern with N except that plateauing occurred earlier (5th month for PC and 10th month for RN). It is also noticeable that RN sugarcane accumulates more N and K compared to PC sugarcanes. Contrastingly for P, PC sugarcane showed a continuous P uptake from the 2nd month up to the 11th month while for RN sugarcane P accumulation rate reduced on the 7th month and maintained the level towards maturity stage. This trend can be due to the less availability of N, P and K in the soil for plant uptake during the first cropping period (2015) brought by the relatively low precipitation compared to the second cropping (2016) wherein conducive precipitation events were well distributed throughout the rapid vegetative growth stage (Figure 7. Monthly rainfall data (mm) in the study sites from 2015-2017.).
N Expt (plant crop)
Nitrogen Expt
Phosphorus Expt
Potassium Expt
Modeled N
Modeled P
Modeled K
Nitrogen uptake (kg/ha) Months
2nd3rd4th5th6th7th8th9th10th11th12th
36. Nitrogen accumulation dynamics in plant crop sugarcane.
N Expt (ratooned)
Nitrogen Expt
Phosphorus Expt
Potassium Expt
Modeled N
Modeled P
Modeled K
Nitrogen uptake (kg/ha) Months
2nd3rd4th5th6th7th8th9th10th11th12th
37. Nitrogen accumulation dynamics in ratooned sugarcane
Figure
Figure
Phosphorus uptake (kg/ha)
P Expt (plant crop)
Nitrogen Expt
Phosphorus Expt
Potassium Expt
Modeled N
Modeled P
Modeled K
Phosphorus uptake (kg/ha)
2nd3rd4th5th6th7th8th9th10th11th12th
Months
38. Phosphorus accumulation dynamics in plant crop sugarcane.
P Expt (ratooned)
Nitrogen Expt
Phosphorus Expt
Potassium Expt
Modeled N
Modeled P
Modeled K
2nd3rd4th5th6th7th8th9th10th11th12th
Months
39. Phosphorus accumulation dynamics in ratooned sugarcane.
Figure
Figure
Potassium uptake (kg/ha)
K Expt (plant crop)
Nitrogen Expt
Phosphorus Expt
Potassium Expt
Modeled N
Modeled P
Modeled K
Potassium uptake (kg/ha)
2nd3rd4th5th6th7th8th9th10th11th12th
Months
40. Potassium accumulation dynamics in plant crop sugarcane.
K Expt (ratooned)
Nitrogen Expt
Phosphorus Expt
Potassium Expt
Modeled N
Modeled P
Modeled K
2nd3rd4th5th6th7th8th9th10th11th12th
Months
41. Potassium accumulation dynamics in ratooned sugarcane.
Figure
Figure
Nutrient Use Efficiency (NutUE)
Nutrient use efficiency (NutUE) is an important indicator of nutrient uptake and utilization, and thus warrants a lot of research attention (Foulkes et al., 2009; Oliveira et al., 2013; Jawad et al., 2017; Rajesh et al., 2017; Zhang C. et al., 2017). NutUE implies not only the maximum uptake of the applied nutrient by the crop but also the availability of the applied nutrient under variable climatic and edaphic conditions. Environmental aspects such as pollution resulting from the fertilizer application are also considered (Zapata and Hera 1995).
Calculated NutUEs of the all three experiments (N, P and K) are presented in Figure 42Figure 43. It is observable that there is a wide range of NutUE of sugarcane crops under various treatments with values of 0.68 t/kg N – to 2.69 t/kg N, 0.61 t/kg –2.55 t/kg P2O5, and 0.57 t/kg – 3.07 t/kg K2O during the first cropping (PC). The PC sugarcane NutUEs were considerably higher compared to the NutUEs (0.44 t/kg N – to 2.13 t/kg N, 0.34 t/kg – 1.25 t/kg P2O5, and 0.15 t/kg – 1.10 t/kg K2O) obtained during the second cropping (RN). Furthermore, there was a trend for NutUE to increase with increasing yield. These NutUEs values are much higher than the reported ranges between 0.25 t/ha- 0.9 t/ha worldwide (Ladha et al., 2005). This variation of NutUE from PC to RN have been reported as a result from the numerous interactions between climate (Thorburn et al., 2017), rooting system development and crop age (Marles, 2017). For both PC and RN sugarcanes, higher NutUEs were observed in lower dose of fertilizer application. That is, the lower the amount of nutrient applied the higher is the efficiency of utilization. Thorburn et al (2003) reported that high NutUE values (i.e. >2 t/kg nutrient applied) dominantly occurred in plant crops applied with low amount of nutrient.
On the first cropping, among the three nutrients (N, P and K) studied, application of 100 kg K2O/ha showed the highest yield response per kilogram nutrient applied, followed by the application of 60 kg N/ha and 60 kg P2O5/ha. Results of regression analysis indicated a negative exponential relationship with levels fertilizer dose, which indicates that fertilizer utilization efficiency rapidly decreases with increasing rate of nutrient application. Barbieri et al (2008), also reported that as the nutrient rates increase towards an optimum, productivity continues to increase but at a decreasing rate, and nutrient use efficiency typically declines. The extent of the decline is determined by
source of nutrient, time of application, and placement, other cultural practices, as well as soil and climatic conditions (Fixen et al., 2015).
Although there were higher NutUes observed in treatments with less amount of nutrient applications, yield levels were significantly lower compared to sugarcanes applied with higher doses of nutrients. Thus, in order to maximize NutUEs without compromising the yields the needed nutrients must be applied in the key fertilizer requirement periods that is during initial phase and in rapid vegetative growth or linear phase. Likewise, increasing the number of fertilization (split application methods) to enhance the availability of fertilizers to better match the crop demand. In addition, the use of remote sensing technologies can improve sugarcane NutUE (Bell et al., 2014).
In the present study, the NutUE differences among treatments supplied with different doses of fertilizers (urea, solophos and muriate of potash) were analyzed to identify the optimal levels of fertilizer application with considerable crop response in terms of sugarcane tonnage. Particularly, in this experiment for both cropping seasons, the NutUEs were modeled following the exponential allometric model obtaining a very high coefficient of determinations (R2>0.99) (Figure 42Figure 43). These fitted models were then use to evaluate the response and identify the inflection point where nonsignificant crop response was observed, hence NutUEs plateaued. Based on NutUEs data, it can be delineated that the optimal amount of N and P2O5 application is around 180 kg/ha – 200 kg/ha, while for K2O is around 200 kg/ha. Conversely, for the RN sugarcane, the optimal amount of N and P2O5 application is around 120 – 150 kg/ha, while for K2O is only around 250 kg/ha.
One of the main goals of the study is to minimize the amount of fertilizer application while maintaining the yield, which should result in a better input–output ratio and higher NutUEs. Based on our results, an increment on the level of fertilizer application can increase the tonnage yield, while too much fertilizer applications resulted to the decrement of the NutUEs. Thus, in order to reduce the detrimental effects to environmental, one of the anticipated solution is to reduce the application amount of fertilizers during cultivation. This is evidently possible as shown in the results. In order to obtain good nutrient–yield ratio, farmers may reduce the use of fertilizers following the above recommended amounts.
Nutrient Use Efficiency (t/kg nutrient)
Fit NUE (R2=0.998)
95% Confidence Band of NUE
Fit PUE (R2=0.998)
95% Confidence Band of PUE
Fit KUE (R2=0.996)
95% Confidence Band of KUE
0100200300400500600700
Amount of nutrient applied (kg/ha)
Figure 42. Nutrient-use efficiencies (NUE, PUE and KUE) of plant crop.
Nutrient Use Efficiency (t/kg nutrient)
NUE PUE KUE
Fit NUE (R2=0.99)
95% Confidence Band of NUE
Fit PUE (R2=0.99)
95% Confidence Band of PUE
Fit KUE (R2=0.99)
95% Confidence Band of KUE
0100200300400500600700
Amount of nutrient applied (kg/ha)
Figure 43. Nutrient-use efficiencies (NUE, PUE and KUE) of ratooned sugarcane.
Nitrogen Use Efficiency based on 15 N Tracer Techniques
The conventional calculation method of nitrogen use efficiency (NUE) used above does not consider the background effect of inherent soil available N, hence may be not so suitable. To eliminate the assumption of equal soil N availability among various treatments, 15N labelled fertilizer was used in the experiment. Stable isotope of nitrogen (15N) have been used successfully in some studies to directly quantify the fertilizer N recovery and or nitrogen use efficiency (Fortes et al., 2013; Ambrosano et al., 2011; Basanta et al., 2003).
In PC sugarcane, approximately on the 6th month after the N fertilization (March 2014), Ndff (%) reached the highest values in all 15N treated plots, while in RN sugarcanes, the highest Ndffs were attained earlier during the 5th month (Table 13Table 14). It is observable that this increase in Ndffs is concurrent with the linear increase of plant nitrogen uptake. In other words, the N in the above ground biomass during the PC and RN continued increasing within time up to the 6th and 5th month, respectively. In contrast to the increasing Ndffs during the first semester for both PC and RN sugarcanes, the Ndffs were declining rapidly and reduced further during the maturity stage. This trend was found to be accompanied with the slowdown in sugarcane growth. This appears to be related to the timing of crop maturation and sucrose formation towards harvesting period (Van Heerden et al., 2010). Similarly, the decline of Ndffs may be attributed to the remobilization of nutrients from the above ground to the roots and rhizomes, which is a plant mechanism to produce a nutritional reserve and guarantees a greater vigor of the subsequent regrowth. Feller and Fischer (1994) have found out that that during the senescence of the leaves, the proteins of the chloroplasts are degraded, and fractions of N may be translocated via phloem to other parts of the plants, such as roots and rhizomes. This result shows that, in the initial stages of crop development, a substantial part of total N in the plants was derived from fertilizer. It can also be seen that the contribution of sources other (e.g. soil organic matter miniralization, irrigation and rainfall N and biological nitrogen fixation) than labeled N-fertilizer added to the crop is considerable.
At harvest, in both PC and RN sugarcane, the amount of N in plants from fertilizer represented a small fraction of total N in the above ground biomass (~35% in PC and ~17% in RN). These Ndffs at harvest results can be misleading and will undervalue the importance of N fertilization in plant cane nutrition. In many studies that
have used 15N on the evaluation of fertilizer application to sugarcane, the NDFF was assessed only in the harvest period. Thus, a considerable loss of information regarding the effects of N fertilizer for sugarcane plant nutrition were not considered.
In the experiments, PC and RN sugarcane appear to have similar trend on Ndffs with age. The differences in values imply that the practice of fertilizing the ratooned sugarcane following the same methodologies and timing with PC sugarcane is not an efficient practice in terms of plant N uptake. This result requires attention on the current strategies for N fertilization and management (i.e. amount or timing of application) to increase the crop use efficiency of the added resource.
Nitrogen use efficiency or plant recovery is a quantitative measure of the actual uptake of fertilizer nutrient by the plant in relation to the amount of nutrient added to the soil. A common form of expression of NUE is % utilization of the added fertilizer. Plant recoveries or NUE using the tracer techniques of both PC and RN sugarcanes are presented in Figure 44Figure 45. In both cropping periods, NUE were very low (<20%) from the first quarter of the season and peaks on the second-third quarter (40% - 85% for PC and 20 - 60% for RN) followed by a continuous decline towards harvest period (<50% for PC and <40% for RN). Similar to Ndffs, the observed increase of NUE from the 2nd month towards the 7th month occurred during the rapid vegetative growth (maximum tillering stage) of sugarcane. This NUEs are very similar in some previously conducted studies in sugarcane using tracer methodologies in Brazil (Martinelli and Filoso, 2008; Franco et al. 2011; Vieira-Megda et al. 2015). These results are higher than the 20 to 30% of recovered N reported by Vallis and Keating (1994). In some previous research, the reported recovery of fertilizer N by sugarcane generally ranges between 21% and 40% (Chang and Weng, 1983; Sampaio et al., 1984; Gava et al., 2005; Franco et al., 2011). The declining NUE throughout the crop cycle can be attributed to N immobilization and environmental losses such as leaching and volatilization. The findings of Martinelli and Filoso (2008) have shown that large losses of N from sugarcane fields occur not only because of the relatively low NUE, but also via ammonia volatilization due to the high evapotranspiration rates of sugarcane, which is characteristic of C4 plants. Additionally, N can be lost through volatilization from soils ranging from 30–40% of the fertilizer applied (IPCC, 1997).
Overall, this finding indicated that other sources of N in the soil (i.e., soil organic matter mineralization, irrigation and rainfall N and biological nitrogen fixation) are very
important to the N nutrition of the sugarcane entire crop cycle. As such, these sources must be considered in N management systems where increasing yield and NUE is the ultimate goal.
Table 13. Monthly nitrogen derived from fertilizer (Ndff) measured using N-15 tracer techniques during the first cropping (PC).
Means with common letter(s) within the same column and treatment group are not significantly different at 5% level of significance based on Tukey’s HSD.
Table 14. Monthly nitrogen derived from fertilizer (Ndff) measured using N-15 tracer techniques during the second cropping (RN).
Means with common letter(s) within the same column and treatment group are not significantly different at 5% level of significance based on Tukey’s HSD.
Fertilizer Nitrogen Recovery (%)
60 kg N/ha
120 kg N/ha 180 kg N/ha
kg N/ha
kg N/ha
First Cropping (NP)
2nd3rd4th5th6th7th8th9th10th11th12th
44. Monthly fertilizer nitrogen recovery of sugarcane during the first cropping (PC).
Fertilizer N Recovery (%)
60 kg N/ha
120 kg N/ha
180 kg N/ha
240 kg N/ha
300 kg N/ha
Second Cropping (RN)
3rd4th5th6th7th8th9th10th11th12th
45. Monthly fertilizer nitrogen recovery of sugarcane during the second cropping (RN).
Figure
Figure
Estimating Soil Inherent Nutrie nt Availability following Mitsch erlich’s Crop Response Model
A good history of yield data from previous cropping should be able to characterize those soils for which fertilization will result in a return on investment (i.e., improvement/enhancement in yield and/or quality). Likewise, soil test must be able to identify those soils with sufficient inherent nutrients for which fertilization is not required (Hochmuth et al., 2014). In order to provide a truthful prediction of the fertilizer requirements for those soils deemed likely to respond with nutrient addition, yield trials coupled with crop response modeling are necessary to determined actual soil nutrient availability. Mathematical models can offer valuable information and data to generate specific recommendations. Appropriate fertilizer recommendations can help farmers maximize profits with production sustainability.
The yield characteristics of PC and RN sugarcanes as affected by the consolidated amount of nutrients (indigenous soil nutrient supply plus fertilizers) are were modeled and presented in Figure 46Figure 51. In both plant crop and ratoon, the model predicts that the nutrient input requirements of the whole field increase with greater requirement at higher targeted yield levels. Despite the potential limitations of the assumptions in the model, evaluation on the yield data reveals that equivalent soil indigenous nutrients are way higher than expected based on the initial soil testing results. In PC and RN sugarcane, availability of indigenous nutrients was on the same ranges, for N it is around 60 - 68 kg N/ha, 53-60 kg/ha for P2O5 and approximately 7590 kg/ha K2O. Conversely, in both observed and modeled data, it is noticeable that sugarcane tend to generate considerable amount of tonnage even without the additional nutrient inputs from fertilizers. This result clearly shows that the soil in the study contain substantial amount of plant nutrients which may came from the residuals of previous croppings. Previous studies using tracer methods have shown that around 20% to 40 % of the applied N to sugarcane remained in the soil (Gava et al., 2005; Oliveira et al., 2000). Overall, due to the relative availability of indigenous nutrients the crop did not show significant yield response to the added nutrients from fertilizers. Likewise, since P efficiency is very low (10% to 20%), which is much less than that of the other nutrients such as N and K, unutilized P gradually accumulates in soils and is slowly released and becomes available to successive crops (Cho, 1997). Therefore, the application of P fertilizer to ratoon crops should be based on the residual P content of the soil for
economic crop production and to sustain the yield and quality. Similarly, Korndorfer et al. (2018) reported an increase in overall available residual potassium with time which they considered as an essential source in sugarcane K nutrition especially in succeeding ratoons.
46. Yield response of plant crop at different levels of N.
47. Yield response of ratoon at different levels of N.
Figure
Figure
48. Yield response of plant crop at different levels of P2O5.
49. Yield response of ratoon at different levels of P2O5
Figure
Figure
50. Yield response of plant crop at different levels of K2O.
51. Yield response of ratoon at different levels of K2O.
Figure
Figure
SUMMARY AND CONCLUSIONS
Sugarcane is one of the country’s most extensively grown crops next to rice and corn. Moreover, the country needs to increase its sugarcane production to meet the everincreasing demand for sugar despite having limitation of arable land. Nutrient management offers great promise in meeting the growing nutrient demands of intensive sugarcane agriculture while keeping productivity at higher levels. It helps provide a sound basis for nutrient recommendations to meet the crop demands without compromising environmental sustainability. However, the gradual decline of soil fertility brought about by mismanagement of plant nutrients and deteriorating soil physical environment have made this task more difficult. In order to provide sciencebased mitigation of the abovementioned problem, this study has been implemented to increase the crop nutrients utilization efficiency, minimize loss of soil nutrients and reduce fertilizer application in sugarcane production through nutrient management using elemental tracer and related techniques. Specifically, the study determined the nutrient-use efficiency (NUE) of sugarcane under different fertilization schemes through the use of elemental tracer technique and yield response method; elucidated and delineated the nutrient utilization dynamics (NUD) of sugarcane as enhanced by stable isotope tracer and related techniques; and evaluated sugarcane yield response to nutrient addition and refined fertilizer recommendations.
Approximately 1.5 ha of land were cleared from weeds and residues from previous sugarcane croppings. Sugarcane variety Phil99-1793 was planted on 3 March 2014 for the first year and ratooned on 25 March 2016 for the second year. The experiments were laid out following the Randomized Complete Block Design (RCBD) with four replications. Rainfall and soil moisture data were monitored daily from the onset of germination to maturity using the installed automatic weather station (Hobo, Australia) and digital 10HS soil moisture profiler (Decagon, USA). Plant tissue nutrient monitoring was undertaken at monthly interval. Similarly, monthly morphological monitoring was also conducted evaluating the changes in plant height (biweekly), stalk weight and stalk moisture content (monthly). Harvesting was done 12 months after planting when the brix reading and sugar content were within the optimal range. Yield and yields components data were collected and were analyzed statistically for the analysis of variance. Subsequently, the significance of differences between the treatment means were determined by using the Tukey’s HSD test (P < 0.05).
Rainfall data obtained revealed that the dry season is from January to May and wet season is from June to December. In general, the driest condition was observed in the months February to April while the wettest conditions occurred in months of July and August. Moreover, the study through its soil moisture monitoring data showed that the most rapid fluctuations in terms of moisture content is within the upper 100 cm which can be classified as the effective rooting depth (ERD) of sugarcane crops. This clearly indicates that fertilizer application should not be applied deeper than this zone. Results on chlorophyll measurement using SPAD revealed content variations with levels of fertilizer application. For both PC and RN sugarcane chlorophyll content in leaves increases with increasing N level on the seventh month after planting and declines towards maturity. Likewise, the varying levels of P and K also showed some effects to chlorophyll content especially in PC sugarcane.
Analysis of plant juice content showed that it rapidly increased during the first four months of the vegetative growth and it peaked during the fifth month at about 85%. The moisture content gradually and consistently decreased until the harvest stage to about 70-75% regardless of treatments. The application of different level of N and K fertilizers on sugarcane did not show significant differences in the number of millable stalks. In contrast, the application of P showed a significant increase in the number of millable stalks which might be due to the P limitations in the studied soil, hence a substantial response in terms of sugarcane tillering capacity was observed. Sugarcane stalks were significantly thicker in plants applied with higher levels of N, P and K fertilizers, while control plants showed the thinnest stalk diameter. The effect of increase stalk diameters (base, middle, and top) is observed to be more pronounced in K experiments than in N and P.
Sugarcane tonnage were not affected by applications of N. Thus, the results can be deduced that the soil in the studied area were able to provide the least amount of N necessary to achieve optimal sugarcane yield. Highest sugarcane tonnage was observed in plants applied with 600-700 kg K2O/ha. Application of 300 kg P/ha resulted in significantly higher yield compared to other treatments but were comparable with plants applied with 240 kg P2O5/ha. This result implies that the sufficiency level for optimum sugarcane yield in the area can be achieved at the application of around 240 kg P2O5/ha. Generally, for all experiments, plant crop (PC) sugarcane obtained higher tonnage (~35% more) compared to ratooned (RN) sugarcane.
Sugar content (Lkg/TC) were not affected for all experiments except during the second cropping (RN) in P experiment. Though there was a significant effect of P addition, there was no observable trend with regards to treatments (i.e. control plants obtained higher values than plants applied with 60 kg P2O5/ha). In general, for all experiments, Lkg/ha (50 kg sugar per hectare) increased significantly with the application of fertilizers, and PC consistently obtained higher yield than in RN sugarcane. In the analysis of sugar yield from the entire study, it is observable that sugar yield levels did not differ among treatments during second cropping (RN), with average values of about ~35% less than during the first cropping (PC). Though sugar yields remained on the profitable levels, the considerable reduction in yield necessitates changes in management from plant crop to ratoon. Apparently, ratoon sugarcane needs better management to boost its overall productivity. Results of the study showed that increasing the level of nutrient application also increases sugar yield but at a slowed rate.
Differences in growth performance is very noticeable between the PC and RN sugarcane. RN sugarcane are relatively taller than PCs. During the first cropping, in all three experiments (N, P, and K) it was noticed that around the 27th week the sugarcane almost reached its maximum height and it started to plateau towards maturity on the 42nd week. Sugarcane growth and biomass accumulation were observed to have major three phases, excluding the germination phase. These are the lag phase (slow growth), which accounts about 15-20% of the biomass; the linear phase (rapid growth), which accounts 60-70% of the biomass; and the stationary phase (reduced growth), which also accounts 15-20% of the biomass relative to total biomass at maturity. The differences in the growth patterns and durations of the growth phases implies different strategies to be implemented for nutrient management. It can be deduced from the noticeable patterns of PC and RN sugarcane growths that a practical series of managements for both water and nutrient must be done to increase the biomass yields and nutrient utilization efficiencies of the crop. The alternative management should include the proper timing of fertilizer application and irrigation scheduling to support the critical establishment period or the lag-phase; enhancement of availability of nutrients by fertilizer splitting and provide sufficient soil moisture during the rapid vegetative growth; and limiting the amount of moisture to trigger ripening of the stalks and increase sugar accumulation towards maturity stage.
Nutrient concentrations (N, P, and K) in the above ground parts of the sugarcane were also monitored and were observed to have decreased with age. Similar with plant height and biomass, nutrient accumulation in the above ground parts starts with a lagphase, followed by a linear phase or rapid nutrient accumulations, and then declines towards maturity. Thus it is imperative to correctly establish the location-specific planting calendar so that the rapid vegetative growth of the sugarcane falls between the transition of rainy to dry season having high ambient temperatures, solar radiation, and soil moisture from irrigation and/or precipitation. Clearly, based on the gathered data on sugarcane growth performance and nutrient accumulations patterns, it is desirable to design a specific nutrient management for both plant crop (PC) and ratooned (RN) sugarcane to increase fertilizer use efficiencies and overall productivity. N and K showed remobilization trend towards maturity of the sugarcane while P was continuously taken up by the crop especially during the first cropping period. Thus, applications of these nutrients should be guided accordingly with the crop demands based on its nutrient utilization dynamics.
Nutrient use efficiency (NutUE) were considerably higher in PC compared to the second cropping (RN). Furthermore, there was a trend for NutUE to increase with increasing yield. For both PC and RN sugarcanes, higher NutUEs were observed in lower dose of fertilizer application, that is the lower the amount of nutrient applied the higher is the efficiency of utilization. Thus, in order to maximize NutUEs without compromising the yields, the needed nutrients must be applied in the key fertilizer requirement periods, which are during initial phase and in rapid vegetative growth. Likewise, increasing the number of fertilization (split application methods) should be implemented to enhance the availability of fertilizers to better match the crop demand. Based on NutUEs data, it can be delineated that the optimal amount of N and P2O5 application is around 180 kg/ha – 200 kg/ha, while for K2O is around 200 kg/ha. Conversely, for the RN sugarcane, the optimal amount of N and P2O5 application is around 120 – 150 kg/ha, while for K2O is only around 250 kg/ha.
Following 15N tracer techniques, N derived from fertilizer (Ndff %) increased during the first semester for both PC and RN sugarcanes, while it declined rapidly and reduced further during the maturity stage. In addition, the tracer data showed that more than half of N in the plant came from the indigenous soil N especially during initial
phase and towards crop maturity Results indicated high losses of applied N to the environment especially on the application of higher doses. It can also be seen that the contribution of sources other (e.g. soil organic matter mineralization, irrigation and rainfall N and biological nitrogen fixation) than labeled N-fertilizer added to the crop is considerable. The decline of Ndffs may be attributed to remobilization of N from the above ground to the roots and rhizomes.
In both cropping periods, NUE were very low from the first quarter of the season and peaks on the second to the third quarter, followed by a continuous decline towards harvest. This finding indicated that other sources of N in the soil are very important to the N nutrition of the sugarcane entire crop cycle. As such, these sources must be considered in N management systems where increasing yield and NUE is a central goal. The findings of this study further indicate that the very short residence time of applied nitrogenous fertilizer (< 3 months), especially during wet season when it can be easily lost from the soil, making it unavailable to plants. Therefore, greater care regarding fertilization, such as careful evaluation of the time, forms, rate, and method of application, are necessary to optimize the effects of fertilizer application on soil fertility and crop yields.
Sugarcane response function with regards to N, P, and K fertilizations were determined and were predicted using the Mitscherlich’s crop response model. In both croppings, the model has shown that a considerable amount of inherent soil nutrients can be found in the studied soils opposing the initial soil analyses results. Thus, an improvement in the fertility classification criteria is necessary to update the fertilizer recommendations especially for long duration crops like sugarcane. This is needed to avoid unbalanced nutrient supply and improve recommendations according to the soil indigenous nutrients and plant demand for both economic and environmental benefits. Furthermore, the Mitscherlich model was used to estimate the best amount of fertilizers based on the efficiency functions. Overall, the study has clearly shown that there is an avenue to improve the current nutrient management by considering the crop nutrient utilization dynamics through the proper matching of nutrient supply with crop demands and proper timing of fertilizer application. Analytical tools coupled with the use of crop response models described here can play an important role in developing sustainable nutrient management policies, especially under a scenario of further intensification of sugarcane production, without compromising environmental sustainability.
RECOMMENDATIONS
The results of this study have clearly shown that there is a wide avenue to improve the nutrient management in sugarcane production without compromising yield, profitability, and environmental sustainability. Additionally, the study has provided insights and understanding especially on nutrient management decisions for efficient and productive resource utilization in boosting sugarcane agriculture. However, with the inherent limitations on the scope, duration, design, and area covered during the implementation and field trials, some of the study claims and generalizations may need to be validated further for recurrence and reproducibility of the results in other sugarcane fields in the country. Here we identified some recommendations to solidify and strengthen our claims.
1. The initial soil analyses results based on standard laboratory test were classified to be under low fertility soil. However, our results showed that sugarcane planted in the area were able to produce considerable yield for both plant crop and ratoon. Thus, it is highly recommended that a more intensive soil test calibration procedure should be done in many sugarcane fields in the country using high throughput techniques like non-destructive testing, remote sensing and geospatial analysis and techniques to correlate soil test with yield. This is very important as sugarcane is a plantation crop and planted in a vast of lands throughout the country.
2. Many sugarcane field in the country are practicing several ratooning cycles (up to 5 - 7 times) before replacing the stubbles with new plant crop. However, the study was only able to examined and assessed the yield response, nutrient utilization dynamics and nutrient use efficiency up to the first ratoon. Therefore, it is highly recommended to have similar study to continue or focuse on the succeeding 2nd to 6th ratoon cycles. In this way, we can outline the overall series of management and cultural practices that are necessary to rejuvenate and maintain crop productivity with age.
3. One way of increasing the nutrient use efficiency is varietal selection. However, our study was focused only to one variety (Phil99-1793). Thus it is suggested to have a study on varietal testing for nutrient use efficiencies using direct quantification techniques such as isotope tracer methodologies.
4. And while the current study findings and results offer tremendous potential on developing the best nutrient management for sugarcane production, the suggested management recommendation is only limited to some extent on areas having more or less similar edaphic and climatic conditions. Thus, it is essential that similar undertaking be conducted in various location especially to major sugarcane producing regions in the Visayas and Mindanao.
LITERATURE CITED
Abebe, Z., & Feyisa, H. (2017). Effects of nitrogen rates and time of application on yield of maize: rainfall variability influenced time of N application. Hindawi.Com, 2017, 1–10. Retrieved from https://www.hindawi.com/journals /ija/2017/1545280/abs/
Accoe, F., Boeckx, P., Busschaert, J., Hofman, G., and Van Cleemput, O. (2004). Gross N transformation rates and net N mineralization rates related to the C and N contents of soil organic matter fractions in grassland soils of different age. Soil Biology and Biochemistry, 36: 2075-2087.
Allison, J. C. S., Pammenter, N. W., & Haslam, R. J. (2007). Why does sugarcane (Saccharum sp. hybrid) grow slowly? South African Journal of Botany. https://doi.org/10.1016/j.sajb.2007.04.065
Altoveros, Nestor C. & Borromeo, T. H. (2007). The state of the plant genetic resources for food and agriculture of the Philippines. A Contry Report, (1997–2006), 1–72.
Ambrosano, E. J., Trivelin, P. C. O., Cantarella, H., Ambrosano, G. M. B., Schammass, E. A., Muraoka, T., & Rossi, F. (2011). 15N-labeled nitrogen from green manure and ammonium sulfate utilization by the sugarcane ratoon. Scientia Agricola, 68(3), 361–368. https://doi.org/10.1590/s0103-90162011000300014
Ambrosano, E.A., P.C.O. Trivelin, H. Cantarella, G.M.B. Ambro- sano, E.A. Schammas, N. Guirado, F. Rossi, P.C.D. Mendes, and T. Muraoka. (2005). Utilization of nitrogen from green manure and mineral fertilizer by sugarcane. Scientia Agri- cola (Piracicaba, Brazil) 62:534–542. doi:10.1590/S010390162005000600004
Ang, P. A. (2012). Philippines Dairy and Products Annual Situation and Outlook.
Anon (2001) Sugarcane production handbook. LSU AgCenter, Louisiana State University (http://www.agctr.lsu.edu/NR/ rdonlyres/807E6478-E556-44A88440-16A2CC4BFD4C/ 3272/pub2859sugarcane4.PDF)
Arnon, I. (1972). Fertilizer use in dry regions. Crop Production in dry Regions: Background and Principles; Leonard Hill: London; Vol. 1.
Bacchi, O. O. S. (1983). BotSnitca da cana-de-agucar. In Nutri~ao e aduba~ao da canade-aqticar no Brasil. Ed. J F Orlando. pp 25-37. IAA/Planalsucar, Piracicaba.
Bajpai, P. K., Priya, K., & Malik, M. (2012). Selection of Appropriate Growth Model for Prediction of Sugarcane Area, Production and Productivity of India. Sugar Tech. https://doi.org/10.1007/s12355-012-0142-4
Baligar, V. C., R. R. Duncan, and N. K. Fageria. (1990). Soil-plant interaction on nutrient use efficiency in plants: An overview. pp 351–373. In: V C Baligar and
R R Duncan (eds.),Crops as Enhancers of Nutrient Use. Academic Press, San Diego, CA.
Ball-Coelho, B., Sampaio, E. V. S. B., Tiessen, H., & Stewart, J. W. B. (1992). Root dynamics in plant and ratoon crops of sugar cane. Plant and Soil, 142(2), 297–305. https://doi.org/10.1007/BF00010975
Barbieri, P. A., Sainz Rozas, H. R., Covacevich, F., & Echeverría, H. E. (2014). Phosphorus placement effects on phosphorous recovery efficiency and grain yield of wheat under No-tillage in the humid pampas of argentina. International Journal of Agronomy, 2014. https://doi.org/10.1155/2014/507105
Bashir, S., Fiaz, N., Ghaffar, A., & Khalid, F. (2012). Ratooning ability of Sugarcane genotypes at different harvesting dates. International Sugar Journal, 114(1360), 273–276.
Beaudoin N, Saad JK, Van Laethem C, Machet JM, Maucorps J, Mary B (2005) Nitrate leaching in intensive agriculture in Northern France: Effect of farming practices, soils and crop rotations. Agric Ecosyst Environ 111:292–310
Bell, M.J., Moody, P., (2014). Fertilizer N use in the sugarcane industry −an overview and future opportunities. In: Bell, M.J. (Ed.), A Review of Nitrogen Use Efficiency in Sugarcane. SRA Research Report. Sugar Research Australia, Brisbane, pp. 305–320.
Bengtsson, G., Bengtson, P., and Mansson, K.F. (2003). Gross nitrogen mineralization, immobilization, and nitrification rates as a function of soil C/N ratio and microbial activity. Soil Biology and Biochemistry, 35: 143-154.
Binkley, D. and P. Vitousek. (1991). Soil nutrient availability. In: R.W. Pearcy, et al. (Eds.) Plant physiological ecology. Chapman and Hall, London.
Blackburn, F. (1984) Sugar-Cane. Longman, London.
Bokhtiar, B. S. M., & Sakurai, K. (2003). Sugarcane Response to Soil Phosphorus, 17(1), 20–22.
Bomans E., Fransen K., G., A., Mertens J., M. P., & Vandendriessche H., V. N. (2005). Addressing phosphoru s related problems in farm practice. Soil Science of Belgium, 32(0).
Bouwman, A. F., Boumans, L. J. M., & Batjes, N. H. (2002). Emissions of N 2 O and NO from fertilized fields: Summary of available measurement data. Global Biogeochemical Cycles. https://doi.org/10.1029/2001gb001811
Boyer, C. N., Brorsen, B. W., & Tumusiime, E. (2015). Modeling skewness with the linear stochastic plateau model to determine optimal nitrogen rates. Agricultural Economics (Czech Republic). https://doi.org/10.1111/agec.12121
Bramley RGV, Roth CH (2002) Land-use effects on water quality in an intensively managed catchment in the Australian humid tropics. Marine Freshw Res 53:931–940
Bray. R., H and Kurtz, L. T. (1945). Determination of Total Organic and Available Forms of Phosphorus in Soils. Soil Sci. 59, 39-54.
Brodie J, Binney J, Fabricius K, Gordon I, Hoegh-Guldberg O, Hunter H, O’Reagain P, Pearson R, Quirk M, Thorburn P, Waterhouse J, Webster I, Wilkinson S (2008) Synthesis of evidence to support the Scientific Consensus Statement on Water Quality in the Great Barrier Reef. The State of Queensland (Department of the Premier and Cabinet), Reef Water Quality Protection Plan Secretariat, Brisbane, p84
Brown, J. R., Blankinship, J. C., Niboyet, A., van Groenigen, K. J., Dijkstra, P., Le Roux, X., … Hungate, B. A. (2012). Effects of multiple global change treatments on soil N 2O fluxes. Biogeochemistry. https://doi.org/10.1007/s10533-011-96552
Bruulsema, T. W., Fixen, E., & Snyder, C. S. (2004). Fertilizer Nutrient Recovery in Sustainable Cropping Systems. Better Crops with Plant Food, 88(4), 15–17.
Burger, M. and Jackson, L.E. (2003). Microbial immobilization of ammonium and nitrate in relation to ammonification and nitrification rates in organic and conventional cropping systems. Soil Biology and Biochemistry, 35: 29-36.
Caione, G., De Mello Prado, R., Campos, C. N. S., Rosatto Moda, L., De Lima Vasconcelos, R., & Pizauro Júnior, J. M. (2015). Response of sugarcane in a Red Ultisol to phosphorus rates, phosphorus sources, and filter cake. Scientific World Journal. https://doi.org/10.1155/2015/405970
Cantarella, H. (2007). Nitrogen. In ‘‘Soil Fertility’’ (R. F. Novais, V. H. Alvarez, N. F. Barros, R. L. F. Fontes, R. B. Cantarutti, and J. C. L. Neves, Eds.), pp. 375–470. Brazilian Soil Science Society, Vic¸osa, MG.
Cardozo, N. P., & Sentelhas, P. C. (2013). Climatic effects on sugarcane ripening under the infl uence of cultivars and crop age. Scientia Agricola. https://doi.org/10.1590/S0103-90162013000600011
Cassman, K.G., A. Dobermann and D.T. Walters. (2002). Agroecosystems, nitrogen use efficiency, and nitrogen management. Ambio. 31: 132-140.
Chang, S.C. (1966). Soil Analysis in Application to Soil Fertility. Bureau of Soils, Diliman, Quezon City, Philippines. 131 pp.
Chang, Y., Weng, T., (1983). Use of 15N to study the efficacy of nitrogen for sugarcane; nitrogen recovery on spring planting cane. Taiwan Sugar 50, 161–164.
Cheesman OD (2004) The environmental impacts of sugar production. CABI Publishing, Wallingford
Cho, N. (1997). Phosphorus Nutrition of Sugarcane Growth , Yield and Quality of Ratoon Cane as Affected by Residual Soil Phosphorus cane growth is generally by The plot spacings . Cultural practices harvest of plant cane ) were collected from 0 coefficient was determined, 41(3), 177–186.
Choi W. J., H. M. Ro and Chang, S. X. (2004). Recovery of fertilizer-derived inorganic15N in a vegetable field soil as affected by application of an organic amendment. Plant and Soil 263:191-201.
Ciampitti, I.A., J.J. Camberato, S.T. Murrell, and T.J. Vyn. (2013). Maize nutrient accumulation and partitioning in response to plant density and nitrogen rate: I. Macronutrients. Agron. J. 105:783–795. doi:10.2134/agronj2012.0467
Coale, F. J., Sanchez, C. A., Izuno, F. T., & Bottcher, A. B. (1993). Nutrient Accumulation and Removal by Sugarcane Grown on Everglades Histosols. Agronomy Journal. https://doi.org/10.2134/agronj1993.00021962008500020 028x
Coulter, B., Daly, K., Kurz, I., Coxon, C., Jeffrey, D., Mills, P., Kelly, G., & Morgan, G. (2000). Quantification of phosphorus loss from soil to water. Water.
CRASWELL, E.T. and E. PUSHPARAJAH (eds). (1989). Management of Acid Soils in the Tropics of Asia. Australian Centre for International Agricultural Research. G.P.O. Box 15511, Canberra.
Crutzen PJ, Mosier AR, Smith KA, Winiwarter W (2008) N2O release from agrobiofuel production negates global warming reduction by replacing fossil fuels. Atmos Chem Phys 8:389–395
Daly, K., Jeffrey, D., & Tunney, H. (2006). The effect of soil type on phosphorus sorption capacity and desorption dynamics in Irish grassland soils. Soil Use and Management, 17(1), 12–20. https://doi.org/10.1111/j.1475-2743.2001.tb00003.x
de Almeida, H. J., Cruz, F. J. R., Pancelli, M. A., Flores, R. A., Vasconcelos, R. de L., & Prado, R. de M. (2015). Decreased potassium fertilization in sugarcane ratoons grown under straw in different soils. Australian Journal of Crop Science, 9(7), 596–604.
Delgadillo-Vargas, O., Garcia-Ruiz, R., & Forero-Álvarez, J. (2016). Fertilising techniques and nutrient balances in the agriculture industrialization transition: The case of sugarcane in the Cauca river valley (Colombia), 1943-2010. Agriculture, Ecosystems and Environment, 218, 150–162. https://doi.org/10.1016/j.agee.2015.11.003
Derby NE, Casey XM, Knighton RM (2009) Long-term observa- tions ofvadose zone and groundwater nitrate concentrations under irrigated agriculture. Vadose Zone J 8:290–300
Dercon,G., Diels, J., Aihou, K., Chinwo, K., Nziguheba, G., Clymans, E., Unogwu, J., Merckx, R. and J. Deckers. (2005). Can 13C isotopic discrimination become the basis for a tool to quantify the dynamics of water stress in maize under field conditions? In: Combating Soil Degradation to Enhance Food Security in Africa: The Role of Nuclear Techniques in Developing Improved Soil, Water and Nutrient Management Practices. Synopses of technical papers. Nairobi, Kenya. pp. 19-20.
Dobermann, A. (2005). Nitrogen use efficiency—State of the art. In “Proceedings of the International Workshop on Enhanced-Efficiency Fertilizers”, Frankfurt, Germany. International Fertilizer Industry Association, Paris (CD-ROM).
dos Santos Simões, M., Rocha, J. V., & Lamparelli, R. A. C. (2005). Indicadores de crescimento e produtividade da cana-de-açúcar. Scientia Agricola, 62(1), 23–30. https://doi.org/10.1590/S0103-90162005000100005
Dry PR, Loveys BR (1999) Grapevine shoot growth and stomatal conductance are reduced when part of the root system is dried. Vitis 38:151–156
Eickhout, B., Bouwman, A. F., & van Zeijts, H. (2006). The role of nitrogen in world food production and environmental sustainability. Agriculture, Ecosystems and Environment. https://doi.org/10.1016/j.agee.2006.03.009
El-Kholy, M.A., El-Ashry, S. and Gomaa, A..M. (2005). Biofertilization of Maize Crop and its Impact on Yield and Grains Nutrient Content under Low Rates of Mineral Fertilizers. Journal of Applied Sciences Research 1(2): 117-121
El-Tilib, M. A., Elnasikh, M. H., & Elamin, E. A. (2004). Phosphorus and potassium fertilization effects on growth attributes and yield of two sugarcane varieties grown on three soil series. Journal of Plant Nutrition, 27(4), 663–699. https://doi.org/10.1081/PLN-120030375
Epstein, E., and A.J. Bloom, editors. (2005). Mineral nutrition of plants: Principles and perspectives. 2nd ed. Sinauer Associates, Inc. Publ., Sunderland, Massachusetts.
Everingham YL, Inman-Bamber NG, Thorburn PJ, McNeill TJ (2007) A bayesian modelling approach for improving long lead sugarcane yield forecasts. Aust J Agric Res 58:87–94
Fan, X., Li, F., Liu, F., and Kumar, D. (2004). Fertilization with a new type of coated urea: Evaluation for nitrogen efficiency and yield in winter wheat. J. Plant Nutr. 27, 853–865.
Feller, U., Fischer, A., (1994). Nitrogen-metabolism in senescing leaves. Crit. Rev. Plant Sci., Boca Raton 13, 241–273.
Fixen, P., Brenturp, F., Bruulsema, T. W., Garcia, F., Norton, R., & Zingore, S. (2015). Nutrient/ Fertilizer Use Efficiency: Measurment, Current Situation and Trends. Managing Water and Fertilizer for Sustainable Agricultural Intensification, (January), 8–38.
Flyman, M. V., & Afolayan, A. J. (2007). Effect of maturity on the mineral content of hairy vetch (Vicia villosa). Tropical and Subtropical Agroecosystems, 7(1), 53–58.
Food and Agriculture Organization of the United Nations. (2008). Current world fertilizer trends and outlook to 2011/12. Viale delle Terme di Caracalla, 00153 Rome, Italy. 57 pp.
Fortes, C., P.C.O. Trivelin, A.C. Vitti, D.A. Ferreira, H.C.J. Franco, and R. Otto. (2011). Recovery of nitrogen (15N) by sug- arcane from previous crop residues and urea fertilisation under a minimum tillage system. Sugar Tech 13:42–46. doi:10.1007/ s12355-011-0074-4
Fortes, C., Vitti, A. C., Otto, R., Ferreira, D. A., Franco, H. C. J., & Trivelin, P. C. O. (2013). Contribution of nitrogen from sugarcane harvest residues and urea for crop nutrition. Scientia Agricola, 70(5), 313–320. https://doi.org/10.1590/S010390162013000500005
Foulkes, M. J., Hawkesford, M. J., Barraclough, P. B., Holdsworth, M. J., Kerr, S., Kightley, S., & Shewry, P. R. (2009). Identifying traits to improve the nitrogen economy of wheat: Recent advances and future prospects. Field Crops Research. https://doi.org/10.1016/j.fcr.2009.09.005
Franco, H.C.J., R. Otto, C.E. Faroni, A.C. Vitti, and E.C.A. Oliveira. (2011). Nitrogen in sugarcane derived from fertilizer under Brazilian field conditions. Field Crops Res. 121:29–41. doi:10.1016/j.fcr.2010.11.011
Gao, N., Liu, Y., Wu, H., Zhang, P., Yu, N., Zhang, Y., … Zhang, Y. (2017). Interactive effects of irrigation and nitrogen fertilizer on yield, nitrogen uptake, and recovery of two successive Chinese cabbage crops as assessed using15N isotope. Scientia Horticulturae, 215, 117–125. https://doi.org/10.1016/j.scienta.2016.12.011
Gava, G.J.C.; Trivelin, P.C.O.; Vitti, A.C.; Oliveira, M.W. (2005). Urea and sugarcane straw nitrogen balance in a soil-sugarcane crop system. Pesquisa Agropecuária Brasileira 40: 689-695.
Gellings, W.C. and Parmenter, K.E. (2010). Energy Efficiency in Fertilizer Production and Use. Efficient Use Conservation of Energy. Vol. 2. 5pp.
Good, A. G., Shrawat, A. K., & Muench, D. G. (2004). Can less yield more? Is reducing nutrient input into the environment compatible with maintaining crop production? Trends in Plant Science. https://doi.org/10.1016/j.tplants.2004.10.008
Gremaud G. and Hilkert A. (2008). Isotopic-spectroscopic technique: stable isotope ratio mass spectrometry (IRMS). In D-W. Sun (Ed.), Modern Techniques for Food Authentication (pp. 269-320). Amsterdam: Elsevier Inc.
Grieu, P., Lucero, D.W., Ardiani, R., Ehleringer, J.R. (2001). The mean depth of soil water uptake by two temperate grassland species over time subjected to mild soil water deficit and competitive association. Plant Soil 230:197-209.
Griffin, T. S. (2007). Estimates of Gross Transformation Rates of Dairy Manure N Using 15N Pool Dilution. Communications in Soil Science and Plant Analysis, 38: 1451-1465.
Groenigen, J.W. van; Oenema, O.; Groenigen, K.J. van; Velthof, G.L.; Kessel, C. van. (2011). Best Nitrogen Management Practices to Decrease Greenhouse Gas Emissions. Better crops with plant food 95 (2011) 2. P. 16 – 17.
Hartemink, A. E. (2005). Plantation agriculture in the tropics: Environmental issues. Outlook on Agriculture, 34(1), 11–21. https://doi.org/10.5367/00000000532 95150
Hartemink, A.E., (2008). Sugarcane for bioethanol: soil and environmental issues. Adv. Agric. 99, 125–182.
Hennessy, D. A. (2009). Crop yield skewness under law of the minimum technology. American Journal of Agricultural Economics. https://doi.org/10.1111/j.14678276.2008.01181.x
Hera, C. (1995). Contribution of nuclear techniques to the assessment of nutrient availability for crops. In: FAO Fertilizer and Plant Nutrition Bulletin No 12. Integrated plant nutrition systems. Rome, Italy: 307-331.
Hochmuth, George, Rao Mylavarapu, and Ed Hanlon. (2014). Fertilizer Recommendation Philosophies. Gainesville: University of Florida Institute of Food and Agricultural Sciences.
Huang, J., Zhang, P.-J., Zhang, J., Lu, Y.-B., Huang, F., & Li, M.-J. (2013). Chlorophyll Content and Chlorophyll Fluorescence in Tomato Leaves Infested With an Invasive Mealybug, Phenacoccus solenopsis (Hemiptera: Pseudococcidae). Environmental Entomology, 42(5), 973–979. https://doi.org/10.1603/EN12342
Hunsigi, G and Srivastava, SC (1981). Some measures of potassium availability to sugarcane. Fertilizer News 26,6: 35-38.
Inman-Bamber, N.G., Baillie, C., Willcox, J., Attard, S., Spillman, M.F., (2003). Increased profitability and water use efficiency through best use of limited water under supplementary irrigation in sugarcane. Final Report for Rural Water Use Efficiency Initiative, Queensland Department of Natural Resources and Mines. CSIRO Sustainable Ecosystems, Townsville, 12 pp.
International Atomic Energy Agency (IAEA). (2001). Use of Isotope and Radiation Methods in Soil and Water Management and Crop Nutrition. Training Course Manual Series No. 14. Vienna, Austria. 247 pp.
International Atomic Energy Agency (IAEA). (2002). Neutron and Gamma Probes: Their Use in Agronomy. Training Course Manual Series No. 16. Vienna, Austria. 75 pp.
IPCC, (1997). Intergovernmental Panel on Climate Change/Organization for Economic Cooperation and Development. IPCC Guidelines for National Greenhouse Gas Inventories. OECD/ODCE, París.
IPNI. (1999). Functions of Phosphorus in Plants. Better Crops, 83(1), 6–7.
Janssen BH, de Willinen P (2006) Ideal and saturated soil fertility as bench marks in nutrient management 1. Outline of the framework. Agric Ecosyst Environ 116:132–146
Jawad, M. S., Syed, A. H. B., Zeng, J. B., Quan, X. Y., Essa, A., Noor, M., et al. (2017). Nitrogen (N) metabolism related enzyme activities, cell ultrastructure and nutrient contents as affected by N level and barley genotype. J. Integr. Agr. 16, 190–198. doi: 10.1016/S2095-3119(15)61308-9
Johnson PA, Shepherd MA, Hatley DJ, Smith PN (2002) Nitrate leaching from a shallow limestone soil growing a five course combinable crop rotation: the effects of crop husbandry and nitrogen fertilizer rate on losses from the second complete rotation. Soil Use Manag 18:68–76
Johnson, R. M., & Richard, E. P. (2005). Sugarcane yield, sugarcane quality, and soil variability in Louisiana. Agronomy Journal. https://doi.org/10.2134/agronj 2004.0184
Jones, C. and Jacobsen J. (2001). Plant Nutrition and Fertility. Nutrient Management No.2. Montana State Univ., USA. 12pp.
Korndorfer, G. H., Pereira, H. S., Duarte, I. N., Pinto, L. R. N., & Fonseca, L. F. da. (2018). Sugarcane cultivation with source potassium low water-soluble. Acta Scientiarum. Agronomy, 40(1), 36399. https://doi.org/10.4025/actasciagron. v40i1.36399
Kostka, G., Polzin, C., & Scharrer, J. (2009). The future of sugar cane in China and India - Supply constraints and expansion potential. Applied Energy. https://doi.org/10.1016/j.apenergy.2009.05.005
Ladha, J.K., Pathak, H., Krupnik, T.J.J., Six, J., van Kessel, C., (2005). Efficiency of fertil- izer nitrogen in cereal production: retrospects and prospects. Adv. Agron. 87, 85–156.
Landell, M. G. de A., Prado, H. do, Vasconcelos, A. C. M. de, Perecin, D., Rossetto, R., Bidoia, M. A. P., Silva, M. D. A, & Xavier, M. A. (2003). Oxisol subsurface chemical attributes related to sugarcane productivity. Scientia Agricola, 60(4), 741–745.
Landell, M. G. de A., Prado, H. do, Vasconcelos, A. C. M. de, Perecin, D., Rossetto, R., Bidoia, M. A. P., … Xavier, M. A. (2003). Oxisol subsurface chemical attributes related to sugarcane productivity. Scientia Agricola, 60(4), 741–745. https://doi.org/10.1590/S0103-90162003000400020
Landon, J. R. (editor) (1991). Booker Tropical Soil Manual. (2nd ed). Longman Technical and Scientific, Harlow, England.
Leite, J. M., Ciampitti, I. A., Mariano, E., Vieira-Megda, M. X., & Trivelin, P. C. O. (2016). Nutrient partitioning and stoichiometry in unburnt sugarcane ratoon at varying yield levels. Frontiers in Plant Science. https://doi.org/10.3389/fpls. 2016.00466
Lofton, J., Tubana, B. S., Kanke, Y., Teboh, J., Viator, H., & Dalen, M. (2012). Estimating sugarcane yield potential using an in-season determination of normalized difference vegetative index. Sensors (Switzerland). https://doi.org/10.3390/s120607529
Lonsdale, J. E., & Gosnell, J. M. (1974). Monitoring maturity of sugarcane during drying-off. In Proc. ISSCT (Vol. 15, p. 13).
Maiti, D., & Das, D. K. (2006). Management of nitrogen through the use of Leaf Colour Chart (LCC) and Soil Plant Analysis Development (SPAD) in wheat under irrigated ecosystem. Archives of Agronomy and Soil Science, 52(1), 105–112. https://doi.org/10.1080/03650340500460875
Malik, K.B. (1997) Profitable cultivation of sugarcane. Directorate of Agri. Information, Agri. Dept. Punjab, Lahore: 49.
Mariano, E., J.M. Leite, M.X. Vieira-Megda, L. Torres-Dorante, and P.C.O. Trivelin. (2015). Influence of nitrogen form supply on soil mineral nitrogen dynamics, nitrogen uptake, and pro- ductivity of sugarcane. Agron. J. 107:641–650. doi:10.2134/ agronj14.0422
Mariano, E., Leite, J. M., Vieira-Megda, M. X., Ciampitti, I. A., Vitti, A. C., Faroni, C. E., … Trivelin, P. C. O. (2016). Biomass and nutrient content by sugarcane as affected by fertilizer nitrogen sources. Crop Science, 56(3), 1234–1244. https://doi.org/10.2135/cropsci2015.06.0349
Marles, R. J. (2017). Mineral nutrient composition of vegetables, fruits and grains: The context of reports of apparent historical declines. Journal of Food Composition and Analysis. Academic Press Inc. https://doi.org/10.1016/j.jfca.2016.11.012
Martinelli, L. A., and Filoso, S. (2008). Expansion of sugarcane ethanol production in Brazil: environmental and social challenges. Ecol. Appl. 18, 885–898. doi: 10.1890/07-1813.1
Mccray, J. M., Rice, R. W., Ezenwa, I. V, Lang, T. A., & Baucum, L. (2013). Sugarcane Plant Nutrient Diagnosis. Florida Cooperative Extension Service Pub. SS-AGR129, 1–12.
Mcmartin, A. (1979). The Logistic Curve of Plant Growth and its Application to Sugarcane. Proceedings of The South African Sugar Technologists’ Association, 232(756), 1200.
Meier, E. A., Thorburn, P. J., Wegener, M. K., & Basford, K. E. (2006). The availability of nitrogen from sugarcane trash on contrasting soils in the wet tropics of North Queensland. Nutrient Cycling in Agroecosystems. https://doi.org/10.1007/ s10705-006-9015-0
Meinzer, F.C., Saliendra, N.Z., and Crisosto, C. H. (1992). Carbon isotope discrimination and gas exchange in Coffea arabica during adjustment to different soil moisture regimes. Aust J Plant Physiol 19:171-184.
Mendoza, T. (2016). The Philippine Sugar Industry: What Needs to be Done. UP Los Banos, Laguna.
Meyer JH, Schumann AW, Wood RA, Nixon DJ, Van Den Berg M (2007) Recent advances to improve nitrogen use efficiency of sugarcane in the South African sugar industry. In: Hogarth DM (ed) Int Soc Sugar Cane Technol Proc XXVIth Congress, Durban July 2007, S Afr Soc Sugar Cane Technol Assoc and XXVIth ISSCT Organis- ing Committee, pp 238–246
Meyer JH, Wood RA (1994) Nitrogen management of sugar cane in South Africa. Proc Aust Soc Sugar Cane Technol 15:93–104
Meyer, J. (2011). Sugarcane nutrition and fertilization. Good Management Practices Manual for the Cane Sugar Industry. Eds. J. Meyer. The International Finance Corporation (IFC). Johannesburg. South Africa.
Mitchell AW, Reghenzani JR, Furnas MJ (2001) Nitrogen levels in the Tully River—a long-term view. Water Sci Technol 43:99–105
Molijn, R. A., Iannini, L., Rocha, J. V., & Hanssen, R. F. (2018). Data descriptor: Ground reference data for sugarcane biomass estimation in São Paulo state, Brazil. Scientific Data, 5. https://doi.org/10.1038/sdata.2018.150
Muchow, R. C., Robertson, M. J., Wood, A. W., & Keating, B. A. (1996). Effect of nitrogen on the time-course of sucrose accumulation in sugarcane. Field Crops Research. https://doi.org/10.1016/0378-4290(96)00022-6
Murphy, J., and Riley, J.P., (1962). A modified single-solution method for the determination of phosphorus in natural waters: Analytica Chimica Acta, v. 27, p. 31-36.
Nadelhoffer, K.J., M.R. Downs, and B. Fry. (1999). Sinks for 15N-Enriched additions to an oak forest and a red pine plantation. Ecological Applications. 9: 72-86.
Neal, J.S., Fulkerson, W.J., Sutton, B.G. (2011). Differences in water-use efficiency among perennial forages used by the dairy industry under optimum and deficit irrigation. Irrig Sci 29:213-232.
Neeteson JJ (1995) Nitrogen management for intensively grown arable crops and field vegetables. In: Bacon PE (ed) Nitrogen fertilisation and the environment. Dekker, New York, pp 295–325
Ng Kee Kwong, K. F., & Deville, J. (1989). Timing potassium fertilizer applications to sugarcane in Mauritius. Fertilizer Research. https://doi.org/10.1007/BF01054550
Nigussie Dechassa, M. B. (2014). Effects of Pre Cutting Nitrogen Application Rate and Time on Seed Cane Quality of Sugarcane (Saccharum officinarum L.) Crop at Finchaa Sugar Estate. Advances in Crop Science and Technology. https://doi.org/10.4172/2329-8863.1000152
Nikoli, T., Matsi, T., & Barbayiannis, N. (2016). Assessment of nickel’s sufficiency critical levels in cultivated soils, employing commonly used calibration techniques. Journal of Plant Nutrition and Soil Science. https://doi.org/10.1002/jpln.201600173
Ohashi, A. Y. P., de Matos Pires, R. C., Ribeiro, R. V., & de Oliveira Silva, A. L. B. (2015). Root growth and distribution in sugarcane cultivars fertigated by a subsurface drip system. Bragantia, 74(2), 1–9. https://doi.org/10.1590/16784499.0295
Oliveira, E. C. A., Freire, F. J., Oliveira, R. I., Oliveira, A. C., & Freire, M. B. G. S. (2011). Accumulation and allocation of nutrients in sugar cane. Revista Ciencia Agronomica, 42, 579e588.
Oliveira, J.C.M.; Reichardt, K.; Bacchi, O.O.S.; Timm, L.C.; Dourado-Neto, D.; Trivelin, P.C.O.; Tominaga, T.T.; Navarro, R.C.; Piccolo, M.C.; Cássaro, F.A.M.
(2000). Nitrogen dynamics in a soil-sugar cane system. Scientia Agricola 57: 467472.
Otto, R., Castro, S. A. Q., Mariano, E., Castro, S. G. Q., Franco, H. C. J., and Trivelin, P. C. O. (2016). Nitrogen use efficiency for sugarcane-biofuel production: what is next? BioEnergy Res. 9, 1272–1289. doi: 10.1007/s12155- 016-9763-x
Otto, R., Silva, A. P., Franco, H. C. J., Oliveira, E. C. A., & Trivelin, P. C. O. (2011). High soil penetration resistance reduces sugarcane root system development. Soil and Tillage Research, 117, 201–210. https://doi.org/10.1016/j.still.2011.10.005
Otto, R., Trivelin, P., Franco, H., et al (2009) Root sys- tem distribution of sugar cane as related to nitrogen fertil- ization, evaluated by two methods: monolith and probes. Revista Brasileira de Ciencia do Solo, 33, 601–611.
Otto, Rafael, Coutinho, H., Franco, J., Faroni, C. E., Vitti, A. C., Cantidio, E., Trivelin, O. (2014). The role of nitrogen fertilizers in sugarcane root biomass under field conditions. Agricultural Sciences.
Paningbatan, E. P., & Llanto, D. G. J. (2004). Soil and Fertilizer Requirements of Sugarcane in the Philippines. University of the Philippines, Los Baños, Laguna, 152 pp.
Park, S. E., Robertson, M., & Inman-Bamber, N. G. (2005). Decline in the growth of a sugarcane crop with age under high input conditions. In Field Crops Research. https://doi.org/10.1016/j.fcr.2005.01.025
PCARR. (1980). Standard Methods of Analysis for Soil, Plant Tissue, Water and Fertilizer. Farm and Systems Res. Div. Philippine Council for Agriculture and Resources Research, Los Banos. 164 pp.
Pearce, R.B., J.J. Mock, and T.B. Bailey. (1975). Rapid method for estimating leaf area per plant in maize. Crop Sci. 15:691–694.
Peng, S., Buresh, R. J., Huang, J., Zhong, X., & Zou, Y. (2010). To cite this version : HAL Id : hal-00886551 Review article Improving nitrogen fertilization in rice by site-specific N management . A review *, 30(3), 649–656.
Perakis, S.S. and L.O Hedin. (2001). Fluxes and fates of nitrogen in soil of an unpolluted old-growth temperate forest, southern Chile. Ecology 82:2245- 2260.
Perez O, Ufer C, Azañon V, Solares E (2010) Strategies for the optimal use of nitrogen fertilisers in the sugarcane crop in Guatemala. Proc Int Soc Sugar Cane Technol 27, 9 pp
Perez, B. O., & Melgar, M. (1998). Sugar Cane Response to Nitrogen , Phosphorus and Potassium Application in Andisol Soils. Better Crops International, 12(2), 20–24.
Philippine Statistics Authority. (2018). Major Crops Statistics of the Philippines. (November), 254. Retrieved from https://psa.gov.ph/sites/default/files/ MajorCrops10-14.pdf
Philippine Statistics Authority. (2019). Major Non-Food and Industrial Crops Quarterly Bulletin, October-December 2017. 13(1).
Qudsieh, H. Y. M., Yusof, S., Osman, A., & Rahman, R. A. (2001). Physico-chemical changes in sugarcane (Saccharum officinarum var yellow cane) and the extracted juice at different portions of the stem during development and maturation. Food chemistry, 75(2), 131-137.
Qudsieh, H. Y. M., Yusof, S., Osman, A., & Rahman, R. A. (2002). Effect of maturity on chlorophyll, tannin, color, and polyphenol oxidase (PPO) activity of sugarcane juice (Saccharum officinarum Var. Yellow Cane). Journal of agricultural and food chemistry, 50(6), 1615-1618. https://doi.org/10.1021/jf010959l
Rajesh, K., Thatikunta, R., and Naik, D. S. (2017). Enzymatic study of glutamine synthetase activity for validating nitrogen use efficiency in rice genotypes. Int. J. Pure App. Biosci. 5, 1416–1423. doi: 10.18782/2320-7051. 5213
Ramamurthy, V., L.G.K. Naidu, G. Ravindra Chary, D. Mamatha and S.K. Singh. (2017). Potassium Status of Indian Soils: Need for Rethinking in Research, Recommendation and Policy. Int. J. Curr. Microbiol. App. Sci. 6(12):1529-1540. https://doi.org/10.20546/ijcmas.2017.612.171
Rashid, M. I., Mujawar, L. H., Shahzad, T., Almeelbi, T., Ismail, I. M. I., & Oves, M. (2016). Bacteria and fungi can contribute to nutrients bioavailability and aggregate formation in degraded soils. Microbiological Research. Elsevier GmbH. https://doi.org/10.1016/j.micres.2015.11.007
Renouf MA, Wegener MK, Nielsen LK (2008) An environ- mental life cycle assessment comparing Australian sugar- cane with US corn and UK sugar beet as producers of sugars for fermentation. Biomass Bioener 32:1144–1155
Rosales C.M., Rivera, F.G. Hautea, R.A. and del Rosario, E. (1998). Field evaluation on nitrogen fixation by mungbean and residual effects on corn. IAEA TECDOC 1027. Improving nitrogen fixation of grain legumes in tropics and sub tropics of Asia.
Rosales C.M., Rivera, F.G. Hautea, R.A. and del Rosario, E. (2001). Biological nitrogen fixation under stress environment I: Diagnosis and correction of nutrient problems of mungbean in acid soils conditions. Philippine Nuclear Journal 13: 33-39.
Rosales C.P et al. (2004). Timber tree-based contour hedgerow system on sloping acid upland soils: The Philippine Nuclear Journal. 11:25-27.
Rosales C.P. et al. (1998). Field evaluation on nitrogen fixation by mungbean and residual effects on maize. IAEA TECDOC 1027. Improving nitrogen fixation of grain legumes in tropics and sub tropics of Asia. July 1998.
Rosales, C. M., Pailagao, C., Grafia, A. O., Rivera, F. G., and Mercado, A. R. J. (2004). Timber tree-based contour hedgerow system on sloping acid upland soils: the use of 15N in quantifying tree-crop interaction in agroforestry system. Philippines Nuclear Journal, 26–39. Retrieved from http://inis.iaea.org/search/search.aspx?orig_q= RN:36041241
Roy, R. N., Finck, A., Blair, G. J., & Tandon, H. L. S. (2006). Plant nutrition for food security. A guide for integrated nutrient management. In FAO Fertilizer and Plant Nutrition Bulletin 16 Food and Agriculture Organization of the United Nations. In FAO Fertilizer and Plant Nutrition Bulletin 16 Food and Agriculture Organization of the United Nations.
Salgado García S, Palma-López DJ, Zavala-Cruz J, Lagunes- Espinoza LC, CastelánEstrada M, Ortiz-García CF, Juárez-López JF, Ruiz-Rosado O, Armida-Alcudia l, Rincón-Ramírez JA (2010) A sustainable fertilisation program for a sugar factory in Mexico: A principle for precision agriculture. Proc Int Soc Sugar Cane Technol 27, 9 pp
Santos, I.E., Bangalan, A.A., Villarey, S.F., Grospe, C.R. Bersabe, Panganiban, P.V. and Loberiza, E.G. (1996). Calibration of Fertilizer Recommendation for Corn. Bureau of Soils and Water Management. Diliman, Quezon City. 31 pp.
Scharf, P.C., S.M. Brouder and R.G. Hoeft, (2006). Chlorophyll meter readings can predict nitrogen need and yield response of corn in the North-Central USA. Agron. J., 98: 655-665.
Schroeder, B.L., Hurney, A.P.,Wood, A.W., Moody, P.W. (2010). Concepts and value of the nitrogen guidelines contained in the Australian sugar industry’s ‘sixeasysteps’ nutrient manage- ment program. Proc Int Soc Sugar Cane Technol 27, 11 pp.
Seventeen, J.P., Smith, M.I., Lloyd, J. and Fuqua, G. D. (1997). Net Carbon Dioxide Assimilation, Carbon Isotope Discrimination, Growth, and Water-use Efficiency of Citrus Trees in Response to Nitrogen Status. J. Amer. Hort. Sci. 122 (2): 226232.
Sharma, L. K., & Bali, S. K. (2017). A review of methods to improve nitrogen use efficiency in agriculture. Sustainability (Switzerland), 10(1), 1–23. https://doi.org/10.3390/su10010051
SHI, Q. and Z. ZHU. (2008). Effects of exogenous salicylic acid on manganese toxicity, element contents and antioxidative system in cucumber.Environmental and Experimental Botany 63:317-326.
Shukla, S. K., Yadav, R. L., Singh, P. N., & Singh, I. (2009). Potassium nutrition for improving stubble bud sprouting, dry matter partitioning, nutrient uptake and winter initiated sugarcane (Saccharum spp. hybrid complex) ratoon yield. European Journal of Agronomy, 30(1), 27–33. https://doi.org/10.1016/ j.eja.2008.06.005
Sima, N.F., Sima, R.M., CUna, S., Cristea, G. and Mihai, V. (2011). Evaluation of the Use of Carbon Isotope Discrimination as a Selection Tool of Perennial Fodder Species for Temporary Pastures. Not Bot Horti Agrobo, 2011, 39(2):34-41.
Simões, M. dos S., Rocha, J. V., & Lamparelli, R. A. C. (2005). Growth indices ans productivity in sugarcane. Scientia Agricola. https://doi.org/10.1590/s010390162005000100005
Singh, J., Brar, B. S., Sekhon, B. S., Mavi, M. S., Singh, G., & Kaur, G. (2016). Impact of long-term phosphorous fertilization on Olsen-P and grain yields in maize–wheat cropping sequence. Nutrient Cycling in Agroecosystems. https://doi.org/10.1007/s10705-016-9796-8
Singh, P. (2018). Sustainable Sugarcane Production. Sustainable Sugarcane Production. https://doi.org/10.1201/9781351047760
Smeets, E.M.W., Bouwmanw, L.F., Stehfest, E., van Vuuren, D.P., Posthuma, A. (2009). Contribution of N2O to the greenhouse gas balance of first-generation biofuels. Glob Change Biol 15:1–23
Smith, D. M., Inman-Bamber, N. G., & Thorburn, P. J. (2005). Growth and function of the sugarcane root system. Field Crops Research, 92(2-3 SPEC. ISS.), 169–183. https://doi.org/10.1016/j.fcr.2005.01.017
Sturm, M., Adu-Gyamfi, J. (2009). Determination of Nitrogen Uptake and Fertilizer Use Efficiency in Corn (Zea mays L.) Using the 15N Labeling Method. Soils News Letter, Vol. 32. No. 1. p 27-29.
Sugarcane production in 2017, Crops/Regions/World list/Production Quantity (pick lists)". UN Food and Agriculture Organization, Corporate Statistical Database (FAOSTAT). 2017. Retrieved 10 October 2019.
Sugarcane Varieties | SRA. (n.d.). Retrieved February 27, 2020, from https://www.sra.gov.ph/sugarcane-varieties/
Thorburn PJ, Biggs JS, Collins K, Probert ME (2010) Using the APSIM model to estimate nitrous oxide emissions from diverse Australian sugarcane production systems. Agric Ecosyst Environ 136:343–350.
Thorburn PJ, Dart IK, Biggs IM, Baillie CP, Smith MA, Keating BA (2003) The fate of nitrogen applied to sugarcane by trickle irrigation. In: Thorburn PJ, Bristow KL,
Annandale J (eds) Micro-irrigation: Advances in system design and management. Irrig Sci 22:201–209
Thorburn PJ, Horan HL, Biggs IM, Park SE (2004) Which is the most important crop when assessing nitrogen applica- tions—the next or the last? Proc S Afr Sugar Technol Assoc 78:383–391
Thorburn, P. J., Biggs, J. S., Webster, A. J., & Biggs, I. M. (2011). An improved way to determine nitrogen fertiliser requirements of sugarcane crops to meet global environmental challenges. Plant and Soil, 339(1), 51–67. https://doi.org/10.1007/s11104-010-0406-2
Thorburn, Peter J., Biggs, J. S., Palmer, J., Meier, E. A., Verburg, K., & Skocaj, D. M. (2017). Prioritizing crop management to increase nitrogen use efficiency in australian sugarcane crops. Frontiers in Plant Science, 8(September), 1–16. https://doi.org/10.3389/fpls.2017.01504
Tran Duc Toan, Nguyen Duy Phuong, Nguyen Duc Dung, Vu Dinh Hoan, Nguyen Dinh Thong, A. S. (2016). Potassium Effects on the Productivity and Quality of Sugarcane in Vietnam. International Potash Institute, (44), 42.
Uyovbisere, E. O., & Lombim, G. (1991). Efficient fertilizer use for increased crop production: The sub-humid Nigeria experience. Fertilizer Research, 29(1), 81–94. https://doi.org/10.1007/BF01048991
Vallis L, Keating BA (1994) Uptake and loss of fertilizer and soil nitrogen in sugarcane crops. Proceedings of the Australian Society of Sugar Cane Technologists 16:105113
Van Heerden, P. D. R., Donaldson, R. A., Watt, D. A., & Singels, A. (2010). Biomass accumulation in sugarcane: Unravelling the factors underpinning reduced growth phenomena. Journal of Experimental Botany, 61(11), 2877–2887. https://doi.org/10.1093/jxb/erq144
Vieira-Megda, M.X., E. Mariano, J.M. Leite, H.C.J. Franco, A.C. Vitti, M.M. Megda, S.A. Khan, R.L. Mulvaney, and P.C.O. Trivelin. (2015). Contribution of fertilizer nitrogen to the total nitrogen extracted by sugarcane under Brazilian field conditions. Nutr. Cycling Agroecosyst. 101:241–257. doi:10.1007/ s10705-015-96767
Vijay Kumar, Ramesh Sharma, Goyal, N. K. and Singh, J. P. (2009). Recommendation of potassium application for sugarcane crop in Haryana. Indian Sugar, 59(6): 2530
Wiedenfeld R, Enciso J (2008) Sugarcane Responses to Irrigation and Nitrogen in Semiarid South Texas. Agron J 100:665–671
Wild, A., (1988). Russell’s soil condition and plant growth. Longman Scientific & Technical, Harlow, Essex, UK.
William R. Raun* and Gordon V. Johnson. (1999). Improving Nitrogen Use Efficiency for Cereal Production. Agronomy Journal, 91(3), 357–363. https://doi.org/10.2134/agronj1999.00021962009100030001x
Wood, A.W., Muchow, R.C., Robertson, M.J. (1996). Growth of sugar- cane under high input conditions in tropical Australia. III. Accumulation, partitioning and use of nitrogen. Field Crops Res., 48, 223–233.
Wood, R. A., & Meyer, J. (1986). FACTORS AFFECTING POTASSIUM NUTRITION OF, (April).
Yadav, R. L. (2004). Enhancing efficiency of fertilizer N use in sugarcane by ring-pit method of planting. Sugar Tech. https://doi.org/10.1007/BF02942719
Yang, H., Li, J., Yang, J., Wang, H., Zou, J., & He, J. (2014). Effects of nitrogen application rate and leaf age on the distribution pattern of leaf SPAD readings in the rice canopy. PLoS ONE, 9(2), 1–11. https://doi.org/10.1371/journal.pone.0088421
Zambrosi, F. C. B., Ribeiro, R. V., Marchiori, P. E. R., Cantarella, H., & Landell, M. G. A. (2014). Sugarcane performance under phosphorus deficiency: physiological responses and genotypic variation. Plant and Soil, 386(1–2), 273–283. https://doi.org/10.1007/s11104-014-2252-0
Zapata, F. and Axmann, H. (1991). Agronomic evaluation test of phosphate rock materials by means of radioisotope techniques. Pedologie XLI-3: 291-301.
Zapata, F. and Hera, C. (1995). Enhancing nutrient management through use of isotope techniques. In: IAEA Proc. Int. Symp. Nuclear Techniques in Soil-Plant Studies for Sustainable Agriculture and Environmental Preservation. Vienna, Austria: 83105.