Introduction | 1
Introduction | 2
Introduction | 3
ARCHITECTURAL ASSOCIATION SCHOOL OF ARCHITECTURE MASTER OF SCIENCE IN EMERGENT TECHNOLOGIES AND DESIGN 2025–2026
Architectural Association 2026 36 Bedford Square, London WC1B 3ES
Architectural Association [Inc], Registered charity No. 311083 Company limited by guarantee. Registered in England No. 171402
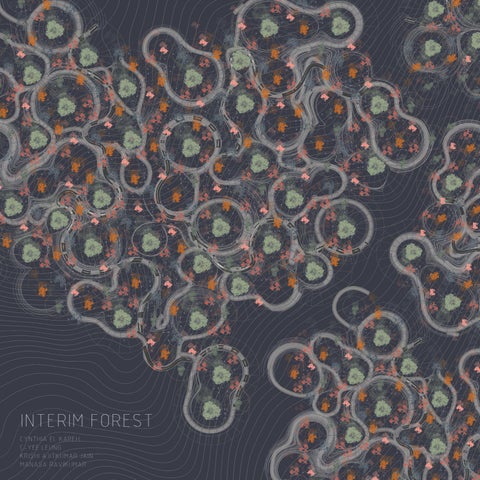
INTERIM FOREST
M.Sc Candidates
Cynthia El Kareh C Yee Leung
M.Arch Candidates
Krishi Ajitkumar Jain Manasa Ravikumar
Founding Director
Dr. Michael Weinstock
Programme Head
Dr. Milad Showkatbakhsh
Studio Master
Dr. Anna Font Vacas
Studio Tutors
Abhinav Chaudhary Paris Nikitidis Danae Polyviou Dr. Álvaro Velasco Pérez Krishna Bhat
ARCHITECTURAL ASSOCIATION SCHOOL OF ARCHITECTURE GRADUATE SCHOOL PROGRAMMES
PROGRAMME:
EMERGENT TECHNOLOGIES AND DESIGN
YEAR:
2025 - 2026
COURSE TITLE:
MSc. Dissertation
DISSERTATION TITLE:
Interim Forest
STUDENT NAMES:
Cynthia El Kareh (M.Sc.) C-Yee Leung (M.Sc.) Krishi Ajitkumar Jain (M.Arch.) Manasa Ravikumar (M.Arch.)
DECLARATION:
“I certify that this piece of work is entirely my/our and that my quotation or paraphrase from the published or unpublished work of other is duly acknowledged.”
SIGNATURE OF THE STUDENT:
Cynthia El Kareh (M.Sc.)
DATE:
18 September 2026
C-Yee Leung (M.Sc.)
Acknowledgement We would like to express our sincere gratitude to Dr. Michael Weinstock and Dr. Milad Showkatbakhsh for their guidance and support throughout this research. Their critical feedback encouraged us to question our assumptions and develop a clearer relationship between architectural intervention and forest restoration. We also thank Dr. Anna Font for her valuable input, and our studio tutors, Abhinav Chaudhary, Paris Nikitidis, Danae Polyviou and Dr. Álvaro Velasco Pérez, for their continued guidance throughout the development of this thesis. Their discussions and advice helped us refine our ideas and translate them into the design proposal. We are grateful to our peers within EmTech and the wider AA community for sharing their knowledge and making this year a collaborative experience.
8 | Introduction
ABSTRACT Lebanon’s cedar forests have been reduced to fragmented remnants by centuries of deforestation. In the Bcharre Valley beside the Cedars of God, rising temperatures, shorter snow cover, drought and human activity hinder regeneration. These challenges are particularly pronounced during the early establishment of Cedrus libani, when saplings need moisture, shelter, and protection from wind and harsh sunrays. The Interim Forest asks how temporary structures can support this stage and assume new uses as the forest develops.
Site observations and simulations of slope, sun, wind, snow, drainage and access establish the site’s ecological conditions. Cedars are planted with companion species selected for environmental compatibility and symbiotic relationships, forming clusters that support shared growth and regeneration. These species relationships determine the cluster's composition, while local environmental factors determine its location and the form of the nurturing structure around it. Each shelter is designed to compensate for the environmental conditions its location cannot adequately provide. Reusable, compression-based, dry–assembled components are created through a process of material prototyping and structural analysis. As the cedar matures and becomes less reliant on this protection, the structure can be dismantled. The individual components can then either be repurposed to shield another young sapling or reassembled along and around the trail for human use. As the forest matures, these structures create an interim forest: a dynamic layer of shelters, shaded areas and pathways that offer environmental support while mimicking the spatial qualities of a mature forest in its absence. The trail fosters opportunities for movement, observation, contemplation and camping. As the cedars grow, this system gradually recedes. The components transform into seating, steps, shelters, shading devices and low walls, keeping the material in circulation rather than leaving permanent structures on the site. Thus, human space emerges as the surplus of ecological need. Ultimately, this study investigates whether a temporary, reconfigurable architectural system can support early forest establishment, be repurposed for human use and progressively recede as the forest produces its own environmental and spatial conditions.
Introduction | 9
Contents THE INTERIM FOREST
0
1
2
INTRODUCTION
DOMAIN
METHODS
1. Forest Cover Across the Globe 2. Forest Migration: A Global Response
1.1
Cedar Forest | Bcharre, Lebanon
2.1
1.1.1 Social and Cultural Significance
QGIS : Site and Landscape Mapping
2.2
Grasshopper with C# Scripting
1.1.2 Tourism & Infrastructure
2.3
Ladybug : Solar and Microclimatic Analysis
1.2
Cedrus libani : A Living System 1.2.1 Seasonal Cycle 1.2.2 Root System and Mycorrhizal Network
1.2.3 Threats and Vulnerability 1.3
Case Studies 1.3.1 Reforestation Efforts in Lebanon 1.3.2 Kew Gardens
1.4
Biodiversity
1.5
Sapling Transport & Logistics
1.6
Precedents 1.6.1 Wardian Case 1.6.2 Palm House | Kew Gardens 1.6.3 Tree Shards | Current Techniques
1.7
Site Study 1.7.1 Global Scale
10 | Introduction
1.8
Design Strategy and Intervention
1.9
Hypothesis
2.4
Houdini : Snow Accumulation and Airflow Simulation 2.4.1 MPM Particle Simulations using HoudiniFX 2.5
Computational Fluid Dynamics : Wind Analysis
2.6
Finite Element Analysis : Structural Analysis
2.7
Wallacei : Multi-Objective Optimisation
2.8
Physical Experiments
3
4
5
RESEARCH DEVELOPMENT
DESIGN DEVELOPMENT
CONCLUSION
3.1
Site Study and Analysis
4.1
Social Catalogue | The Need
3.1.1 Regional Scale
4.2
Spatial Zones
3.1.2 Local Scale
4.3
Social Catalogue | The Design
3.1.3 Site Selection
4.4
Spatial Distribution
3.2
Primary Trail
4.5
Secondary Trails
3.3
Tree Location and Placement
4.6
Spatial Distribution | Rationalisation
3.4
Form Finding | Nurturing Devices 3.4.1 Nurturing Devices - Overhang Study
4.7
Tertiary Connections
4.8
Protection Deployment by Phase
3.4.2 Nurturing Devices - Curvature Study 3.5
Localized Intervention 3.5.1Tree Values 3.5.2 Reading the Tags 3.5.3 Nurturing Devices | Value Assessment 3.5.4 Nurturing Devices | Cuts & Types 3.5.5 Nurturing Devices | Deployment on site
3.6
Material Study 3.6.1 Material Selection & Properties 3.6.2 Material Casting Process 3.6.3 Material Compositions 3.6.4 Material Experiments 3.6.5 Material Experiments - Conclusion
3.7
Component Design and Analysis
3.8 Structural Analysis 3.8.1 Vertical Rib & Horizontal Rib Reinforcements 3.9 Snow Accumulation Study 3.9.1 Localised Intervention & Snow Accumulation 3.9.2 Perforation Study 3.10 Component Variation
Introduction | 11
1. Forest Cover across the Globe Forests cover roughly one-third of the world’s land area, but they are distributed unevenly across the planet. Extensive boreal forests stretch across Canada, Alaska, Scandinavia and Russia, while dense tropical forests are concentrated in the Amazon Basin, Central Africa and Southeast Asia. Forest cover is continually changing through deforestation, degradation, restoration and natural regeneration, making it an important indicator of ecological and climatic change. This brings in the need for their conservation, restoration and sustainable management.1
1. Food and Agriculture Organization of the United Nations, Global Forest Resources Assessment 2025 (Rome: FAO, 2025)
12 | Introduction
Forest cover around the world
Fig. 1 Forest cover shown on the world map Introduction | 13
2. Forest Migration: A Global Response Climate change is altering the temperature and precipitation patterns that determine where forests can survive and regenerate. As these conditions shift, the suitable ranges of many tree species are moving towards cooler environments, particularly higher latitudes and elevations. Forest migration occurs gradually through seed dispersal, regeneration and establishment across generations but since trees are long-lived and disperse slowly, many species may be unable to keep pace with rapid climate change, particularly where landscapes are fragmented. Forest restoration must therefore consider not only the recovery of lost forest cover, but also the conditions required for forests to establish and persist under future climates.2 2. Natalie Alcoba, “Trees Are Migrating in Response to Climate Change,” Corporate Knights, July 29, 2026, https://corporateknights.com/issues/2026-best-50-issue/tree-migration-climate-change-heat/.
14 | Introduction
Poleward Shift Upslope Migration Area of study
Fig. 2 Forest migration shown on the world map Introduction | 15
01 DOMAIN Within Lebanon, cedar forests hold an especially significant ecological and symbolic role, yet their extent has been greatly reduced over time. Today, the remaining stands of Cedrus libani represent both a vulnerable ecological system and an important part of Lebanon’s cultural identity, supporting biodiversity, tourism, recreation and local livelihoods. This chapter examines the cedar forest as a living system, tracing its decline, ongoing restoration, biological processes and environmental vulnerabilities.
16 | Domain
Fig. 3 Kew Garden image shot on phone Domain | 17
Fig. 3 Map of Lebanon
1.1 Cedars of God | Bchare, Lebanon Located on Mount Makmel, east of Bchare in northern Lebanon, the Forest of the Cedars of God (Horsh Arz el-Rab) survives as a remnant of the ancient cedar forests that once extended more widely across the region.3 The Lebanese cedar forest is simultaneously a biological community, a mountain landscape, and a cultural territory. Although Cedrus libani occurs naturally across parts of Lebanon, Syria, and Turkey, the species has become most closely associated with Lebanon, where it functions as both a national emblem and a living remnant of the forests that once occupied much larger areas of the eastern Mediterranean mountains.4 3. UNESCO World Heritage Centre, “Ouadi Qadisha (the Holy Valley) and the Forest of the Cedars of God (Horsh Arz el-Rab),” accessed September 13, 2026, https://whc.unesco.org/en/list/850/. 4. Melih Boydak, “Regeneration of Lebanon Cedar (Cedrus Libani A. Rich.) on Karstic Lands in Turkey,” Forest Ecology and Management 178, no. 3 (2003): 231–43, https://doi.org/10.1016/S03781127(02)00539-X.
18 | Domain
Fig. 4 Cedar of God forest located in Bcharri, Lebanon Domain | 19
1.1.1 Social & Cultural Significance
1.1.2 Tourism & Infrastructure
The Lebanese cedar’s significance also extends through ancient construction, religious narratives and the cultural history of the eastern Mediterranean. UNESCO describes the Forest of the Cedars of God as a surviving sacred forest, historically connected to the monastic landscape of the Qadisha Valley and valued in antiquity as a source of timber for major religious buildings.
The Cedars of God functions not only as an ecological reserve but also as an important cultural and recreational landscape within Lebanon. Forest tourism provides opportunities for recreation, education and social interaction, while the Lebanese cedar itself carries strong national, cultural and religious significance. Across the forest nature reserves and protected areas assessed in the study, an estimated 228,943 visitors per year generated approximately US$2.38 million annually in forest-tourism value, demonstrating the wider economic importance of these landscapes.6
The wood of the cedar is naturally durable, resistant to decay and weathering, stable, fragrant, and easy to work with. This made it ideal for use in construction, in the making of ships, temples, furniture, sculptures, and handicrafts. The economic value of the tree also played a role in its long history of deforestation.5 Although the Cedars of God forest is now protected and tree-cutting is prohibited, the area's economic worth has subtly moved to conservationrelated endeavors that include research, educational initiatives, tourism, crafts, guided tours, and the preservation of cultural memories.
5. UNESCO World Heritage Centre, “Ouadi Qadisha (the Holy Valley) and the Forest of the Cedars of God (Horsh Arz el-Rab),” accessed September 13, 2026, https://whc.unesco.org/en/list/850/.
A tourism development study identified the Cedars Ski Area as Lebanon’s oldest and highest ski destination and documented associated hotels, restaurants, accommodation and year-round activities.7 This continuous visitation highlights the need for conservation of the cedar forest while maintaining trails and facilities such that social activities and ecological restoration can exist side by side.
6. Lebanon Reforestation Initiative, “Forest Ecosystem Services,” ArcGIS StoryMaps, accessed September 15, 2026, https://storymaps.arcgis.com/stories/3f7a666b2b0a4cd485f357241937f15f 7. Japan International Cooperation Agency, The Study on the Integrated Tourism Development Plan in the Republic of Lebanon: Final Report, Volume 2, Master Plan Report (Tokyo: Japan International Cooperation Agency, 2004), https://openjicareport.jica.go.jp/pdf/11755048_03.pdf
FESTIVAL
HIKING
PARAGLIDING
SKIING
Fig. 5 Different tourist attractions around the Cedars of God forest in the Bcharre region
20 | Domain
OFF-ROAD
WINTER WALK
Cedar of God Forest`
Residential Zones
Tourism Zone
Existing Road
New Cedar Forest
Existing Trees
Water bodies
Ski Slopes
Fig. 6 Infrastructure map highlighting the different activities & zones around Cedars of God forest Domain | 21
1.2 Cedrus libani: A living System
1.2.2 Root System & Mycorrhizal Network
A cedar tree’s life cycle, root development and mycorrhizal associations reveal how the tree responds to changing climatic and soil conditions across different stages of establishment. These relationships are particularly critical during the early years of growth, when environmental stresses have the greatest influence on long-term survival. This understanding forms the ecological basis for identifying where and how design intervention can support cedar regeneration.
Cedrus libani seedlings initially havea rapidly extending taproot while above-ground growth remains slow. In shallow karstic soils, roots can penetrate soil-filled fissures in the limestone, allowing access to deeper moisture reserves and providing anchorage on rocky mountain slopes.8 The roots also form ectomycorrhizal networks, in which fungal hyphae colonise the roots and extend their effective nutrient-absorbing area. A 2024 study found that inoculation with Hebeloma crustuliniforme and Lactarius deliciosus increased cedar seedling biomass, root colonisation and uptake of nitrogen, phosphorus, potassium, iron and zinc.9
1.2.1 Seasonal Cycle The life cycle of Cedrus libani progresses from germination through the seedling stage into juvenile growth and finally the mature stage. The tree undergoes five distinct stages: germination in late summer or early spring; a seedling phase lasting one to two years; a juvenile phase spanning ten to fifteen years; maturity occurring between twenty and forty years, when it begins to cone; and a period of continuous growth beyond that. Following germination, the tree remains relatively small during its first two years, while establishing the root systems required for longer-term survival. This transition from seedling to juvenile tree represents a particularly critical establishment period which this project aims to address.
8. M. Boydak, REFORESTATION OF LEBANON CEDAR (CEDRUS LIBANI A. RICH.) IN BARE KARSTIC LANDS BY BROADCAST SEEDING IN TURKEY 9. Sedat Tüfekçi and İbrahim Ortaş, “Impact of Three Distinct Mycorrhizal Species on Cedrus Libani Seedling Development and Nutrient Uptake,” Forest Systems 33, no. 2 (2024): e04, https://doi.org/10.5424/fs/2024332-20816.
Autumn Fast planting before snow
Summer Drought Stress
Fig 8. Root system of cedar tree
Spring Snow melt + new growth
Winter Snow cover / dormacy
Fig 7. Seasonal life cycle of a cedar tree
22 | Domain
Fig 9. Mycorrhizal network around tree roots. Source: Egli S., Brunner I. (2011) Mycorrhiza. A fascinating community of life in the forest.
Fig. 10 Cedars of God forest during winter Domain | 23
1.2.3 Threats & Vulnerability Cedrus libani is increasingly vulnerable to the combined effects of climate change, biological disturbance and habitat fragmentation. Rising temperatures are producing shorter winters and reduced snowfall, limiting the moisture required for natural regeneration and increasing summer drought stress.10 The Cedrus libani has been added to the IUCN’s red list of vulnerable species.11 Apart from climate change, several other threats such as overgrazing, pest outbreaks, urban expansion, over exploitation of cedar wood and changing snow patterns.12
Pest outbreaks
Urbanization
These interacting pressures are particularly significant during regeneration, as changing temperature, moisture and snow conditions can limit the successful establishment of new trees, making the protection of young cedars increasingly important to the long-term migration and continuity of the forest. 10. Alasdair Soussi, “Lebanon’s Cedar Trees Threatened by Climate Change,” Environment, The Guardian, September 6, 2012, https://www.theguardian.com/environment/2012/sep/06/lebanon-cedartrees-climate-change. 11. Martin Gardner (IUCN SSC Conifer Specialist Group), “IUCN Red List of Threatened Species: Cedrus Libani Var. Libani,” IUCN Red List of Threatened Species, July 21, 2011, https://www.iucnredlist.org/en.
Overgrazing
Centuries of Overexploitation
12. TheBeiruter, “The Beirutr | Lebanon’s Cedars and the Fight for Survival,” TheBeiruter, accessed August 13, 2026, https://www.thebeiruter.com//article/lebanons-cedars-and-the-fight-for-survival/2119.
Annual mean temperature 2016 – 2025 fitted direction
Annual snow cover days 2016 – 2025 fitted direction
Fig 11. Temperature & snow pattern change over the last 10 years in Bcharre. Source: Open-Meteo historical weather data for Bcharri, 2016–2025. Temperature represents annual mean air temperature; snow-cover days represent days with recorded snow depth ≥1 cm. 24 | Domain
The graphs illustrate how cedar vulnerability changes as the forest matures. Young plants have high planting density that later on becomes lower through natural mortality or thinning due to increasing competition. Young plants are most vulnerable when they are still growing in the seasonal snow zone as the snow load, wind, and sunlight may impact their livability. As cedars grow taller and develop stronger roots and trunks, their vulnerability decreases.
Fig. 12. Cedar height and stand-density changes across stages of forest maturation. Sources: Carus & Catal (2010): 25-year plantation density, height and 100-year site index. Zsolnay et al. (2023): mean height of a separate ~40-year stand.
Fig 13. Relationship between cedar height, seasonal snow exposure and establishment-stage vulnerability. Sources: Carus & Catal (2010): 25-year plantation density, height and 100-year site index. Zsolnay et al. (2023): mean height of a separate ~40-year stand. Domain | 25
1.3 Current Case Studies 1.3.1 Reforestation Efforts in Lebanon In response to the historical decline of Lebanon’s cedar forests, organised reforestation efforts have progressively sought to expand the remaining stands around Bcharre. The Committee of the Friends of the Cedar Forests of Bcharre (CFC) had already undertaken reforestation through several funding programmes before collaborating with the Lebanon Reforestation Initiative (LRI), with new planting areas conceived as extensions of the existing Cedars of God forest in 1996. 12,920 cedar seedlings were planted across 30.39 hectares in 2013 alone. Monitoring recorded a survival rate of 82.04% in 2013, increasing to 90.64% in 2014, making Bcharre one of the more successful LRI reforestation sites.13 13. “Jouzour Loubnan, “Bcharri Reforestation Project,” November 8, 2019, https://www.jouzourloubnan.org/our-plantation-sites ..
3,205 Planted trees
Area – 10 hectares
Altitude – 2020 – 2400m
Survival – 97.5%
Fig 14. The new forest reforestation project near the Cedars of God forest.
Fig 15. Young cedar are enclosed in a scaffold for protection
26 | Domain
1.3.2 Kew Gardens Three mature cedar trees at Kew Gardens were examined as a comparative case study. Measurements and planting records produced an estimated average height increase of approximately 45 cm per year which is greater than the published growth benchmark used for cedars in Lebanon. This difference illustrates how managed soil, water and climatic conditions can influence tree development.
Growth rate - Cedar trees in Kew Gardens Growth rate - Cedar trees in Lebanon
Fig. 16. Comparative growth trajectories of Cedrus libani at Kew Gardens and the published Lebanon benchmark.
Average cedar tree growth at Kew Gardens – 45 cm/ year Fig. 17. Cedar Trees found at Kew Gardens, London. Source: Authors
Domain | 27
1.4 Biodiversity A monoculture consisting solely of cedar would lead to the restoration of the dominant tree species, but it would not fully revitalise the broader ecological system found in a mature cedar forest. Natural Cedrus libani forests often exist as mixed communities, incorporating species such as Brant’s oak, cedar oak, taurus maple, and junipers. These varying root systems stabilise soil, while deciduous species contribute diverse leaf litter and enhance nutrient content. Shrubs provide protection for exposed ground, and the different canopy layers create variations in shade, humidity. Increased tree species diversity leads to higher forest productivity and enhanced stability over time, as different species respond uniquely to environmental stress, preventing the entire forest from relying on a single ecological strategy. Turkish and Calabrian pines are introduced as a temporary secondary planting layer rather than part of the permanent seven-species mix. Their faster growth helps establish early forest density while the cedar and other slower-growing species mature. As the permanent forest develops and competition for light, water and space increases, the pines are selectively thinned and gradually removed.14
1.5 Sapling Transport & Logistics Each tree species undergoes a systematic nursery-to-site establishment process. Saplings are cultivated under controlled nursery conditions for approximately one to two years, which facilitates adequate root and shoot development before transplantation. Once ready, the saplings are carefully lifted and transported to pre-selected planting locations.
During transportation and planting, the root ball is encased within a biodegradable pot made from mycelium, coir, and hemp. This design not only protects the roots but also introduces compatible mycorrhizal fungi into the planting area, aiding in the initiation of below-ground fungal colonisation. Additionally, water-filled biodegradable hydrogels15 are incorporated into the surrounding soil enhancing soil water retention and gradually making moisture available to the developing roots. As the saplings become established, these temporary support systems gradually diminish, allowing the trees to increasingly rely on the site's natural soil, water, and ecological networks.
14. Yılmaz et al. (2019), “Scale-dependent intraspecific competition of Taurus cedar (Cedrus libani) saplings in Southern Turkey.”
15. Dawid Skrzypczak et al., “Biodegradable Hydrogel Materials for Water Storage in Agriculture Review of Recent Research,” Desalination and Water Treatment 194 (August 2020): 324–32, https://doi.org/10.5004/dwt.2020.25436. 28 | Domain
Fig. 18. Proposed nursery-to-site workflow: seed collection, nursery cultivation, myceliumlayered root wrapping and transplantation into the restoration landscape.
Turkish pine
Birch Tree
Fig. 19. Proposed mixed-species cluster with their spatial sizes Domain | 29
1.6 Precedents 1.6.1 Wardian Case The Wardian Case was a small, closed environment, moist and warm, that decoupled the plant inside it from the polluted city outside. Within decades, it had become the essential instrument of botanical transport. How tea, and cinchona were moved between continents, and by which colonial botany assembled the global collections that filled Kew and its imitators. The device is elegant, and its logic is simple: architecture as an enclosure that isolates the plant from a hostile world.16
1.6.2 Palm House, Kew Gardens What the Wardian Case did at the scale of a jar, the great glasshouses did at the scale of a room. Palm House (1848) proposed that industrial materials could be assembled into vast prefabricated envelopes capable of holding controlled climates. Their architectural intelligence remains instructive: modular, demountable, ordered by a rigorous constructional logic. They treat the plant as an object to be protected from its environment, and the architecture as the boundary that makes that protection possible.17
1.6.3 Tree Guards – Current Techniques Existing tree guards protect saplings from browsing and create a sheltered microclimate during establishment. Plastic guards may become brittle, split as the tree expands, or remain uncollected in the landscape. UV degradation can also cause them to fragment, contributing to plastic pollution, while guards left around the tree for too long may restrict its growth. They therefore provide passive protection rather than site-specific environmental support.18
16. “The Wardian Case: A History of Plant Transportation | Kew,” accessed June 26, 2026, https://www.kew.org/read-and-watch/the-wardian-case-a-history-of-plant-transportation. 17. Jonathan Rutherford and Simon Marvin, “Climate-Controlled Conservation: Remaking ‘the Botanical Metropolis of the World,’” Transactions of the Institute of British Geographers 50, no. 2 (2025): e12701, https://doi.org/10.1111/tran.12701. 18.Plastic-Tree-Tube-Options-Report.Pdf,” n.d., accessed July 17, 2026, https://www.northpennines.org.uk/wp-content/uploads/2022/02/Plastic-Tree-Tube-Options-Report.pdf.
30 | Domain
Fig. 20. Precedents – 1. Wardian Case, 2. Palm House, 3. Tree Shards
1.7 Site Study and Analysis 1.7.1 Global Scale Water Flow & Snow Accumulation
Altitude Levels
10km
10km
10km
10km
2850
1750
The map identifies the wider areas of potential snow accumulation surrounding the Cedars of God forest region. These patterns reveal how seasonal water moves across the terrain, helping locate zones with more snow accumulation to select the site of intervention.
The wider landscape ranges from approximately 1,750 to 2,850 metres above sea level. Mapping this elevation gradient helps position the site on slopes that are accessible and will support tree growth.
Incident Radiation
Slope Analysis 10km
10km
10km
10km
60deg Slope
Flat
The map shows variations in annual solar exposure across the wider landscape. Highly exposed areas may lead to faster snow melt while shaded areas will retain snow for longer period comparatively. This analysis helps identify zones with balanced solar conditions for forest establishment.
The slope map distinguishes gentler terrain from steep and erosion-prone mountain slopes. Gentler and moderately sloping areas offer more suitable conditions for planting, access and soil stability, while very steep areas should be avoided.
Fig. 21. Site Analysis – 1.Water Flow, 2.Altitude, 3.Radiation, 4.Slope Domain | 31
1.8 Design Strategy & Intervention
Fig. 22. Conceptual diagram showcasing the project’s scope and design intervention
The key environmental pressures affecting trees in the Bcharre region include snow, solar exposure, wind and water availability, with each species responding differently to these conditions. Nurturing devices are therefore proposed as temporary interventions that support trees during their most vulnerable stage of establishment. Rather than modifying the entire reforestation landscape, each structure creates a localized microclimate where factors such as shade, snow accumulation, wind exposure and water access can be selectively managed according to the needs of the planted species. By improving these conditions at specific points, the intervention aims to strengthen early tree establishment and support the gradual development of a more resilient forest ecosystem. As the trees mature and become increasingly selfsufficient, the structures reduce their protective role and instead function as catalysts within an emerging self-sustaining system. The nurturing devices are conceived as an aggregation of components that are temporary in location but compressive, durable and waterproof in materiality. As the trees mature and become capable of sustaining itself, the structures are no longer required for its original role. The components are therefore designed in a way that they can be dismantled and reused for the newly planted trees, offering the same climatic support to the next vulnerable generation of trees. 32 | Domain
Regional mapping
33 | Introduction
1.9 Hypothesis A localised intervention can act as a catalyst for the growth of a sapling by creating a temporary microclimate during the early, vulnerable stages of the young forest.
Our Assumption By adjusting to variations in sunlight, wind, snow, and water, these localised interventions establish more favourable conditions for saplings. As the forest grows, structures evolve and have the capacity to be dismantled and repurposed, adding another layer to the experience of the forest.
34 | Introduction
02 METHODS
35 | Introduction
36 | Introduction
Fig. 23. CFD Analysis
2.1 QGIS
Fig. 24. Territorial overlay: altitude, radiation, slope, infrastructure
QGIS is used to construct a spatial model of the Bcharre valley using terrain, vegetation, hydrology, infrastructure, and circulation data. These layers establish the basis for site selection, identify potential expansion corridors, and locate runoff routes that inform the scaffold’s water- management strategy. The resulting GIS model provides the geographic framework for the subsequent stages of design development. Specifically placed geo-data can be used to convey specific measurements and provide accurate scale an information to models ran on grasshopper and rhino for testing.
2.2 Grasshopper Scripts
Using a mesh pipeline, the team can calculate the incident radiation on these surfaces using an environmental analysis software such as Ladybug. These factors improve and drive our analysis on height, perforation amount and sloping of our climate-responsive systems. Fig. 25. Site Analysis, Tree location optimisation
37 | Methods
2.3 Ladybug Solar Radiation and Microclimatic Analysis
Fig. 26. Qadisha Valley Seasonal Sun Hours
Fig. 27. Qadisha Valley Hydrological Water Shed
Using a mesh pipeline, the team can calculate the incident radiation on these surfaces using an environmental analysis software such as Ladybug. These factors improve and drive our analysis on height, perforation amount and sloping of our climate-responsive systems.
Fig. 28. Qadisha Valley Seasonal Incident Radiation
Fig. 29. Bcharre Relative Ground Wind Speed Wind Rose Diagram
Methods | 38
2.4 Slump Simulation using HoudiniFX As an alpine mountain climate, our team can simulate the snow accumulation using particle simulations which employ the terrain, wind flow and ground friction of the chosen site along with gravity. This data will provide our team with an in-depth understanding of how to gather as much as snow as possible.
Fig. 30. Houdini Slump Simulation
Using Houdini’s slump mode, we can attribute snow depth and accumulation precisely to the mountain morphology which will in turn inform our site selection and design geometry. Environmental Conditions
Fig. 32. Houdini Slump + Optimal Sun Locations + Lowest Sloping Regions
39 | Methods
Slump iteratively using an attribute known as entrainment which ‘deposit’ material changing the slope and curvature of the underlying mesh.
Fig. 31. Houdini Slump + Existing Forest Locations
These can be assessed against the local environmental conditions and infrastructure elements.
Local Infrastructure
Fig. 33. Houdini Slump + Existing Transportation Network
2.4.1 MPM Particle Simulations using HoudiniFX The Material Point Method (MPM) is an advanced numerical physics technique used to simulate the complex behaviour of continuous materials like solids, liquids, gasses, and mixtures. As such it is well suited for the multi phase materials such as snow which transforms from light fine snow to heavy packed ice. This tiered implementation was the model used to find out where snow would accumulate along the wider site morphology and would best indicate where to place our final site regarding increased snow accumulation for growing Lebanese cedar trees. Although simple enough, the next level would’ve been for the design to utilise vellum solver which is best suited for deformable materials such as cloth and mud. Vellum solve uses Extended Position Based Dynamics (XPBD). It connects points together using geometric constraints rather than a continuous background volume grid. Which mean that snow could deform and compact to produce different properties and would break and recombine.
Fig. 35. Heaviest Snow Accumulation (Uniform Friction 0.2)
However, this results in millions of points each actively being calculated for each frame. Instead, MPM works best as a consistent indicator for snow flow and which can be split with different properties to simulate heavy, regular and light snow.
Fig. 36. Regular Snow Accumulation (Uniform Friction 0.4)
Fig. 34. 3d Export of Snow Particles as Mesh to Rhino
Fig. 37. Lightest Snow Accumulation (Uniform Friction 0.6) Methods | 40
Fig. 38. Snow Depth Coverage Map
Heavy
0m
Medium
5.8m
69,000 particles
0m
4.2m
78,000 particles Fig. 39. Snow Depth Heat Map
41 | Methods
Light
0m
3.8m
95,000 particles
Aggregation 0m
5.8m
261,000 particles
Fig. 40. Total Aggregate Snow Depth Heat Map Methods | 42
Fig. 41. Houdini Slump + Existing Forest Locations + Snow Max Depth Locations
43 | Methods
Fig. 42. Houdini Slump + Principal Zones + Primary Trail Connection
Methods | 44
2.5 Computational Fluid Dynamics – Wind Analysis (Visual Introduction)
Fig. 43. Houdini Wind Force Simulation
Fig. 44. Autodesk CFD wind scoop analysis
CFD (Computational Fluid Dynamics) is an integral part of designing for the windy climate and snow accumulation for the microclimatic approach that we are using in our design, especially when designing a wind shadow.. The proactive approach requires us to undergo constant analysis and iterative design decisions with feedback from the Autodesk CFD software to understand how wind flows according to specific geometries.
Fig. 45. CFD Overhang Geometry Wind Shadow
Fig. 46. CFD Structure Curvature Geometry Wind Shadow
These approaches maintain a level of realism and accuracy to the project which uses Navier-Stokes equations and Energy equation models across a mesh grid to rationalise evolving pressures interacting along a surface. Although far less precise due to the absence of air pressure in Houdini, we are able to generate snow accumulation using wind vectors from Autodesk CFD.
45 | Methods
2.6 Finite Element Analysis – Structural Analysis (Visual Introduction) FEA (Finite Element Analysis) is an integral part of realising the geometric forms with relation to weight and structural load. Engaging with improving structural stability with efficient material placement and joinery. Using software plugin such as Karamba as a part of grasshopper in Rhino3d, we are able to directly link joints and 3d point supports which dictate the amount of rotational or translational displacement would occur. Furthermore, Karamba offers utilizable values which will assist in developing optimisation pipelines that we would use, especially with Wallacei.
Fig. 49. Interlocking segmentation stress/strength
Fig. 47. Arch configuration component rationalisation
Fig. 48. Orthographic Material Properties for modelling in Karamba
Fig. 50. Stress/strength analysis
Methods | 46
2.7 Wallacei – Multi - Objective Optimization Wallacei is a multi-objective optimisation tool based in grasshopper which tests the individual design input variables that make a design hundreds of times and adapts the variables that produce the most benefits to objectives given (genes and fitness functions). This model then produces a result using a given set of input variables that it recognises in the set domain that produces the best overall average of multiple objectives or specific objective. We then use the wallacei analysis to classify specific trends in the design morphology or to state how much benefits are gained through the optimisation process.
Fig. 52. Testing parameter for tree distribution
Fig. 51. Wallacei test for tree distribution
47 | Methods
Fig. 53. Resulting Wallacei Analysis Process
2.8 Physical Experiments Material selection was guided by the environmental, structural and temporal requirements of the climate-responsive structures. The principal criteria included structural strength, density, water retention, durability and compatibility with disassembly and reuse. Based on these requirements, locally available materials were selected, including timber shavings, hemp shiv, coir fibres, lime, limestone sand and metakaolin. A series of physical experiments was then conducted on the selected material mixes to evaluate their mechanical, thermal and water- related performance. For the compressive strength tests, 5 × 5 × 5 cm cubes were placed on a flat platform and subjected to incremental loads of 1. kg, 2. kg and 5 kg, allowing deformation and failure thresholds to be observed and compared across the different mixes. For the thermal insulation tests, the cubes were placed on a hot plate and their surface temperatures were recorded using an infrared thermometer at one-minute intervals over a period of five minutes. The rate of temperature increase was then compared to evaluate the thermal behavior of each mix. Fig. 55. Sample of incremental material set adjustments and material casting processes
Fig. 56. Incremental Tension Stress Material Test
Fig. 54. Sample of incremental material set adjustments and material casting processes
Methods | 48
C#
Grasshopper
bundling + stitching
canopy geometry
Magnetic fields
C#
movement field lines
bundling + stitching
Grasshopper spatial distribution
Shortest Walk slope-graded routing
Houdini
CFD
snow drift
Grasshopper canopy geometry
QGIS
regional mapping
49 | Methods
wind shadow
Rabbit
L-system species
Karamba3D structural analysis
C#
placement + packing
Ladybug solar radiation
CFD
site wind
Wallacei
Regional mapping
07 MOTION
06 SECONDARY TRAIL
05 CATALOGUE
04 PRIMARY TRAIL
03 NURTURING DEVICES
02 TREES
01 SITE/TOPOGRAPHY
Methods | 50
03 RESEARCH DEVELOPMENT
This chapter progresses through investigations of site conditions, computational analysis, material properties, and design principles to effectively situate and build the forest intervention. It begins with a landscape-scale analysis to identify optimal tree locations, then refines the nurturing device’s form and performance for saplings. Material experimentation and structural testing lead to a topologically interlocking component system that integrates environmental performance, fabrication techniques, and assembly methods into a cohesive design strategy. 51 | Introduction
Research Development | 52
53 | Research Development
07 MOTION
06 SECONDARY TRAIL
05 CATALOGUE
04 PRIMARY TRAIL
03 NURTURING DEVICES
02 TREES
01 SITE/TOPOGRAPHY
Research Development | 54
3.1 Site Study and Analysis 3.1.1 Regional Scale 02 Proximity to Road
01 Slope Analysis
4.8km
4.8km
4.8km
4.8km
Areas with slopes between 0° and 8° were prioritised for plantation. These gentler gradients provide more suitable ground conditions for tree establishment, while steeper areas were deprioritised due to reduced accessibility and greater erosion risk.
Areas in closer proximity to existing roads were prioritised to ease the transportation of saplings, materials, and equipment to plantation zones, while reducing the logistical effort required for installation and maintenance.
03 Snow Accumulation
04 Sun Radiation 4.8km
4.8km
4.8km
4.8km
Tree plantation was prioritised in areas where snow depth ranges from 3 to 6 m. Since snowfall across the wider site is generally above 2 m, this criterion helps identify zones with comparatively higher snow accumulation.
Areas receiving incident radiation between 594.39 and 658.49 were selected. This represents the 45–55% band of the site’s total radiation range, prioritising locations with moderate solar exposure rather than highly exposed or heavily shaded areas.
Fig. 57. Snow accumulation, infrastructure, radiation and slope 55 | Research Development
Cedars of God forest
New forest The four environmental and logistical analysis layers were overlaid to identify a suitable pilot site within the landscape corridor between the Cedars of God forest and the new forest. Rather than selecting a site based on a single environmental condition, the overlap allows the project to respond simultaneously to solar exposure, snow accumulation, slope suitability, and proximity to existing roads. The selected pilot area therefore represents a zone where these conditions align most favourably for initial plantation and intervention. This pilot site is intended as the first stage of a larger reforestation strategy, rather than an isolated intervention. Over time, the project has the potential to expand through the land between the two existing forests, gradually establishing a more continuous ecological corridor. The initial site therefore acts as a testing ground for the plantation logic, nurturing structures, material systems, and long-term management strategy before these principles are extended across the wider landscape. Research Development | 56
3.1.2 Local Scale Wind
Snow
0
10
Water
0
10
Following the selection of our potential intervention site at the regional scale, the chosen area was analyzed at a finer resolution to understand variations in its immediate environmental conditions. Snow accumulation, wind exposure, water flow and accumulation, and solar radiation were mapped across the site and sampled onto a common point grid.
Sun
Using an image-sampling process, each point was assigned a relative value from 0 to 10 for each environmental factor, where the value represents the local intensity of that condition. This translated the environmental maps into a comparable numerical dataset, allowing conditions to be evaluated point by point rather than as broad zones. These values subsequently inform the placement of different tree species across the potential intervention site, matching their environmental requirements with suitable locations and identifying where additional intervention may be required to compensate for less favorable conditions. 0
10
0
Fig. 58. Snow accumulation, infrastructure, radiation and slope 57 | Research Development
10
Fig. 59. Limestone bricks drying in a shaded and ventilated spot Research Development | 58
3.1.3 Site Selection
The selection of a pilot site for the initial deployment of the system was informed by the overlap of four regional analysis layers. The chosen area is located within the landscape corridor that connects the Cedars of God forest and a new forest, supporting the long-term goal of gradually establishing continuity between these two forested regions. This pilot site was selected because it meets several favourable conditions. It is situated at a relatively higher altitude and is close to the existing road network, facilitating the transportation of saplings, materials, and equipment. Additionally, the terrain is gentle and suitable for planting trees. The site also falls within the preferred ranges for snow accumulation and solar exposure identified in the regional analysis.
Moreover, its proximity to existing access routes enhances the site's accessibility to visitors, supporting the project’s social objectives by allowing people to explore and experience the reforestation landscape. Therefore, the selected area effectively balances ecological suitability, logistical feasibility, and public accessibility, making it an appropriate location for testing the system prior to potential expansion throughout the wider corridor. Fig. 60.. Site Selec 59 | Research Development
3.1.3 Site Selection
Cedars of God Forest
Pilot Site
New Forest
Fig. 61. Pilot Site Selection Research Development | 60
3.2 Primary Trail
Jointing Sand Paver Block Bedding Sand Sub-base Subgrade
Fig. 63. Limestone Paver Blocks
Easy Trail 3⁰ - 5⁰
General Trail 5⁰ - 12⁰
The primary trail serves as the central circulation route throughout the intervention site, facilitating access across diverse terrain while guiding visitors through the reforestation landscape. It adheres to the existing topography and is categorized into three slope conditions: easy trails ranging from 3° to 5°, general trails from 5° to 12°, and challenging trails between 12° and 18°. This classification aids in adapting movement, accessibility, and pacing to the variations in the site's gradients. The trail surface is constructed using limestone paver blocks, chosen for their durability and local suitability. This paving system is layered over bedding sand, a compacted sub-base, and the existing subgrade, with jointing sand ensuring the stability of the individual blocks. This design allows the trail to rest lightly on the terrain while accommodating drainage and minor ground movement.
Hard Trail 12⁰ - 18⁰ Fig. 62. Section of the paved trails 61 | Research Development
Beyond merely functioning as circulation infrastructure, the primary trail also shapes how individuals experience the plantation system, intertwining areas of ecological intervention with spaces designated for movement, observation, and occupation throughout the site.
Cedars of God Forest
Start Point
Low Slope 0⁰
End Point
New Forest
Fig. 64. Primary Trail through site
High Slope 18⁰ Research Development | 62
63 | Research Development
07 MOTION
06 SECONDARY TRAIL
05 CATALOGUE
04 PRIMARY TRAIL
03 NURTURING DEVICES
02 TREES
01 SITE/TOPOGRAPHY
64 | Introduction
65 | Research Development
3.3 Tree Location and Placement Tree ID’s
Following the selection of the seven permanent species, their ecological and habitat requirements were compiled using data from the IUCN Red List19 along with supporting species-specific literature. The research was analysed through four key environmental factors relevant to the project: solar exposure, wind exposure, water availability, and snow conditions. Since the source information presents these requirements using various units, ranges, and qualitative terms, the values were standardized onto a common scale from 0 to 10. A higher score indicates a greater preference or tolerance for a particular environmental condition, while a lower score reflects a reduced requirement or tolerance.
This standardization establishes a consistent framework for comparing the environmental characteristics of the different species. These species profiles provide a clear set of environmental preferences for each tree type, forming the ecological foundation for the subsequent treeplacement strategy.
19. ‘The IUCN Red List of Threatened Species’, IUCN Red List of Threatened Species, accessed 16 July 2026, https://www.iucnredlist.org/en.
Fig. 65. Species habitat requirements derived from ecological data and standardized to a common 0–10 scale for comparison with site conditions.
Research Development | 66
Scale of the species
Comparative Scale – All seven at one metric scale 20 --
15 --
10 --
5 --
0 --
Height (m)
67 | Research Development
Lebanese Cedar
Cedar Oak
Taurus Maple
Juniper Tree
Brant’s Oak
Cyprus Oak
Lebanese Barberry
Fig. 66. Species heights and radius comparison
Research Development | 68
Site Points
The 16.4-hectare intervention site was divided into a 5 m × 5 m grid, resulting in 6,003 potential planting locations throughout the terrain. This established a consistent spatial framework for evaluating the optimal positioning of each selected species. For every point within the grid, the environmental conditions of the site were assessed against the ecological requirements of each species. This analysis allowed for the identification of locations where factors such as sunlight, wind, snow, and water availability closely aligned with the preferred conditions for specific trees. Instead of distributing trees uniformly across the site, this approach generates a species-specific suitability map, highlighting multiple potential locations for each type. Additionally, the placement logic accommodates a certain degree of environmental mismatch. A tree does not need to be positioned solely where all four conditions are ideal; if one or more site conditions slightly deviate from the preferred range, the location may still be viable if the nurturing device can compensate for the lacking condition. In this way, the device acts as an environmental mediator, providing extra shade, moisture retention, wind protection, or snow-related buffering as needed. This strategy increases the number of viable planting locations while ensuring that architectural interventions are employed strategically, directing support where the landscape alone cannot fully satisfy the needs of the sapling. 69 | Research Development
Fig. 67. Assigning values to each point on site
Tree Placement & Objectives
16m
16m
Fig. 68. No one species dominates the site, proportional distribution is achieved
6m
Fig. 69. No overlap of mature crown
Once suitable locations for each species were identified, the next stage focused on determining how the different species could be distributed together across the site. Rather than allowing the species with the greatest number of suitable locations to dominate, the placement process sought to maintain a proportional mixed-species distribution, supporting the biodiversity strategy established earlier in the project. The placement logic also accounts for the mature crown size of each species. Trees are positioned so that their projected mature canopies do not overlap, with the required spacing changing according to the dimensions of the two neighbouring species. This ensures that the initial planting strategy anticipates long-term growth rather than responding only to the much smaller dimensions of the saplings at the time of planting. These requirements were used as objectives within the computational placement process, generating multiple possible configurations across the site. Each iteration explores a different arrangement while balancing species distribution, available planting locations, spatial mixing and maturetree spacing. The resulting alternatives demonstrate that there is not a single fixed planting pattern, but a range of viable configurations that can respond to the environmental suitability of the site while maintaining a heterogeneous forest structure.
Fig. 70. Optimising Objectives
The temporary thinning species, including Turkish and Calabrian pine, form an additional supporting layer within this system. They can occupy available areas to establish early woodland density and protection, before being selectively removed as the permanent forest matures. Research Development | 70
Tree Placement & Objectives
Total Trees – 675 Cedar Trees - 40
Total Trees – 630 Cedar Trees - 44
Total Trees – 645 Cedar Trees - 45
Total Trees – 600 Cedar Trees - 37
Total Trees – 670 Cedar Trees - 42
Total Trees – 650 Cedar Trees - 48
Total Trees – 660 Cedar Trees - 40
Total Trees – 620 Cedar Trees - 47
Lebanese Cedar Juniper Tree Cedar Oak Brant’s Oak Cyprus Oak Taurus Maple Turkish Pine and Calabrian Pine Lebanese Barberry Fig. 71. Tree location optimisation on site
71 | Research Development
Fig. 72. Final Selection after optimisation Area – 16.4 ha Grid size – 5 x 5m No. Of trees - 612 Research Development | 72
73 | Research Development
07 MOTION
06 SECONDARY TRAIL
05 CATALOGUE
04 PRIMARY TRAIL
03 NURTURING DEVICES
02 TREES
01 SITE/TOPOGRAPHY
Research Development | 74
3.4 Form Finding | Nurturing Devices 3.4.1 Nurturing Devices - Overhang Study
3.4.2 Nurturing Devices - Curvature Study
To create our nurturing device. We need to begin to understand the affecting morphology and so we start with a simple 5x5 m upright wall. We start by adding minor adjustments to the vertical curvature and simply tilt the wall in increments 0.5m to understand how wind reacts to a convex or concave.
Secondly, the CFD analysis was repeated on a second set of geometries using the best overhang and curvature from the first experiment but this time bending the structure horizontally inwards into a inward curved wall to analyse the optimal wind shadow.
Wall Height : 5m
…
Overhang: 0m
Curvature: 0
…
Wall Height : 5m Overhang: 0.5m
Wall Height : 5m
…
Overhang: 1m
Curvature: -0.02
Curvature: -0.02
…
Wall Height : 5m Overhang: 1.5m
Curvature: -0.02
Fig. 73. Wind analysis of different curvature 75 | Research Development
3.4 Form Finding | Nurturing Devices 3.4.2 Nurturing Devices - Curvature Study
1.8
18
1.6
16
WIND SHADOW DISTANCE (M)
WIND SHADOW/HEIGHT RATIO
3.4.1 Nurturing Devices - Overhang Study
1.4
1.2 1 0.8 0.6 0.4
14 12 10 8 6 4
0.2
2
0
0
0
0.5
1
1.5
2
0
0.1
0.2
0.3
0.4
0.5
0.6
0.7
0.8
0.9
OVERHANG + CURVATURE
CURVATURE
Upon review of the results, producing a downwards curve with overhang initially provides significant benefit to increasing the wind shadow strength and distance. Returning the curvature to be outward facing instead of inward facing doesn’t improve the height or length of the wind shadow. Furthermore, after 0.5m of overhang the results point to a direct inversely proportionate relationship between overhang and wind shadow. Thereby resulting in the best result having a 0.5m overhang and 0.02 curvature for a 5m high wall.
Similarly, with the overhang + curvature, the curvature positively impacts the length of the wind shadow at 0.06 curvature but immediately reduces from that point onwards at a steady rate when increasing curvature even further. The resulting optimal curvature was 0.06 for a 5m diameter wall. Attempting to reverse the curvature to be outwardly curving instead of inward curving immediately reduced the distance of the wind shadow by half and only decreased it further from that point onwards.
Fig. 74. Houdini Slump Simulation
Fig. 75.. Houdini Slump Simulation
Conclusion As the nurturing device is not as high as 5m, the sizes can be proportionally changed based on sun access. Research Development | 76
3.5 Localised Intervention Nurturing Devices | Tree Values
The placement script puts each tree where its species best suits the site, yet a planted position seldom meets every need. What it leaves unmet is supplied by the nurturing devices. This section follows that remainder from a single tree to the device built around it on site. Every planted tree carries a tag. The tag reads the site at the tree for sun, wind, water and snow, and compares each value with the need of its species. A green value means the site is sufficient. A red value marks a need the site does not meet, which for wind means more exposure than the species tolerates.
RED VALUES SHOW THE NEED
SPECIES OF THE TREE
GREEN VALUES SHOW THE SITE IS SUFFICIENT SU sun
WI wind
WA water
SN snow
SPECIES SP1 Lebanon cedar
SP2 Juniper
SP3 Cedar oak
SP4 Brant’s oak
SP5 Cyprus oak
SP6 Taurus maple FIG.76 The planted forest, tagged. Cones are the trees; each dashed stem ties a tag to its tree.
77 | Research Development
TREE NEEDS − SITE DELIVERS = 0 No need for a microclimatic support structure. > 0 A nurturing device supplies the difference.
RESULT = 0 · ALL READINGS GREEN
Fig. 77 Need met. All four readings are green, the result is 0 and the tree stays bare.
RESULT > 0 · ONE OR MORE READINGS RED
Fig. 78 Need not met. At least one reading is red; the red readings together decide the device the tree receives.
The rule is applied to each reading on its own, so a tree can be sufficient in three readings and short in the fourth. Only the failing readings call for a device, and a surplus counts as 0. For wind, need and delivery are read as shelter.
Research Development | 78
3.5 Localised Intervention Nurturing Devices | Reading the Tags
At close range every tag can be read. Two trees of the same species can carry different values, since each tag reads the ground at its own position, and so they can need different devices. Three tags are marked on the field and followed through the placement logic on the next spread.
1
SP5 SU 20 red → type 2 sun-scoop
2
SP1 WI 52 red → type 4 windbreak
3
SP3 WI 84 and SN 21 red → type 12 windbreak + snow-fence
Fig. 79 Detail of the tag field across the spread. Numbers mark the three tags followed on the next spread. 2
1
79 | Research Development
3
Research Development | 80
3.5 Localised Intervention Nurturing Devices | Value Assessment
W ATER / SNOW
A tag reduces to four answers, one for each reading: the need is met (0) or it is not (1). Four answers make sixteen combinations, and each combination is one nurturing device type.
0 0
The grid pairs the readings, wind and sun down the side and water and snow across the top. Both axes run 00, 01, 11, 10, so neighbouring cells differ in one reading only. One step across the grid adds or removes a single operation.
0 1
1 1
1 0
0 0
0
8
9
1
bare / control
snow-fence
water-catchment + snow-fence
water-catchment
0 1
10
11
3
sun-scoop + snow-fence
sun-scoop + basin + snow-fence
sun-scoop + basin
W IND / SUN
2 sun-scoop
1 1
HOW TO READ A DIAMOND
SNOW
SUN
W ATER
W IND
6
14
15
7
windbreak + sun aperture
windbreak + sun aperture + snow-fence
full section + snow-fence
full section
1 0 1 MORE the need exceeds what the site delivers 0 LESS
the site delivers enough
EACH RED READING TRIGGERS ONE OPERATION SNOW snow-fence
W IND windbreak
SUN sun-scoop
W ATER basin
4
12
13
5
windbreak
windbreak + snow-fence
windbreak + basin + snow-fence
windbreak + basin
Fig. 80 Nurturing devices placement logic: the sixteen combinations of the four readings, numbered by device type.
81 | Research Development
FOUR READINGS, FOUR OPERATIONS
Three operations add what the site lacks. The windbreak is the only one that takes something away, which is why wind is the one reading tested for excess.
SNOW counts 8
WIND counts 4
SUN counts 2
WATER counts 1
RED WHEN
RED WHEN
RED WHEN
RED WHEN
snow below the need
wind above the tolerance
sun below the need
water below the need
OPERATION
OPERATION
OPERATION
OPERATION
snow-fence
windbreak
sun-scoop
basin
holds drifting snow at the tree
stills the air around the sapling
opens the rim to the sun
catches and holds water around the sapling
TYPE = 8 × SNOW + 4 × WIND + 2 × SUN + 1 × WATER Each reading counts 1 when red and 0 when green. FIG.81 The four readings, the operation each one triggers and the value it adds to the type number.
FROM TAG TO TYPE TAG
READINGS
CELL
TYPE
1 SN
WI
SU
WA
0
0
1
0
0+0+2+0 =
2 sun-scoop
SP5
2 SN
WI
SU
WA
0
1
0
0
0+4+0+0 =
4 windbreak
SP1
3 SN
WI
SU
WA
1
1
0
0
8+4+0+0 =
12 windbreak + snow-fence
SP3
Fig. 82 From tag to type: the three tags numbered in FIG.80. The cell is the one the tag occupies in FIG.72; the form of each type is set out later on
Research Development | 82
3.5 Localised Intervention
Every operation is cut from the same collar, so form finding begins with what the rim of the collar does to each reading.
DEFAULT
SNOW WATER
DECREASED
FIG.83 sets two collar forms side by side. The first decreases the snow and water that reach the sapling, the second increases water and sun. The rim is then drawn against the nominal winter and summer sun angles, 35° and 65° (FIG.84). Two wall sections are run through a wind simulation to see where the air slows inside the collar
INCREASED (a) Default form
WATER
SUN
(b) a-4 · b-4
FIG.83 Collar forms. (a) Default, No adjustments (b) Water and Sun increased from in Front, Snow and Water Decreased from Behind
(a) NOMINAL W INTER SUN ANGLE
(b) NOMINAL SUMMER SUN ANGLE
35°
65°
Increased sun exposure + snow accumulation
Decreased sun exposure + snow accumulation
Increased Sun Exposure + Snow Accumulation
Fig. 84 The rim against the sun, in section. (a) Nominal winter sun angle. (b) Nominal summer sun angle.
83 | Research Development
Decreased Sun Exposure + Snow Accumulation
(a) WIND SCOOP W IND
Wind scoop: low wall to windward, tall wall to leeward. Wind velocity in section.
(b) WINDBREAK
W IND
Windbreak: tall wall to windward. The slowed air (blue) extends past the low wall on the leeward side.
W IND VELOCITY Black: section of the collar wall. Blue: slowed air; red: free stream. 0 m/s
7 m/s
Research Development | 84
3.5 Localised Intervention Nurturing Devices | Cuts & Types The types are cut from one collar. Its elevation is marked at four heights on the left, a to d, and at five on the right, 1 to 5, with 5 at the base. A cut runs from a left mark to a right mark and is named by the pair. Five cuts make the sixteen types, each drawn in FIG.79 in the colour of the reading it answers. Wind keeps the full wall on one side. Snow is executed as slots. Where water joins another operation it is added as a dish inside the ring. FIG.80 and FIG.81 show cut studies, with arrows for the readings each one answers.
a
1
b
2
c
3
d
4
0.46 m
0.53 m
0.56 m
0.56 m
5
MARKS ABOVE THE BASE
a / 1 2.11 m
b / 2 1.65 m
d / 4 0.56 m
c / 3 1.12 m
5 base
a-5 wind, full wall on one side
b-5 sun
d-1 snow, executed as slots
d-5 bare control
c-5 water only, with dish
FIG.87 The cut system on the collar elevation. Grey lines are possible cuts; the five cuts used by the types are drawn in the colour of the reading they answer.
a-4
b-5
c-5
a-4 · b-4
FIG.88 Cut studies. Arrows mark the readings each cut answers. GRADIENT OF OPENINGS THROUGH POROSITY
The same cut, a-4 · b-5, opened in two grades: perforated along the base, and split into slots. READINGS
SNOW
WIND
WATER
SUN
FIG.89 Gradient of openings through porosity: cut a-4 · b-5, perforated and slotted.
a-4 · b-5 perforated
85 | Research Development
a-4 · b-5 slotted
a-4 · b-5
The sixteen types in order of their number. Rows add the windbreak and the snow-fence, columns add the basin and the sun aperture. Cut codes read in the order wind, snow, sun, dish. NONE
+ BASIN
+ SUN APERTURE
+ SUN APERTURE + BASIN
NONE
0 bare / control
1 water-catchment
2 sun-scoop
3 sun-scoop + basin
d-5
c-5 + dish
b-5 sun
b-5 sun + dish
4 windbreak
5 windbreak + basin
6 windbreak + sun aperture
7 full section
a-5 wind
a-5 wind + dish
a-5 wind + b-5 sun
a-5 wind + b-5 sun + dish
8 snow-fence
9 water-catchment + snow-fence
10 sun-scoop + snow-fence
11 sun-scoop + basin + snow-fence
d-1 snow slots
d-1 snow + dish slots
d-1 snow + b-5 sun slots
d-1 snow + b-5 sun + dish slots
12 windbreak + snow-fence
13 windbreak + basin + snow-fence
14 windbreak + sun aperture
15 full section + snow-fence
+ WINDBREAK
+ SNOW-FENCE
+ WINDBREAK + SNOW-FENCE
+ snow-fence a-5 wind + d-1 snow slots
a-5 wind + d-1 snow + dish slots
a-5 wind + d-1 snow + b-5 sun slots
a-5 wind + d-1 snow + b-5 sun + dish slots
Fig.90 Nurturing device types, the complete set of sixteen.
Research Development | 86
3.5 Localised Intervention Nurturing Devices | Deployment on site
W ATER / SNOW
Each planted tree receives the type its four readings produce, and on the plan its collar takes the colour of that type. The key keeps the rows and columns of the placement logic (FIG.72), so every colour leads back to a combination of readings.
0 0
0
0 1
34
8
TREES PER READING
13
1
0
TOP LEFT
type number trees on site DASHED
does not occur snow-fence
102
10
water-catchment + snow-fence
21
11
water-catchment
52
3
3
0 1 sun-scoop
W IND / SUN
TREES PLANTED
STAY BARE
9
0 0
2
RECEIVE A DEVICE
1
1 0
TOP RIGHT
bare / control
306 272 34
1 1
6
sun-scoop + snow-fence
3
14
0
sun-scoop + basin + snow-fence
15
sun-scoop + basin
0
7
0
1 1
SUN
181
SNOW
122
W ATER
91
W IND
80
The sun-scoop is the most frequent device, on 102 trees. Types 1, 7, 14 and 15 do not occur on this site.
windbreak + sun aperture
windbreak + sun aperture + snow-fence
4
12
41
13
full section + snow-fence
13
22
full section
5
1
1 0 windbreak
windbreak + snow-fence
windbreak + basin + snow-fence
windbreak + basin
Fig.91 Nurturing devices on site: colour and number of trees for each type. COLLAR
the nurturing device, in the colour of its type CONE AND TINTED DISC
a planted tree and its crown ORANGE BAND
the trail
Fig.92 Plan detail with the devices in place. Fig.93 (opposite) The planted field in winter with the nurturing devices in place, coloured by type.
87 | Research Development
88 | Introduction
3.6 Material Study The material study investigated the development of a cast mineral–bio composite for the modular components. Where possible, locally or regionally available materials selected. Since the structure was required to sustain key factors like snow load, wind, water retention and durability, the composite was required to balance several properties like compressive strength, resistance to brittle cracking, lightweight so that its easily reused and thermal insulation.
89 | Research Development
Research Development | 90
3.6.1 Material Selection & Properties
Fig 94. Selected materials and their properties
Bcharre is characterized by the presence of a karst landscape, with soil rich in limestone and calcium content. Consequently, local materials that are available in the area were chosen for this purpose.20 The choice of the material was made considering their ability to withstand compressive strength, brittleness, thermal insulation, and light weight so that it is easy to reuse. The proposed system combines plant-based aggregates and fibres with a lime–metakaolin mineral matrix. Hemp shiv and timber shavings reduce density and improve thermal insulation, while coir fibres bridge cracks and increase flexural toughness. Sand provides dimensional stability and limits shrinkage; hydrated lime forms a workable, vapour-permeable binder; and metakaolin reacts with the lime to improve curing and strength. This pozzolanic reaction forms cementitious hydrates that bind the aggregate, densify the matrix and improve mechanical strength.21 CLT provides structural support, while stained glass forms a non-structural layer that filters light and gives the design a visual identity. The experiments that were done compare different mix proportions according to density, strength, thermal performance, water absorption and overall material integrity. 20. Boydak M. Reforestation of Lebanon cedar (Cedrus libani A. Rich.) in bare karstic lands by broadcast seeding in Turkey. 21. André Gameiro et al., “Physical and Chemical Assessment of Lime–Metakaolin Mortars: Influence of Binder:Aggregate Ratio,” Cement and Concrete Composites 45 (2014): 264–271, https://doi.org/10.1016/j.cemconcomp.2013.06.010 91 | Research Development
Organic litter layer
Topsoil
Subsoil
Weathered limestone / dolomite
Bedrock
Fig 95. Soil type of Lebanon.
3.6.2 Material Casting Process
Fig. 96. Demonstrates the casting process used to cast the moulds before testing.
A consistent casting process was followed to ensure that each material sample could be accurately compared. The selected ingredients were first weighed according to the required mix ratio, after which the dry components and liquid binder were prepared separately. Hemp shiv is highly water absorbent, while sufficient moisture must remain available during early curing to sustain the pozzolanic reaction between lime and metakaolin. The samples were therefore cured in shaded conditions and protected from rapid drying.22 Before mixing, the hemp shiv was pre-washed and dried to help regulate its water demand and limit interference with the binder’s curing process. Samples were initially cured in the moulds for 48 hours under shaded, room-temperature conditions before being demoulded. They were then allowed to cure for a further 7–10 days. This controlled process allowed variations in density, water loss and physical integrity to be observed across the different mixes.
Fig. 97. Cast composite samples secured within reusable moulds during the initial curing stage.
22. João Monteiro, Vítor Silva, and Paulina Faria, “Effect of Type of Curing and Metakaolin Replacement on Air Lime Mortars for the Durability of Masonries,” Infrastructures 6, no. 10 (2021): 143, https://doi.org/10.3390/infrastructures6100143 Research Development | 92
Fig. 98. Demonstrates the casting process used to cast the moulds before testing.
93 | Research Development
3.6.3 Material Compositions
Sand + Lime + Metakaolin + Timber + Hemp + Coir
Sand + Lime + Metakaolin + Hemp + Coir
Sand + Lime + Metakaolin + Timber + Hemp
Sand + Lime + Metakaolin + Timber + Coir
W(g)
135.3
149.1
138
146.8
D(g/cm3)
1.08
1.19
1.17
1.17
Building sand
Fig. 99. Comparison of the four composite compositions, showing their constituent proportions, dry weights and calculated densities.
Metakaolin Hydrated lime Timber shavings
Washed hemp Dry coir
Four compositions were produced to examine how timber shavings, washed hemp and coir fibres influenced the composite’s dry weight and density. The mineral matrix of sand, hydrated lime and metakaolin remained broadly consistent, while the plant-based components were varied. The sample containing all three plant materials recorded the lowest dry weight and density, at 135.3 g and 1.08 g/cm³, indicating that their combined inclusion produced the lightest composition. These initial results indicate that the proportion and combination of lightweight organic materials influence density; however, their effects on strength, insulation and water absorption must also be considered before selecting the final composition.
Research Development | 94
3.6.4 Material Experiments Five cube samples (50 x 50 x 50cm) of different compositions were tested to validate each of the material properties based on which they were chosen.
1. Compression Test Each sample was subjected to an incrementally increased load (1.25, 2.5, 5kg), while the applied mass and the onset of visible cracking were recorded. The sample with Sand + Lime + Metakaolin + Timber + Hemp with failed at approximately 9 kg, equivalent to a compressive stress of 0.035 MPa. In comparison, the other samples sustained 39 kg without visible cracking, establishing a compressive resistance greater than 0.153 MPa. In conclusion, the coir fibre containing samples remained intact under maximum applied load.
Cube sample with timber and hemp failed
Fig. 100 Compression test conducted on all four cube samples
2. Tension Test For the tension test, a long beam (300 x 50 x 50 mm) of sand, hydrated lime, metakaolin, hemp shiv, timber shavings and coir fibres was positioned across two supports (15 cm span) and subjected to an incrementally increased load at its centre. The sample failed and cracked from the centre at 15kg.
Failed the tension test at 15kg
Fig. 101 Tension test conducted on a long beam samples 95 | Research Development
3. Water Absorption Test
Eco Plaster + Shellac
No Coating
Lime & Olive soap
Shellac + Lime & Olive soap
Three cube samples were treated with three coating systems- eco plaster with a shellac finish, lime & olive soap and shellac + lime and olive soap. Each cube was then submerged in water for 24 hours and its weight was recorded before and after submerging in water. The water absorption percentage of each cube as well as the difference in mass was calculated. Lime & olive soap coated sample showed the best results The lime-and-olive-soap coating was informed by tadelakt, a traditional Moroccan technique used to produce water-resistant lime-plaster surfaces. Olive soap contains fatty-acid salts that react with calcium in the lime to form poorly soluble calcium soaps. These hydrophobic compounds line the surface pores and reduce capillary water penetration without requiring a synthetic sealant.23
23. Britta Wolff, “Hydrophobized Lime Plasters as Protective Surface in Wet Rooms in Monument Preservation,” Advanced Materials Research 688 (2013): 60–69, https://doi.org/10.4028/www.scientific.net/AMR.688.60
Shellac + Lime & Olive soap 186g
Lime & Olive soap 196g
Eco plaster + Shellac 166g
No coating 140g
Fig. 102 Coating test done on samples
Research Development | 96
4. Thermal Insulation Test
3.6.3 Material Experiments - Conclusion
Each sample was placed directly on a temperature-controlled hot plate, and its top-surface temperature was recorded at one-minute intervals for five minutes. The rate of temperature increase was used to compare how quickly heat travelled through each composition. Compositions with a lower surface-temperature rise demonstrated greater short-term thermal delay, attributed to the presence of hemp and timber. Although, the thermal tests revealed a trade-off between insulation and structural strength.
After evaluating the results of the experiments, composition containing sand, hydrated lime, metakaolin, timber shavings, hemp shiv and coir fibre was selected because it provided the most optimal performance across the experiments. Rather than achieving the highest result in a single category, it offered an appropriate combination of compressive strength, crack resistance, dimensional stability, thermal insulation and low density. This balance enables the components to withstand environmental loads while remaining light enough to be transported and reused elsewhere within the forest. When combined with the selected protective coating (lime + olive soap), the composite also becomes water repellent.
Sand + Lime + Metakaolin + Timber + Hemp + Coir
Compressive Strength
Thermal Insulation
Dimensional Stability
Low Density Sand + Lime + Metakaolin + Timber + Hemp + Coir
Fig. 103 Thermal insulation test done on samples
Fig. 104 Properties of selected material
Sand + Lime + Metakaolin + Hemp + Coir Sand + Lime + Metakaolin + Hemp + Timber Sand + Lime + Metakaolin + Timber + Coir
97 | Research Development
3.7 Component Design & Analysis
The structures are assembled from one cast chevron block, 36 × 55 × 25 cm and 14.5 kg, light enough for one person to carry and set by hand at 1,900 m. Each block seats into the V of the block below, so the courses lock through their geometry, without mortar or fixings. A base piece with a zigzag top receives the first course and sits flat on the ground.
36 cm Topological interlocking
Base support
55 cm 25 cm
Fig.105 Chevron block, axonometric with overall dimensions
Fig.106 Chevron bond in elevation: topological interlocking above the base support
14.5 kg Weight 0.0283 m³ Volume 519.4 kg/m³ Density Research Development | 98
Fig.107 The moulds for our 1:4 model
99 | Research Development
Fig.108 The moulds for our 1:4 model
Research Development | 100
101 | Design Development
Fig.109 The casted bricks for our 1:4 model
102 | Introduction
3.8 Structural Analysis Structural & Material Rationalisation Finite element analysis of the dwelling shell, 190 components forming a dome 4.2 m in diameter and 3.8 m high. Colour gives stress as a percentage of material strength, red in compression and blue in tension. Compression concentrates around the crown, where the opening for the glass skylight is framed in CLT timber and carried on a ring beam. At ground level the shell stands on an interlocked foundation.
Glass skylight CLT timber frame
Ring beam STRESS / STRENGTH
−3.5% −2.8% −2.1% −1.4% −0.7% 0.0% 3.5% 7.0% 10.4% 13.9% 17.4%
Fig.110 Finite element analysis of the dwelling shell, stress as a percentage of strength
103 | Research Development
Glass skylight CLT timber frame Ring beam
Interlocked foundation
Fig.111 Section through the dwelling shell: glass skylight, CLT timber frame, ring beam and interlocked foundation
3.8 m Height
190 Components
12–14 kg Per component
4.2 m Diameter
5.7 kN/m³ Density
2,700 kg Total mass
Research Development | 104
3.8.1 Structural Analysis Structural & Material Rationalisation – Principal Stress Lines & Rib Reinforcement
Referring to the FEA analysis in the left most figure. Tensile stresses exceed the tensile strength of the material which we are using. This is most apparent as the weight of structure increases as the nurturing device gets higher. As this problem doesn’t occur with the dome structure, this deflection is caused by the inability for vertical principal stress to be solved which causes instability and therefore needs a rigid support such as vertical wooden ribs.
Principal stress lines drawn over the shell fall into two families, vertical lines in blue and horizontal lines in red. The rib reinforcement takes the same two directions: vertical fins and horizontal rings brace the block skin from the inside. Fig.112 Material Properties of Provisional Material (Refer to Material Study
Fig.113 FEA using interlocking components on nurturing device
Fig.114 Principal stress lines on the shell
Vertical stress lines
Horizontal stress lines
105 | Research Development
20mm CLT timber rib frame
30mm CLT timber panel frame
Fig.115 Rib reinforcement: vertical and horizontal bracing
Research Development | 106
3.9 Snow Accumulation Study SNOW ACCUMULATION CHART
Fig.116 Snow melt study, 10x20km site
107 | Research Development
Chosen Site Area
OPTIMISED SNOW ACCUMULATION + PHASE TRANSITION
Fig.117 Snow melt study, final 5x5km site
Pilot Site Area Research Development | 108
3.9.1 Localised Intervention & Snow Accumulation
The asymmetric section is tested in two orientations, one the mirror of the other. The first increases snow accumulation, the second reduces it. Accumulation affects the design in two ways: snow adds load to the dry-laid shell, and it supplies the moisture and winter cover the cedar depends on.
Presets: Houdini – Initial Wind Velocity 5m/s MPM Solver – Emission Rate 0.003. (2x5x3 Surface)
INCREASED SNOW ACCUMULATION
W IND
0 days
DOUBLY - INCREASED SNOW ACCUMULATION
Fig.118 Increased snow accumulation study, orientation (a)
109 | Research Development
1 day
2 days
DECREASED SNOW ACCUMULATION
W IND
0 days
1 day
2 days
DOUBLY - DECREASED SNOW ACCUMULATION Fig.119 Decreased snow accumulation study, orientation (b)
Research Development | 110
3.9.2 Perforation Study
23511p@f250
23511@250
49185p@f650
No Perforations Using the 4th variation as an example which uses a high wall to provide extra sun but blocking snow and wind. If only wind needs to be blocked but not the snow, there should be a option for the snow to seep into the inside of the device. Perforations can be a way to balance the accumulation of snow that allows snow buildup outside the nurturing device to
Fig.120 Snow Accumulation
111 | Research Development
85489p@f1300
+4.3% Volume Increase
24524p@f250
+8.1% Volume Increase
53184p@f650
15% Perforation Something as small as 15% perforation provides a compounding increase in the amount of snow that is captured behind the wall at a certain time. This can ensure that the capture of snow is more balanced and even.
Fig.121 Snow Accumulation with perforated bricks
+12.2% Volume Increase
95895p@f1300 Research Development | 112
3.10 Localised Intervention & Component Variation
Every structure type is a partial aggregation of the same block library. The complete shell uses 180 components in five layers. The other variants keep most of layer 1 (65 components) and thin out the layers above, down to 77 components in two layers. Colour identifies the layer, from layer 1 at the base to layer 5 at the crown.
Total components
×180
Total components
Layer 5
×30
Layer 5
×8
Layer 4
×30
Layer 4
×11
Layer 3
×15
Layer 3
×10
Layer 2
×30
Layer 2
×16
Layer 1
×75
Layer 1
×65
Fig.122 Component variation (a): 180 and 104 components, coloured by layer
113 | Research Development
×104
Total components
×85
Total components
×77
Layer 5
×3
Layer 4
×3
Layer 3
×2
Layer 2
×12
Layer 2
×12
Layer 1
×65
Layer 1
×65
Fig.123 Component variation (b): 85 and 77 components, coloured by layer
Research Development | 114
04 DESIGN DEVELOPMENT
115 | Introduction
116 | Introduction
4.1 Social Catalogue | The Need
The tree-placement strategy is determined by the maximum mature crown radius of each species, ensuring that neighbouring trees have adequate space to grow without experiencing future canopy conflicts. While this approach promotes the long-term health of the forest, it results in a landscape where newly planted saplings are initially widely dispersed, leaving large areas of open ground between them. At this early stage, the site cannot yet be perceived as a cohesive forest. The spatial characteristics typically associated with woodlands—such as enclosure, shade, density, shelter, and collective occupation—will gradually emerge as the trees mature and their canopies expand. This creates a significant temporal gap between the act of reforestation and the eventual experience of a mature forest. To address this gap, the social catalogue introduces a temporary spatial layer within the open areas between the young trees. These interventions create spaces for resting, gathering, observing, moving, and inhabiting the landscape, enabling visitors to experience the site as more than just a field of isolated saplings. Together, the young plantation, nurturing devices, and social interventions constitute an Interim Forest—a temporary state that imparts spatial and social presence to the landscape while the ecological forest is still developing. As the trees mature and establish their own canopies, shade, and enclosure, the need for these supplementary structures gradually diminishes, allowing the forest itself to assume their role. Fig.124 Social Catalogue - The Need (c) 117 | Design Development
Fig.125 Emptiness of a young forest Design Development | 118
4.2 Spatial Zones
Before any of this was a project, it was an argument.
Three of us, three forests, and no agreement about what a forest is for. One of us reads a forest as a route, and notices gradient, footing and how far it is to the next turn. One reads it as a sequence of rooms, and notices where the light changes. One walks in order to be out of sight of anybody. We were describing the same act to each other and failing to recognise the other person’s account of it.
What we could agree on was narrower, and more useful: the moments. Every one of us could point to where we speed up, where we stop without having decided to, where we turn our heads, and where we would stay until dark.
Those moments recur in all three forests, which have almost nothing else in common, not species, not climate, not altitude. That recurrence is the argument for designing conditions rather than programmes, and it is what the next two spreads set out.
THE FORESTS WE WALKED IN
PHOTOGRAPH
PHOTOGRAPH
TO BE PLACED
TO BE PLACED
Fig.126 Cedars of God Horsh Arz el-Rab24
Fig.127 Tai Po Kau Nature Reserve25
Fig.128 Nilgiri Biosphere Reserve26
Bcharre Valley, Lebanon
New Territories, Hong Kong
Tamil Nadu · Karnataka · Kerala, India
Mature subtropical secondary forest, 460 ha
5,520 km² across three states, 80–2,600 m
Planted from 1926, reserved in 1977
India’s first biosphere reserve, 1986
Over 100 tree species, planted and self-sown
Shola forest in patches above 1,800 m
The five conditions that survived the argument: motion, prospect, pause, retreat and dwell are photographed in the Bcharre valley overleaf and drawn in section at one shared scale on the spread after that.
24. BlingBling10. Forest of the Cedars of God. Photograph. Uploaded August 25, 2007. Wikimedia Commons 25. Seaonweb. The Park Entrance Sign at Tai Po Kau Nature Reserve. Photograph, n.d. Dreamstime. Accessed September 16, 2026. Image 255368772 26. Vajiram Content Team. “Nilgiri Biosphere Reserve.” Vajiram & Ravi, August 24, 2026. Source page. 119 | Design Development
PAU SE LOOK
They are five readings, positions a body already takes up in a forest that exists, photographed in the Bcharre valley before anything here was designed. Each is a combination of four variables: how exposed it is, whether the ground is raised, level or sunken, how enclosed it feels, and whether you pass through it, along it, or stop there. They close into a loop, not a sequence. Nothing converts into the next: a single walk crosses all five MOVE
and returns, and the same geometry reads differently at another hour, in another season, and in sixty
WITHDRAW
years when the cedars have closed over it.
ST AY
Fig. 129. Identifying moments in a mature forest Design Development | 120
121 | Design Development
07 MOTION
06 SECONDARY TRAIL
05 CATALOGUE
04 PRIMARY TRAIL
03 NURTURING DEVICES
02 TREES
01 SITE/TOPOGRAPHY
Design Development | 122
4.3 Social Catalogue | The Design
Once a stand no longer needs sheltering, its nurturing devices are dismantled and reassembled as social structures. The catalogue below sets out five conditions those reassembled components can hold, ordered from maximum motion to full stop: the trail that moves you through, the high point that stops you, the shaded ledge, the enclosure, and the shelter you stay the night in. How to read this row Every station is drawn in section at the same scale, 1:100, so the five structures are directly comparable in size, the bar above sets that scale. The orange band is the motion axis. The line beneath each station names the spatial qualities it has to deliver.
0
MOVEMENT
123 | Design Development
5m
Follow the trail
Reach a high point
Stop to rest / eat
MOTION
PROSPECT
PAUSE
direction · filtered light
vantage points · views
shade · seating · filtered light
Meditate / escape
Camp / remain overnight
RETREAT
DWELL
quiet · enclosure
shelter · stay
LEISURE
Fig. 130. Materialising the moments in a mature forest Design Development | 124
4.4 Spatial Distribution
Prospect Zones
Most suitable
Least suitable
Pause (Amphitheatre) Zones
Most suitable
Least suitable
Retreat Zones Most suitable
The distribution of the social structures was developed through a mesh-based spatial analysis of the site. The terrain was divided into a 5x5m grid of mesh faces, allowing each location to be evaluated according to the environmental and spatial requirements of a particular programme. Criteria including slope, elevation, proximity to vegetation, separation from other structures, trail accessibility and outward visibility were used to identify suitable locations. The final selected faces were then used to generate a proximity gradient across the site.
Least suitable
Dwell Zones Most suitable
Least suitable
Fig. 131. Potential locations for the catalogue on site 125 | Design Development
Prospect structures provide elevated points for observing the surrounding landscape. Candidate locations were selected from the highest areas of the terrain and tested for views towards the existing forest, proposed forest and western landscape. Obstruction from other structures were also considered. Each structure was oriented towards its strongest available view.
Amphitheatre structures create resting and gathering spaces within the tree cluster patch. Their placement responds primarily to steeper terrain, and route intersections. Candidate locations were filtered according to accessibility, tree clearance and separation from other structures. The structures are oriented downhill while remaining vertically upright for easier construction.
Retreat structures provide quieter and more secluded spaces within the landscape. They are located on relatively gentle slopes and positioned away from dwell structures to maintain privacy and spatial separation.
Dwell structures encourage a closer and more sustained relationship with the emerging forest. They are positioned on gently sloping terrain near tree clusters, while maintaining sufficient clearance for tree.
Fig. 132. Section of placement of catalogue Design Development | 126
127 | Design Development
07 MOTION
06 SECONDARY TRAIL
05 CATALOGUE
04 PRIMARY TRAIL
03 NURTURING DEVICES
02 TREES
01 SITE/TOPOGRAPHY
Design Development | 128
4.5 Secondary Trail
Fig.133 Overlay of suitable zones for catalogue
The secondary trail is designed to offer a more intimate experience of the reforestation landscape, moving beyond the notion of circulation as merely the shortest route between destinations. Its meandering geometry allows the path to gently curve around existing trees and their protective structures, responding to the planted landscape instead of bisecting it. At various points, the trail draws nearer to the trees, enabling visitors to closely engage with the saplings, protective devices, and the shifting microclimates, before returning to the more open areas of the site. This dynamic proximity fosters a diverse sequence of movement, encounters, and pauses, allowing the trail to gradually unveil the developing forest rather than presenting it as a static object. In this way, the secondary trail becomes integral to the project's social and experiential strategy, enabling people to traverse, observe, and engage with the ongoing process of forest growth over time.
The secondary trail network was initially created by establishing numerous potential connections between the distributed social programs and cedar tree locations. At this stage, the network was intentionally expansive, resulting in overlapping and nearly parallel routes to similar destinations. Instead of treating each connection as an individual path, the subsequent step focused on identifying the collective movement trends present within this dense network. Fig.134 Field lines showing potential movement paths 129 | Design Development
Fig.137 Limestone Paver Blocks
Fig.135 Grouping the majority of lines travelling in the same direction
Thus, the rationalization process began by grouping lines that travelled in similar directions or occupied the same spatial corridor. When several routes overlapped or ran closely alongside one another, they were considered as a single movement band rather than multiple distinct trails. The greater the concentration of lines within a band, the stronger the indication that this corridor was significant for connecting multiple destinations simultaneously. These bands were then consolidated by extracting a representative centreline from each cluster of routes. This centrelines preserved the overall direction and connectivity of the original network while eliminating unnecessary duplication, minor deviations, and closely spaced parallel paths. The resulting lines were further simplified and interconnected to create a continuous trail system with fewer intersections and a clearer hierarchy of movement. As a result of this process, the final secondary trail network became significantly more efficient than the initial generated field. Rather than fragmenting the landscape with numerous individual paths, the rationalized network concentrated circulation along shared routes, allowing a single trail to serve several program spaces and planting areas simultaneously. The final geometry thus emerges from the density and convergence of the generated connections, transforming a complex field of potential movement into a coherent and practical circulation system.
The final trails utilize the same limestone paver block system established for the primary circulation, ensuring material continuity across the site while distinguishing the secondary paths through their narrower and more locally responsive routes. Fig.136 Choosing a representative centreline and bridging gaps to keep continuity Design Development | 130
Fig.138 The final rationalised secondary trails 131 | Design Development
Fig.139 Secondary trails with paved limestone blocks Design Development | 132
4.6 Spatial Distribution | Rationalisation
Once the secondary trails were introduced, the suitable mesh faces identified for each social zone were rationalised to achieve a practical number of locations. This rationalisation was carried out using three spatial logics: grouping nearby mesh faces, defining their relationship to the trail network, and culling faces very close to each other. Suitable faces located within a specified distance were grouped, and the mesh face closest to their average centre was retained. Trail proximity was then used to maintain accessibility for dwells and amphitheatres, while retreats were positioned further away to provide privacy. This process transformed the initial suitability analysis into a coordinated spatial distribution across the site.
Nearby suitable mesh faces were grouped according to a defined proximity radius.
Dwells and amphitheatres were positioned within accessible proximity to the trails
Prospect x 4 Pause (Amphitheatre) x 11
Retreat x 9 Dwells x 50 Retreat was positioned away from the trails for more privacy
133 | Design Development
Fig 140. Final rationalised distribution of social structures across the site
Design Development | 134
135 | Design Development
07 MOTION
06 SECONDARY TRAIL
05 CATALOGUE
04 PRIMARY TRAIL
03 NURTURING DEVICES
02 TREES
01 SITE/TOPOGRAPHY
Design Development | 136
4.7 Tertiary Connections 1
The trail is drawn in five states. Nothing is laid across the forest and then adjusted around it: the loop network exists first, a single route is threaded through it, the two are read as one band of movement, and then the cedars cut it. The last drawing is not a proposal. It is what is left once the crowns have taken back the ground they need, which is why the section of the tunnel changes along its length rather than being chosen.
2
3
4
01 Secondary and tertiary trail Fig.141
The loop field is laid first. Secondary loops close around the ground each tree will need and tertiary links thread between them, so the network exists before any route has been chosen through it.
137 | Design Development
Several iterations were developed to refine the motion pathway. The trajectory follows natural human walking angles to avoid abrupt or unnatural zigzags. It also begins and ends at the crossing points where the primary and secondary trails intersect.
The path follows natural walking angles, avoiding abrupt changes in direction.
The trail should balance the directness of the primary trail with a slower, more contemplative promenade through the cluster, without becoming too short.
Ensure that the trail does not extend beyond the secondary boundary by more than 5 metres.
3m 4m
4m
8m 3.5m 2.3m
FAR FROM THE TRUNK
APPROACHING
AT THE CROWN EDGE
Fig.142
Fig.143
Fig.144
Where a cedar stands, the wave breaks. The tunnel is cut at the crown boundary and its section changes with proximity to the trunk. Across the three studies the tunnel widens by 60 per cent while rising only 32, so the profile flattens from width-to-height: nearer the trunk it is wider and, in proportion, lower. The dimension is therefore set by the proximity to the Cedar tree:
02 Both trails, summarized
03 The cedar cuts the path
04 The outcome
Fig.145
Fig.146
Fig.147
Read together the two stop being separate systems. Primary and secondary merge into a single band of movement, the distinction matters to the drawing, not to the person walking it.
Each crown is drawn over the network. Where one falls across the route the path is cut: the trail breaks, the tunnel section stops, and the tree takes back the ground the movement was using.
What survives the cutting is the trail as built. The route runs continuous again, but its width and section are set tree by tree , the plan is a record of where the cedars are, not a decision about circulation. Design Development | 138
4.8 Protection Deployment by phase
The two rows are linked but do not grow at the same rate. Year zero begins with two nurturing devices for one catalogue element. By year five, some collars continue protecting saplings while others open; released parts become seating and are assembled into new social catalogue elements.
The forest schedules the change: a trunk eventually reaches its collar’s inner diameter and the collar must open. Different mould diameters stagger release across the patch. The plan above each year shows the devices in the ground; the row below counts only what they have become.
0 / 2 OLD C AT AL O G U E
2 / 1 N U R T U R I N G D E V I C E : C AT AL O G U E
2 / 1 NEW CLUSTER: D E V I C E S + N E W C AT AL O G U E T H E P AT C H AT Y E AR 0 OPEN
·
C O L L AR S S E T , C AN O P Y
T H E P AT C H AT Y E AR 5 CLOSED
2
·
C O L L AR S O P E N , C R O W N S
2
1 New production
2
1 New production
New production
New production
0 Cluster year 0
YEAR 0
YEAR 5
Two intact nurturing devices stand for each one social catalogue element (2:1). Protection dominates the first years; the catalogue has only a small presence. The figures are a representative ratio, not an inventory of every tree in the forest.
Nurturing device
Three devices still nurture saplings and create no new catalogue element from that active group (3:0). Beneath them, two devices open and supply one newly assembled catalogue element (2:1); the exposed collars begin to work as seating. The Year 0 catalogue remains in use.
Catalogue
Fig.148 Protection deployment by phase — the patch in plan at each stage, with the catalogue it has released. Ratios are phase-specific. 139 | Design Development
YEAR 0
YEAR 10
YEAR 15
YEAR 5
2
1
2 / 1 NEW CLUSTER: DEVICES + NEW CATALOGUE
TO T HE NE X T PAT CH
THE PATCH AT YEAR 10
2
2
2
1 New production
New production
0 Cluster year 0
Exposed collar stays as seating · remaining devices transfer to
0 Cluster year 5
YEAR 10
a new patch
W ha t r e m a i ns fr om the nur tur i ng de vi c e
The trees now shelter themselves. Released collar parts continue to become seating and catalogue, which is much more numerous than active devices in this patch. Nearly all remaining nurturing devices move to a new patch of forest, where the sequence begins again.
Design Development | 140
141 | Introduction
142 | Introduction
143 | Design Development
Design Development | 144
05 CONCLUSION
CONCLUSION The Interim Forest designs for the decades between planting Cedrus libani in the Bcharré valley and the point at which the planting can be entered and read as forest. Through that interval the slope is kept sheltered for saplings and open to people. One computational chain runs from tree placement to the devices protecting each sapling, and the structures along the trails occupy the ground that chain leaves open. The site lies at about 1,900 m near the Cedars of God, inscribed on the World Heritage List in 1998 with the Qadisha Valley. A cedar planted there is most vulnerable in its first years, when sun, wind, water and snow decide whether it establishes. Tree shelters and nurse crops address that stage and make no provision for public use in the decades that follow. The thesis asked whether one computational system could protect saplings through establishment and make those decades inhabitable. The first finding concerns spacing. Six species were allocated by area: each takes a share of the site, and its tree count follows from the hexagonal cell its mature crown occupies. The distance between two saplings is therefore set by the crowns they will eventually reach, drawn at planting. The open ground between them is an output of that rule, and it carries the trail network and the catalogue structures. The shelter those structures produce then affects where saplings establish and where people choose to walk, so the dependence runs in both directions. Placement cannot remove every mismatch between a species and its ground, and the nurturing devices correct what remains. Each tree is tagged with site values for sun, wind, water and snow, tested against the species' needs at sapling stage. Four operations make up the vocabulary: windbreak, sun aperture, basin and snow-fence. Their combinations give sixteen types, indexed as 8·snow + 4·wind + 2·sun + 1·water, so once a tolerance is set a tree's shortfall resolves directly into a type number. Of the 306 trees in the site patch, 181 required a sun aperture and 80 a windbreak, and four of the sixteen types were never called for. The structures use one cast component, a chevron block, in five geometric conditions: a planar leg, two single-curvature runs that separate the arch families, a keystone, and a doubly curved shell piece that belongs to no arch. Component type is fixed by geometry at casting. The social catalogue classifies the same objects by what a visitor meets there, as motion, prospect, pause, retreat or dwell, read on four axes of exposure, ground, enclosure and movement. Those readings depend on the crowns and paths around a structure, so they vary independently of its component mix, and the catalogue cannot settle into a set of building types. Tree growth drives change in the rest of the system. A structure keeps its geometry while the canopy closes around it, so its reading migrates along the four axes, from exposed and open at planting towards sheltered and enclosed. The phasing drawn for one patch records the same shift as a count. Over ten years the catalogue there grows from one structure to seven, while a single collar stays in the ground as seating and the remaining devices leave for the next patch. Conventional silviculture, using nurse crops and staged thinning, would establish this stand at lower cost, and the project is designed to run alongside it. The project adds access during establishment. The slope stays open to visitors while the trees are young, and the collars and structures left behind when protection moves on keep the ground in use afterwards. Much of this rests on simulation and on literature values that have not been tested on site. The wind and snow behavior of the devices has been simulated, and no device has yet spent a winter at 1,900 m. The device vocabulary is also incomplete by construction: only the windbreak removes a resource, so a sapling in surplus of anything other than wind has no device to answer it, and neither does one short of wind. The tenyear phasing depends on growth rates from literature. The cast composite has been tested at sample scale and in the prototype, and has not been through repeated freeze-thaw cycles. Whether nurse-crop logic applies at this spacing, and whether a device giving equivalent shelter can stand in for a nurse crop, remain questions for a forester. The next stage is a monitored pilot patch. Devices would be placed from tags as they are in the model, with untreated trees of matching tags as a control, and snow depth, wind speed, soil moisture and sapling survival logged from the first winter. The measurements would replace literature figures in the species table and give the tolerance, currently set by design judgement, an empirical basis.
BIBLIOGRAPHY 1. Food and Agriculture Organization of the United Nations, Global Forest Resources Assessment 2025 (Rome: FAO, 2025)
14. Yılmaz et al. (2019), “Scale-dependent intraspecific competition of Taurus cedar (Cedrus libani) saplings in Southern Turkey.”
2. Natalie Alcoba, “Trees Are Migrating in Response to Climate Change,” Corporate Knights, July 29, 2026, https://corporateknights.com/issues/2026best-50-issue/tree-migration-climate-change-heat/.
15. Dawid Skrzypczak et al., “Biodegradable Hydrogel Materials for Water Storage in Agriculture - Review of Recent Research,” Desalination and Water Treatment 194 (August 2020): 324–32, https://doi.org/10.5004/dwt.2020.25436.
3. UNESCO World Heritage Centre, “Ouadi Qadisha (the Holy Valley) and the Forest of the Cedars of God (Horsh Arz el-Rab),” accessed September 13, 2026, https://whc.unesco.org/en/list/850/. 4. Melih Boydak, “Regeneration of Lebanon Cedar (Cedrus Libani A. Rich.) on Karstic Lands in Turkey,” Forest Ecology and Management 178, no. 3 (2003): 231–43, https://doi.org/10.1016/S0378-1127(02)00539-X. 5. UNESCO World Heritage Centre, “Ouadi Qadisha (the Holy Valley) and the Forest of the Cedars of God (Horsh Arz el-Rab),” accessed September 13, 2026, https://whc.unesco.org/en/list/850/. 6. Lebanon Reforestation Initiative, “Forest Ecosystem Services,” ArcGIS StoryMaps, accessed September 15, 2026, https://storymaps.arcgis.com/stories/3f7a666b2b0a4cd485f357241937f15f 7. Japan International Cooperation Agency, The Study on the Integrated Tourism Development Plan in the Republic of Lebanon: Final Report, Volume 2, Master Plan Report (Tokyo: Japan International Cooperation Agency, 2004), https://openjicareport.jica.go.jp/pdf/11755048_03.pdf
16. “The Wardian Case: A History of Plant Transportation | Kew,” accessed June 26, 2026, https://www.kew.org/read-and-watch/the-wardian-case-ahistory-of-plant-transportation. 17. Jonathan Rutherford and Simon Marvin, “Climate-Controlled Conservation: Remaking ‘the Botanical Metropolis of the World,’” Transactions of the Institute of British Geographers 50, no. 2 (2025): e12701, https://doi.org/10.1111/tran.12701. 18.Plastic-Tree-Tube-Options-Report.Pdf,” n.d., accessed July 17, 2026, https://www.northpennines.org.uk/wp-content/uploads/2022/02/Plastic-TreeTube-Options-Report.pdf. 19. ‘The IUCN Red List of Threatened Species’, IUCN Red List of Threatened Species, accessed 16 July 2026, https://www.iucnredlist.org/en. 20. Boydak M. Reforestation of Lebanon cedar (Cedrus libani A. Rich.) in bare karstic lands by broadcast seeding in Turkey.
8. M. Boydak, REFORESTATION OF LEBANON CEDAR (CEDRUS LIBANI A. RICH.) IN BARE KARSTIC LANDS BY BROADCAST SEEDING IN TURKEY
21. André Gameiro et al., “Physical and Chemical Assessment of Lime– Metakaolin Mortars: Influence of Binder:Aggregate Ratio,” Cement and Concrete Composites 45 (2014): 264–271, https://doi.org/10.1016/j.cemconcomp.2013.06.010
9. Sedat Tüfekçi and İbrahim Ortaş, “Impact of Three Distinct Mycorrhizal Species on Cedrus Libani Seedling Development and Nutrient Uptake,” Forest Systems 33, no. 2 (2024): e04, https://doi.org/10.5424/fs/202433220816.
22. João Monteiro, Vítor Silva, and Paulina Faria, “Effect of Type of Curing and Metakaolin Replacement on Air Lime Mortars for the Durability of Masonries,” Infrastructures 6, no. 10 (2021): 143, https://doi.org/10.3390/infrastructures6100143
10. Alasdair Soussi, “Lebanon’s Cedar Trees Threatened by Climate Change,” Environment, The Guardian, September 6, 2012, https://www.theguardian.com/environment/2012/sep/06/lebanon-cedartrees-climate-change.
23. Britta Wolff, “Hydrophobized Lime Plasters as Protective Surface in Wet Rooms in Monument Preservation,” Advanced Materials Research 688 (2013): 60–69, https://doi.org/10.4028/www.scientific.net/AMR.688.60
11. Martin Gardner (IUCN SSC Conifer Specialist Group), “IUCN Red List of Threatened Species: Cedrus Libani Var. Libani,” IUCN Red List of Threatened Species, July 21, 2011, https://www.iucnredlist.org/en. 12. TheBeiruter, “The Beirutr | Lebanon’s Cedars and the Fight for Survival,” TheBeiruter, accessed August 13, 2026, https://www.thebeiruter.com//article/lebanons-cedars-and-the-fight-forsurvival/2119. 13. “Jouzour Loubnan, “Bcharri Reforestation Project,” November 8, 2019, https://www.jouzourloubnan.org/our-plantation-sites ..
24. BlingBling10. Forest of the Cedars of God. Photograph. Uploaded August 25, 2007. Wikimedia Commons 25. Seaonweb. The Park Entrance Sign at Tai Po Kau Nature Reserve. Photograph, n.d. Dreamstime. Accessed September 16, 2026. Image 255368772 26. Vajiram Content Team. “Nilgiri Biosphere Reserve.” Vajiram & Ravi, August 24, 2026. Source page.
Introduction | 151
Introduction | 152
Introduction | 153