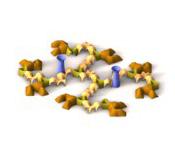
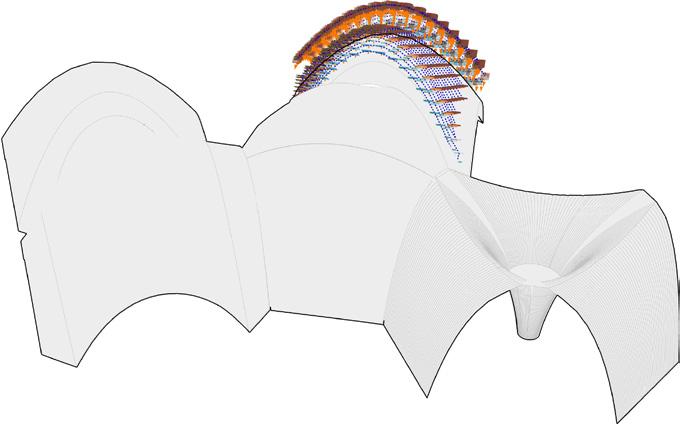
Construction and Water Management strategies for a resilient community in Ethiopia
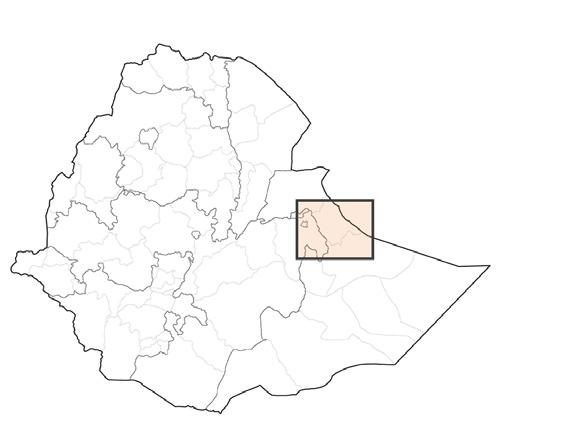
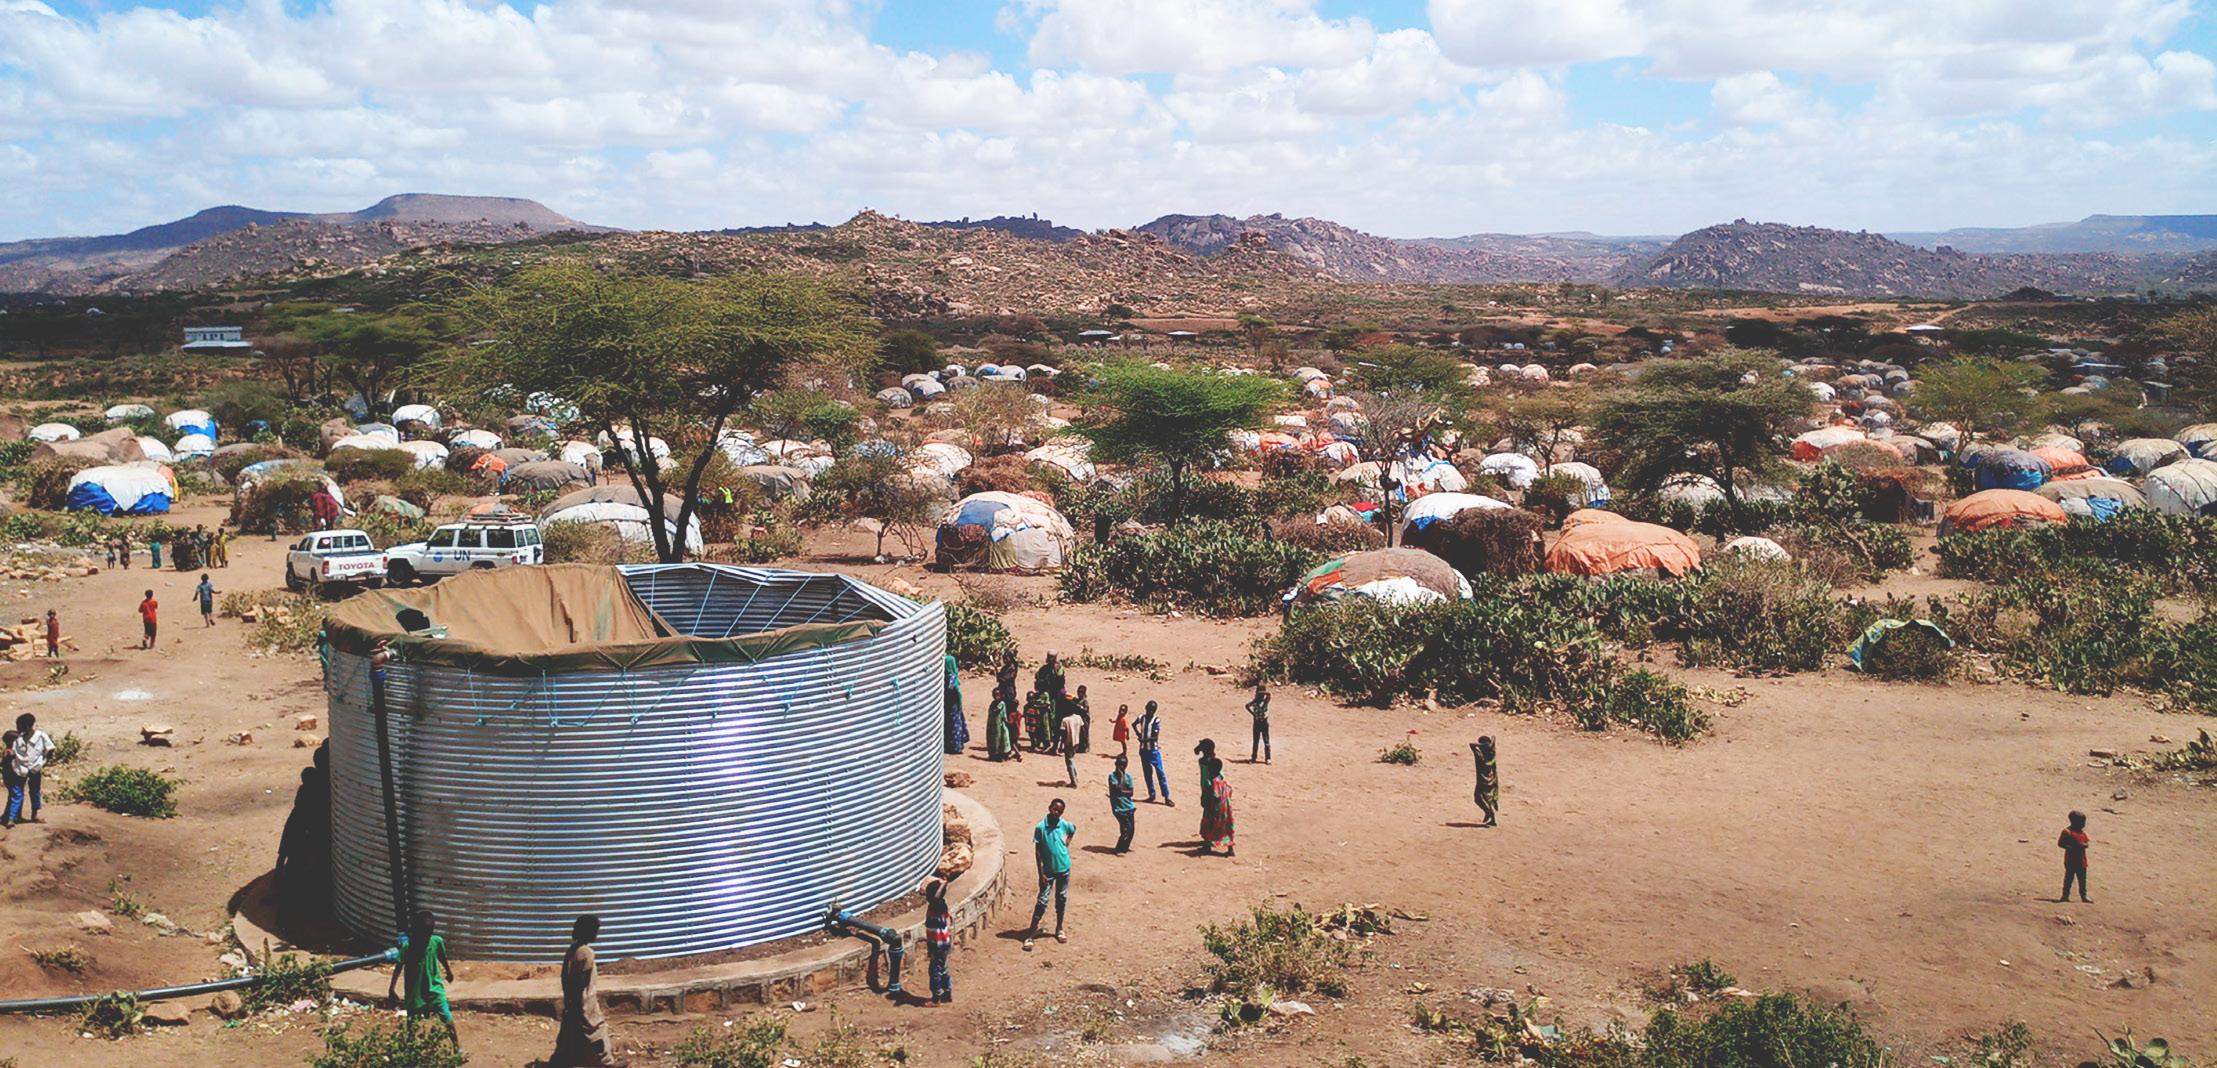
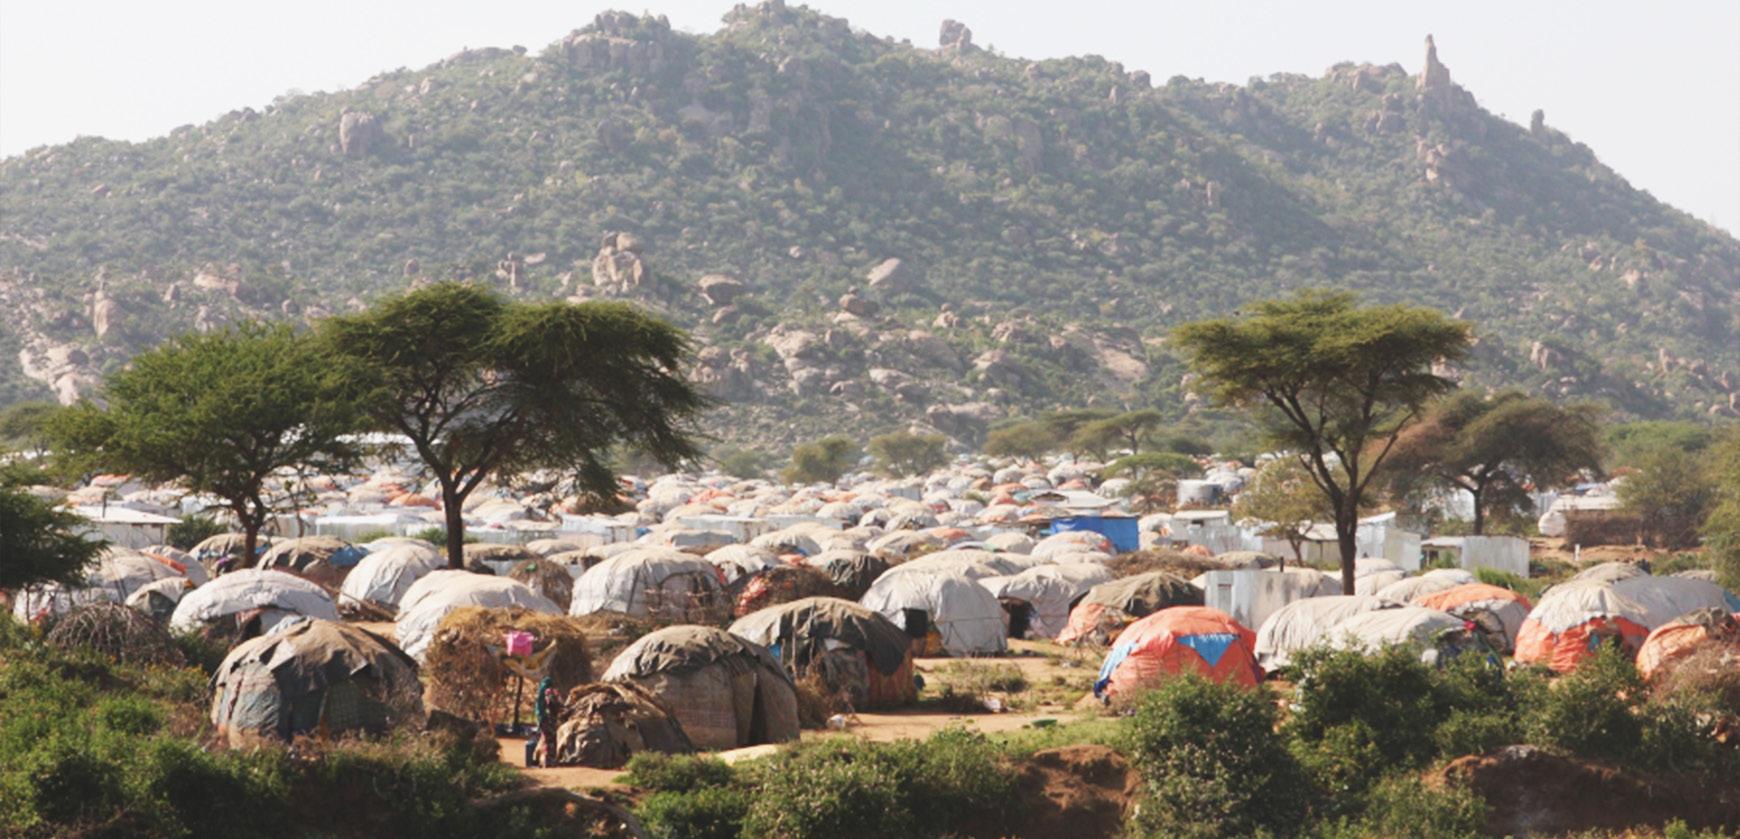
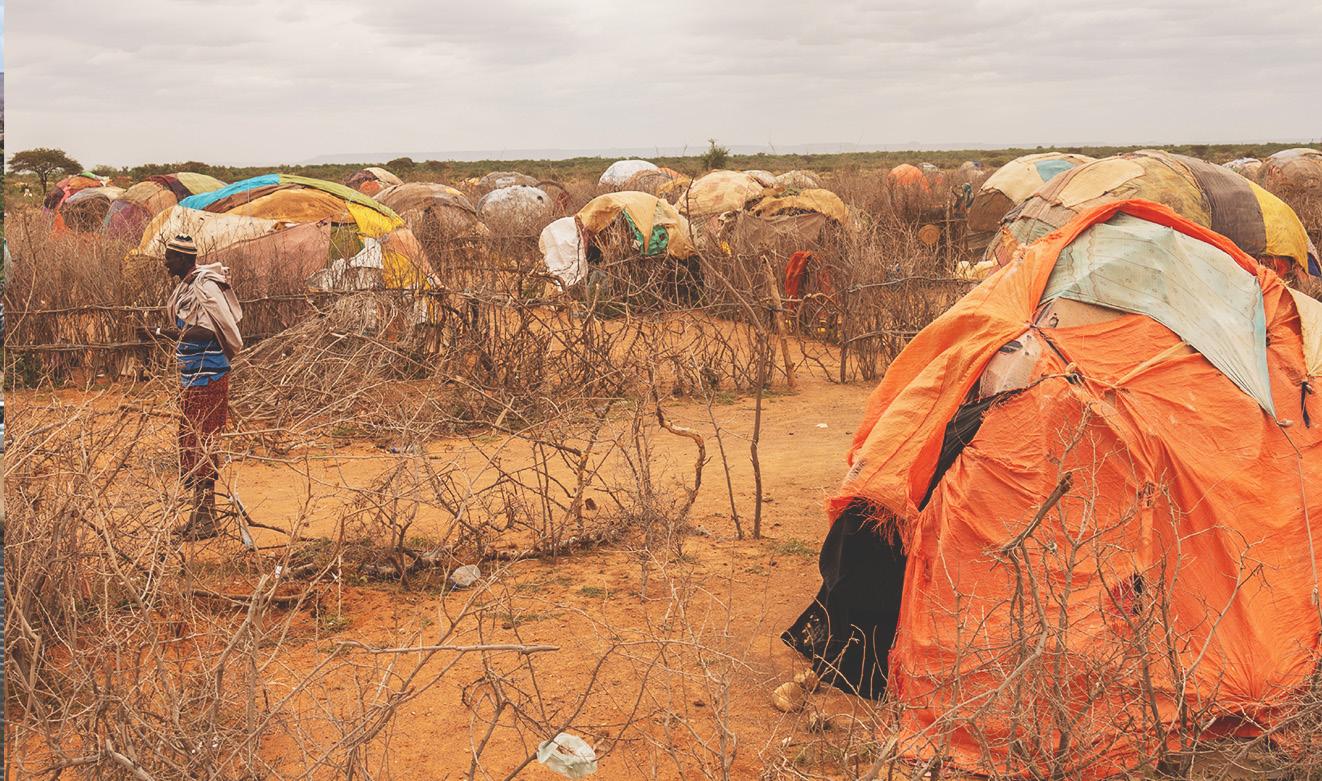
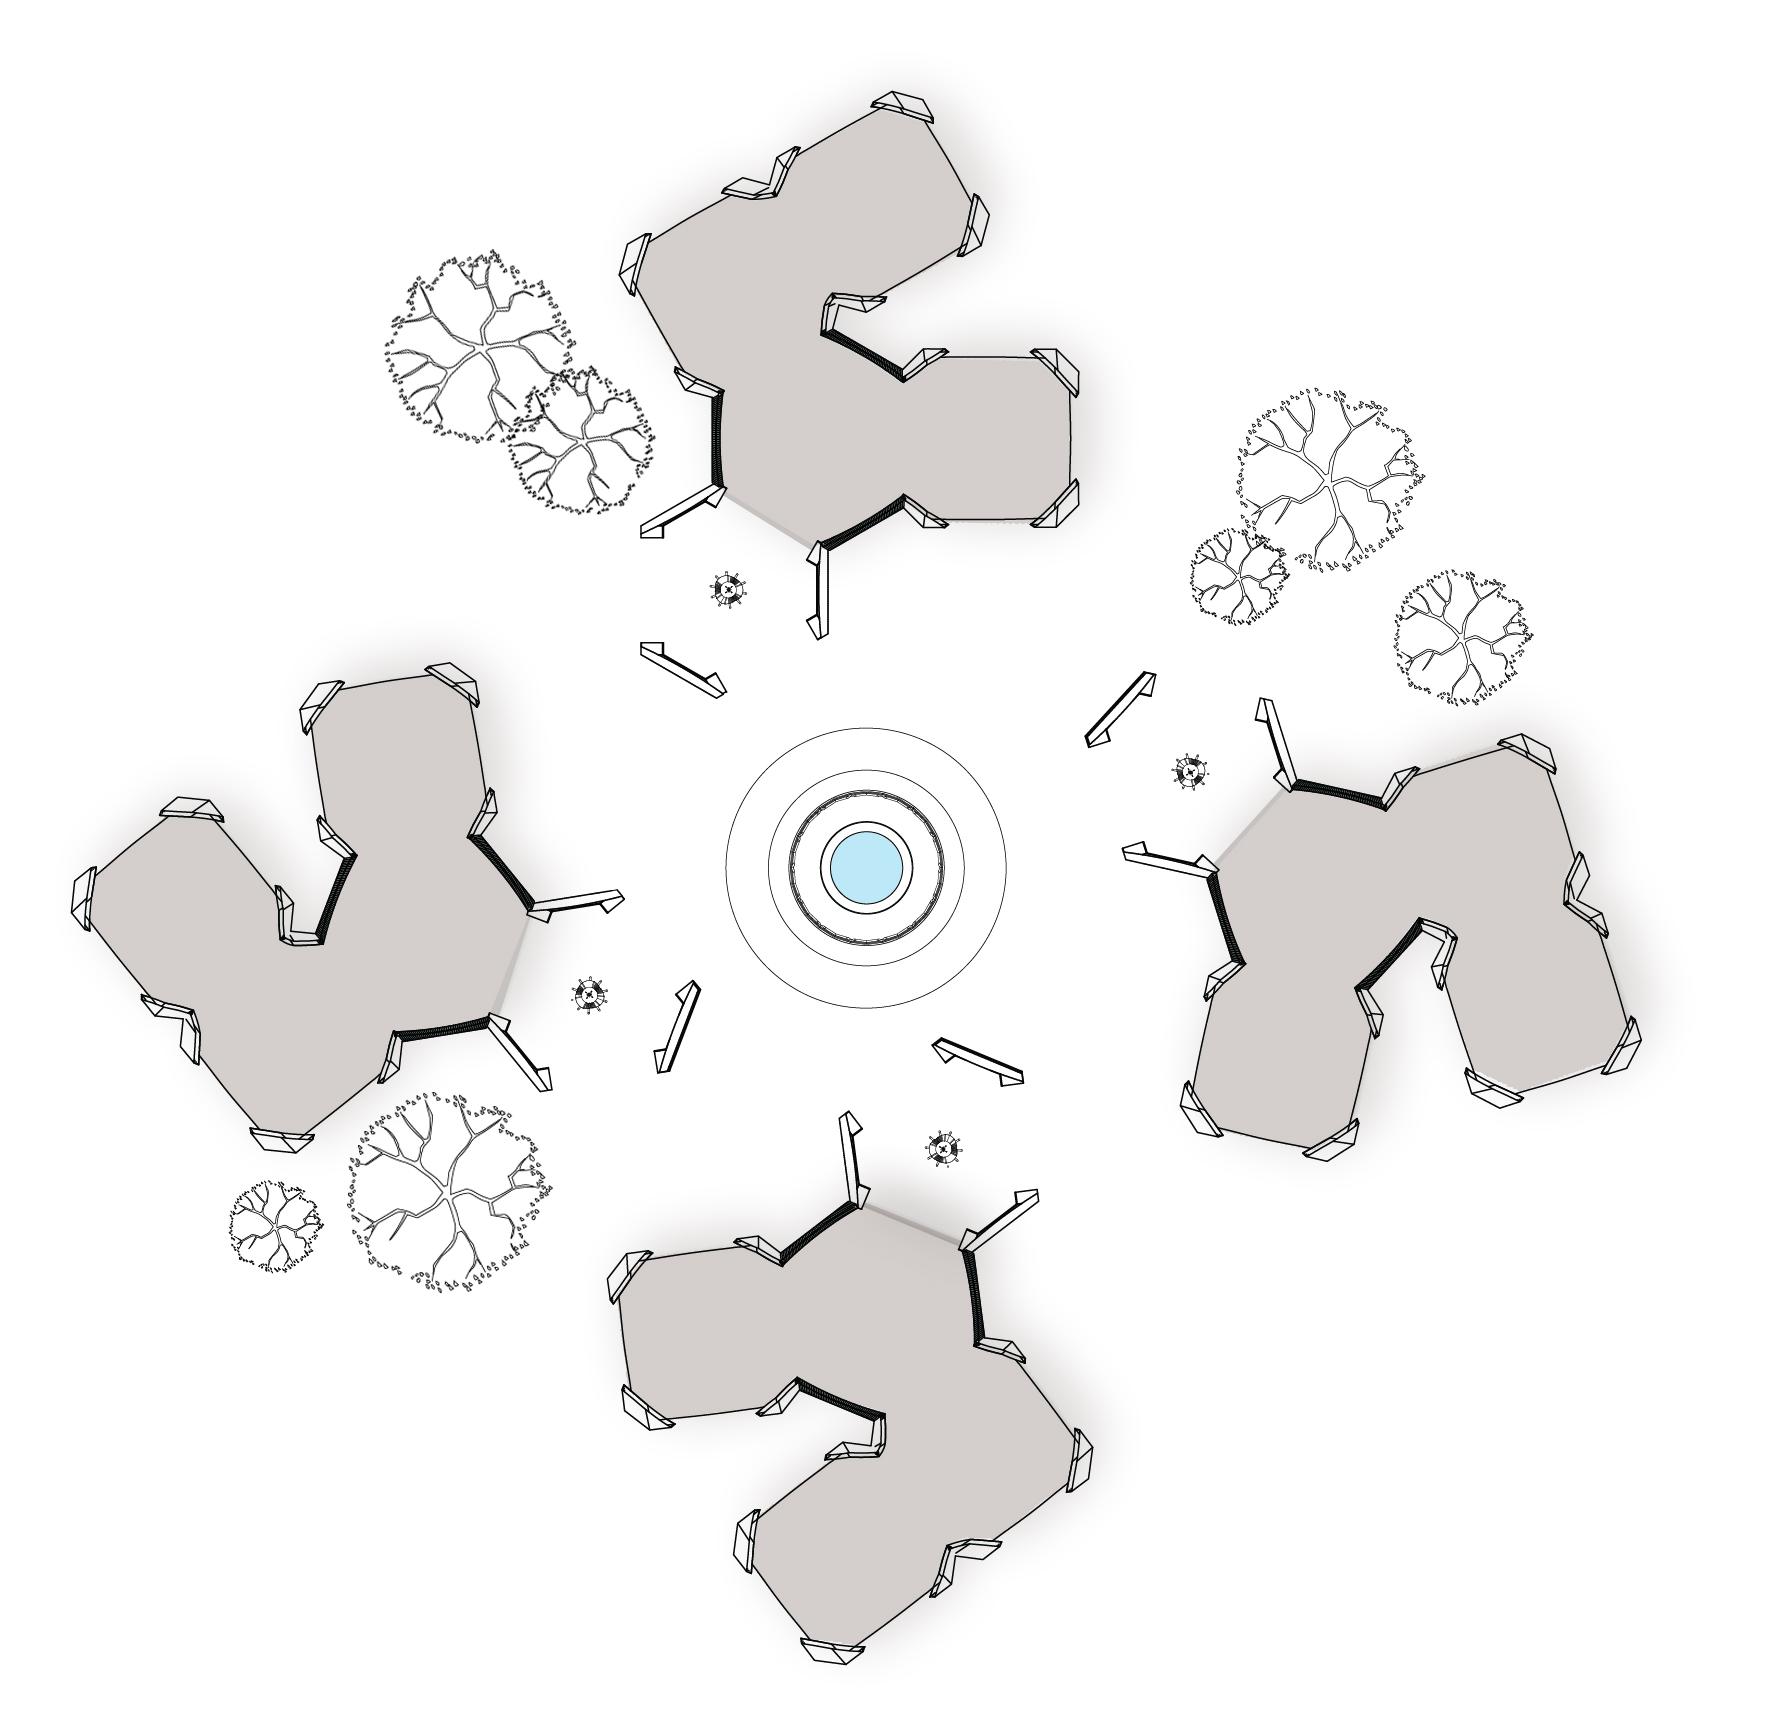
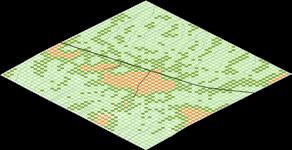
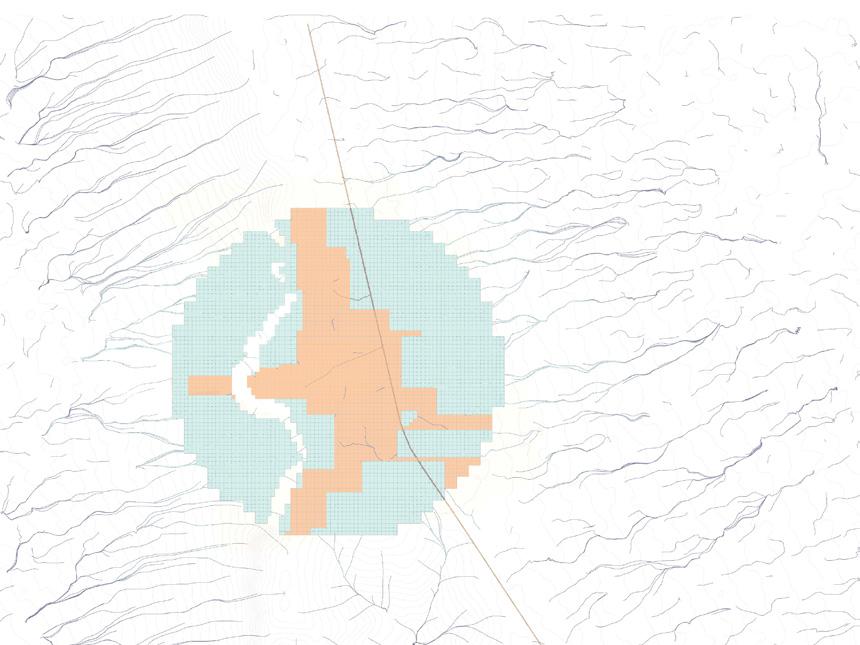
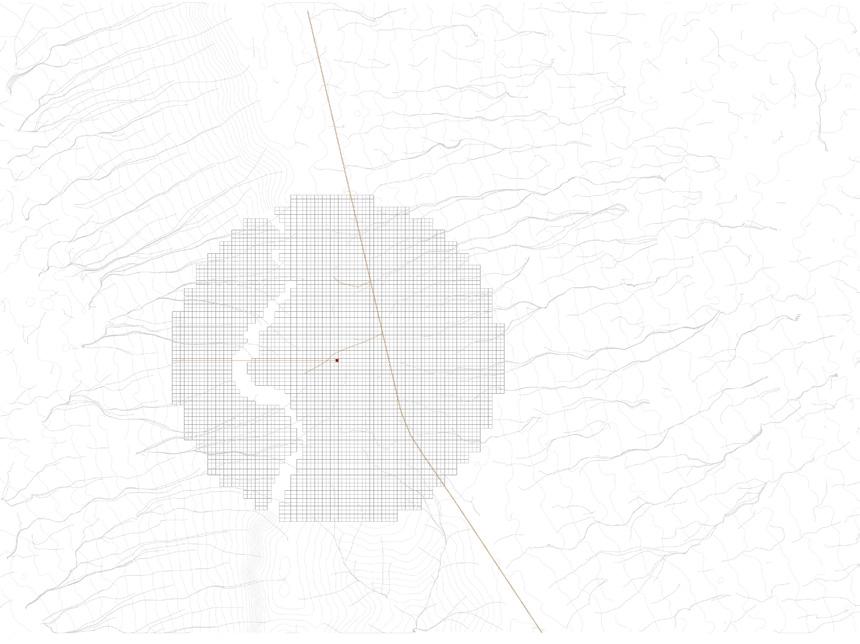
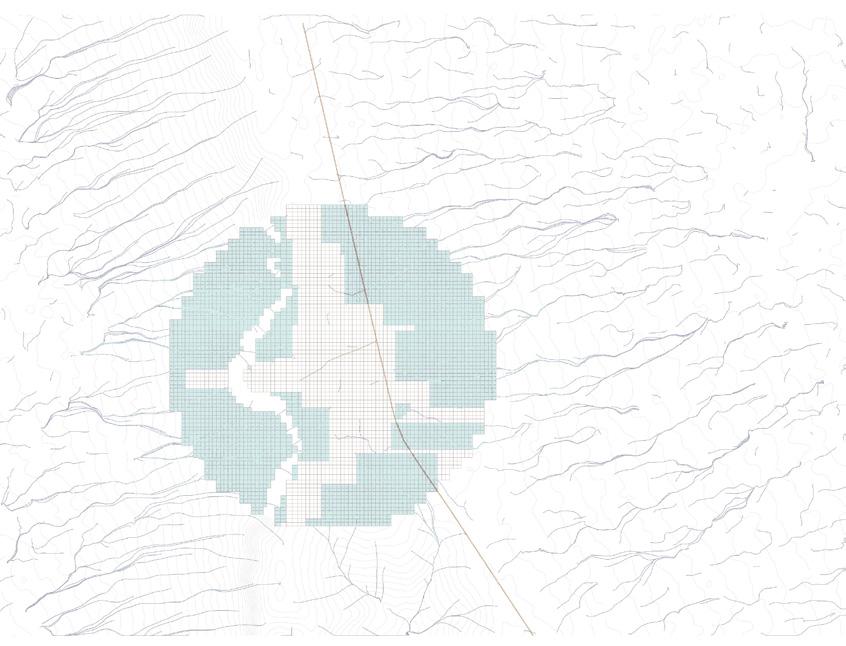
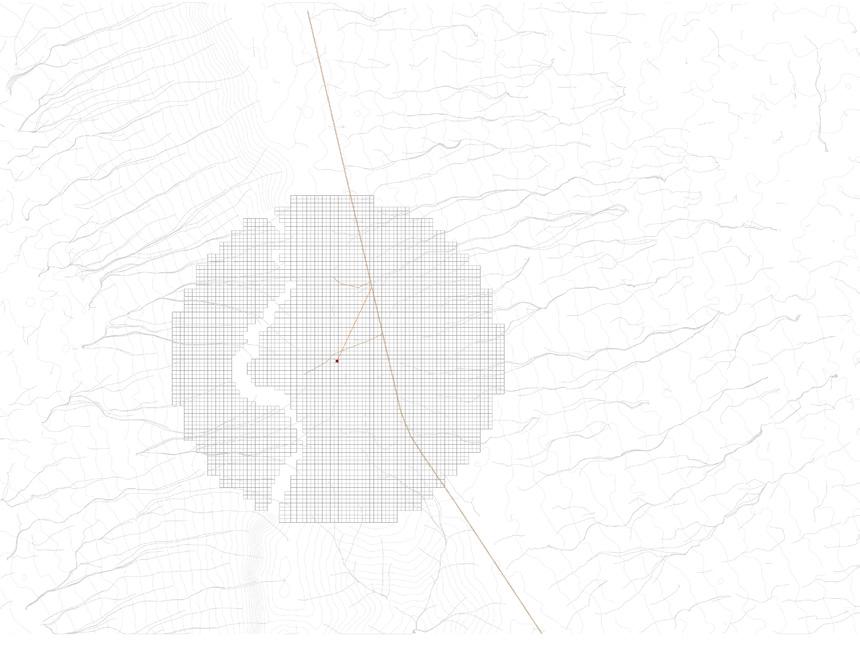
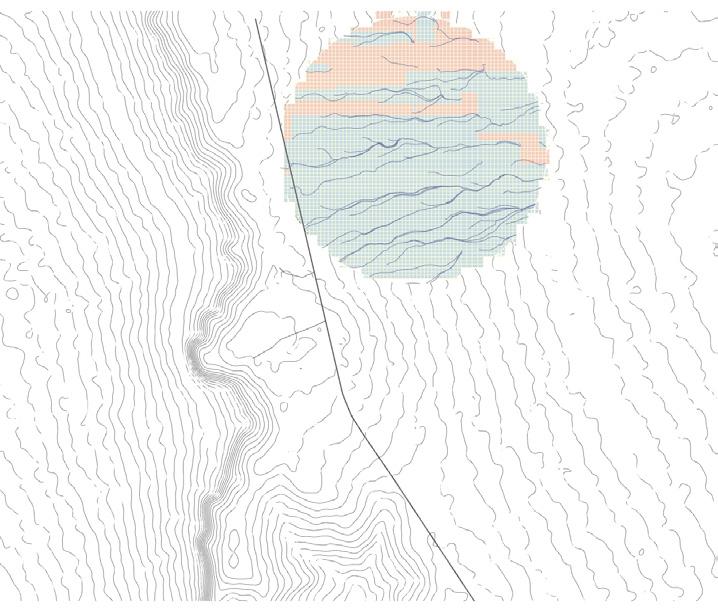
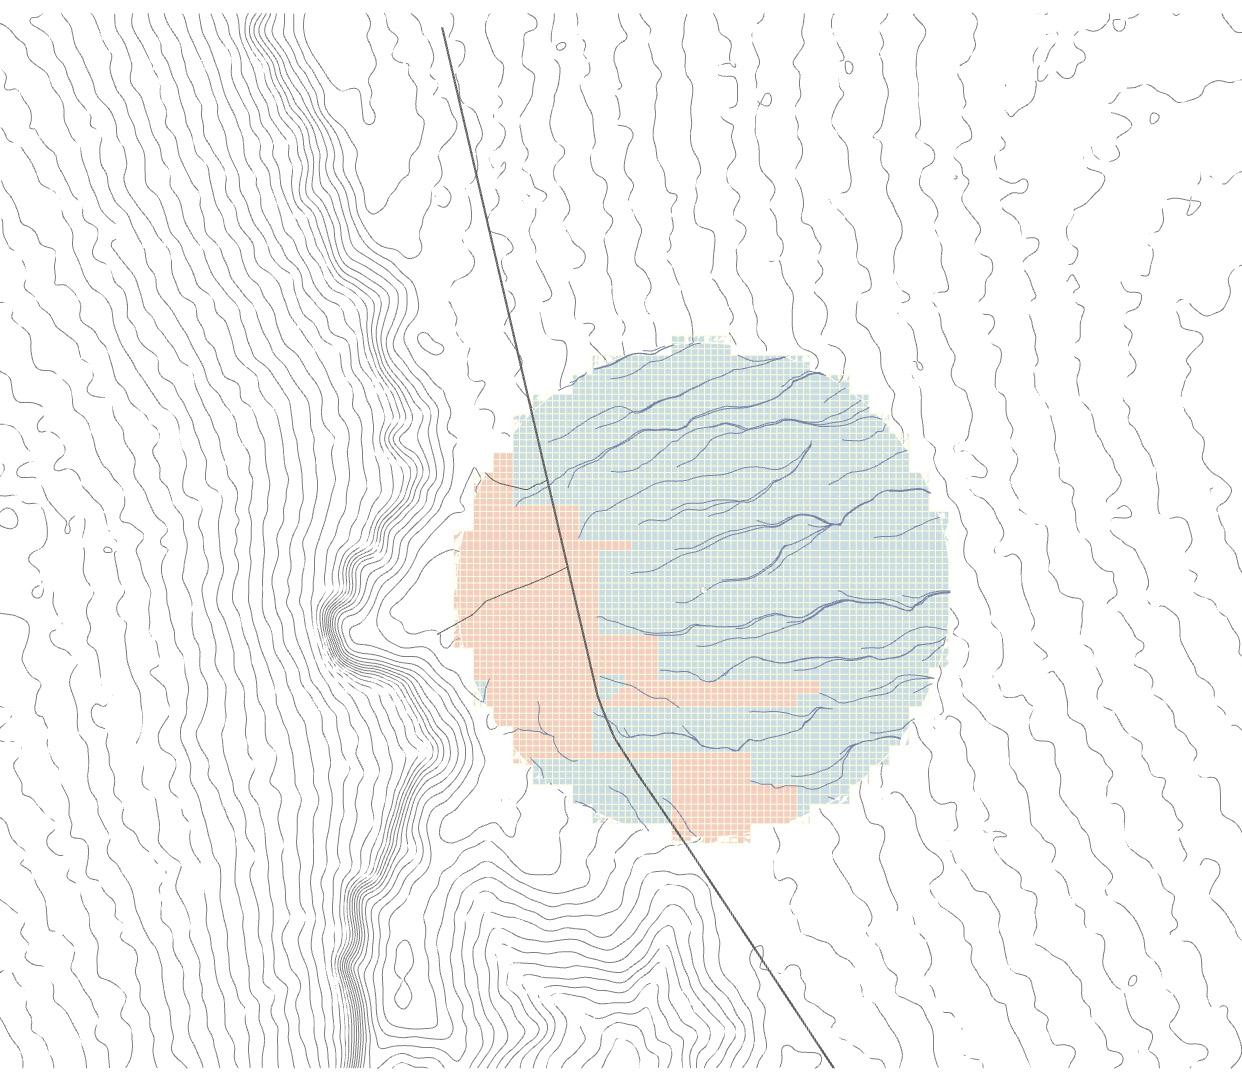
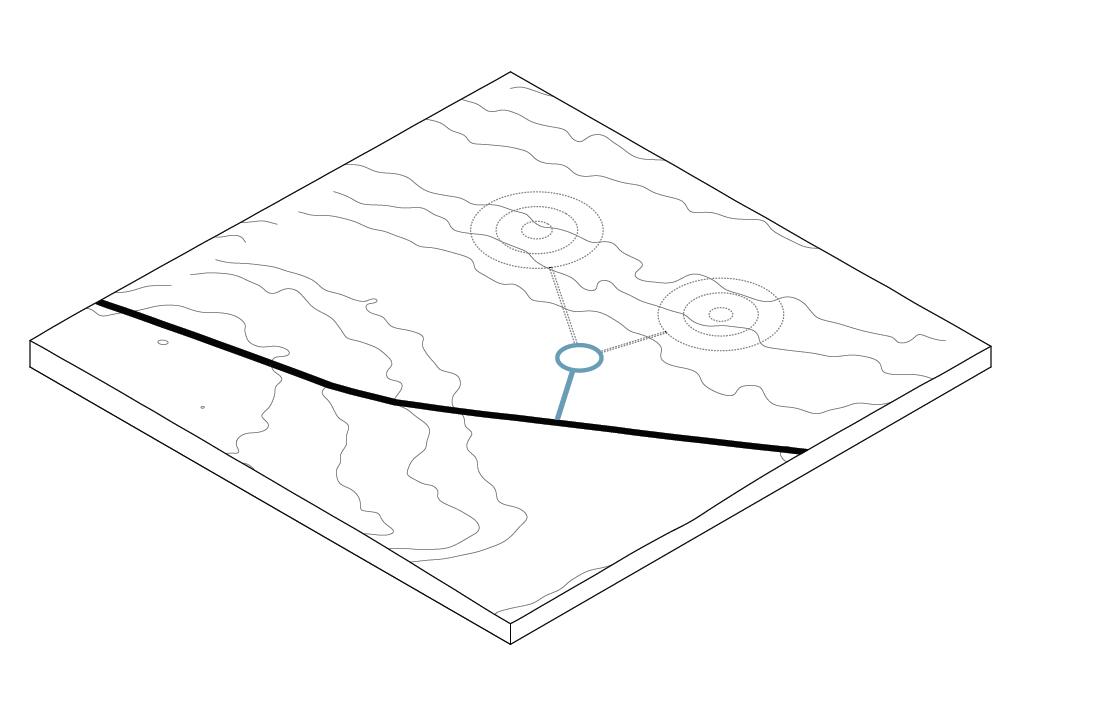
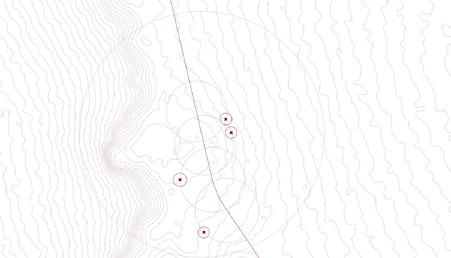
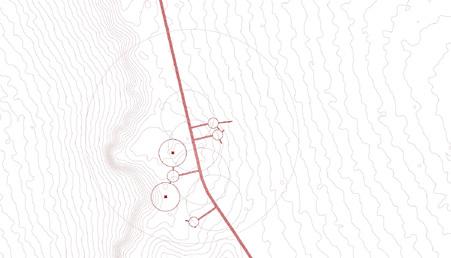
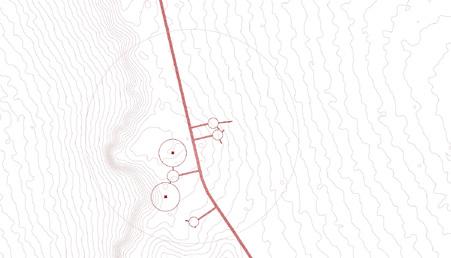
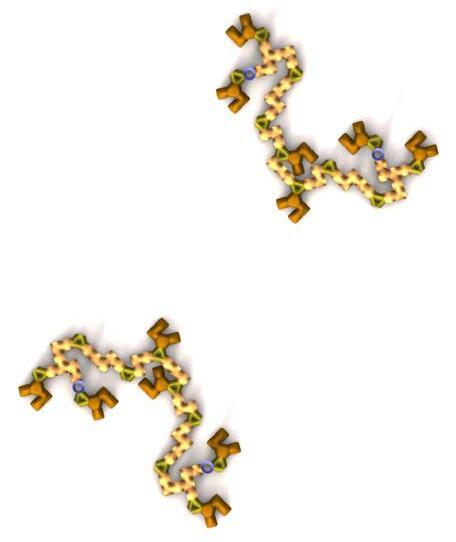
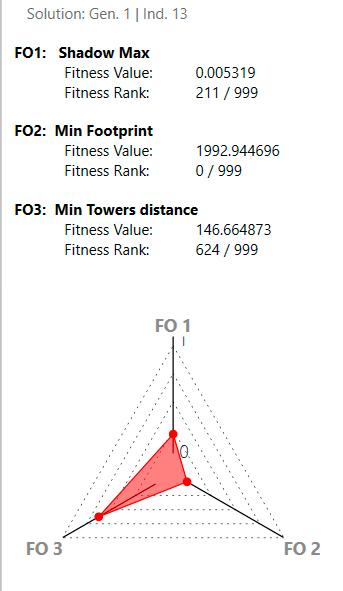
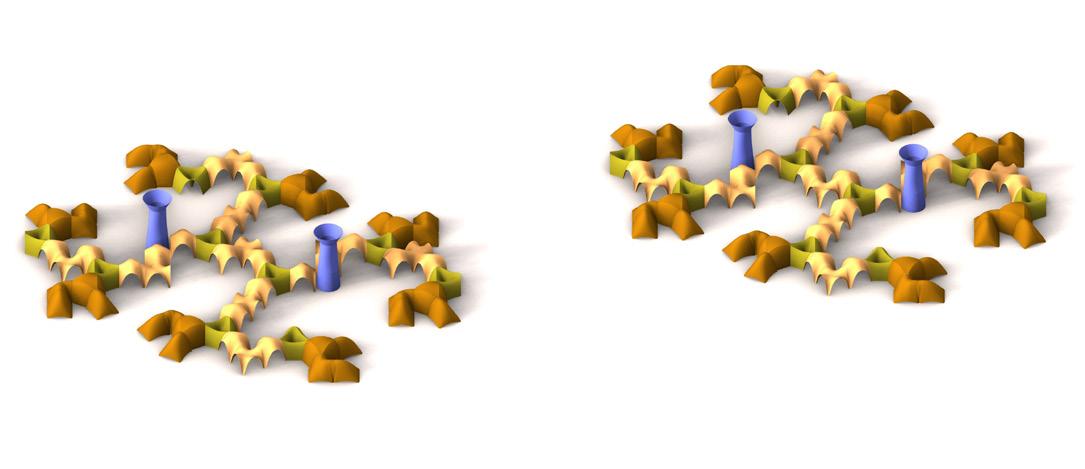
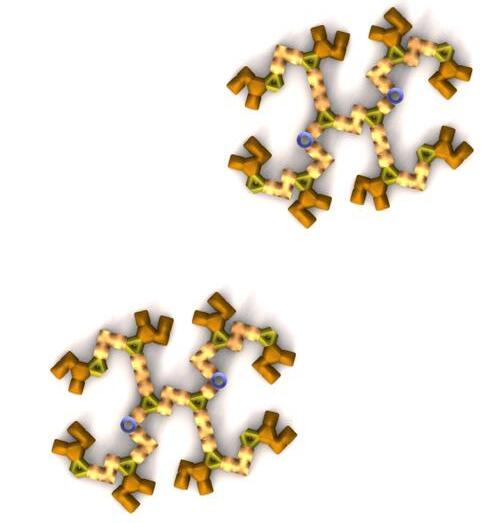
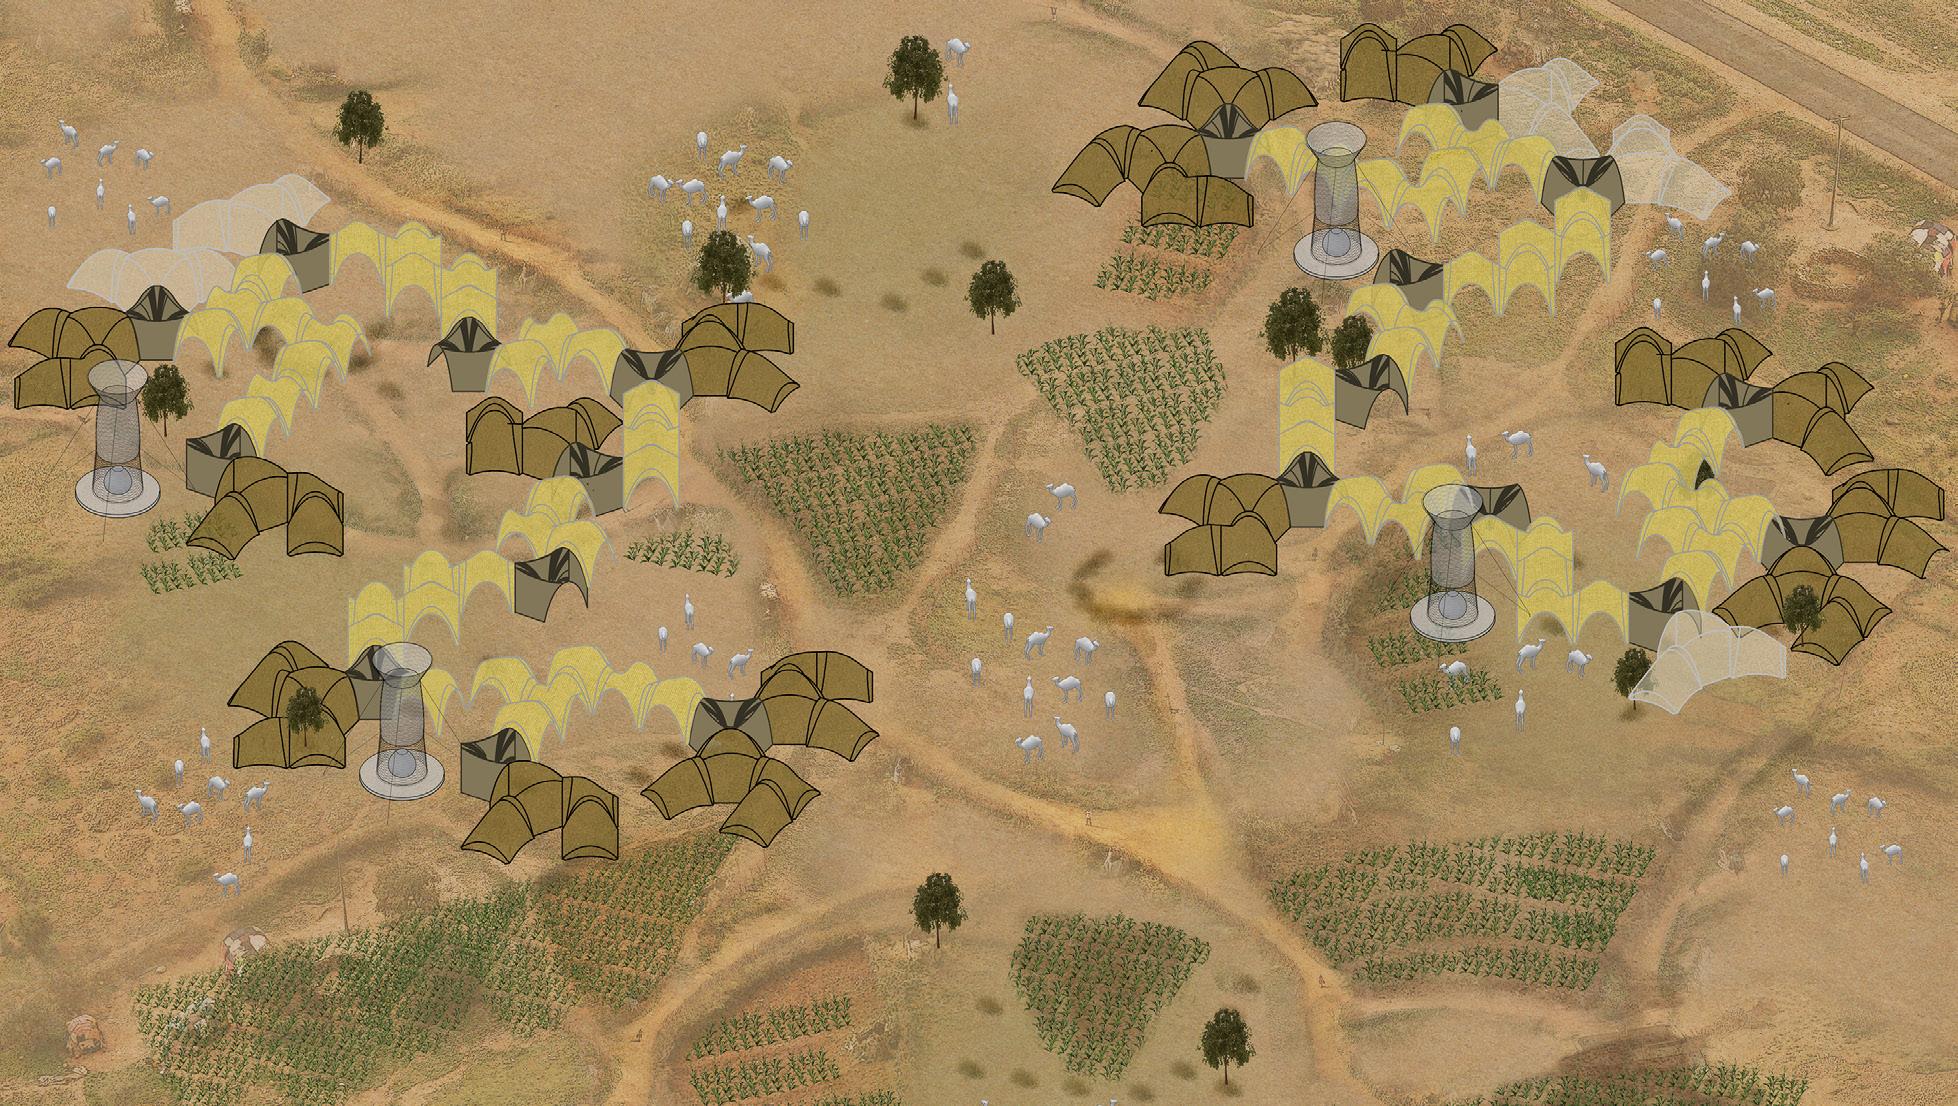
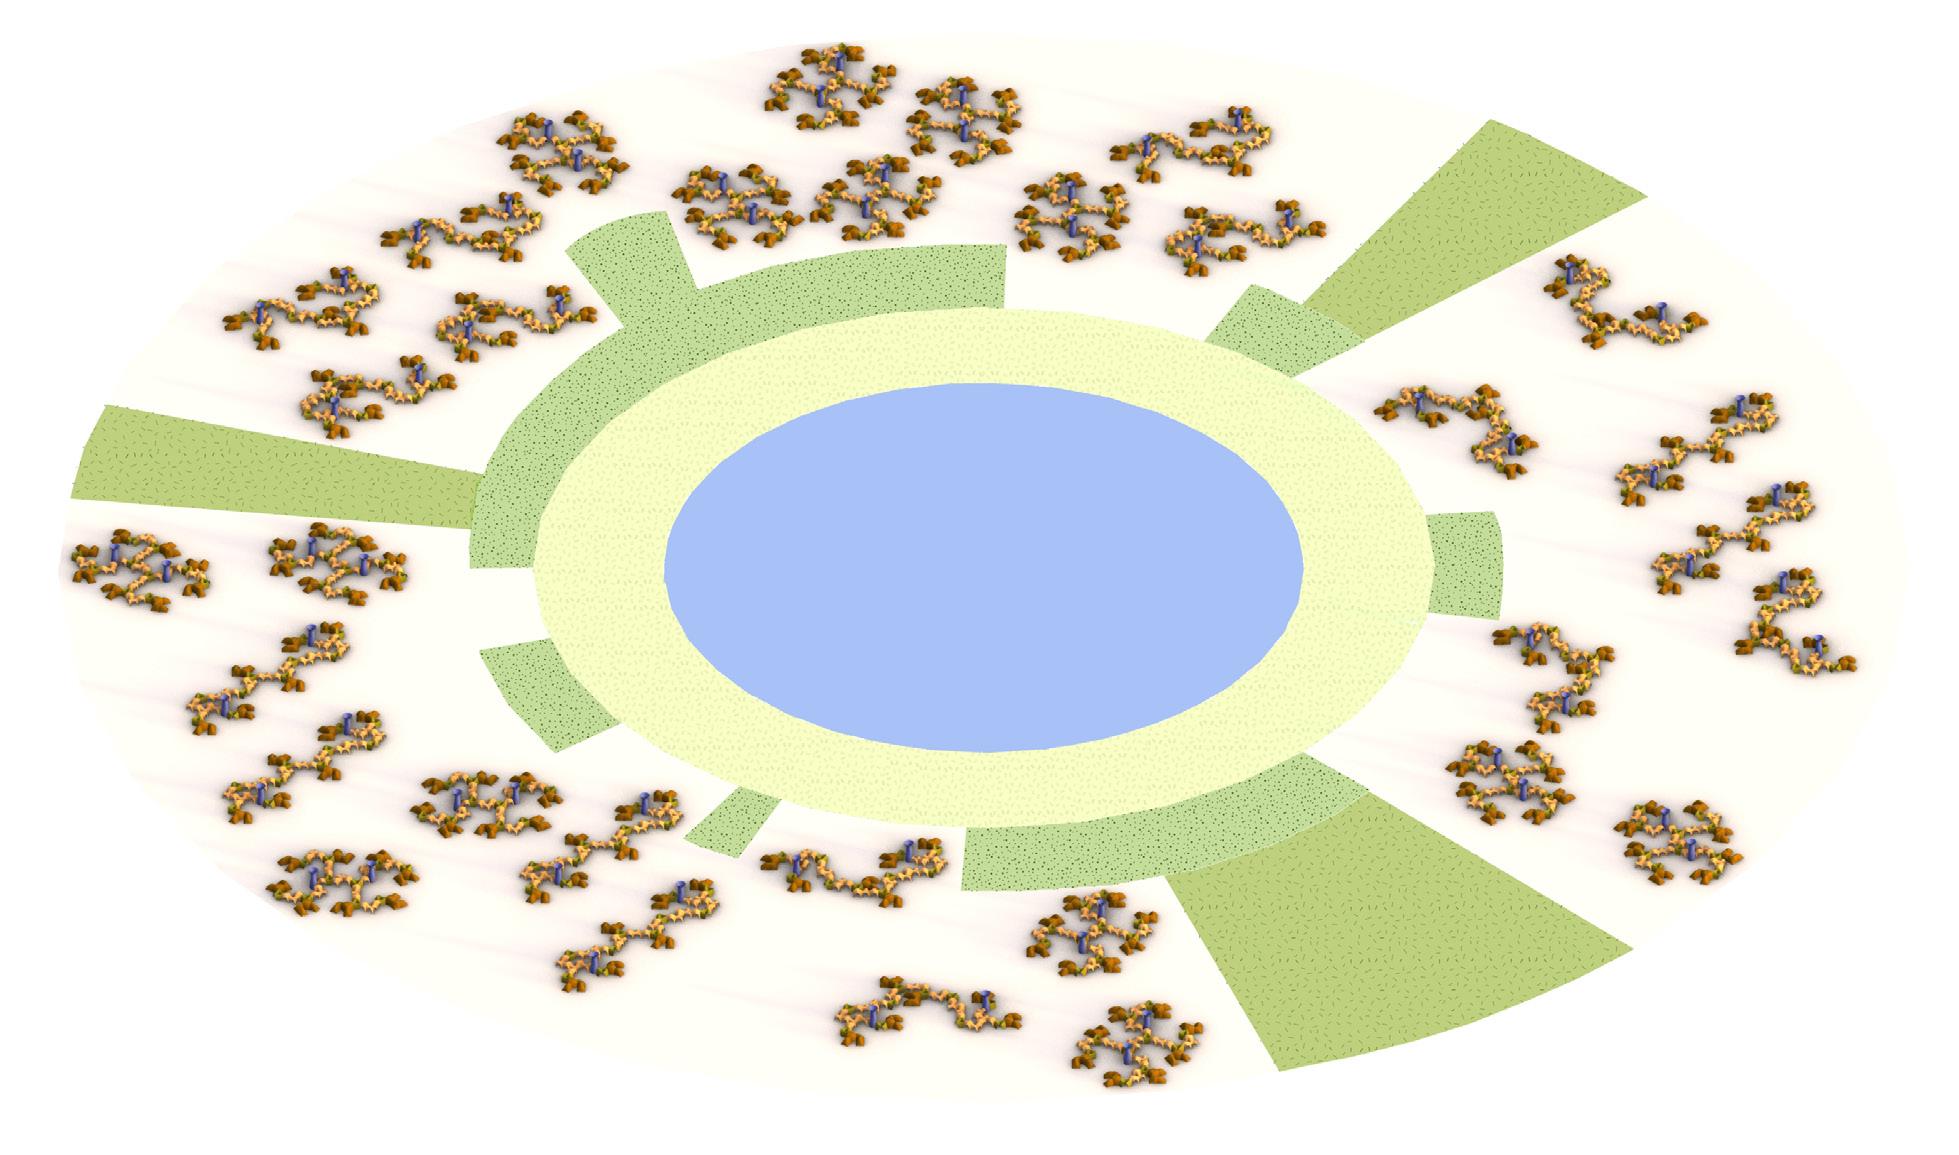
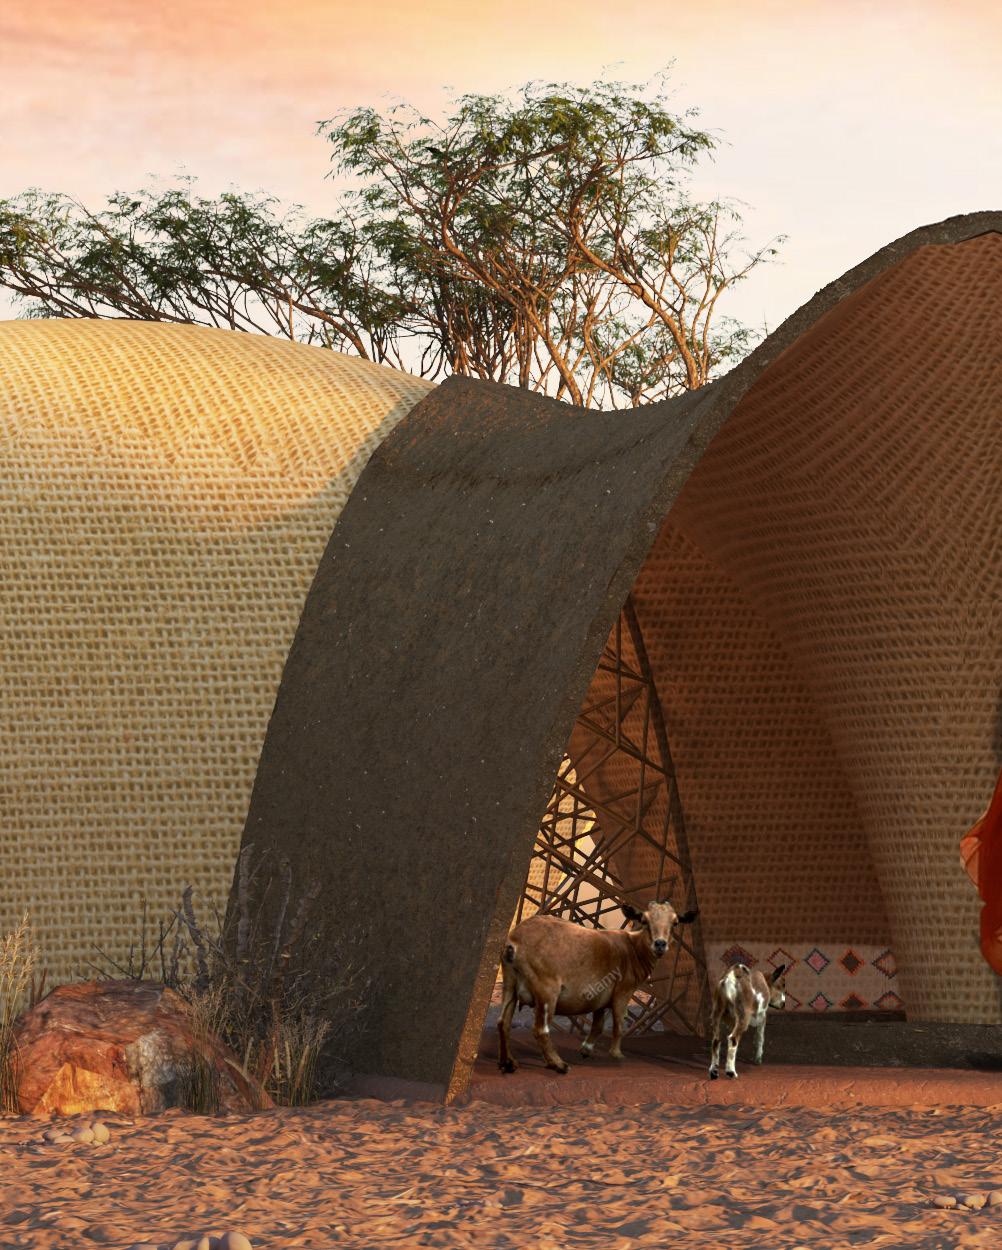
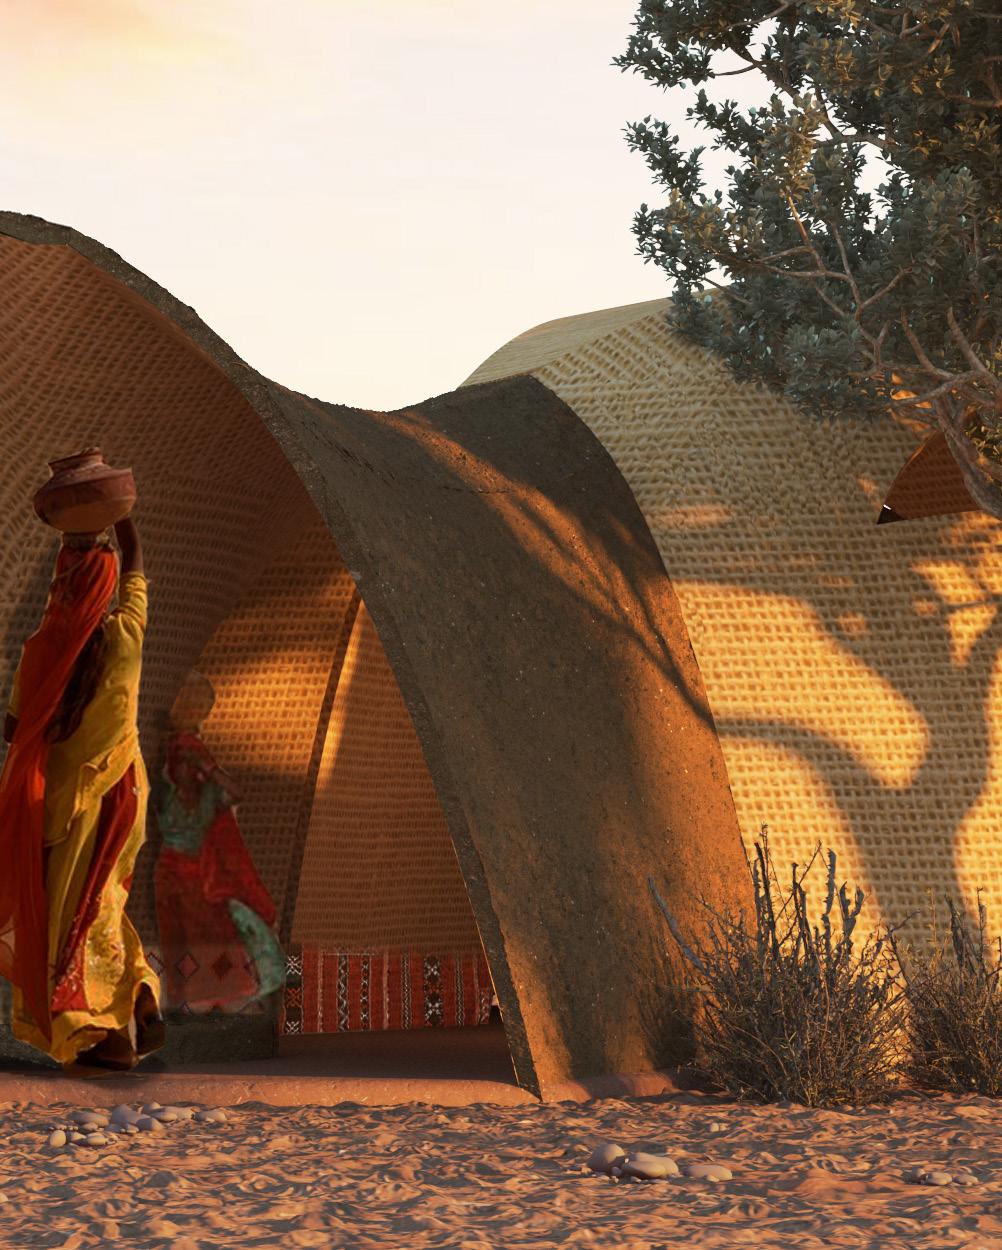
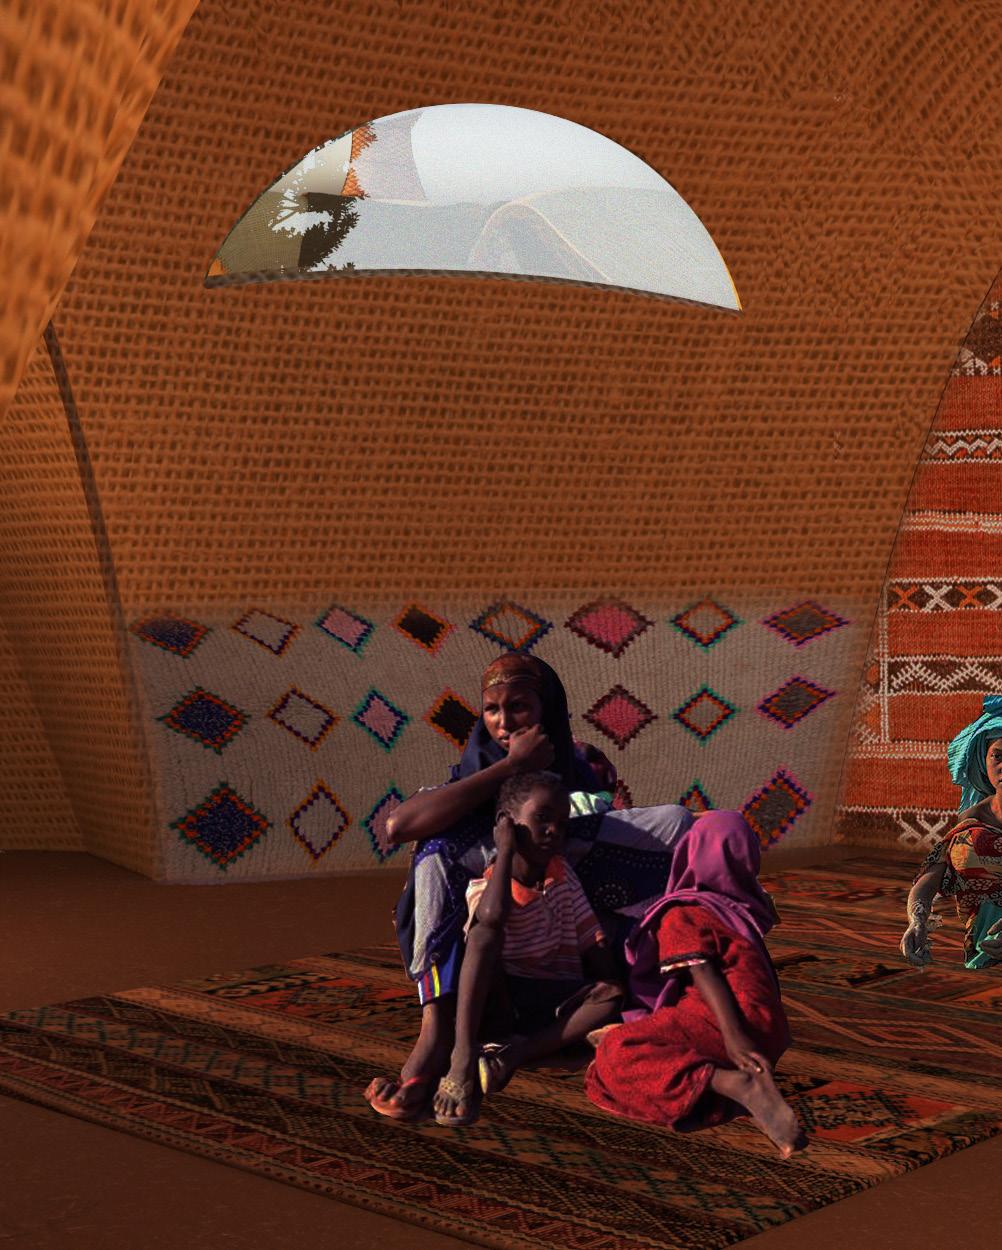
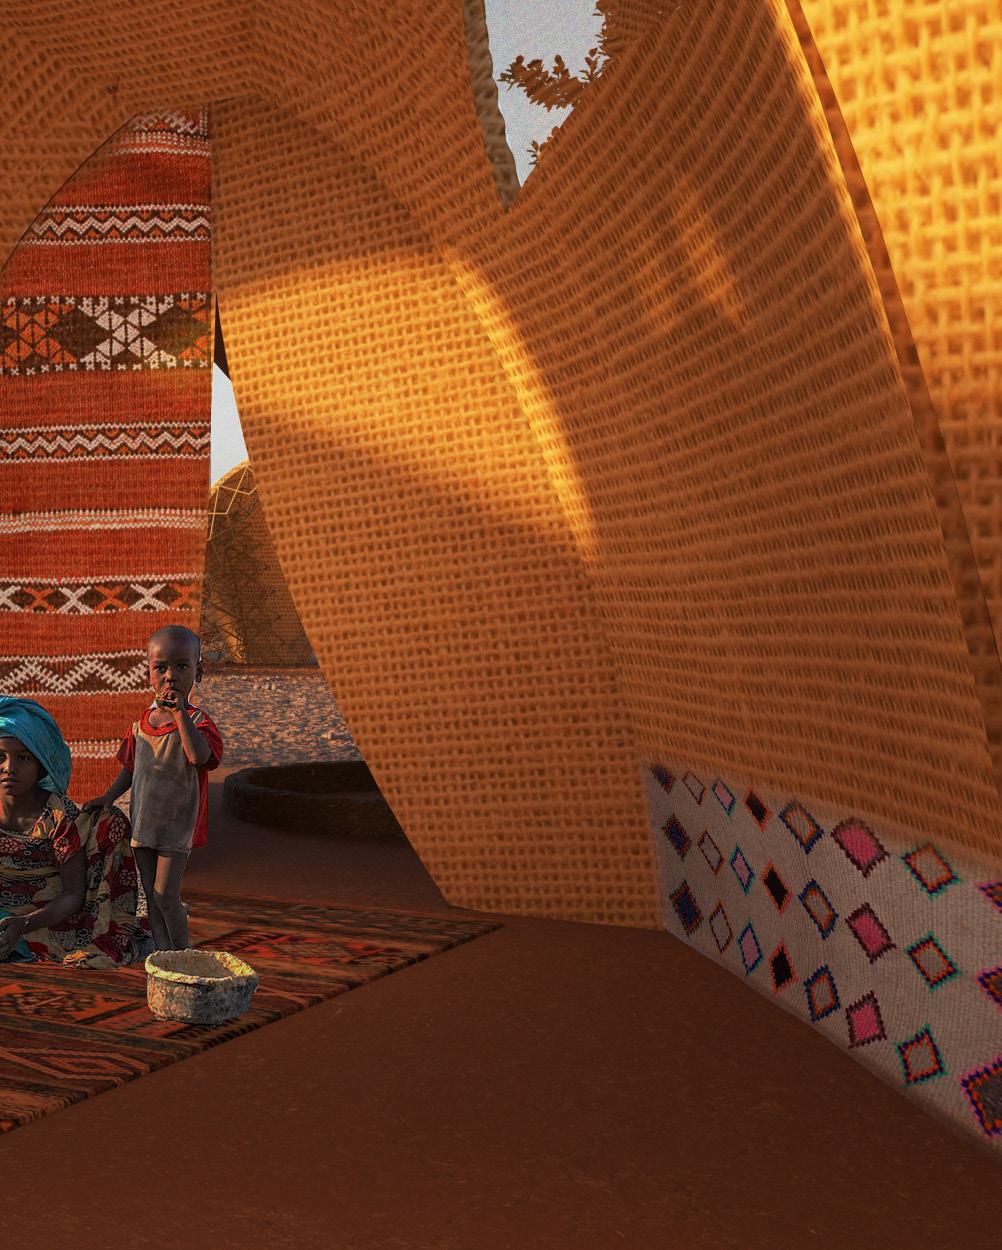
The thesis investigates the potential for the generation and development of a resilient rural community capable of harvesting rain and atmospheric water in the context of an arid/semi-arid environment located in the Somali region of Ethiopia, Eastern Africa.
The current situation in the region was studied, quantifying water requirements and potential water collection, as well as local materials available, vernacular construction techniques and traditional housing typologies.
The research focuses on the design and fabrication strategy for a settlement that could permanently house and ensure the necessary water and land for the development of refugees, IDPs and farmers whilst also temporarily housing pastoral groups during the dry season.
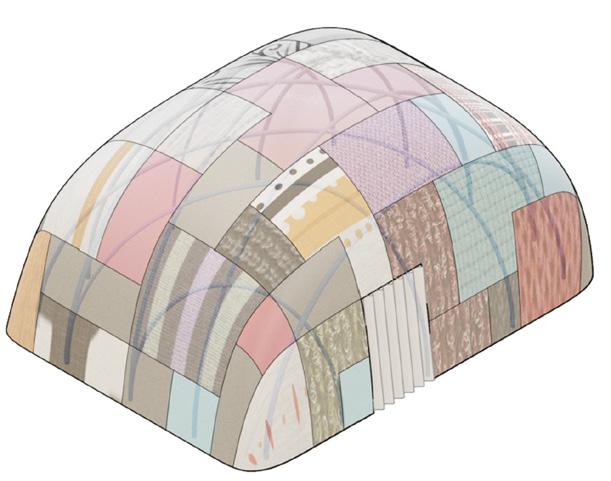
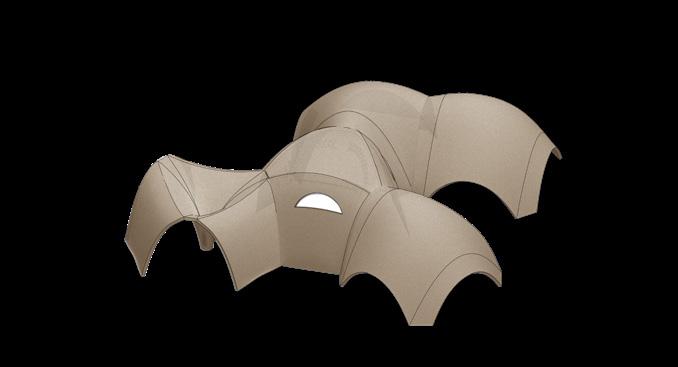
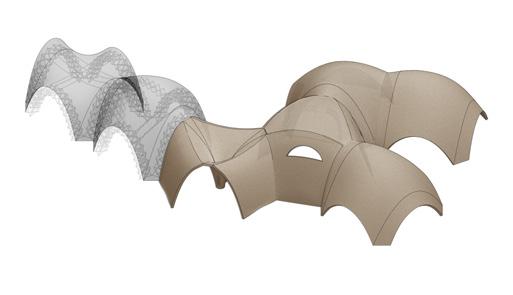
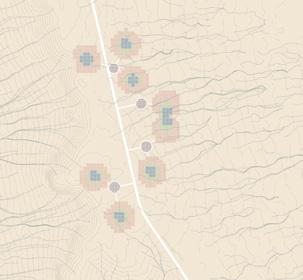
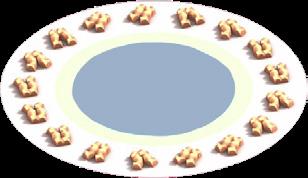
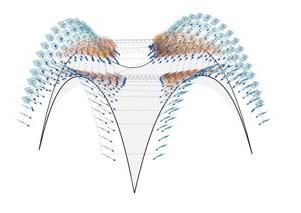
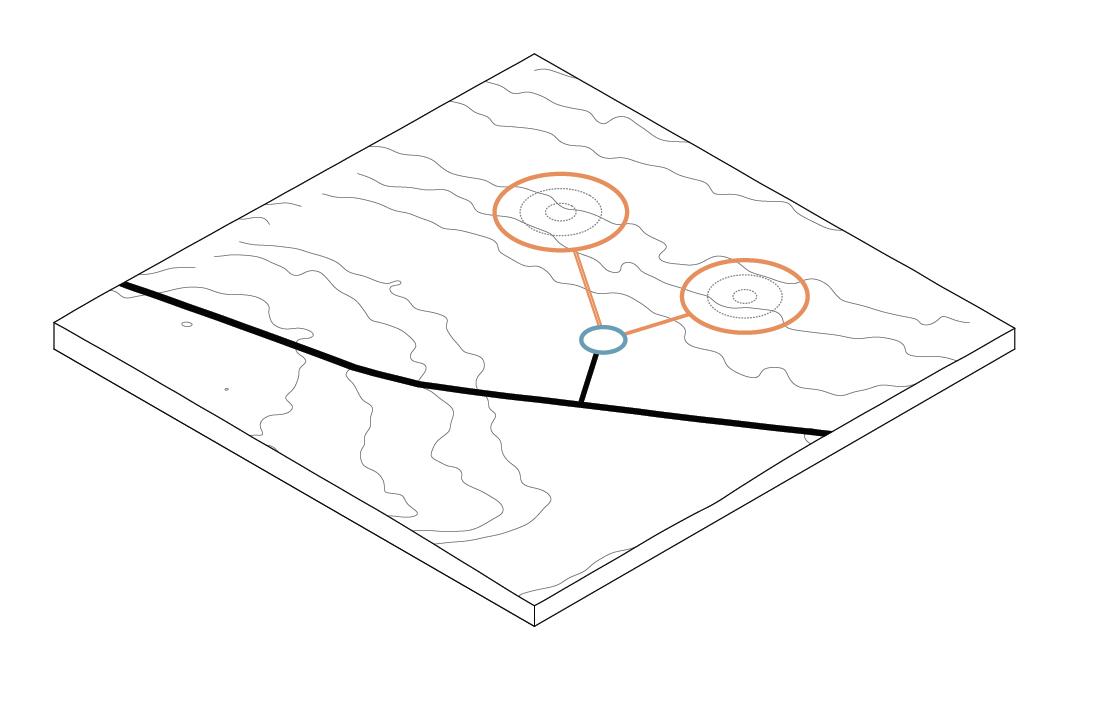
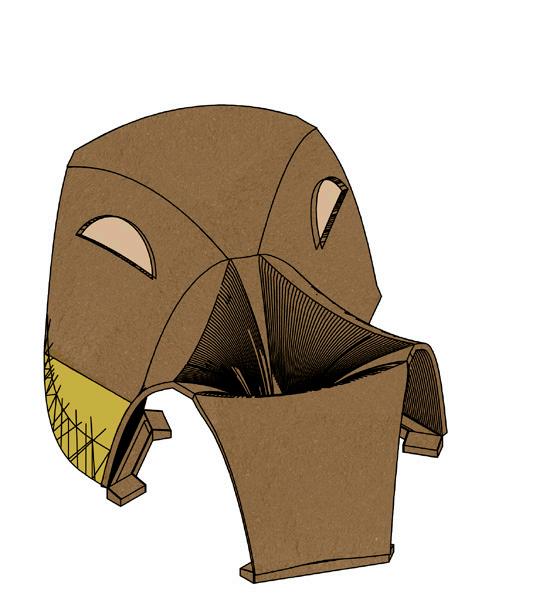
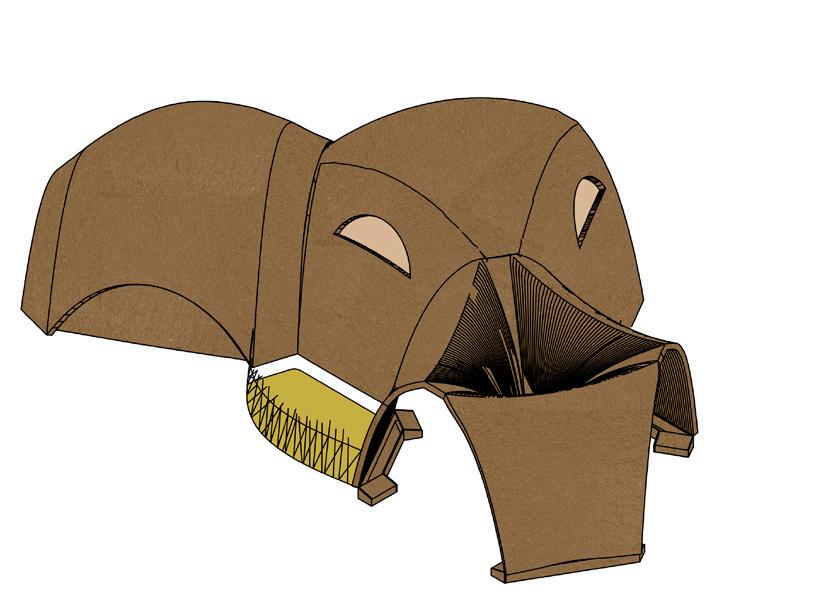
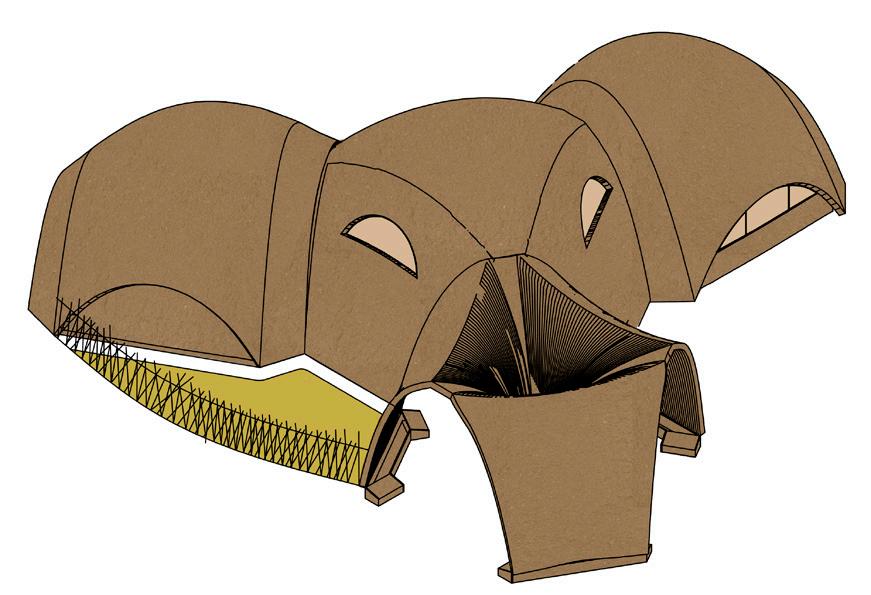
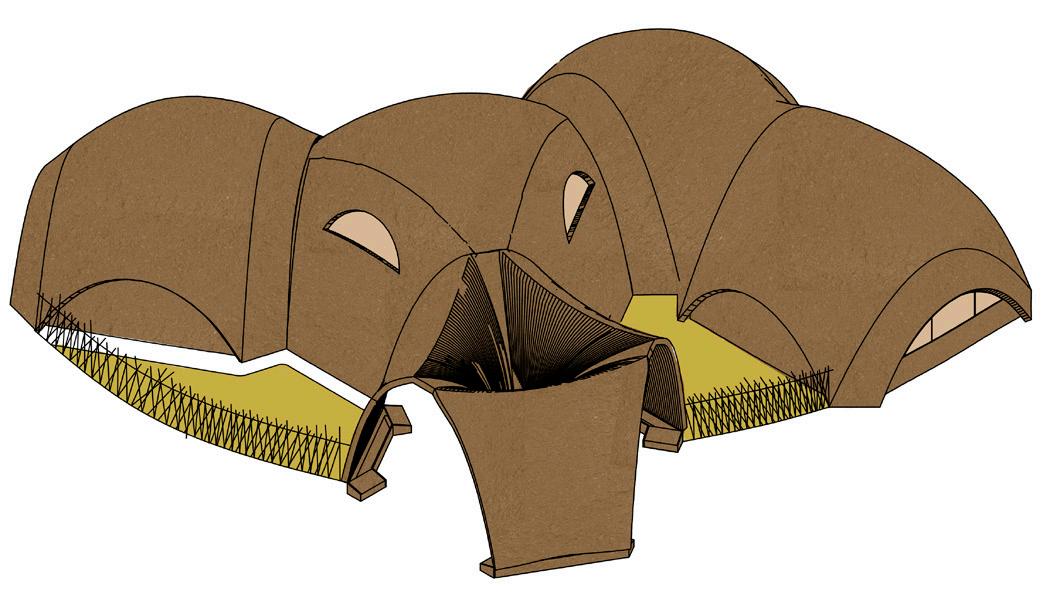
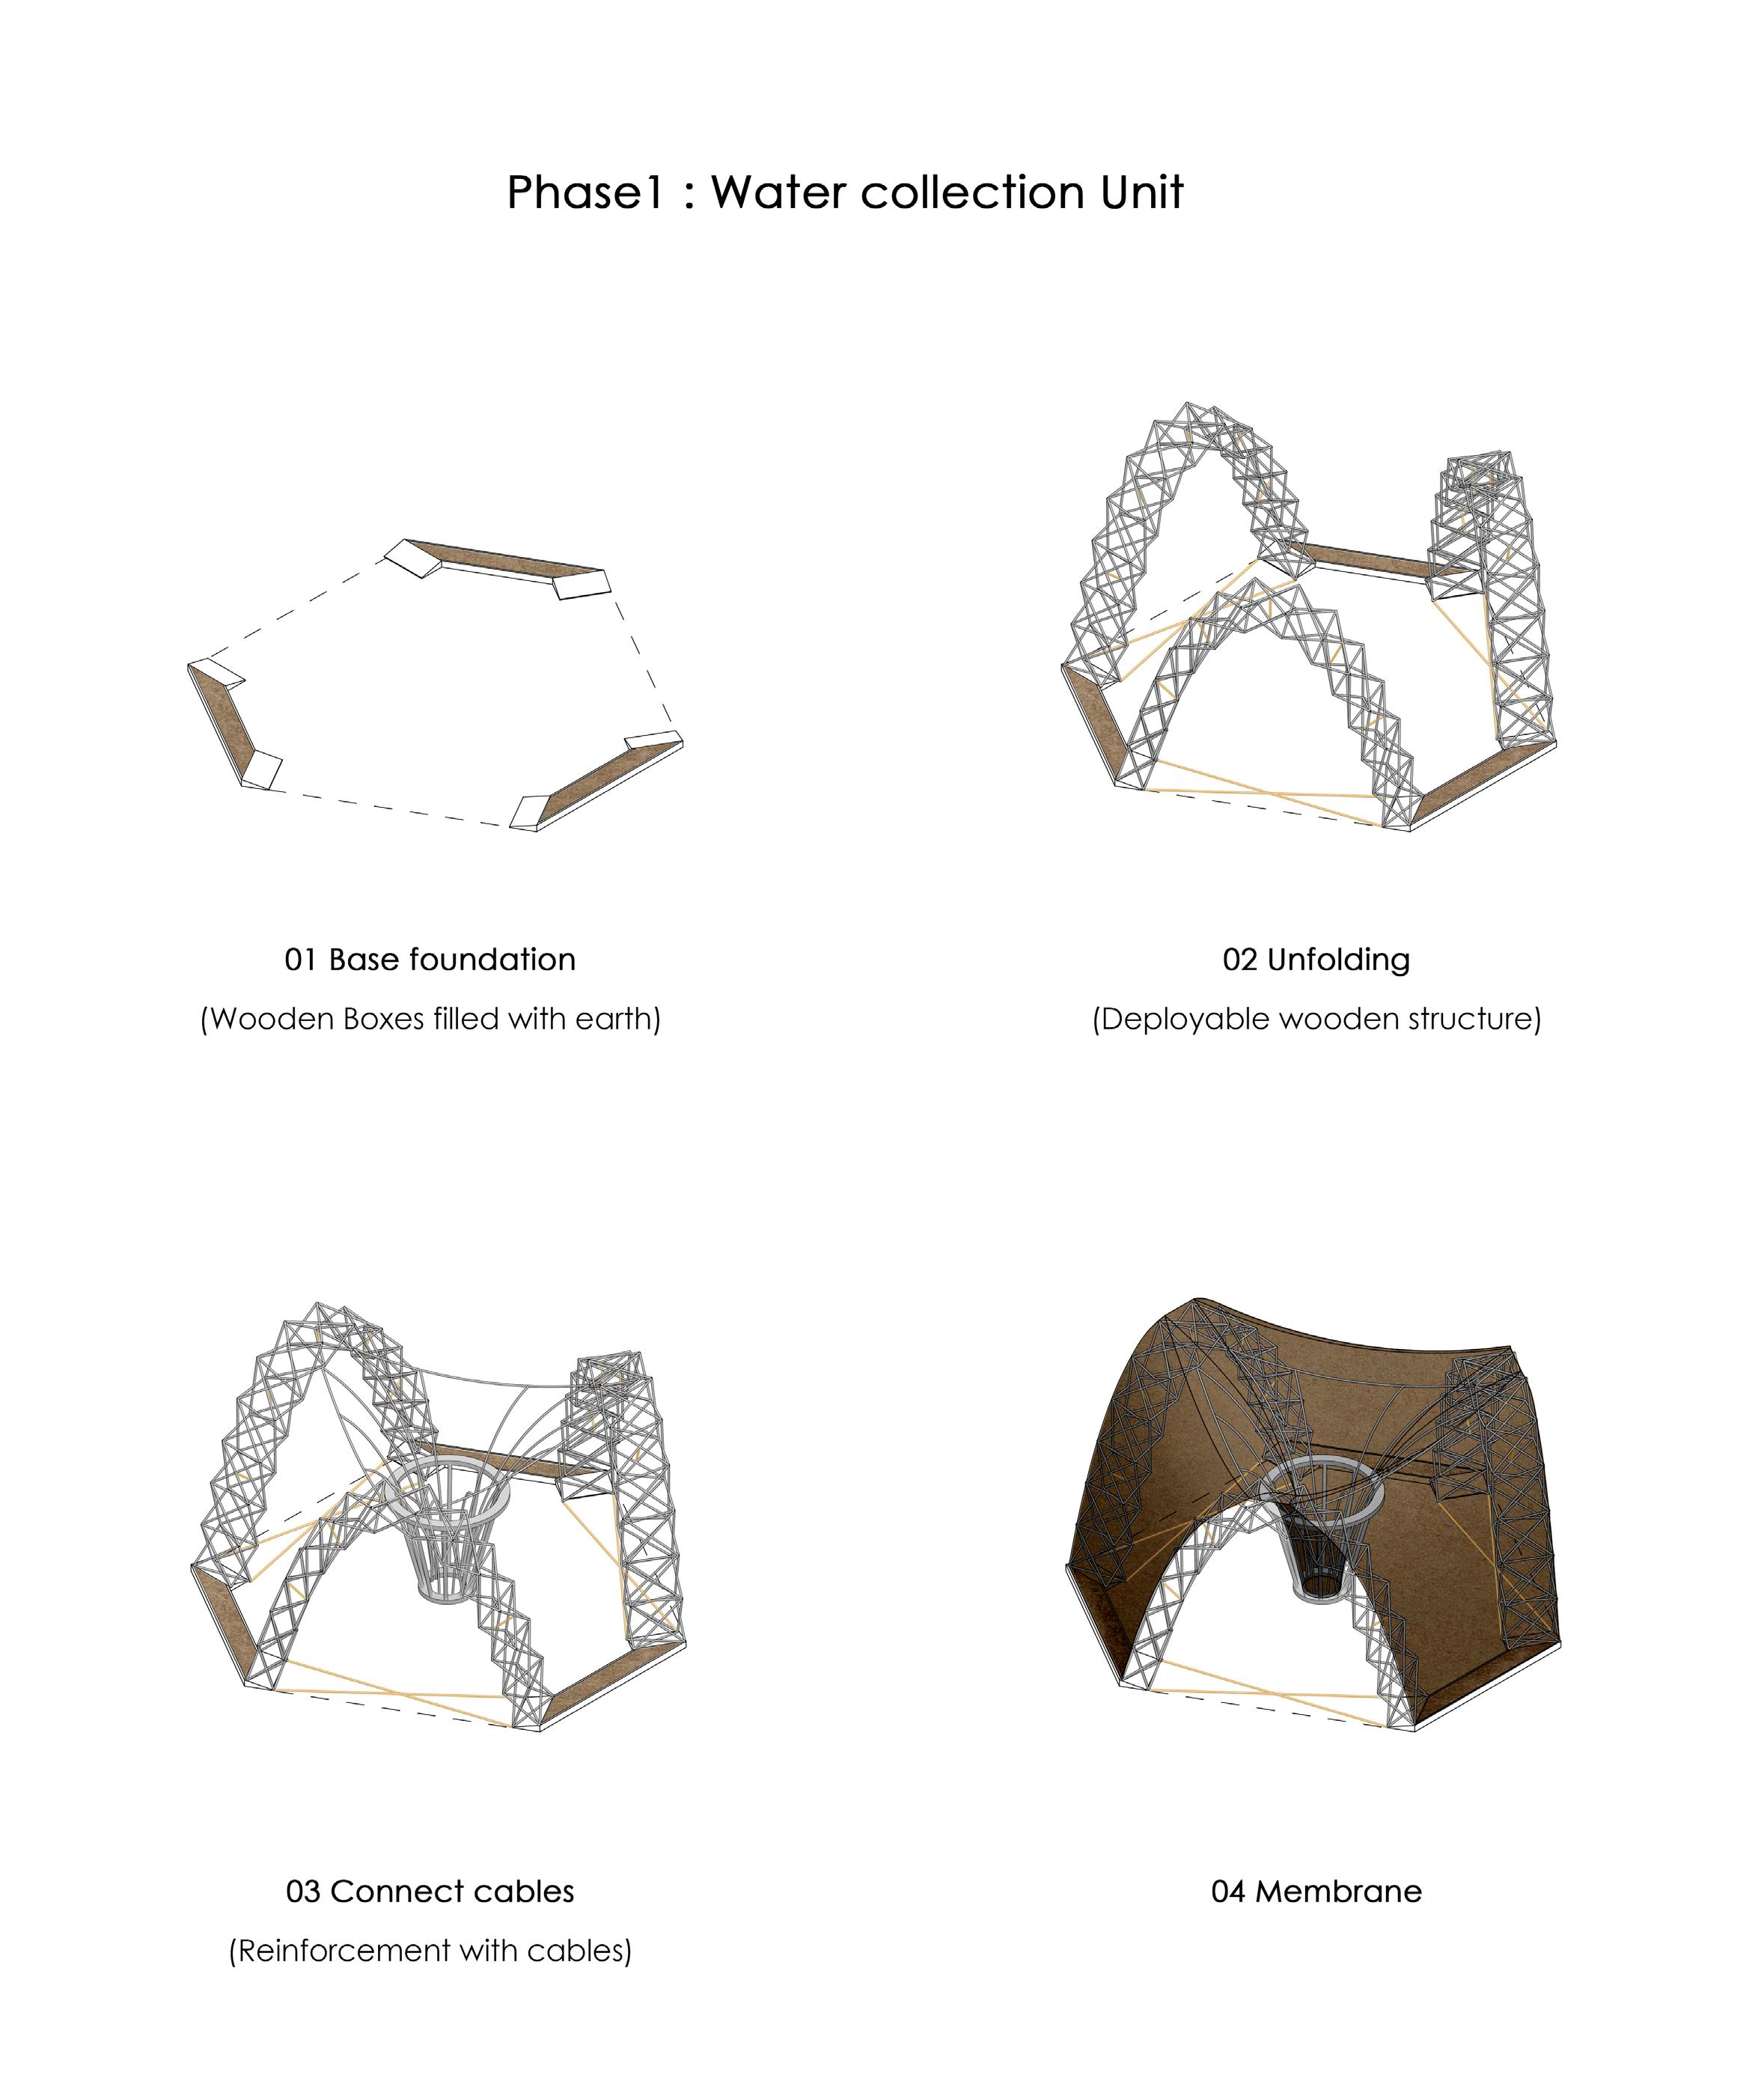
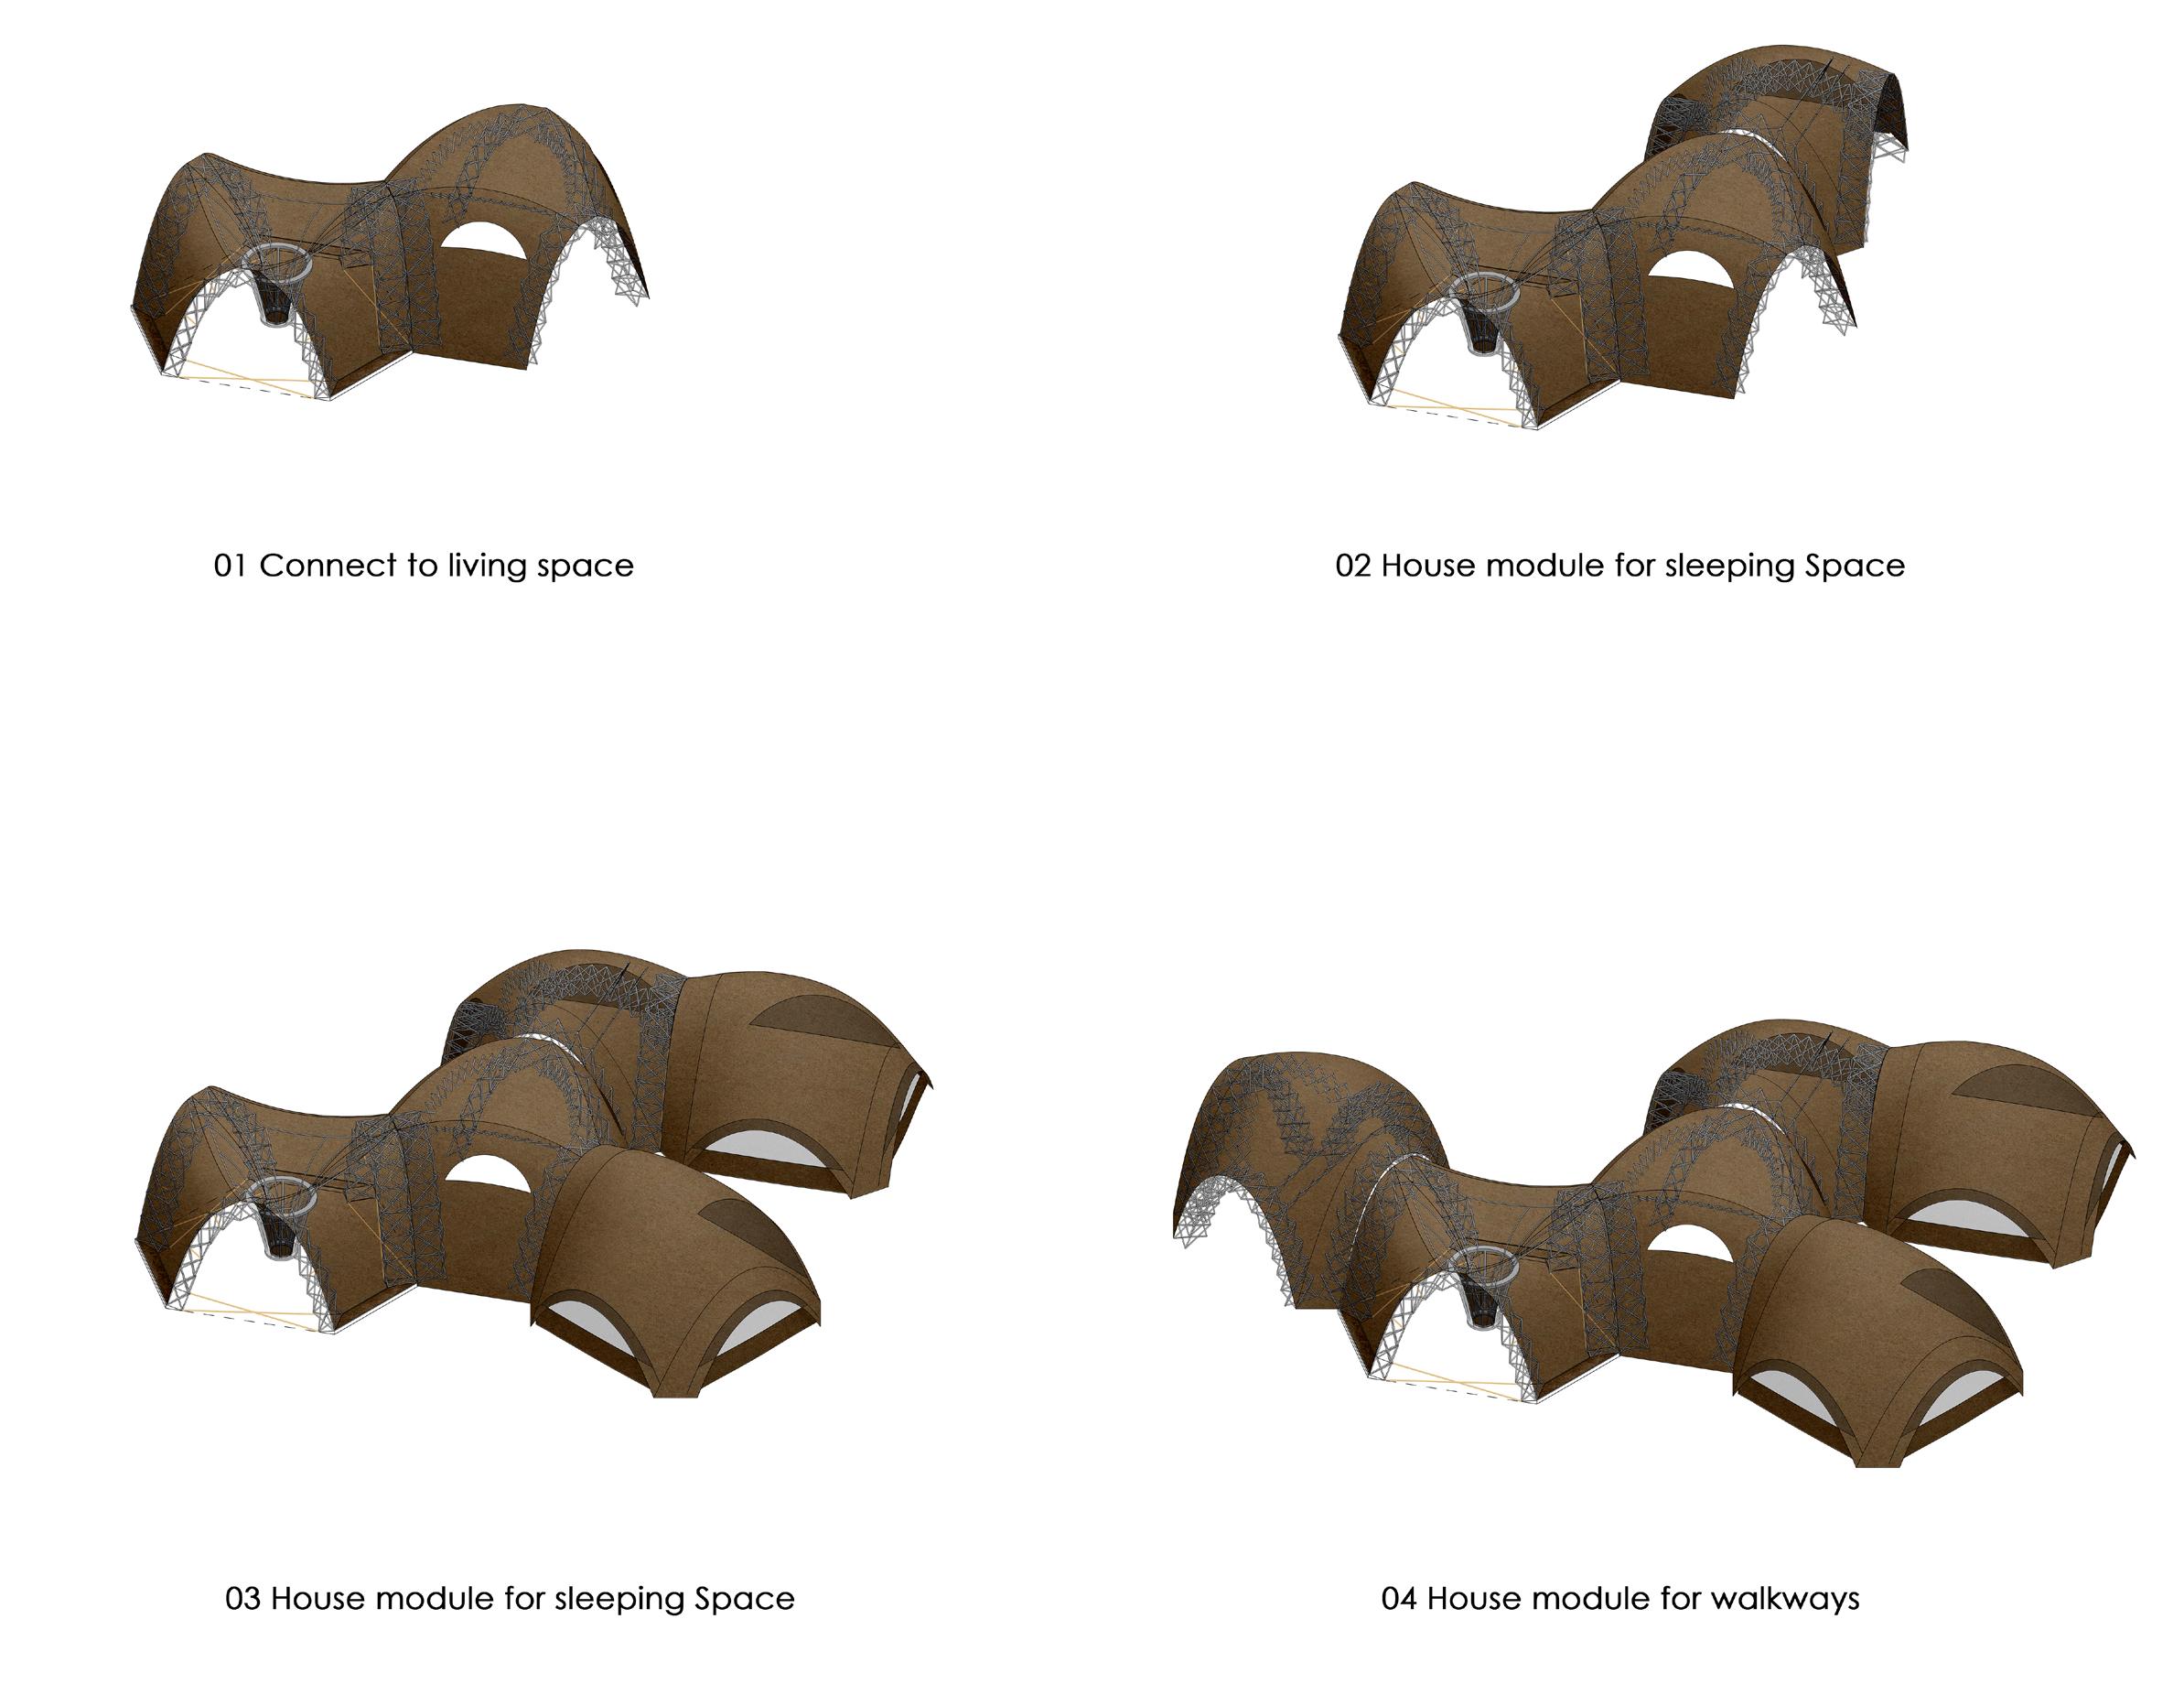
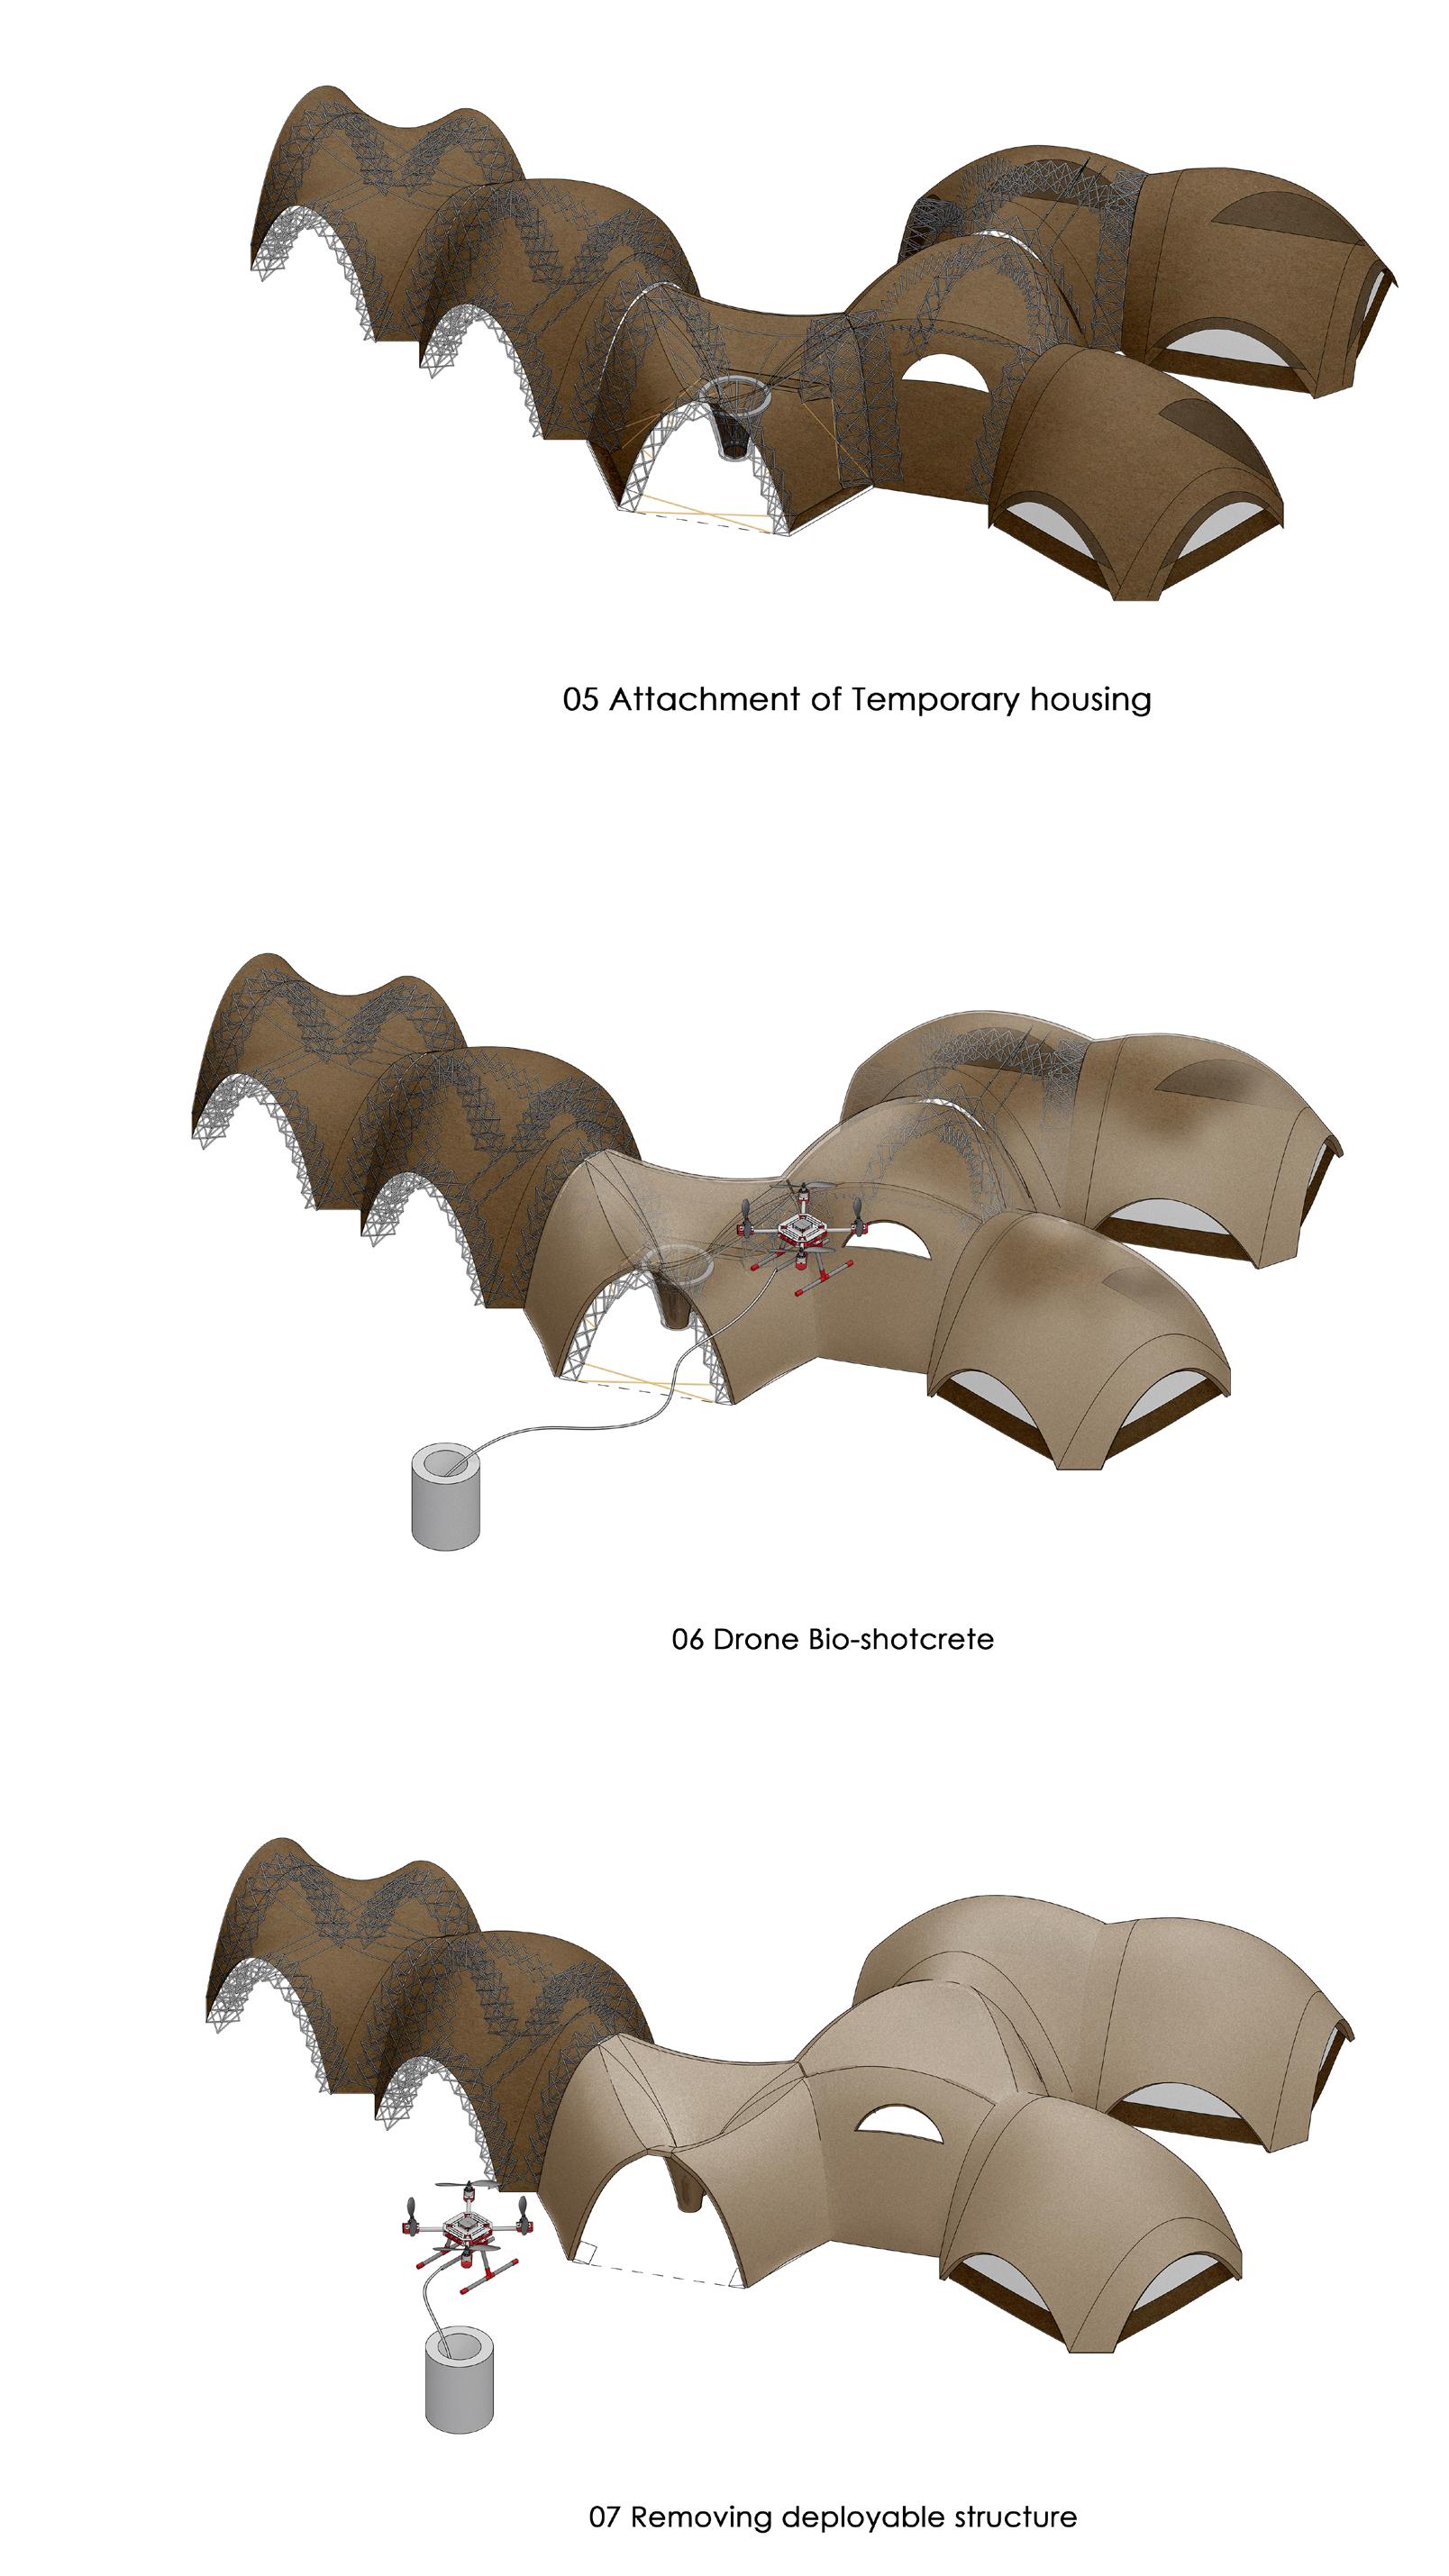
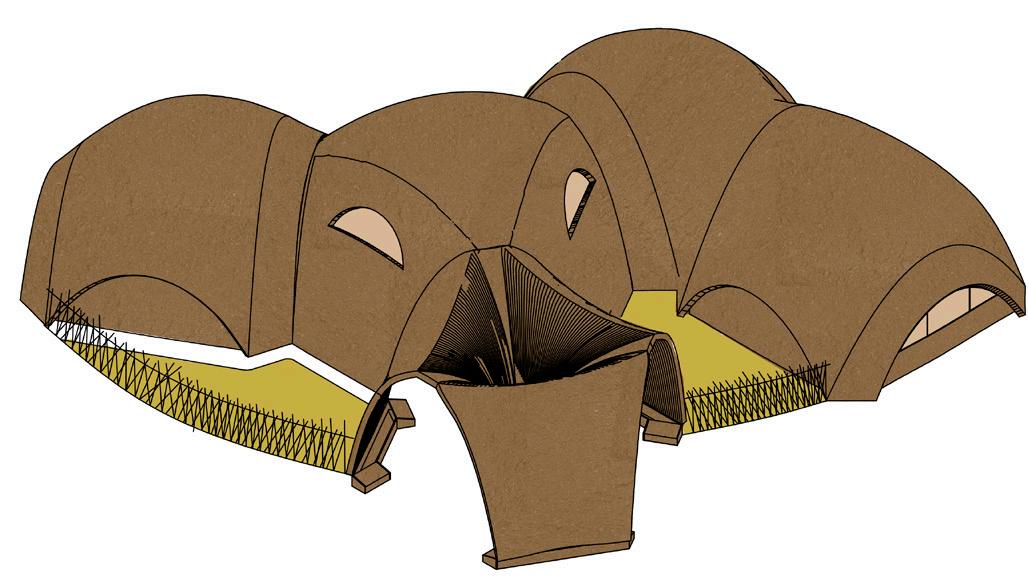
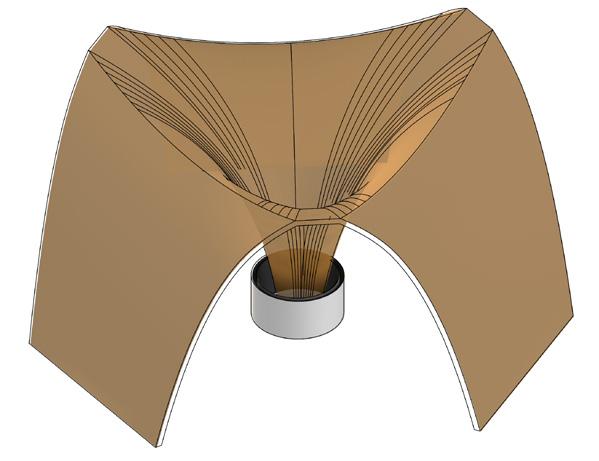
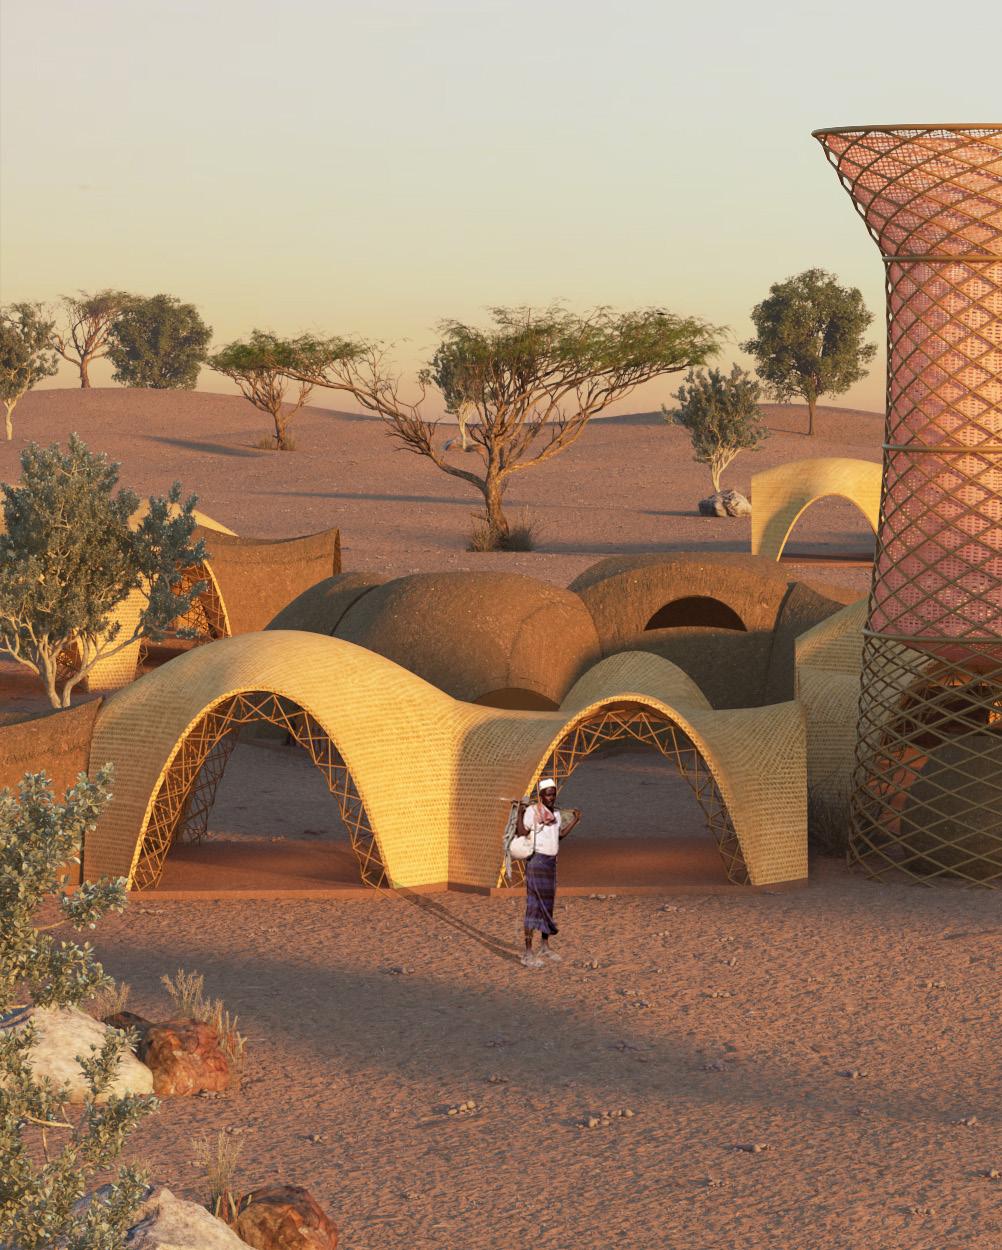
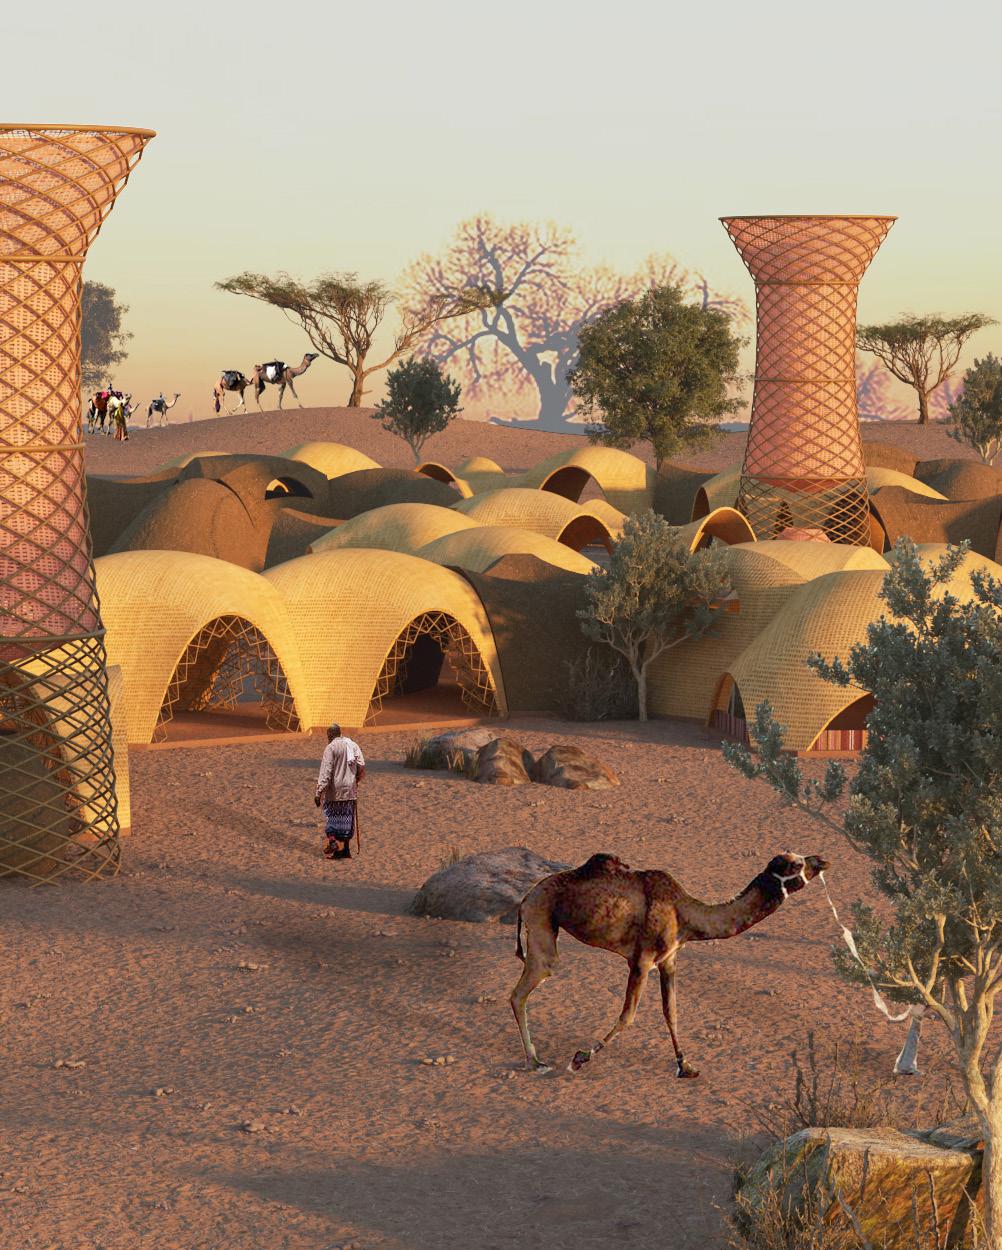
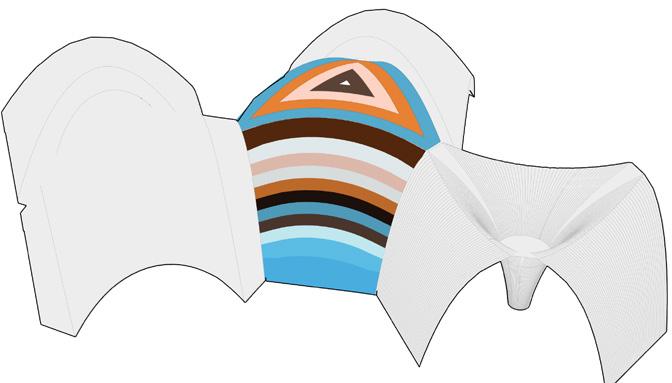
The chosen approach was to use local resources and manual labour to build deployable units, capable of becoming permanent shell structures via a bio-shotcreting process. Material, fabrication and living conditions were taken into account to design the housing units. Environmental and site conditions were considered for the design of a settlement network and distribution that can adapt the best to the existing water flow in the terrain.
1. INTRODUCTION 2. DOMAIN
Climate change and Water Scarcity
Climate Change, mobility and displacement
Why Ethiopia ?
Water situation
Water access
Mobility
Temporary to permanent Conclusion and strategy
3. METHODS
Overview
Design Analysis
Design Methods
4. RESEARCH DEVELOPMENT
Overview
Settlement Planning
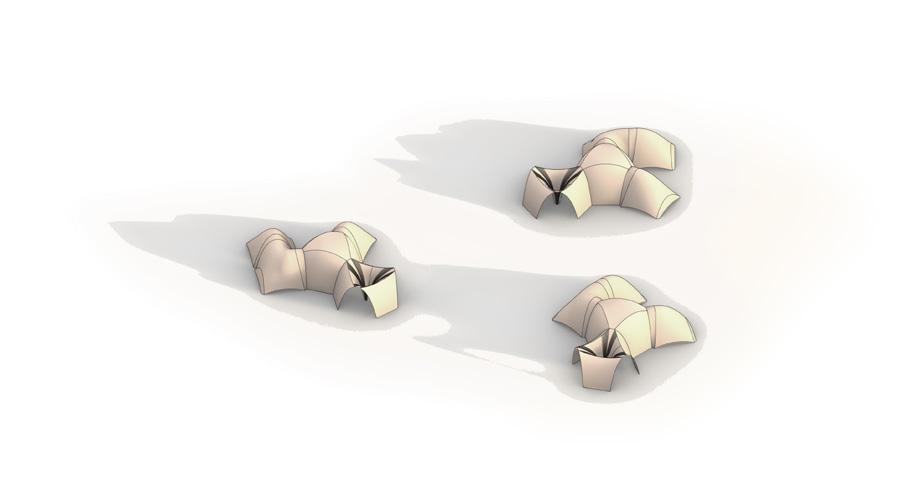
Housing Units
Bio-Shotcrete Applications
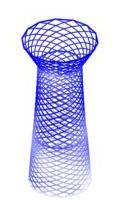
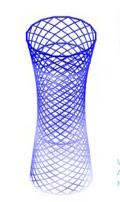
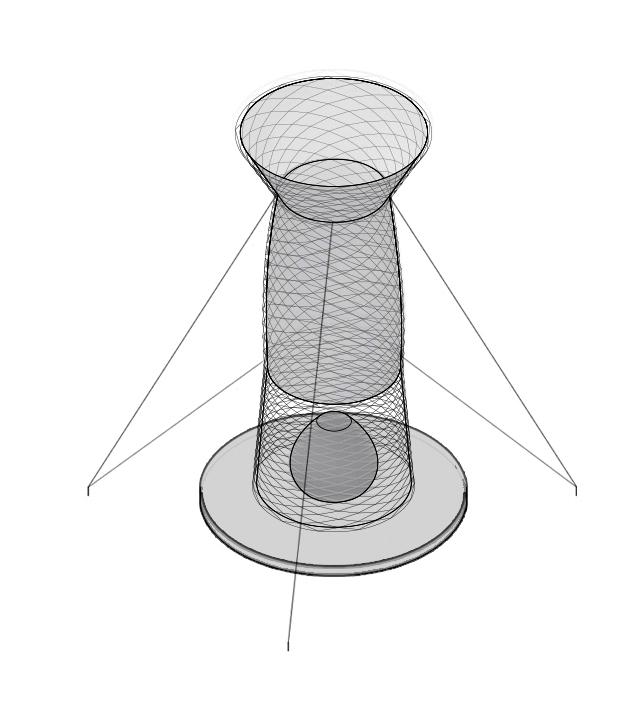
Water Harvesting Tower
5. DESIGN DEVELOPMENT
Housing Design
Housing Construction Sequence
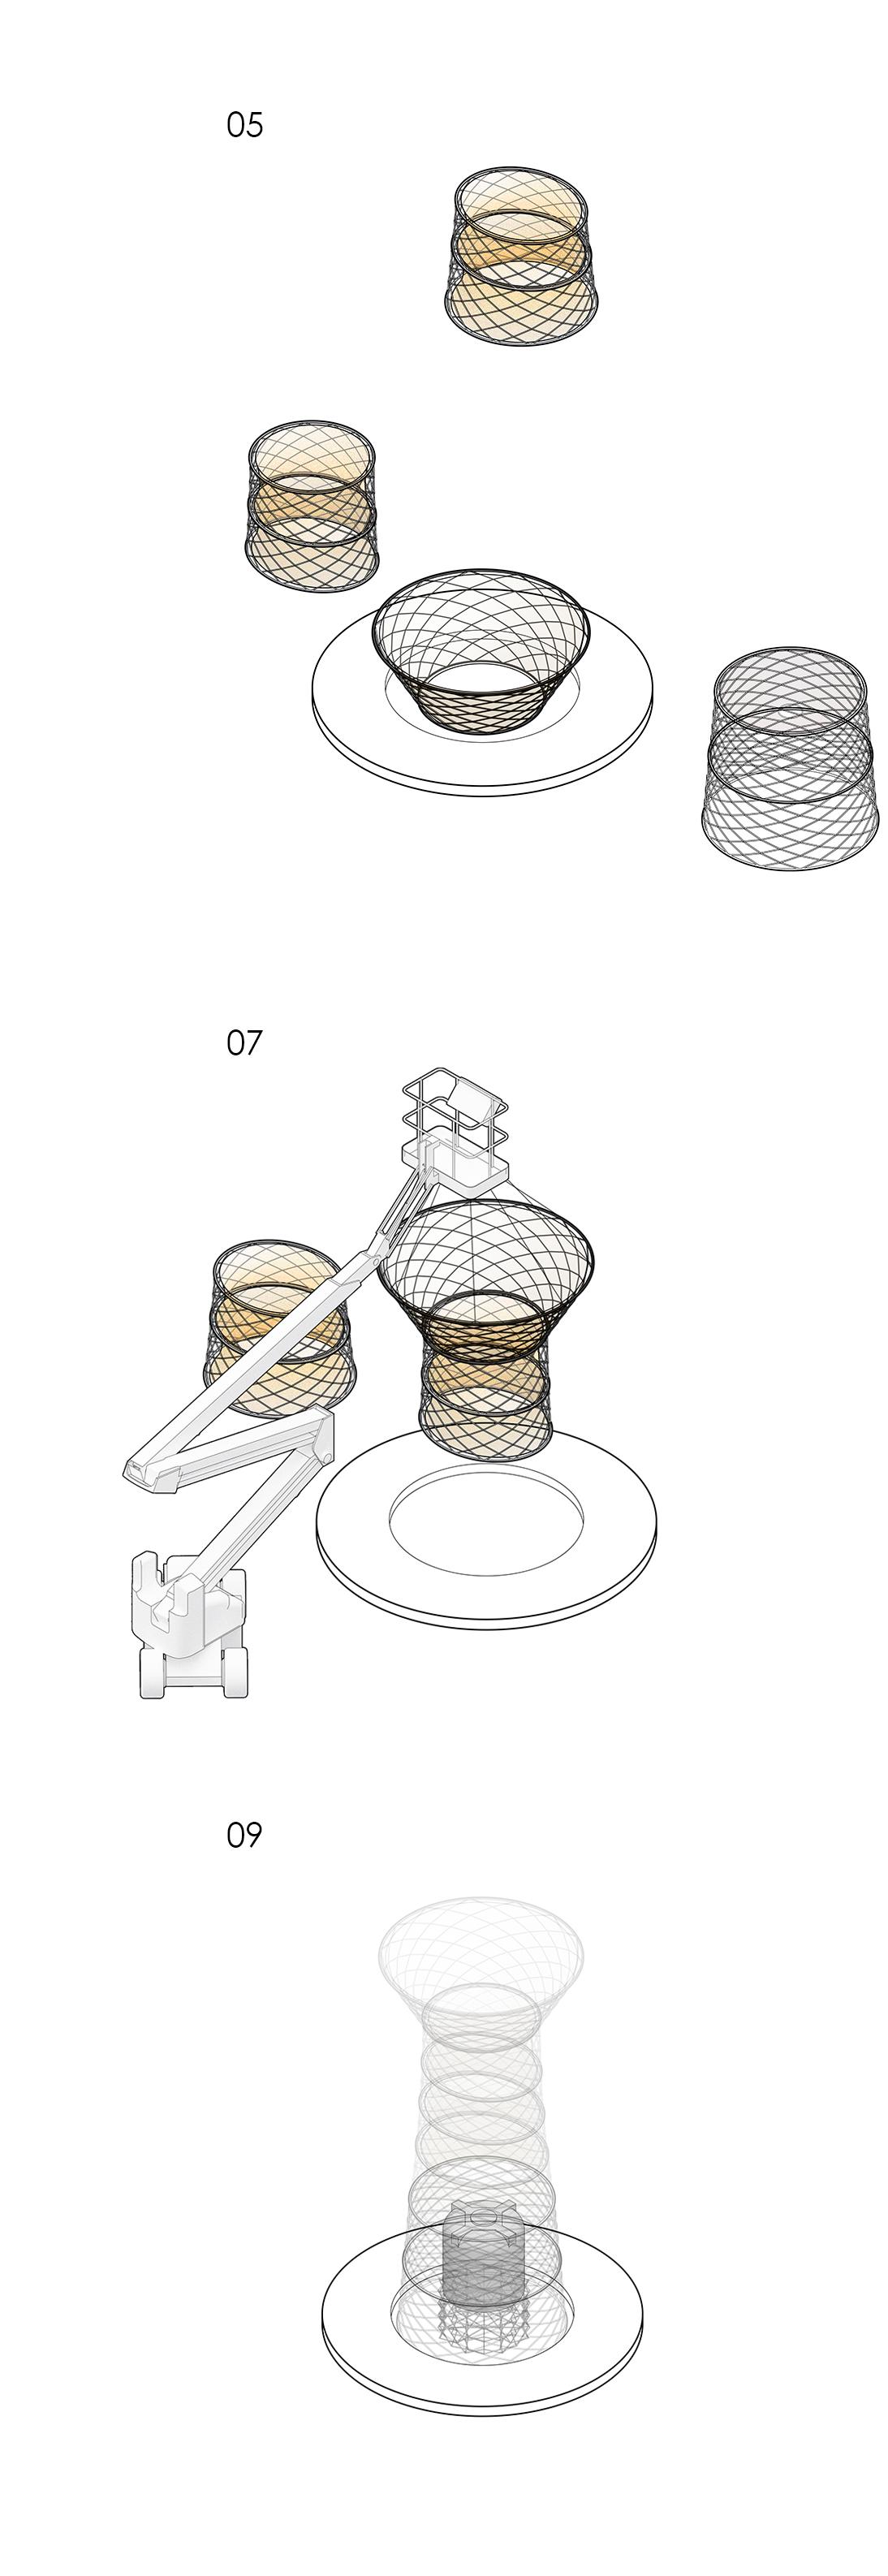
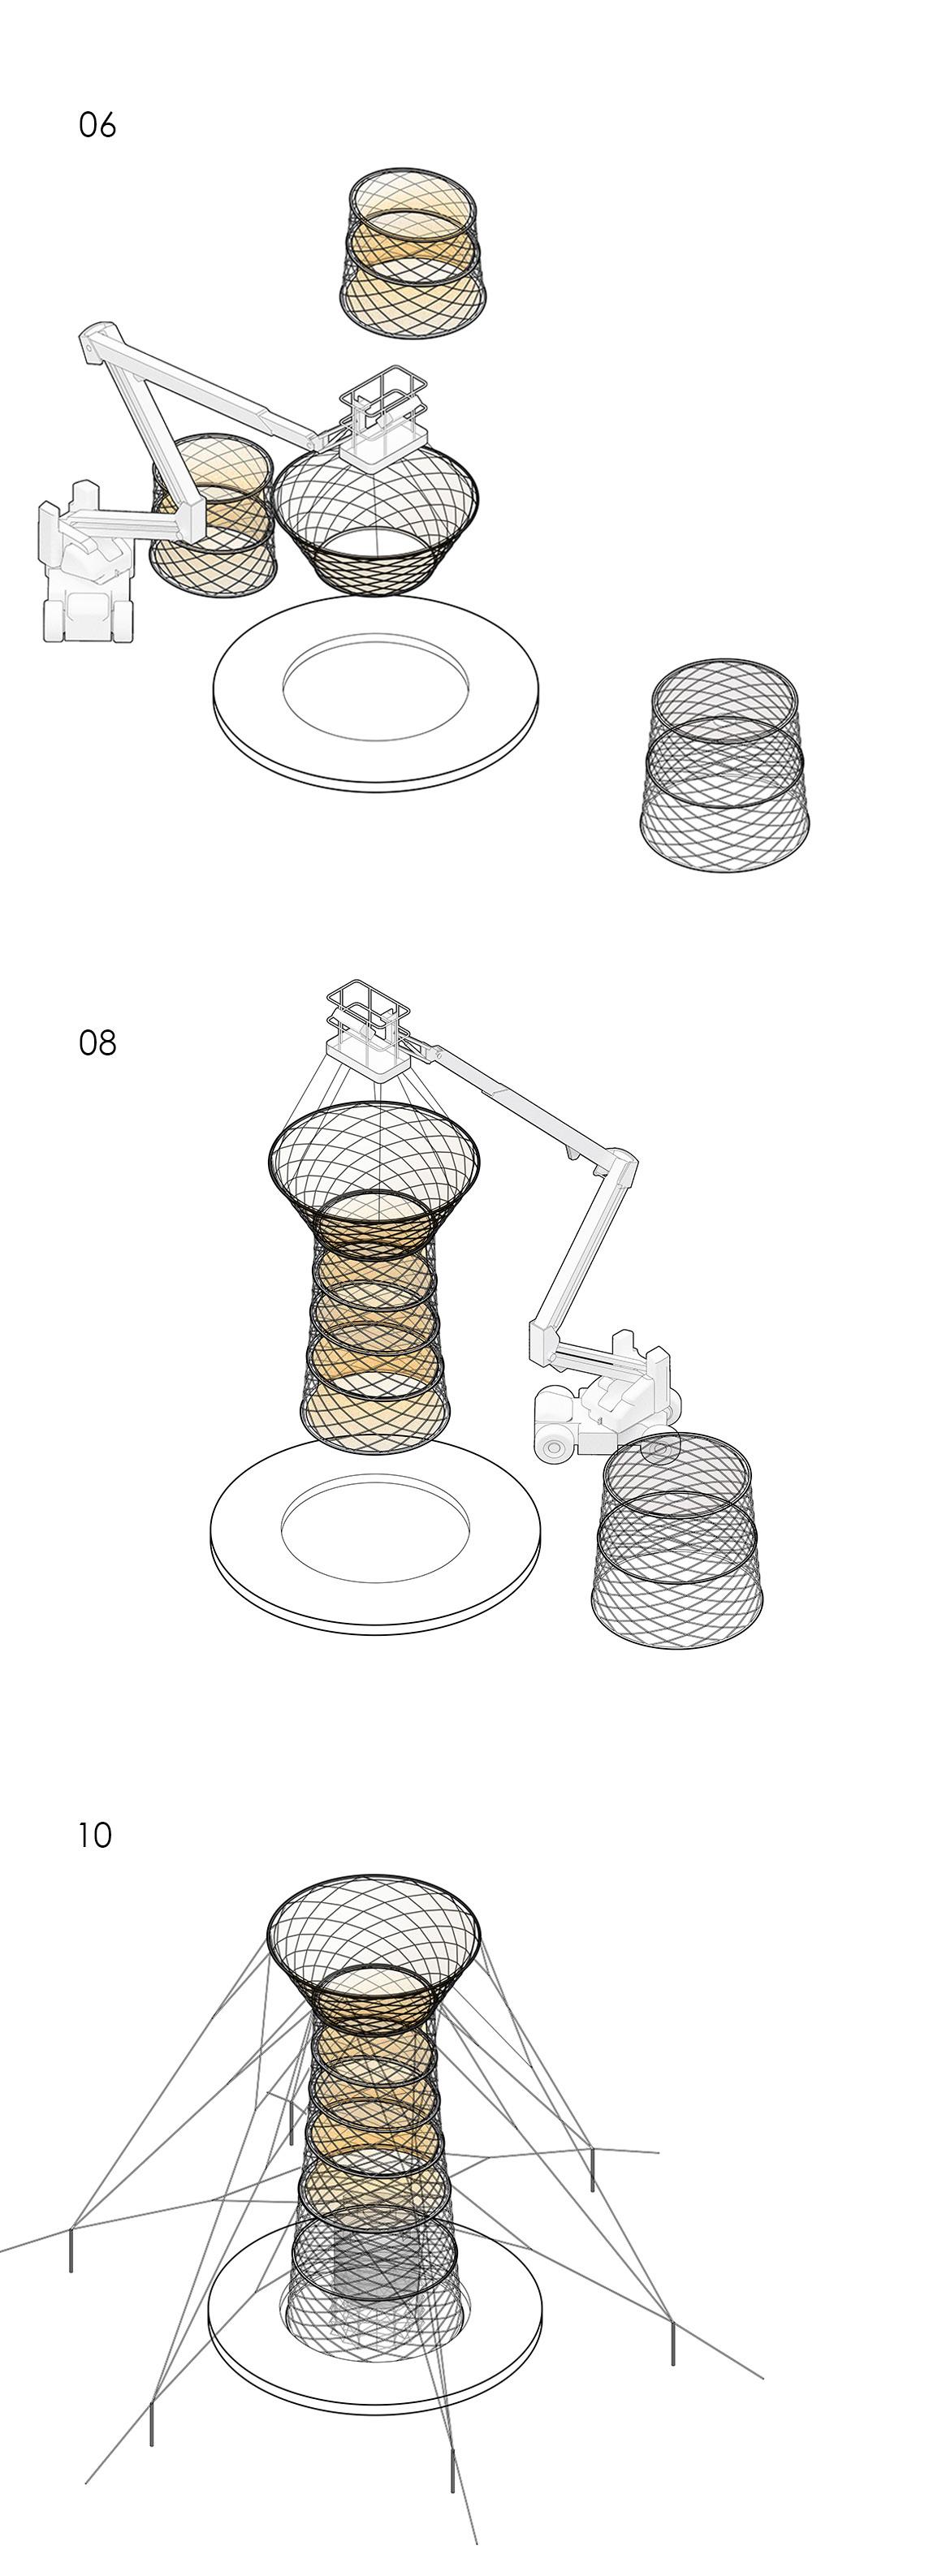
Tower Construction Sequence
6. DESIGN PROPOSAL
Cluster Experiments
Future Clustering Experiments
7. DESIGN ASSESSMENT
Housing Water Catchment Analysis
8. CONCLUSIONS
9. REFERENCES
Further Steps
10. APPENDIX
01. INTRODUCTION
CLIMATE CHANGE AND WATER SCARCITY.............................................................................
CLIMATE CHANGE, MOBILITY AND DISPLACEMENT............................................................... WHY ETHIOPIA ? .....................................................................................................................
01 - 1 CLIMATE CHANGE AND WATER SCARCITY
Droughts, Floods and Sanitation Problems
Uncontrolled human intervention and natural resources exploitation are causing the disruption of numerous ecosystems worldwide and increasing the global temperature of the planet. This is resulting in severe Climate change, causing disorders in the rainfall patterns which manifest through drought and flooding events.
According to the United Nations World Water Report 20191, over 2 billion people worldwide live in waterstressed areas, 4 billion experience “severe water scarcity for at least one month of the year” and “three out of ten people do not have access to safe drinking water”.
Africa is without a doubt one of the continents most affected by lack of access to pure water, where in 2015 about 10% of its population drank water from untreated surface water sources. Inside it, Sub-Saharan Africa is the region with the highest pressure on water sources, where less than 25% of the population has access to a safely managed water supply. When it comes to rural Ethiopia, only 31.06% of the population have access to either safely managed or basic water, whereas the remaining 68.94% depend on limited, unimproved
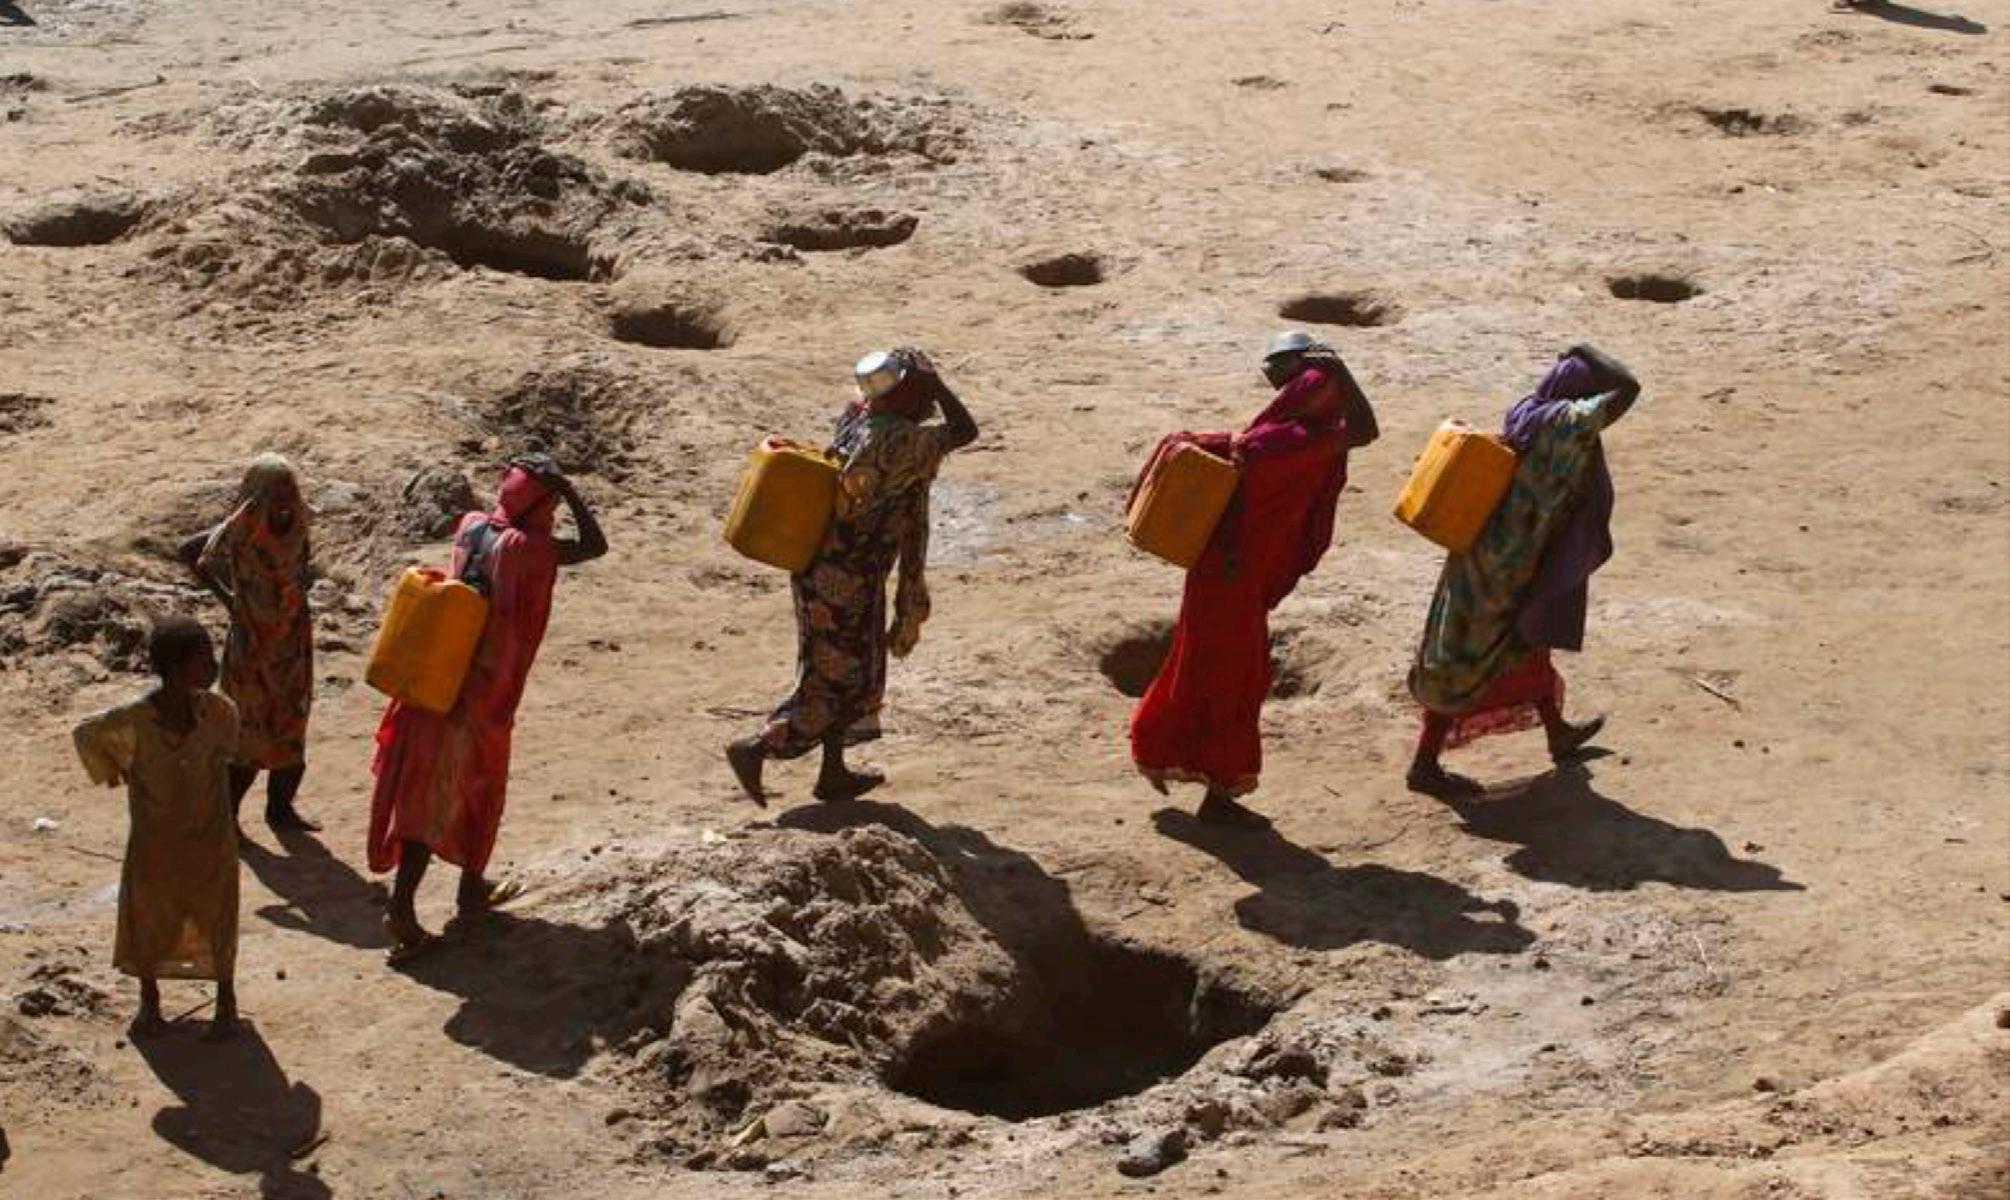
FIG 02 - 2.1.1 Women carrying water canisters
Flooding events
Drought
or surface water sources, and only 3.81 % of the population have access to safely managed sanitation services (2017)13. Poor sanitation conditions and water scarcity are responsible for the appearance of water borne diseases such as Cholera and Malaria, which could easily be avoided.
With around 78 % of its population living in rural areas in 20193, Ethiopia is highly dependent on rain fed agriculture and livestock production to ensure the survival of its local communities. The changes in the rainfall patterns have been affecting the food access since 1950. Dry seasons are becoming longer and rainy seasons shorter with great floods which are washing the soil nutrients, making it harder for plants to grow. In the year 2017, a very important drought led to low water availability and resulted in high livestock death rates and crops losses.
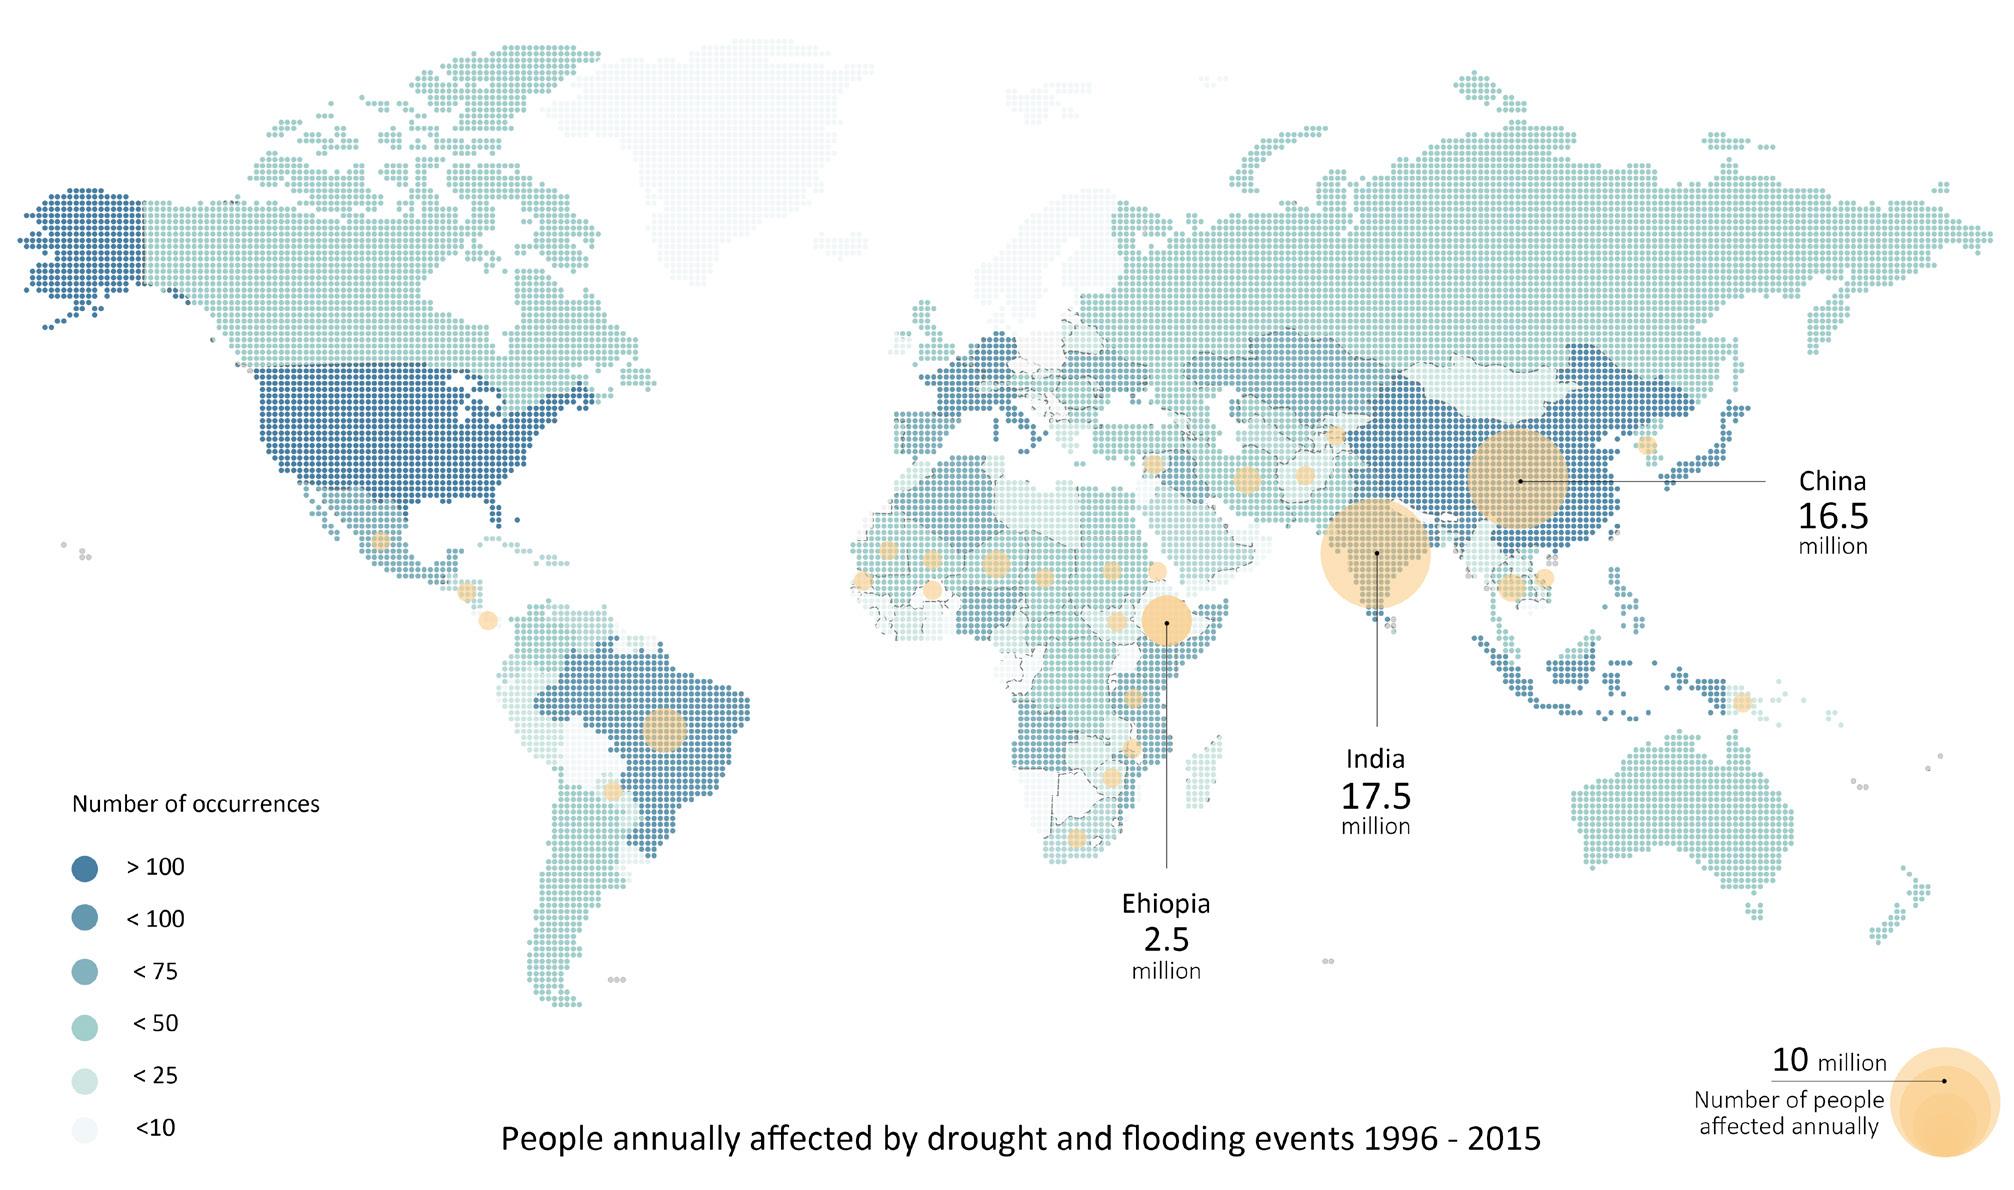
FIG 02 - 2.1.1 Map showing number of people affected by drought and flooding between 1996 and 2015
01 - 2 CLIMATE CHANGE, MOBILITY AND DISPLACEMENT
Natural Disasters, Refugees, IDPs and Pastoral Nomads
Climate change and its effects on the natural environment also cause major problems to a big percentage of the world’s population, in many cases forcing people to leave their houses and resettle in temporary shelters or refugee camps. According to the UNHCR, between 2008 and 2015, 203.4 million people were displaced by natural disasters, and the likelihood of being displaced by them has doubled since the 1970s3. On top of this, persons already displaced for other reasons are exposed to secondary displacement related to natural hazards caused by climate change.
Ethiopia is surrounded by countries with important religious and political conflicts which turn it into a natural destination for refugees escaping Somalia, Eritrea and South Sudan. For this reason, it has historically hosted foreign refugees and accounts for one of the 10 most important protracted refugee populations in the world. It is also home to one of the largest refugee camps to exist, the Kebri-Beyah refugee camp, which has been in its territory for more than 30 years now. According to the UNHCR around 860 thousand refugees are expected to be living in Ethiopia by the end of 20204
FIG 02 - 2.1.1 Women carrying water canisters
02 - 1 WATER SITUATION
Drought and poor water access
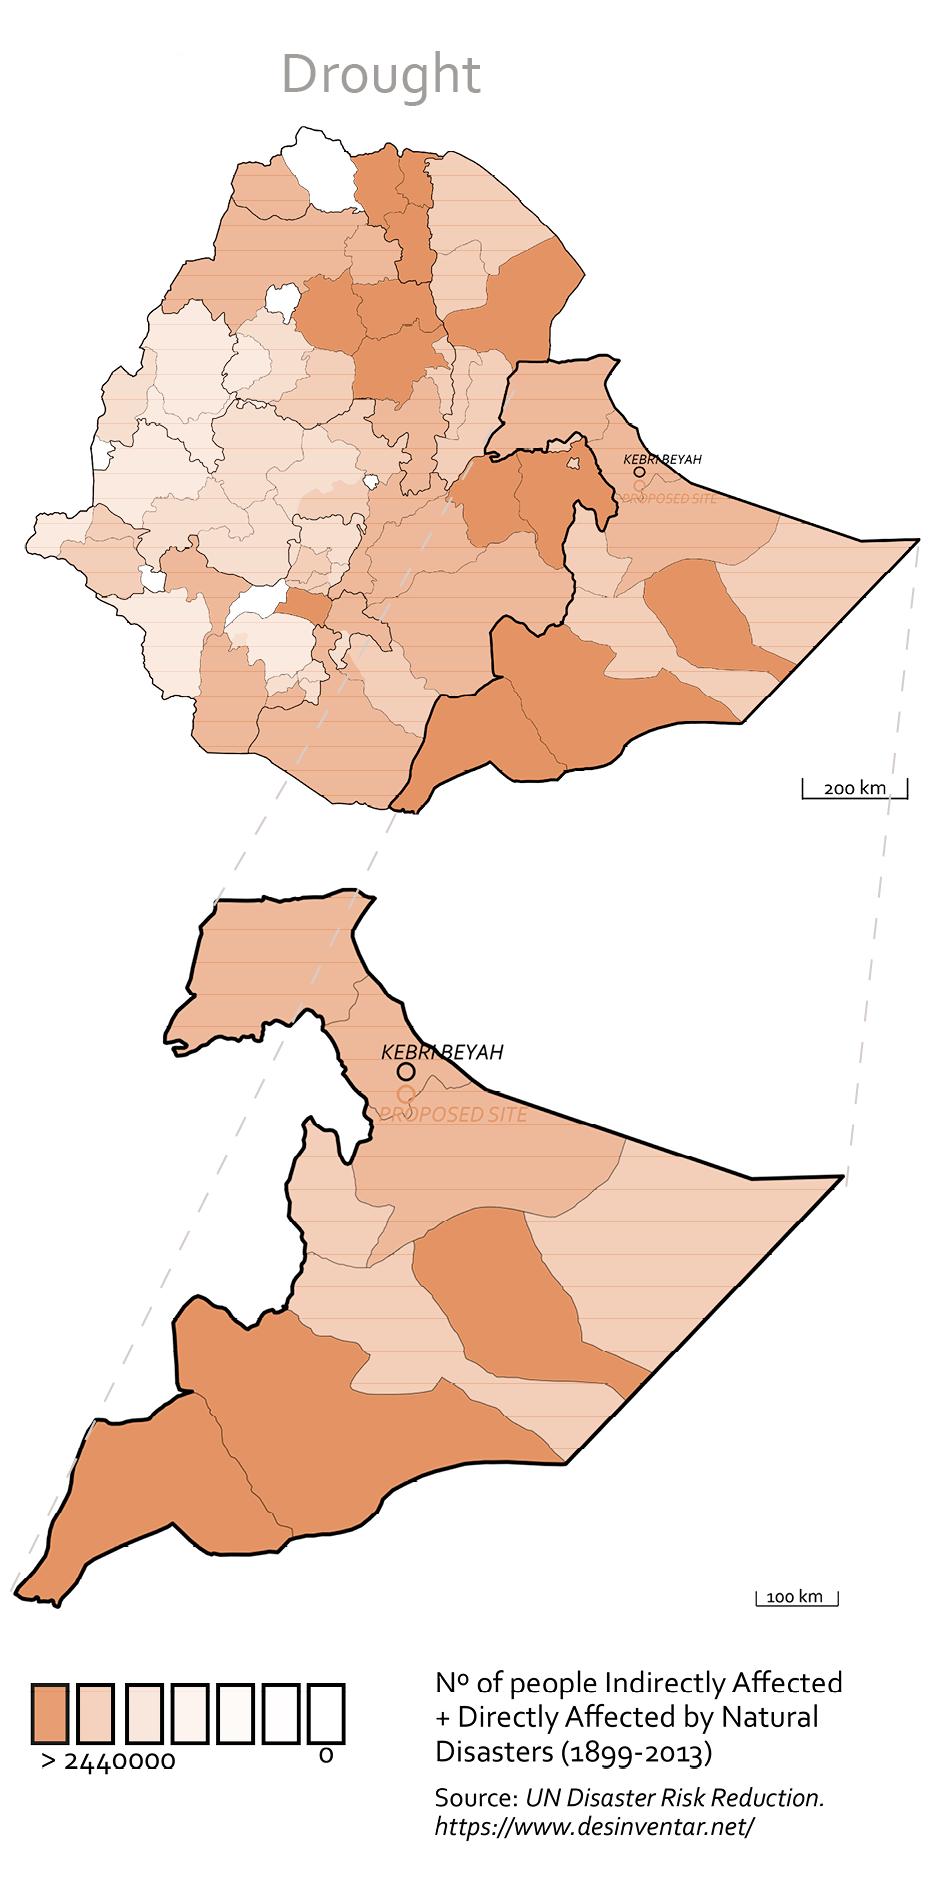
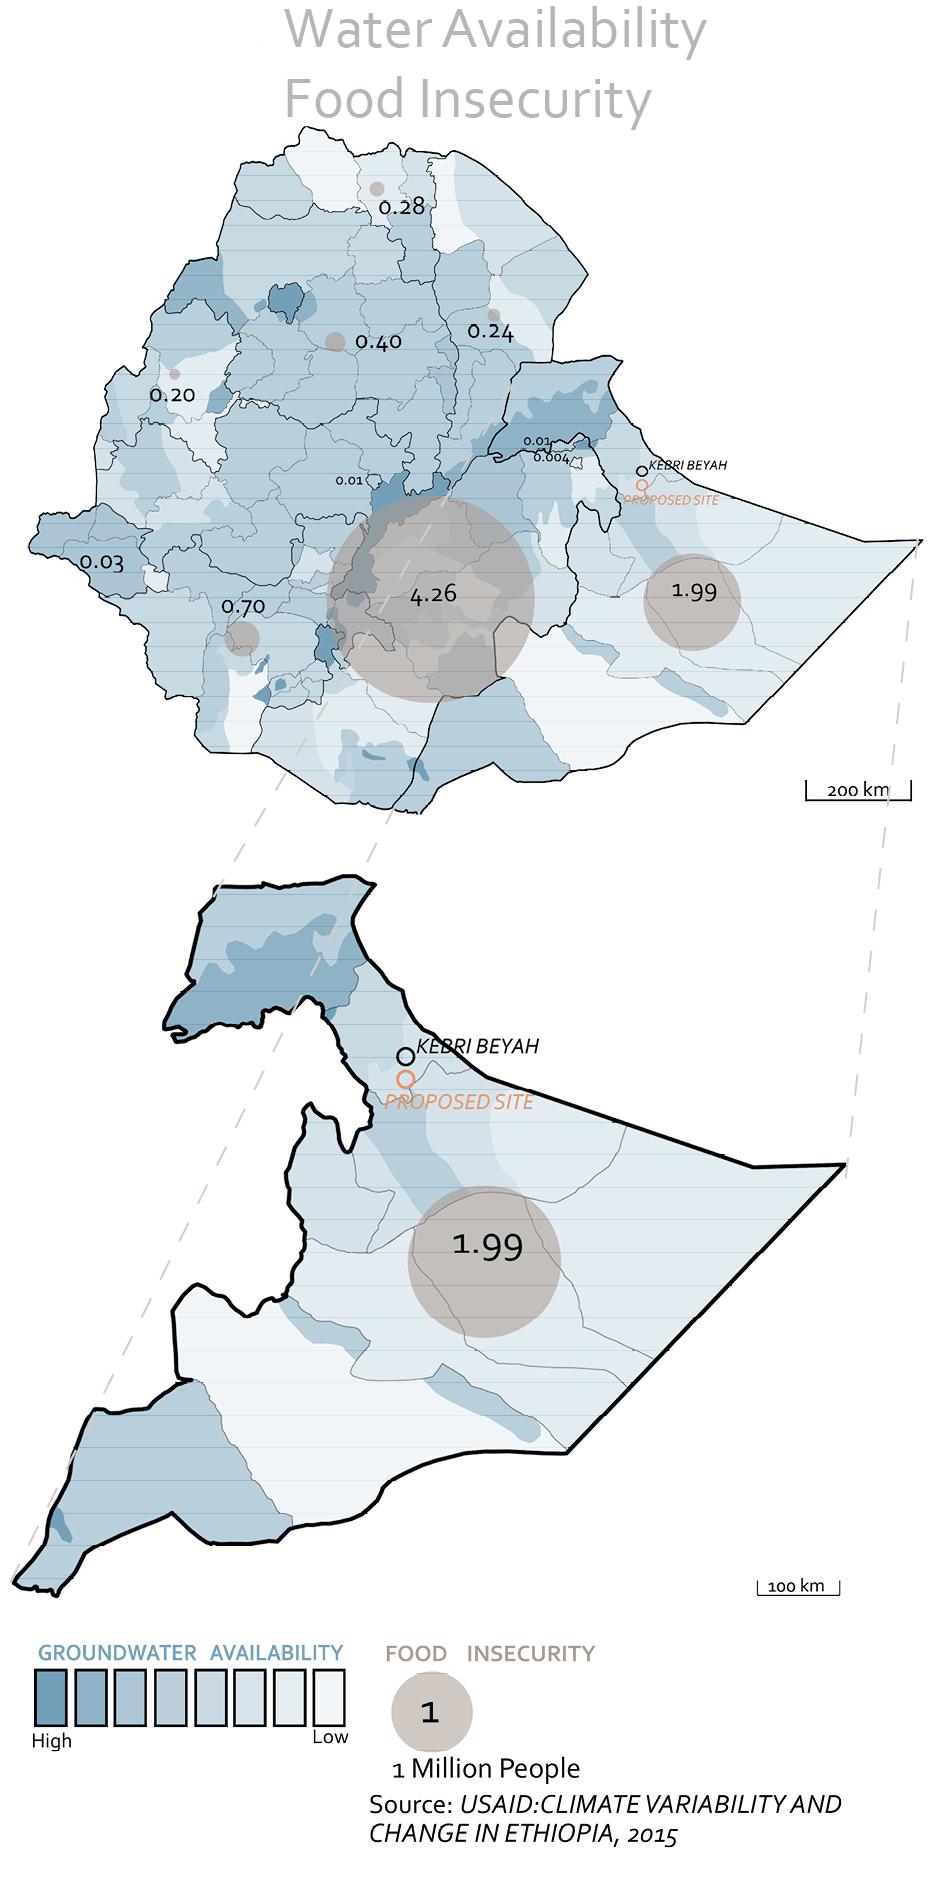
The Somali region of Ethiopia has been severely affected by changing weather patterns for the past 70 years. According to the USAID 2015 technical report, since 1950 12 major drought-induced food security crises have occurred. The impacts of climate change are amplified in the Somali area, due to the combination of population pressure, environmental degradation and unreliable water supplies. The agricultural production here is highly dependent on rain to produce and the water points are scarce. Climate change is resulting in temperature rising and the number of hot days increasing in this region. The mean annual temperature is supposed to grow between 1.1 to 3.1ºC and the number of hot days to occur on 19 to 40% of the year by 2060 (USAID, 2015)1. These rising temperatures and erratic rainfall are causing moisture loss on the land, reducing water infiltration and groundwater recharge. This is having a negative impact on the natural water sources’ availability and quality, and therefore also affecting the crop production and the livestock survival.
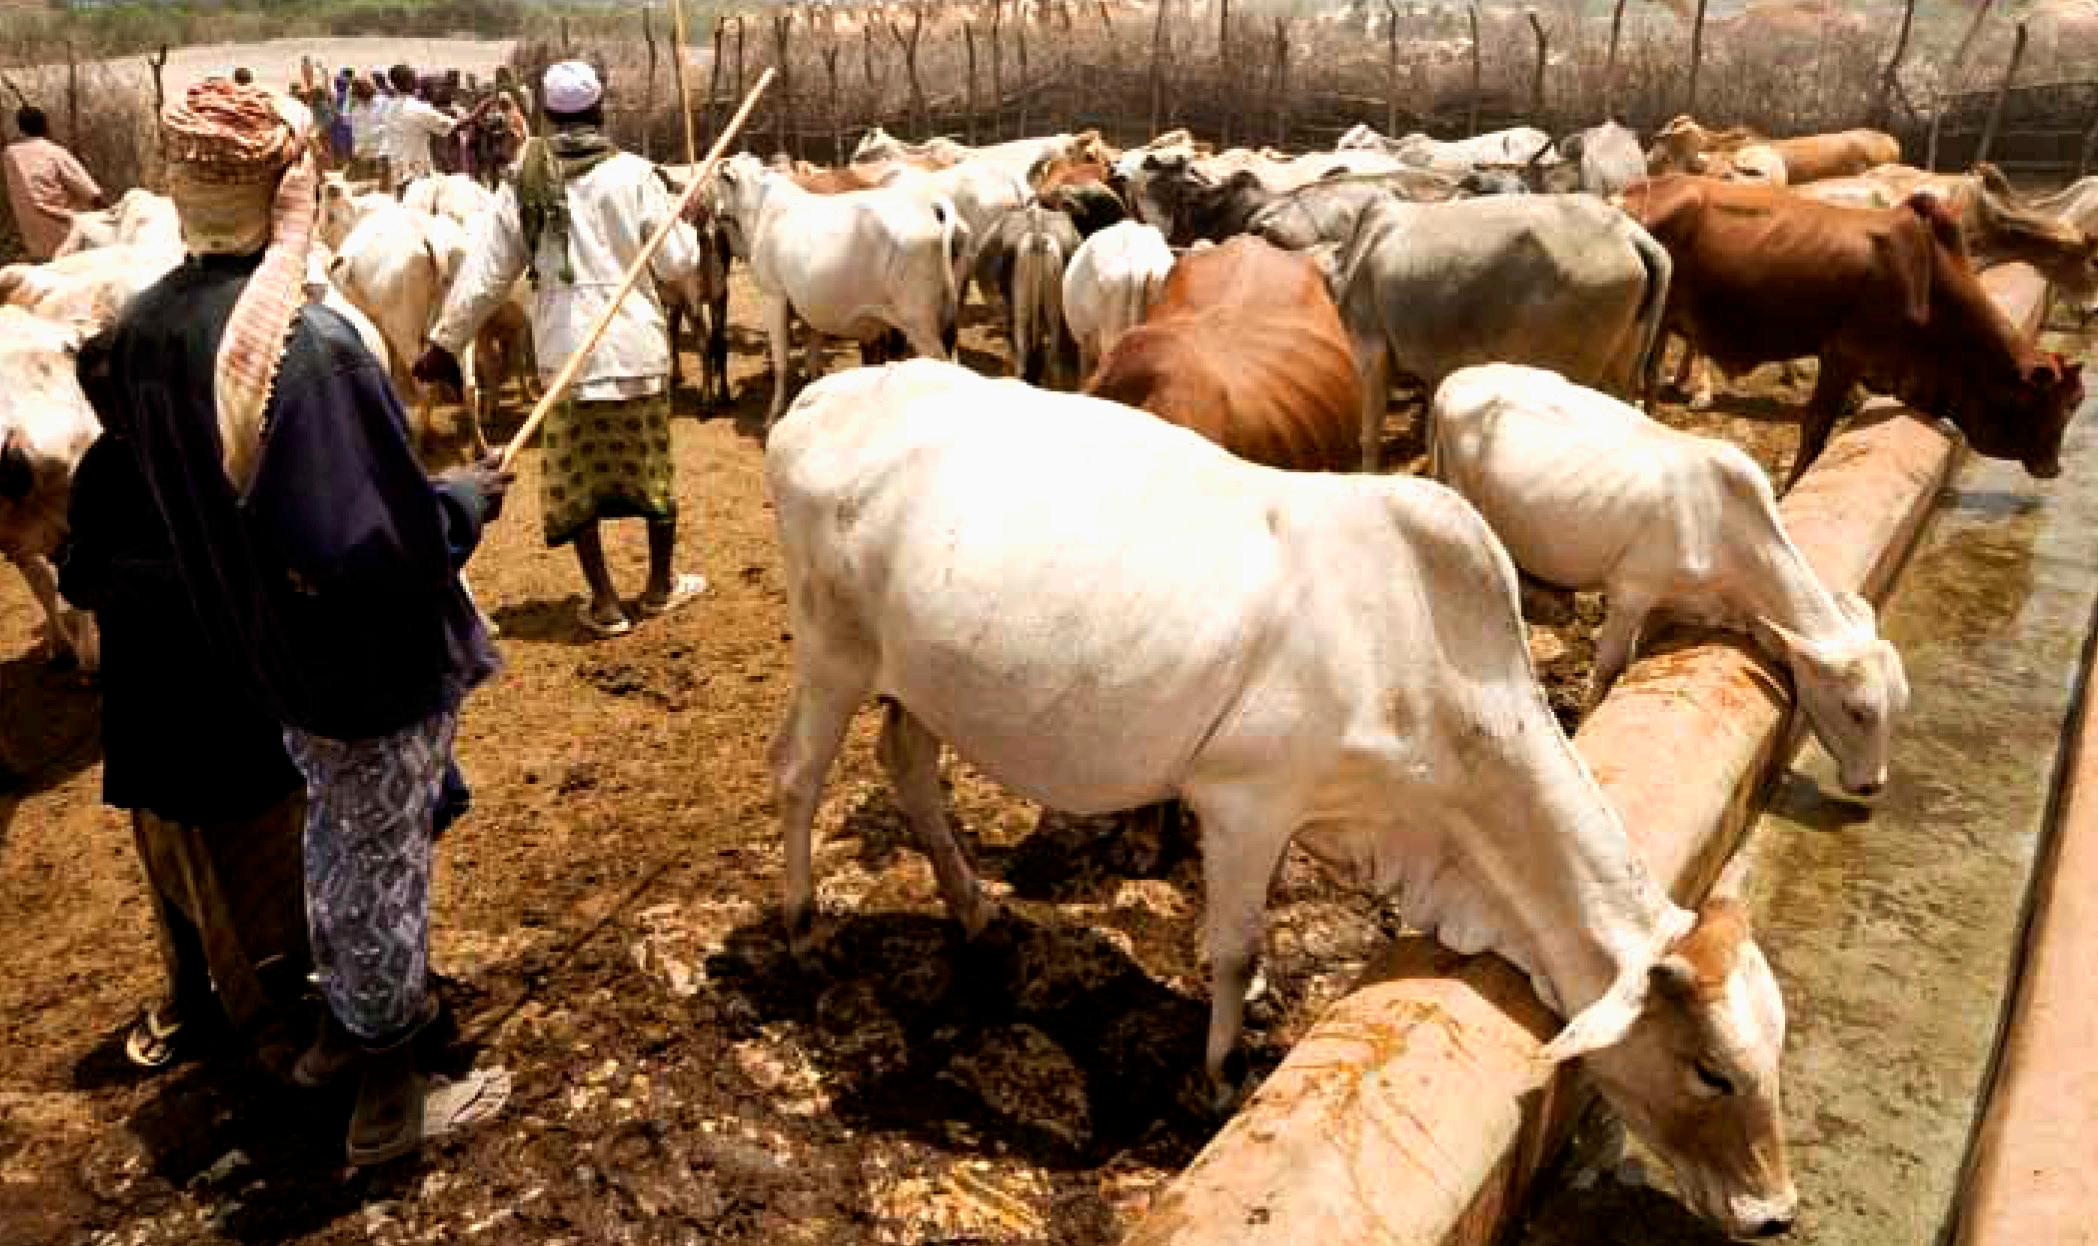
FIG 02 - 2.1.1 Animals waiting to drink at the borehole in Lehey, Somali Region, Ethiopia.
Source: Modern and Mobile, The future of livestock production in Africa’s drylands
maps showing number of people affected by drought and groundwater availabilty with food insecurity
Ethiopia
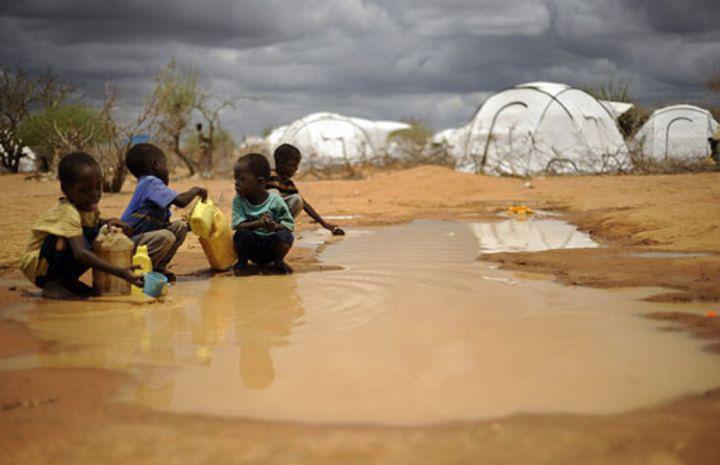
02 - 2.1.1 Somali boys collect water from a rain puddle at Kenya’s Dadaab #refugee complex in October 2011. [Tony Karumba/AFP]
WATER AVAILABILITY
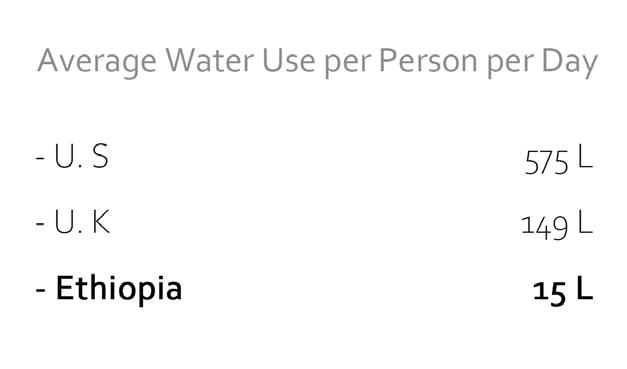
The average water use per person a day ranges from 200 - 300 litres in most countries in Europe and up to 575 in the United States, while in Ethiopia, it is only about 15 litres. Even though the water requirement in Ethiopia is relatively low compared to first world countries, some areas like the Somali region still suffer from grave water shortage caused by severe droughts and other factors making it impossible to cover even their most basic needs.
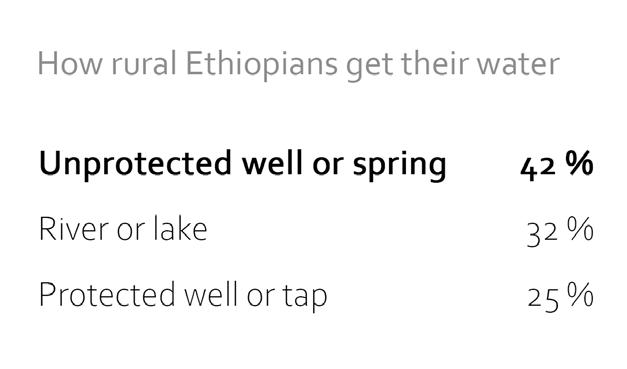
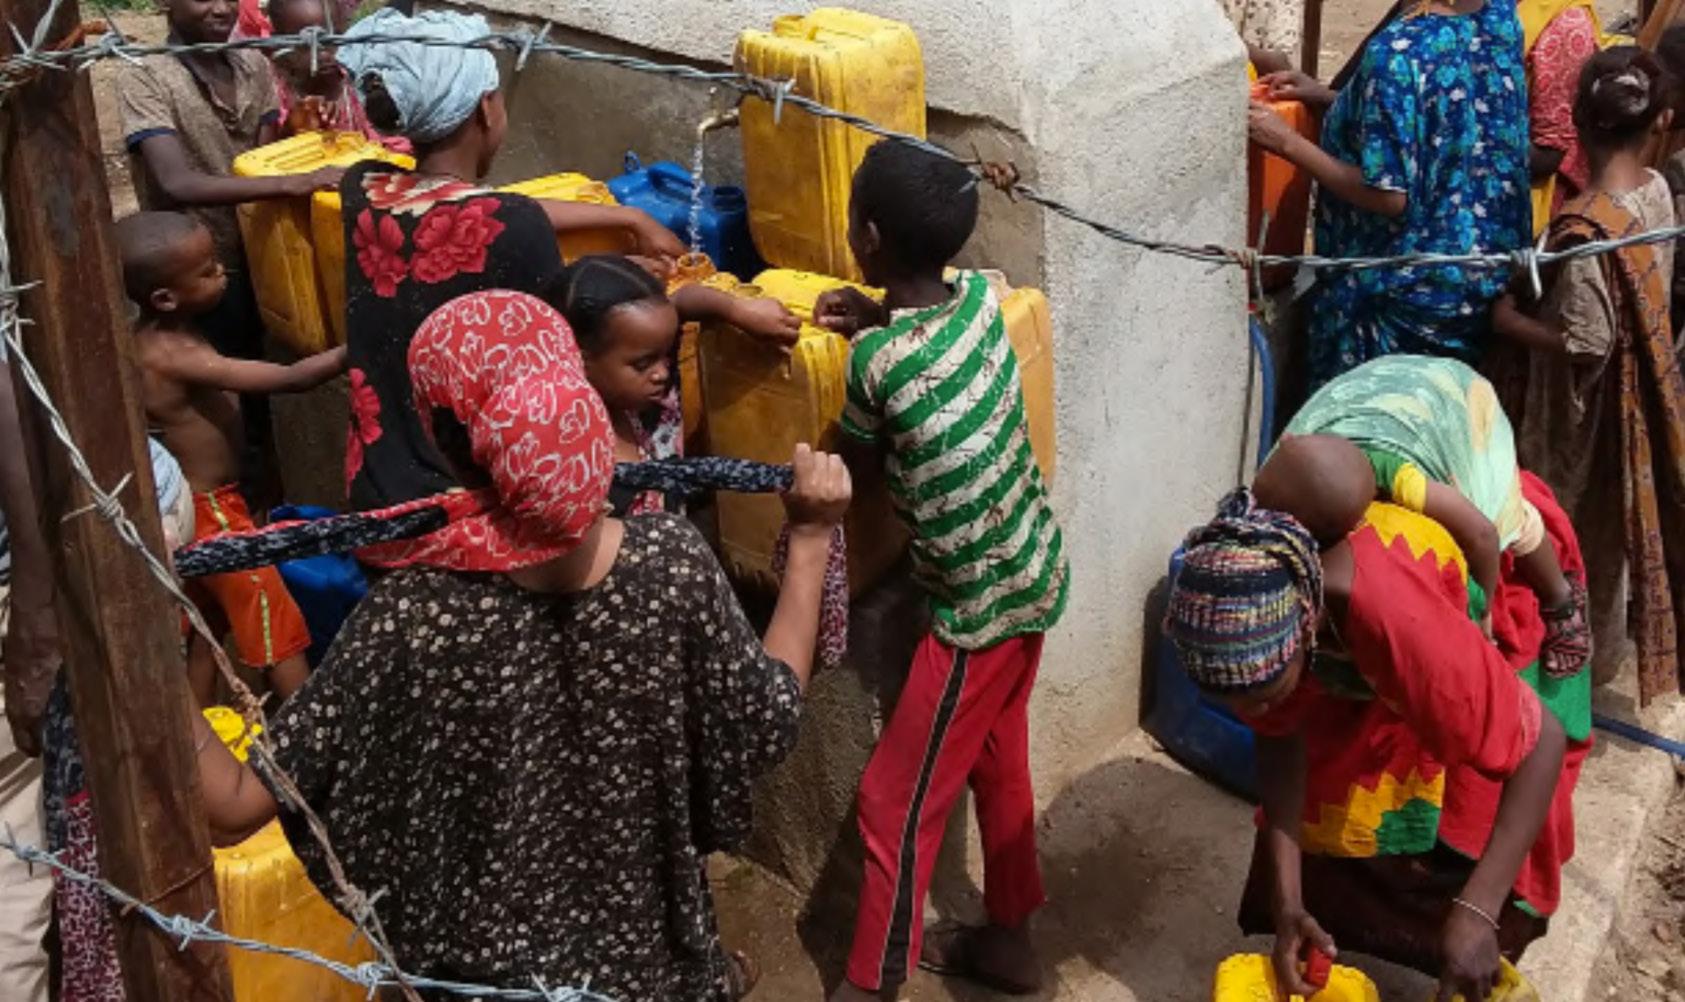
Rural Ethiopians spend much time, trying to obtain water due to the fact that 42% of it comes from untreated wells or springs which are relatively difficult to access. Furthermore, the lack of sanitation accessibility is an even bigger problem than the lack of accessibility to water, especially in countries like Ethiopia. Due to the scarcity of water, poor sanitation, and hygiene, some of the pastoralist regions have experienced Acute Watery Diarrhoea (AWD), Water Washed Disease, and other hygiene-related diseases.
FIG
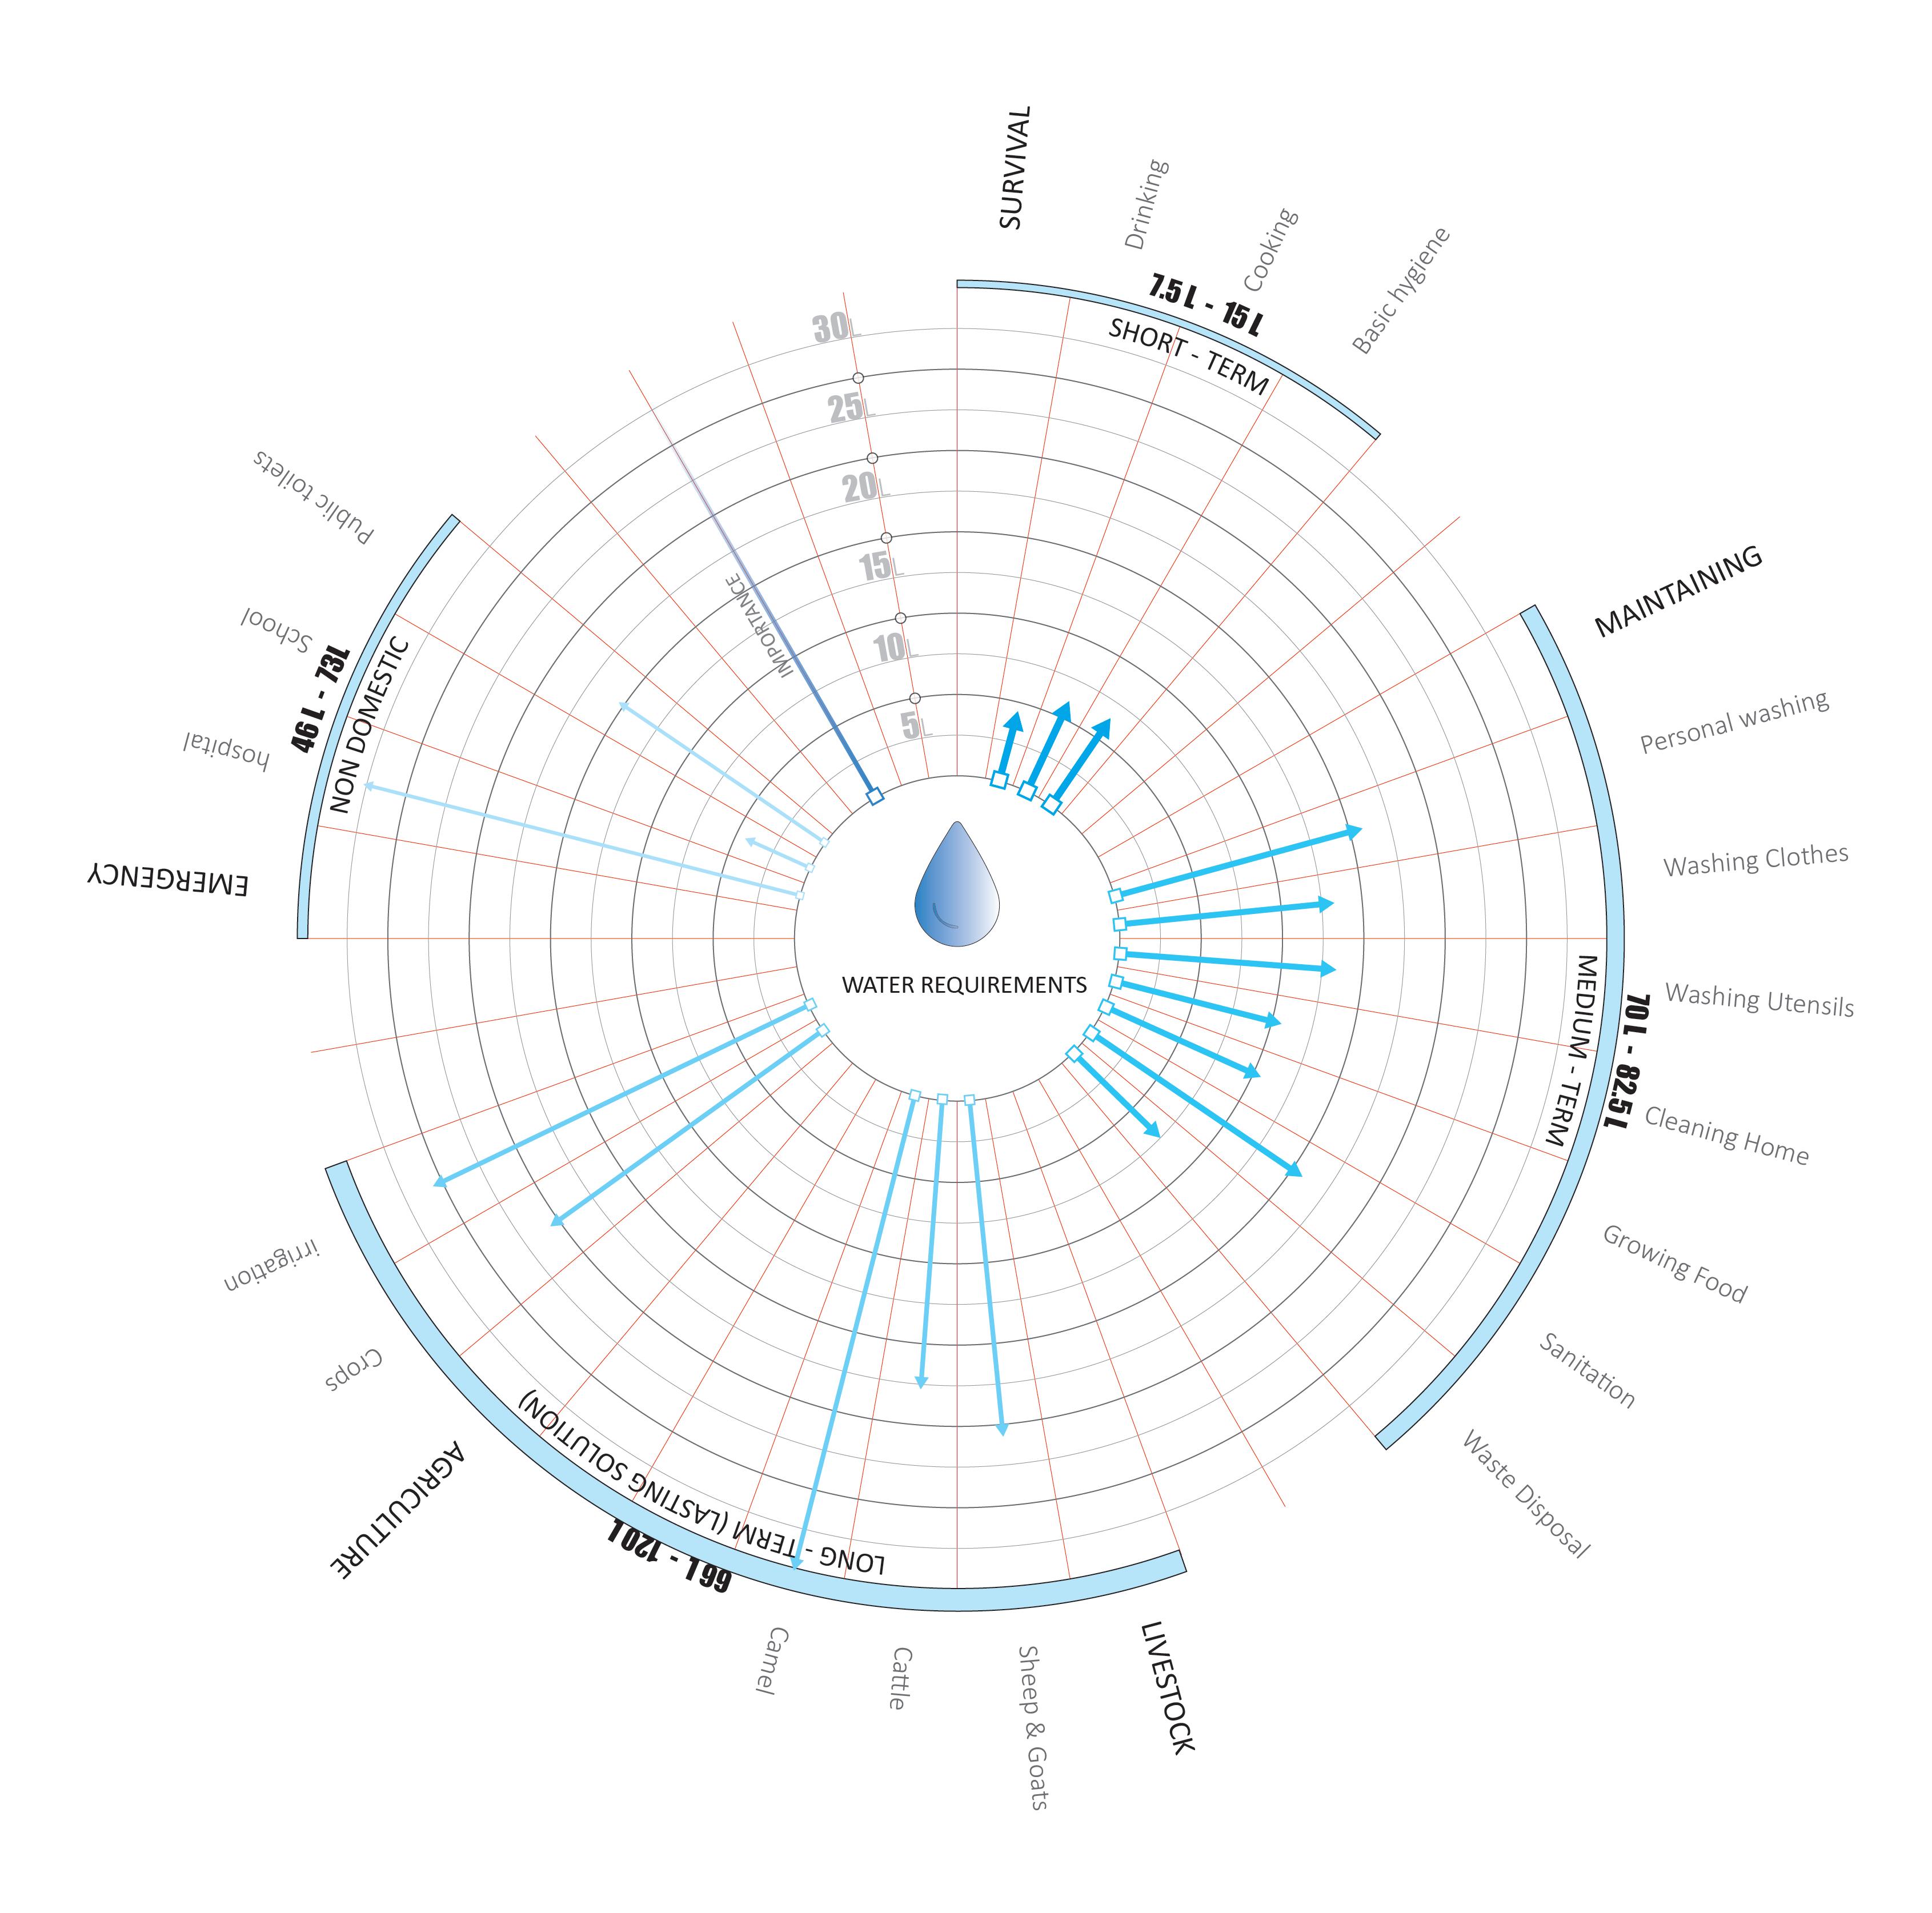
Hierarchy of water requirements (after Maslow’s hierarchy of needs)
Water Situation in Ethiopia
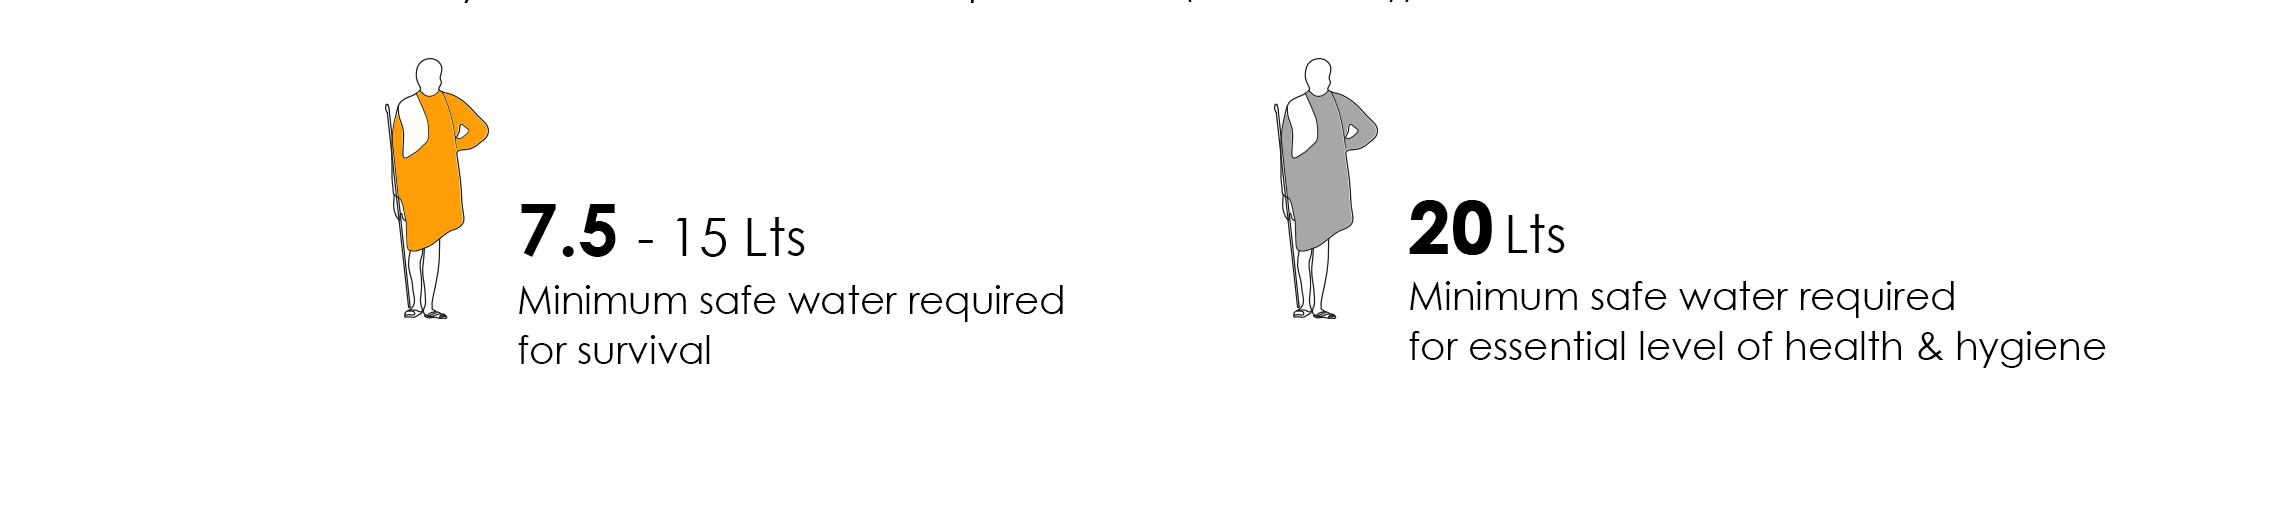
Inhabitant According to the World Health Organization Report 2013, minimum safe water required for survival is 7,5 to 15 litres a person a day to cover drinking, cooking, and basic hygiene necessities. In addition, people should secure at least 20 litres of water when considering the amount of water for essential level of health and hygiene.
Livestock
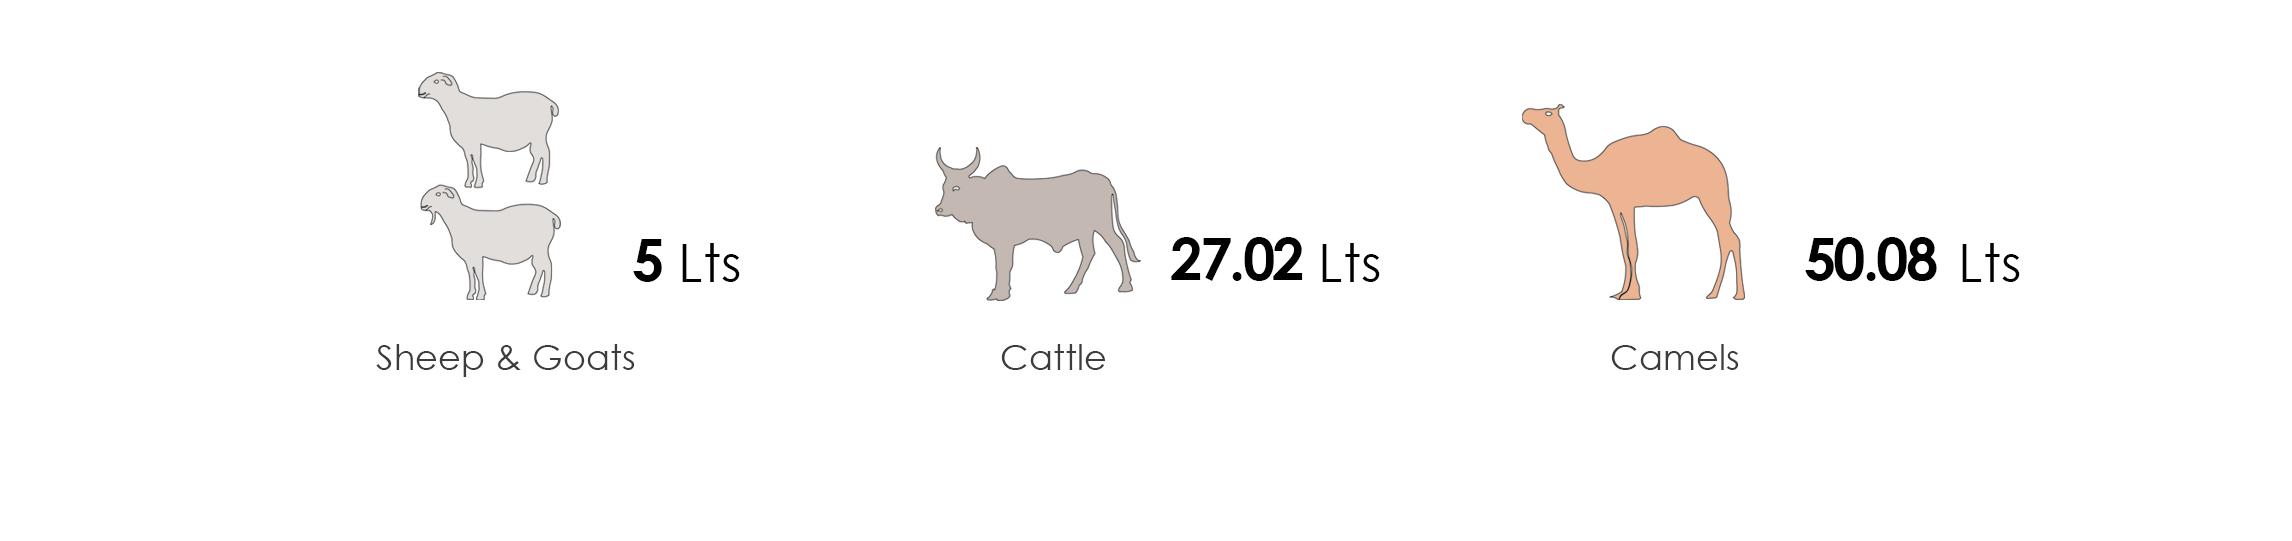
In addition to the minimum safe water required for humans, It is significant to consider water requirements for livestock. The animal population that pastoralists mainly depend on in the Somali region consists of Sheep, Goats, Camels, and Cattle. Sheep and goats have the lowest daily water requirements, with 5 litres per day, followed by cattle and Camel, around 50 litres and 27 litres, respectively. Pastoralists try to lower the risk of drought and diseases by having all types of animals.
Agriculture Production
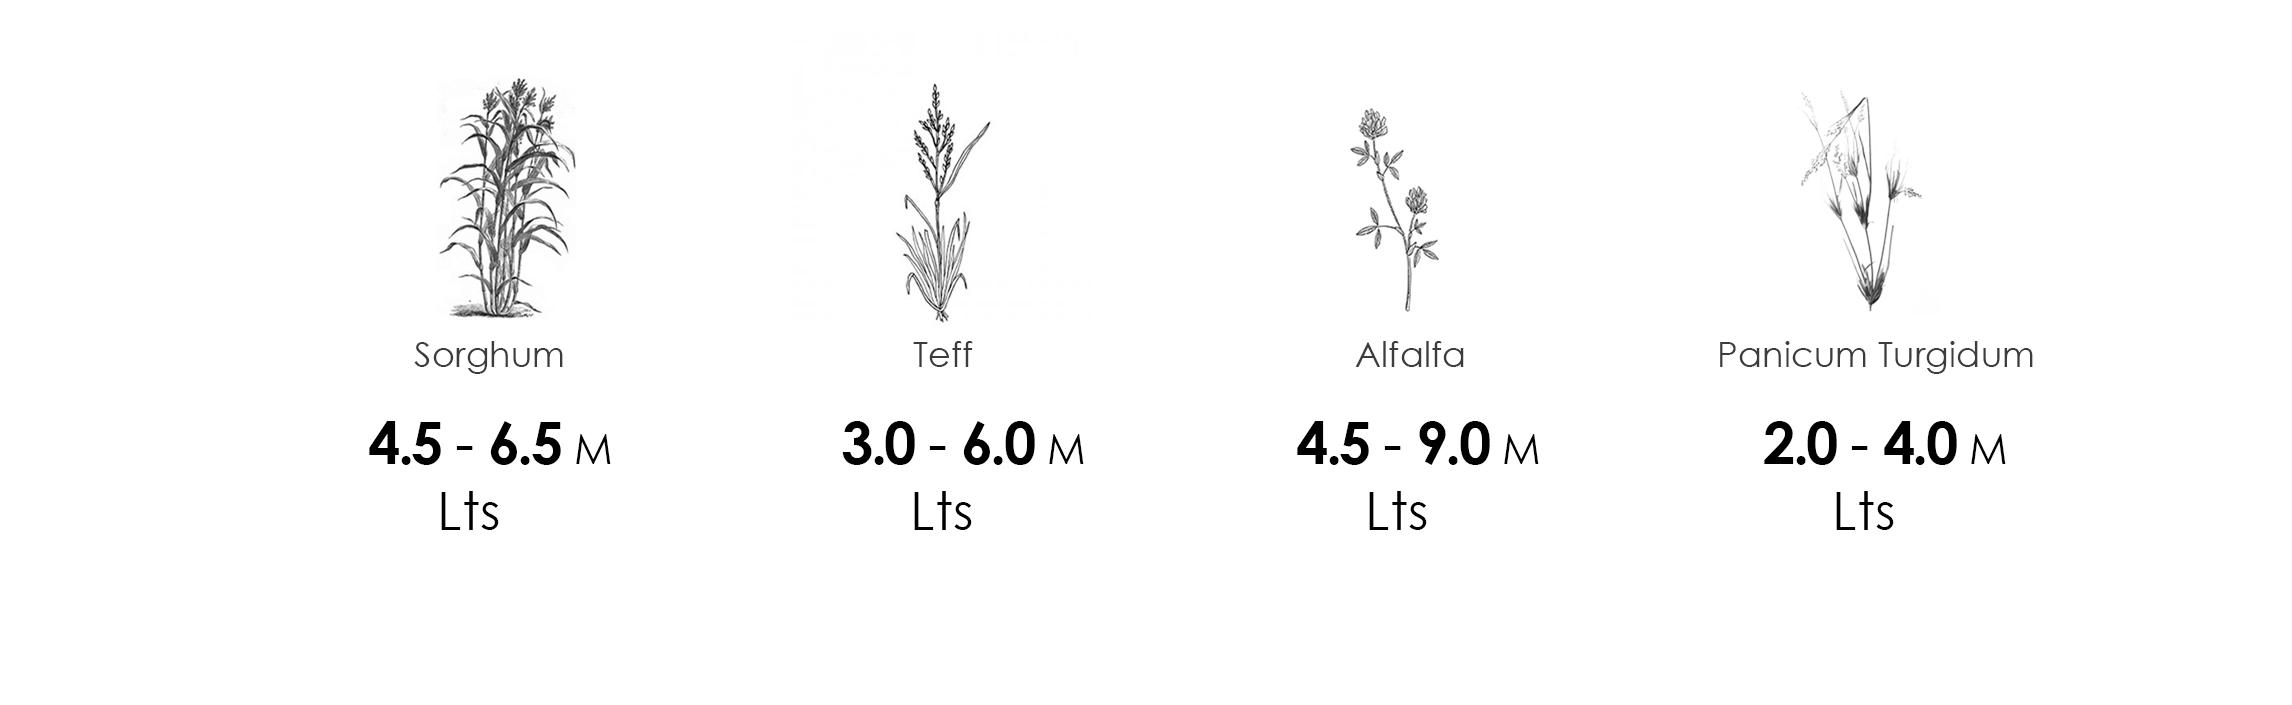
To define our agricultural potential, we evaluated the water use, potential harvest and animal fed per hectare for Sorghum, Teff, Alfafa and Panicum turgidum. The water use varies from 200 - 900mm, which is covering 12t to 60t per Hectar. The provided data shows that Teff and Panicum turgidum give more productivity to cover a much larger area while requiring less water. However, considering the drought resistance and proximity to our site, growing all of them would be the most profitable.
Daily minimum safe water requirements for survival (Person / Day)
Daily minimum safe water requirements for survival (Litre / Head)
Potential crops & fodder cultivation (Litre / ha)
References or
FIG 02 - 2.1.1 or xxxx
WATER COLLECTION
Even if the Somali region is partially occupied by the Wabi Shebelle Basin, with an estimated 558Mm3 of water that could be used, groundwater exploitation is not very common in the area. This is due to the fact that the aquifer lies at an average depth of 250 meters and under several layers of hard rock, making it too expensive for the local context to use (Kebede, 2015)14
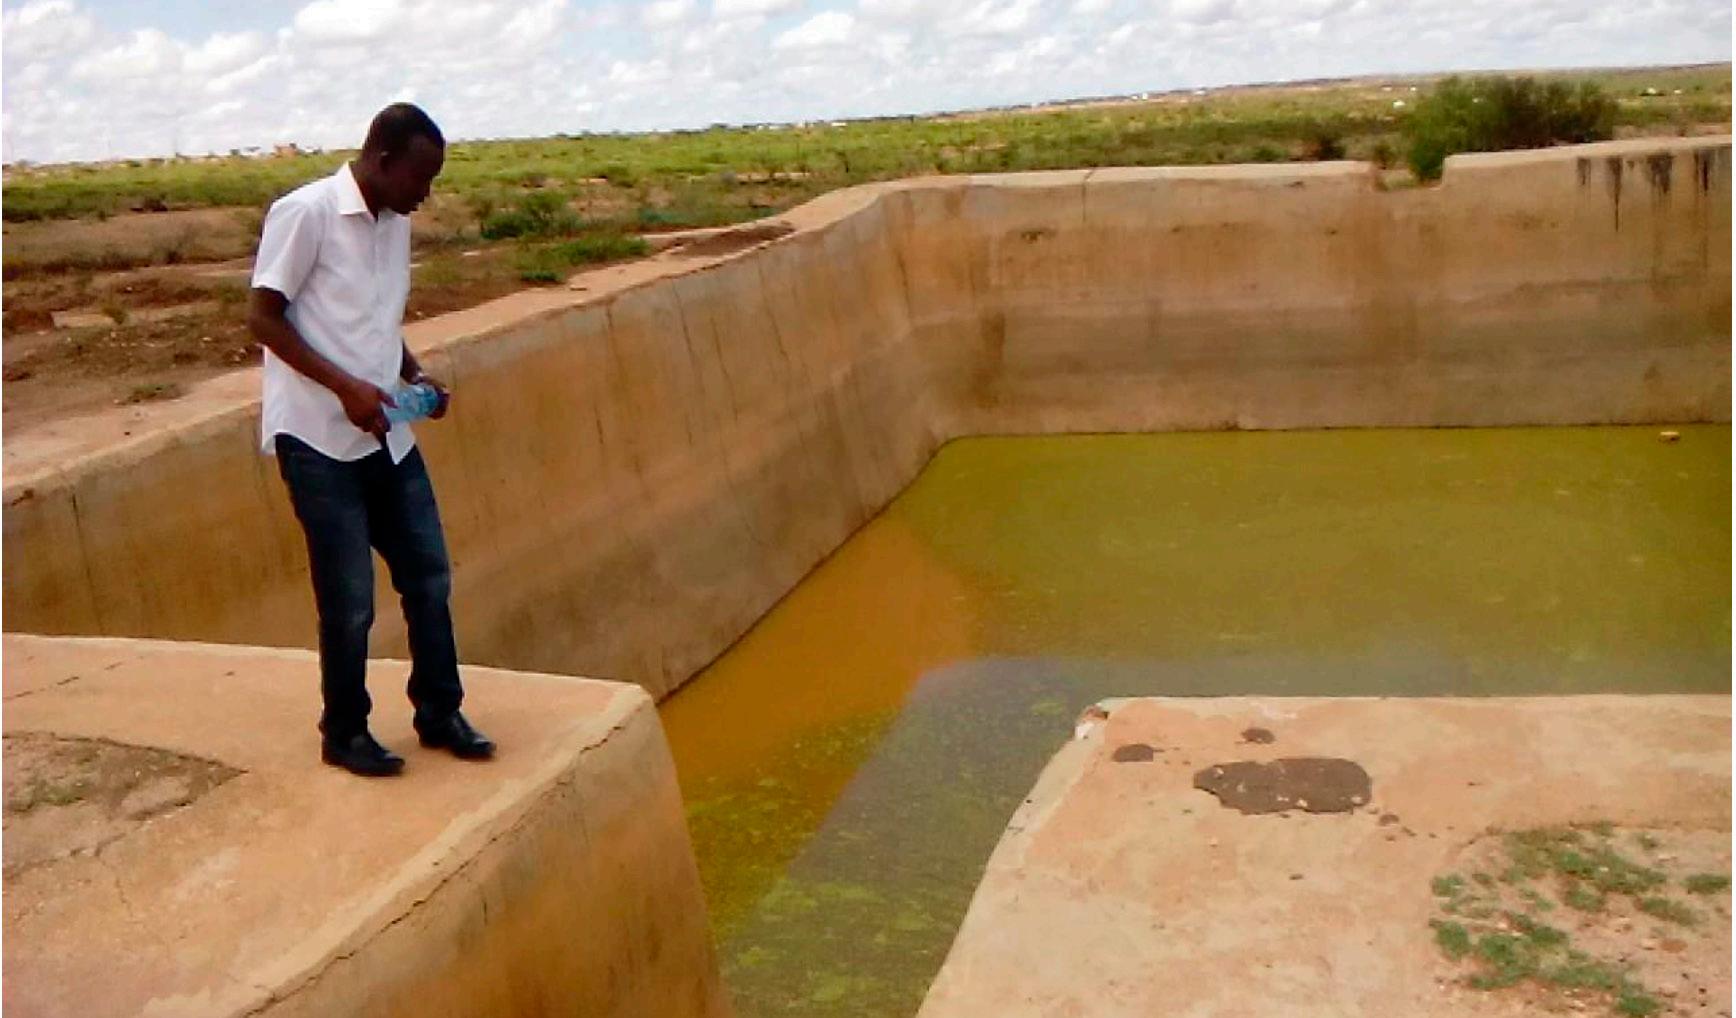
Rain water harvesting remains the main water source in here, where it is collected and stored by the construction and use of run-off harvesting ponds, also known as Birkas. This practice is very common in Ethiopia’s rural areas, where around 15 to 20% of the human and over 80% of the livestock consumption is covered with water coming from either rivers, streams or ponds. (Binyam & Desale, 2015)4. According to them, these Birkas hold about 60 m3 of water in average. Even so, rainfall patterns are becoming increasingly irregular and harder to predict. Rainfall in the Somali region ranges between 200 mm/year in the south to 800 mm/year in the Jijiga plains, with between 50 and 85% of the annual precipitation falling during the rainy season known as the Kiremt (Fazzini et al., 2015)17
This combination of water falling in a short period of time and being stored in open ponds often results in stagnant pools which contribute to the proliferation of waterborne and water related diseases such as malaria or cholera. On top of that, the fact that water is coming from surface run-off increases the risk of pollutants flushing into the ponds, creating other health issues when it is used for drinking (Kassa, 2018)16.
Typical birka Diagram with dimensions
02 - 2 WATER ACCESS
Potential sources and management
Even if some improvements have been made globally, pure water access in Sub-Saharan Africa has worsened in the past two decades. According to the WHO-Unicef Joint Monitoring Program Report (2019)12, 85 million people depend on surface water, 180 million people rely on unimproved sources and 135 million have access to a limited water supply to cover their basic needs. When it comes to rural Ethiopia, only 31.06% of the population have access to either safely managed or basic water, whereas the remaining 68.94% depend on limited, unimproved or surface water sources, and only 3.81 % of the population have access to safely managed sanitation services (2017)13. New strategies combining different sources with greywater recycling have to be developed in order to tackle the increasing pollution of surface water sources and the water scarcity projected for the coming years.
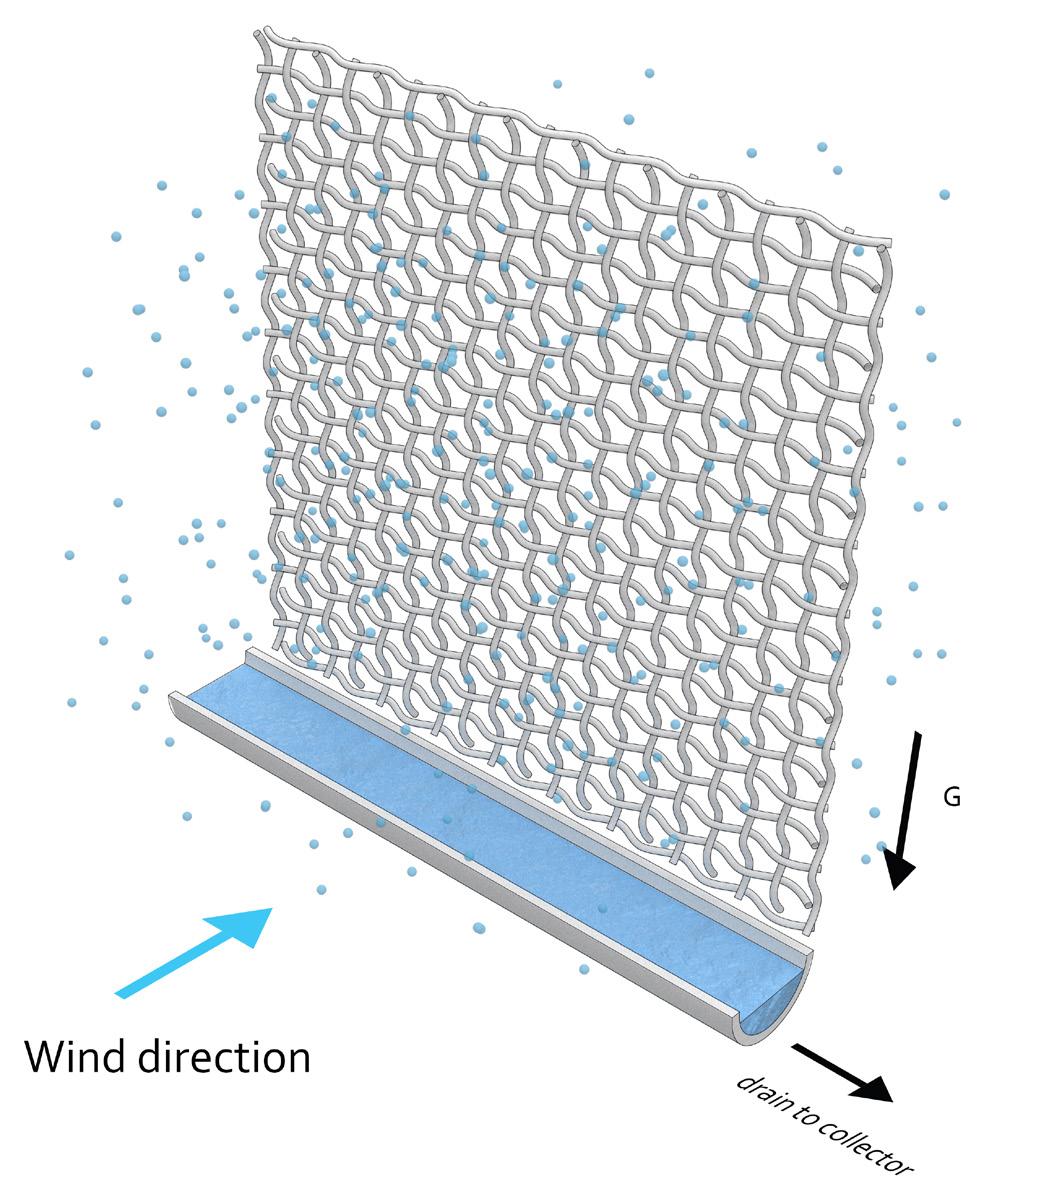
FOG COLLECTION Fog water is an alternative source in contexts where rain is scarce. The appearance of Fog clouds is the result of the saturation of air with water vapour. Whenever this micrometric droplets encounter a cold surface they condense into water that can be collected via a system of gutters and pipes (Salehi et
FIG 02 - 2.1.1 People collecting water from a water point
02 - 2.1
al., 2020)18. Fog events can occur throughout arid zones close to the ocean, where clouds are regularly formed above water and carried inland by prevailing winds, turning into fog once they reach higher ground (Rivera, 2011)19. This fog currents allow for the use of passive water collection devices, using different meshes to enable harvesting as the fog passes through them.
These fog water collectors (FWC), can be divided into 3D and 2D FWCs according to their geometry. 3D devices are not subjected to a particular wind direction, their shape is most commonly a cylinder or two cross-intersecting perpendicular panels. Whereas 2D FWCs are made out of flat vertical structures fixed facing the main wind direction (Regalado & Ritter, 2019)20.
According to Regalado and Ritter, the potential water to be harvested from fog events is difficult to estimate due to the high number of variables present, both climatic, device related, and those appearing in the interaction between these two. Just to name a few, we find droplet size distribution, liquid water content of the cloud, wind regime, collector efficiency, aerodynamics, turbulence, mesh clogging, droplet attachment/
FIG 02 - 2.1.1 Fog collector concept diagram
References or FIG 02 - 2.1.1 or xxxx
detachment and filament impaction mechanics. This is why, the best way to determine potential fog water collection is physical on-site experimentation. Even so, we know the chosen mesh pattern will determine its efficiency. As Rivera9 states, with a shade coefficient too small, a minor percentage of the fog droplets will hit the mesh, but if it is too large, most of the fog will go around it. He also introduces the following formula for the theoretical estimation of the collection efficiency:
Where ηAC corresponds to the aerodynamic collection efficiency, or the maximum amount of fog that could be captured by the FWC, ηcapt stands for capture efficiency, meaning the fraction of droplets that are actually captured by the mesh, and ηdr represents the proportion of water that reaches the gutter, out of the amount that is captured by the mesh.
ηcoll = ηAC.ηcapt.ηdr
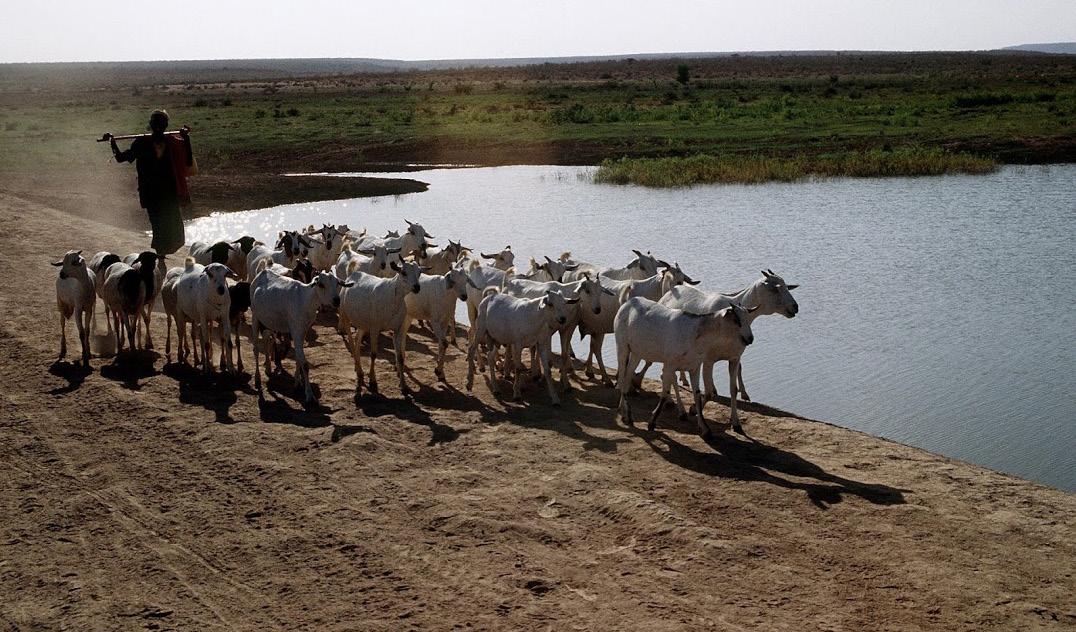
FIG 02 - 2.1.1 pastoralist with a flock of goats, Ethiopia.
DEW Dew is defined as the condensation of water vapour into liquid, when in contact with a substrate. For this to happen, the temperature of the substrate has to be lower than that of the surrounding atmosphere. According to Beysens21, an ideal dew condenser should be a light sheet thermally isolated from massive parts and from the ground. Without becoming too light, as it could easily be warmed by the surrounding air. These condensers should be placed in open areas where the wind velocity is low, the humidity is high and with a clear view of the sky. This allows for the surface to emit more energy than the one received and absorbed, enabling it to steadily cool down during night-time (Sharan, 2011)22.
Having high wind velocities and low humidity in our site, Dew does not seem to be a significant water source for our strategy.
02 - 2.2
FIG 02 - 2.1.1 Dew condenser concept diagram
GREYWATER
Greywater is the wastewater containing no input from toilets, this groups the wastewater generated in bathing, hand washing, laundering and kitchen sinks. Its volume has been estimated at around 75% of the residential sewage (Eriksson et al., 2002)28, and its use can therefore be very important in water scarcity contexts. Nevertheless, a few parameters such as pH, bacterial presence, turbidity and the presence of inorganic chemicals should be evaluated in order to determine the best way to use it. Different multi stage treatment units have been developed containing chambers for suspended solid settling, anaerobic degradation and sand filtering to improve its quality for irrigation. In the past decades a few guidelines have been introduced for GW use, which recommend using it only on trees, forage crops, or on vegetables with low water content, considering a minimum number of days between irrigation, harvest and consumption (Leas et al. 2014)29.
02 - 2.4
WATER STORAGE Water storage has to be done correctly to avoid the pollution of the water supply and the spread of water borne diseases. Storage tanks significantly contribute to the reduction of microbial presence through sedimentation processes. A very important aspect to consider in a water tank is its capacity, smaller tanks can present higher levels of bacterial contamination, due to the fact that the sediment in the bottom is more likely to become agitated and mixed with standing water (Meera & Ahammed, 2006)27. According to Meera and Ahammed, the tank’s material is also important in the quality of stored water, potentially causing water alkalization if it is made out of ferrocement.
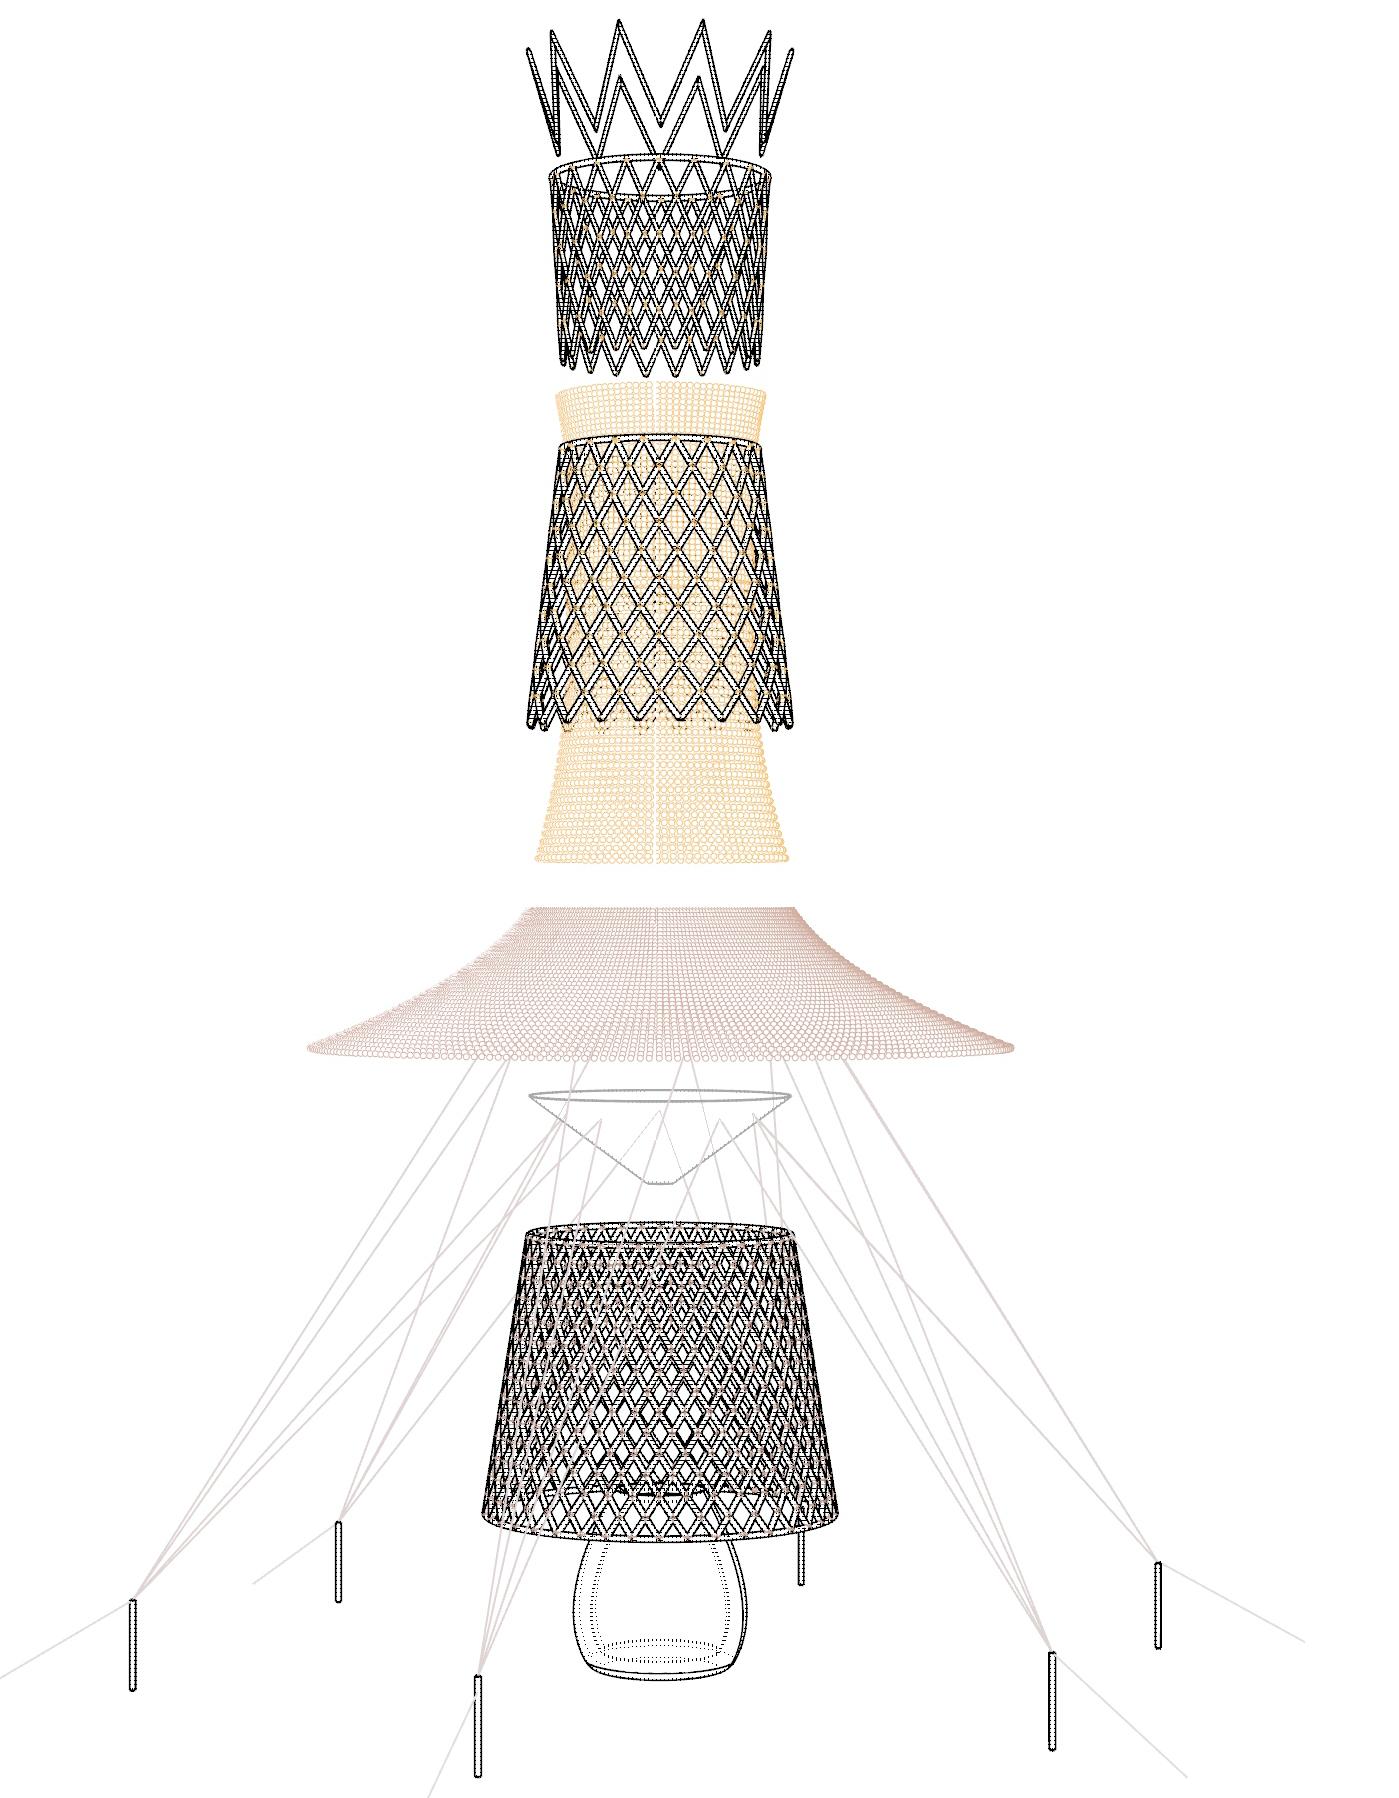
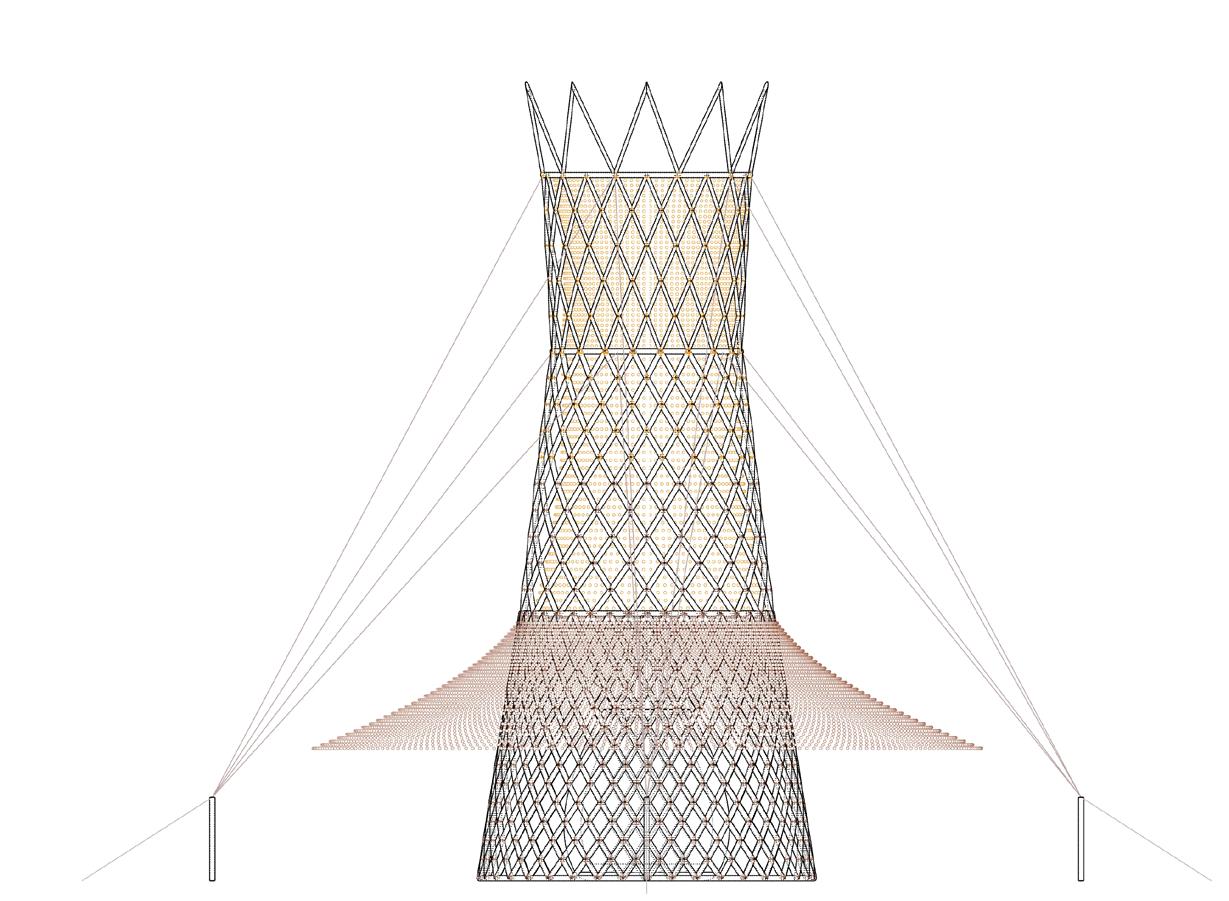
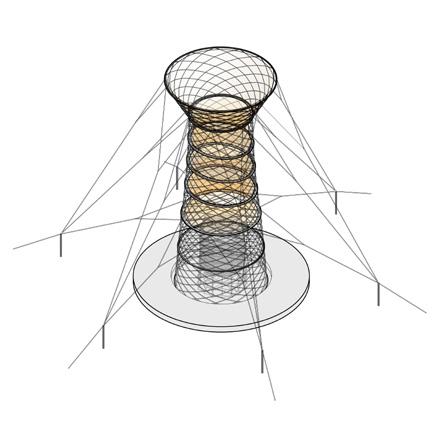
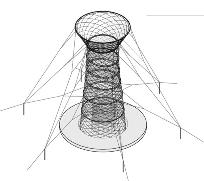
Warka Tower is a water harvesting device designed by Architecture and Vision, which is aimed at providing an alternative source of clean water for rural populations that have a reduced access to it. The tower has been designed to be built in regions that lack infrastructure. It is inexpensive, can collect rainwater and harvest water from fog and dew. The first pilot tower was installed in 2015, in the Dorze region of Ethiopia.
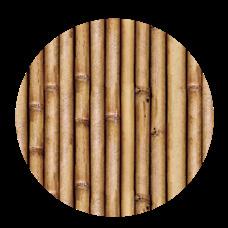
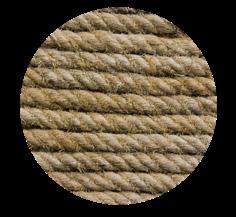
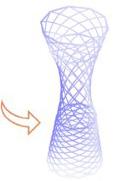
The tower consists of 6 parts which can easily be assembled within a day incorporating traditional construction techniques. The framework of the tower comprises of lightweight bamboo stalks interwoven in a pattern that offers stability in the face of strong wind whilst still allowing air flow 29. Natural fiber ropes are used to tie the overlapping sections of the bamboo stalks in place. Within the bamboo framework is 30 m2 of polyester mesh which collects droplets of dew. As the droplets begin to accumulate, they trickle down into a storage container at the bottom. The water then passes through a distribution network transporting it to the collection points 30 .
Warka Tower is designed to be operated by the villagers, providing a sense of ownership. It also has a canopy which provides shade, creating a social space for the community. Each tower is supposed to collect up to 100 litres of water a day. This claim is supported by a tower which was constructed in a semi-arid region in India.31
The Warka Tower was selected as a precedent project as it was installed successfully in proximity to the proposed site of intervention.
FIG 02 - 2.1.1 Warka Tower axonometric diagram
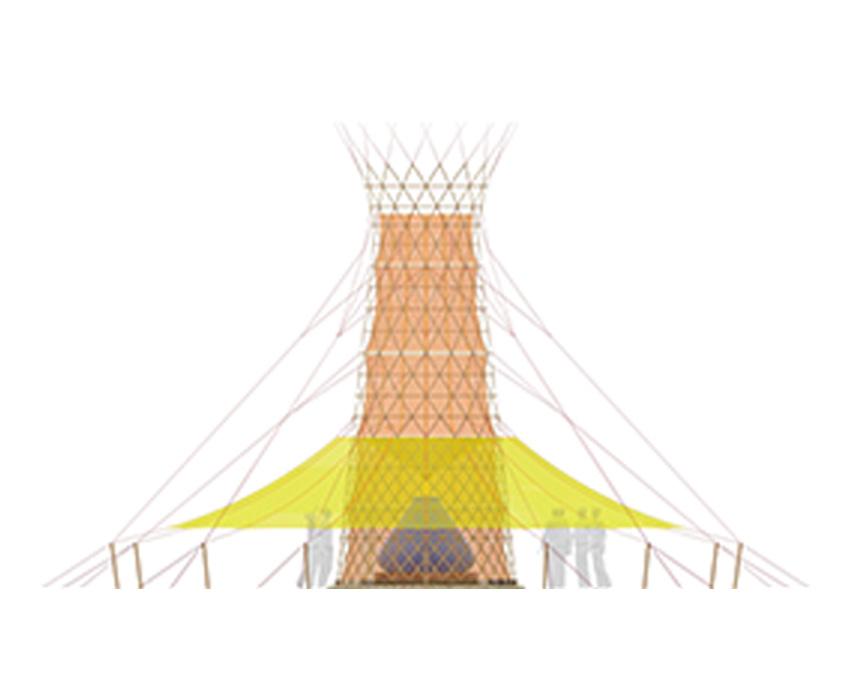
FIG 02 - 2.1.1 Warka Tower section diagram
02 - 3 MOBILITY
Pastoralists, IDPs and Refugees
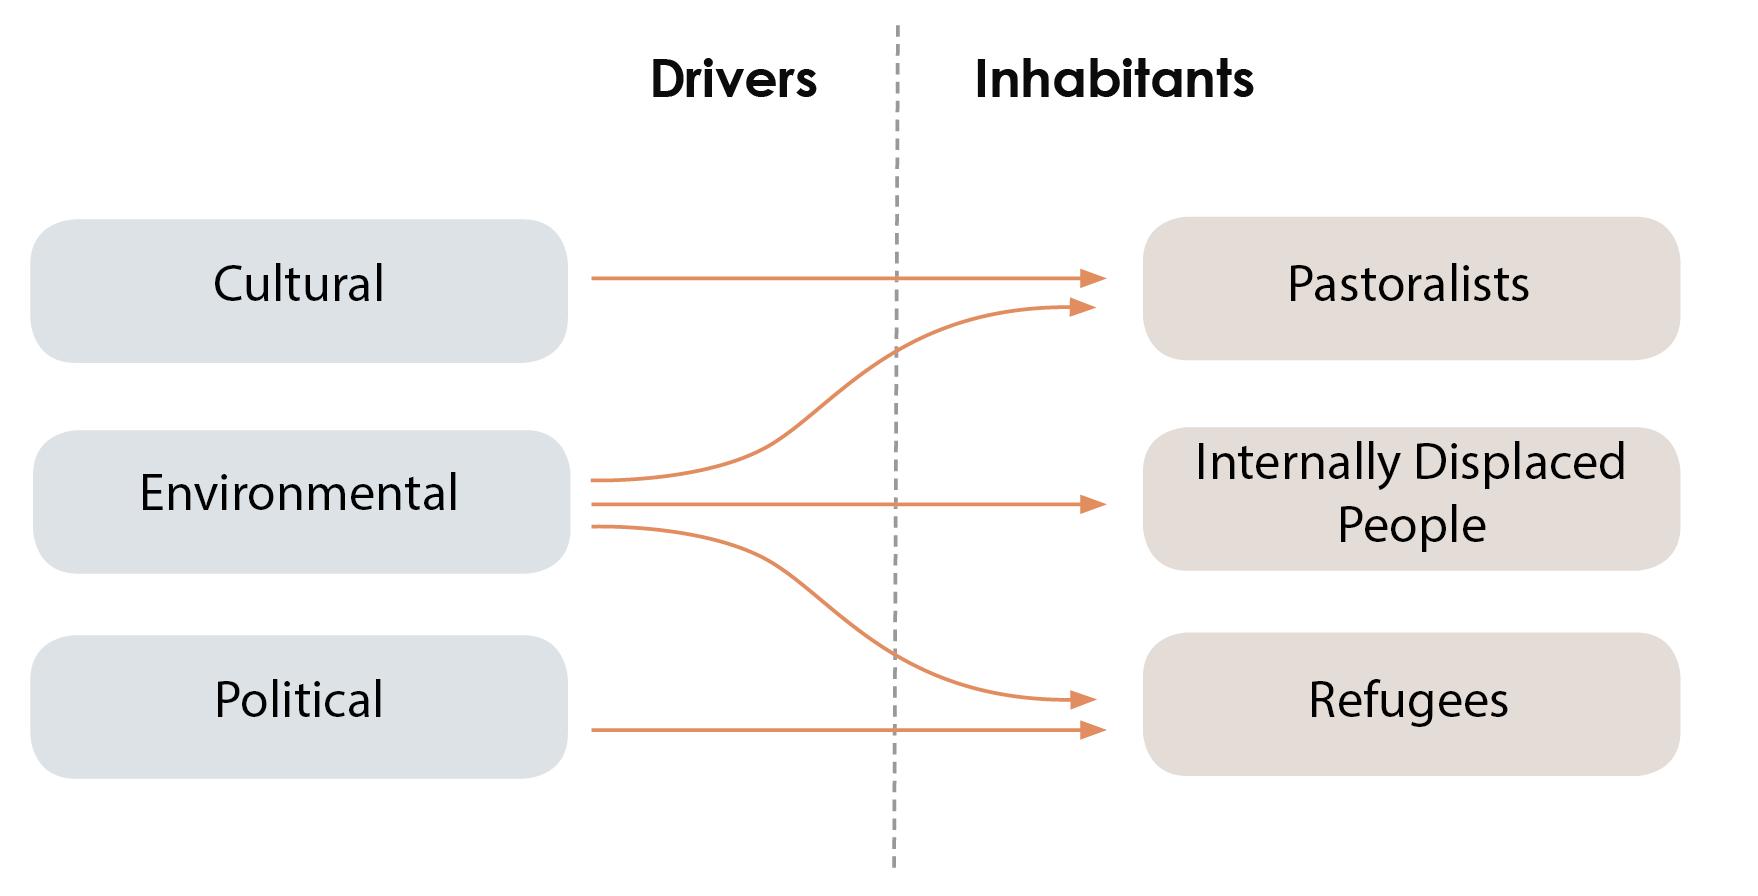
Mobility is a key aspect to understand the current situation in Eastern Africa in general and in the Somali region in particular. There are several drivers for it, some of which are cultural, other are political and most of them have an environmental aspect playing an important role.
Pastoralists have historically seen mobility as a resource for survival and continue to do so. One of the main reasons for this is that they live in remote areas where fodder and water availability are scarce and their existence varies seasonally and yearly. This resulted in a tribal organization that moves collectively from one place to the other and considers every new settlement to be temporary until conditions change and they will have to move elsewhere in search for better resources. Another aspect explaining their mobility is that they get a better price for their animals in markets distant from where the best pastures are.
Nevertheless, changes in land management policies in the recent years favouring permanently settled farmers over moving pastoralists, along with changing climate conditions, are going against pastoral mobility, since grazing lands and water sources are becoming harder to access. This is leading to conflict between different groups and to death of a high number of animals due to insufficient water and grass. Along with their livestock, pastoralists are losing their main source of survival and end up having to resettle closer to administrative centres where they can have access to government aid, therefore changing their status to Internally Displaced People.
On top of that, climate change is reducing the available natural resources all over Sub-Saharan Africa, causing more conflicts over land-control, leading to civil war in many countries with pre-existing tribal disputes. This is the case in South Sudan and Somalia, having 1.6 million[i] and 750.000 nationals[ii] living in neighbouring countries respectively, many of them currently settled in Ethiopian refugee camps and centres, where they hope to temporarily move until conflict is over and they can return. But such moment can take several years and sometimes it may never arrive at all.
The Somali Region of Ethiopia clearly shows how these mobility patterns are affecting the landscape. A number of refugee camps and informal settlements have appeared here, especially in proximity to the Somalian border. They act as a quick response to the current crisis, with different degrees of planning, but there is no long-term idea as to what to do with them. In the meantime, camps such as the one in Kebribeyah have existed in a very precarious condition for more than 30 years now.
This is why we think the situation should be addressed in a more sustainable manner, addressing the humanitarian crisis while also considering the pastoralist lifestyle and the coexistence of all this people within a settlement built using local materials.
PASTORALISTS
02 - 3.1
Pastoralism is a land use system and a way of life for people who derive most of their income from keeping domestic livestock reared in conditions where most of the feed is natural rather than cultivated. Their activities make up an essential contribution to local and national economies and their cultural lifestyle is deriving their mobility. Pastoralists keep moving around their territories and sometimes cross borders to ensure the survival of livestock and sell it in local and foreign markets.
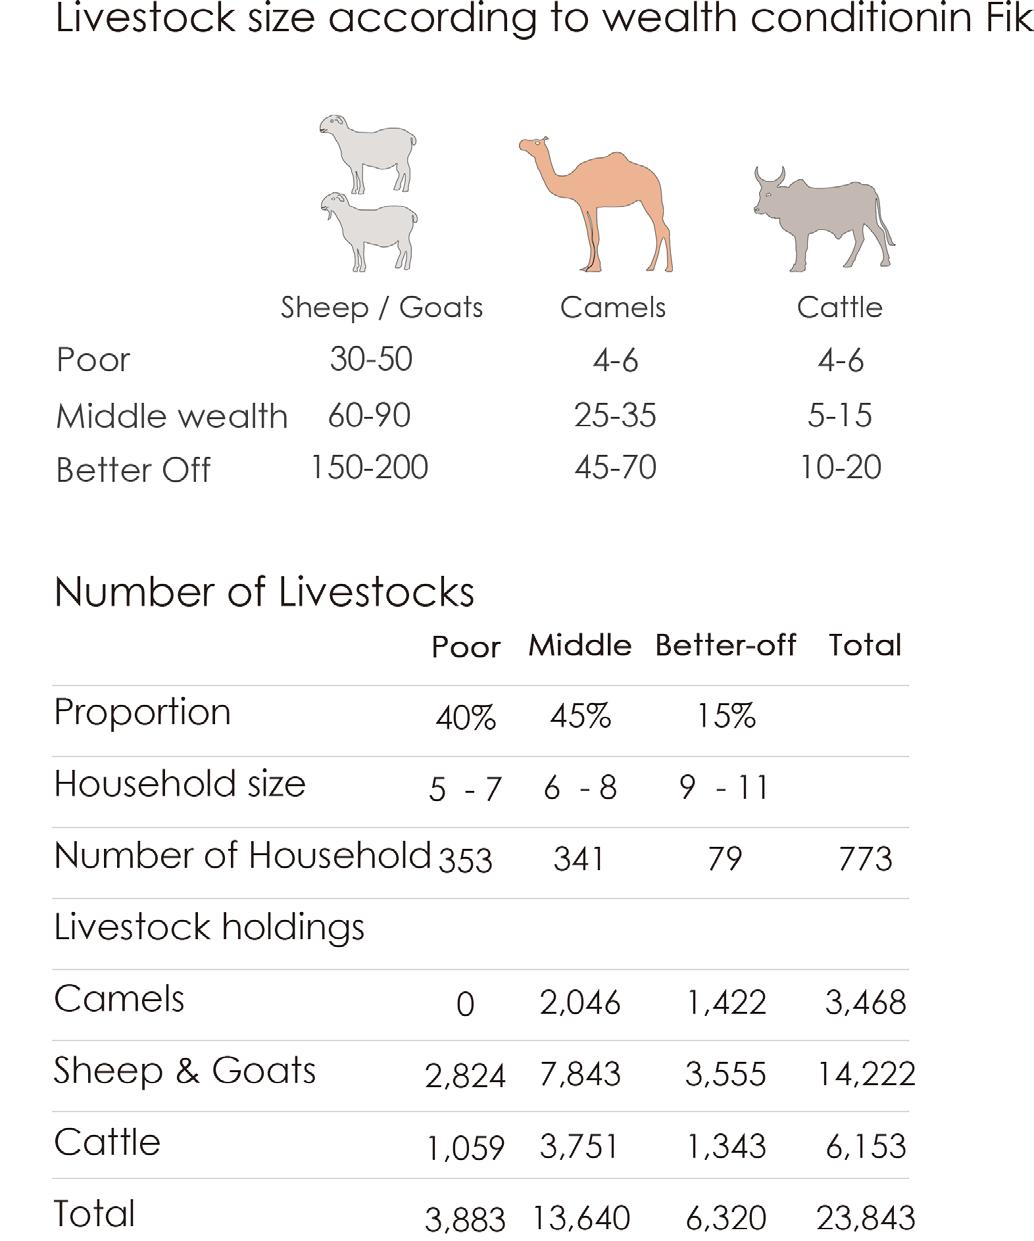
Eastern Africa is home to one of the world’s biggest populations of pastoralists, with an estimated number of around 22 million pastoralists wandering around for more than 3000 years now. They depend on clean water and grazing lands to survive in arid and semiarid biomes, which account for 60 percent of the total area in the Horn of Africa. In the Somali region, and especially the Kebri-Beyah region, around 60% of the rural population are estimated to be pastoral nomads of around 3000, while another 25% of them are Agropastoralists. The number of livestock however varies according to three different wealth conditions.
Climate Change is however affecting the lifestyle of pastoralists causing desertification, which is turning the arid and semi-arid lands they inhabit into deserts. Dry seasons are becoming longer and rainy seasons shorter with great floods washing the soil nutrients and making it harder for plants to grow; This is causing the death of livestock due to lack of water and grass, which in return is affecting the mobility patterns of pastoralists and forcing a large proportion of them to resettle in refugee and IDP camps relying on aids for survival.
Pastoralist mobility behaviour can result in different settlement-types varying in terms of duration, activities, and housing typologies.
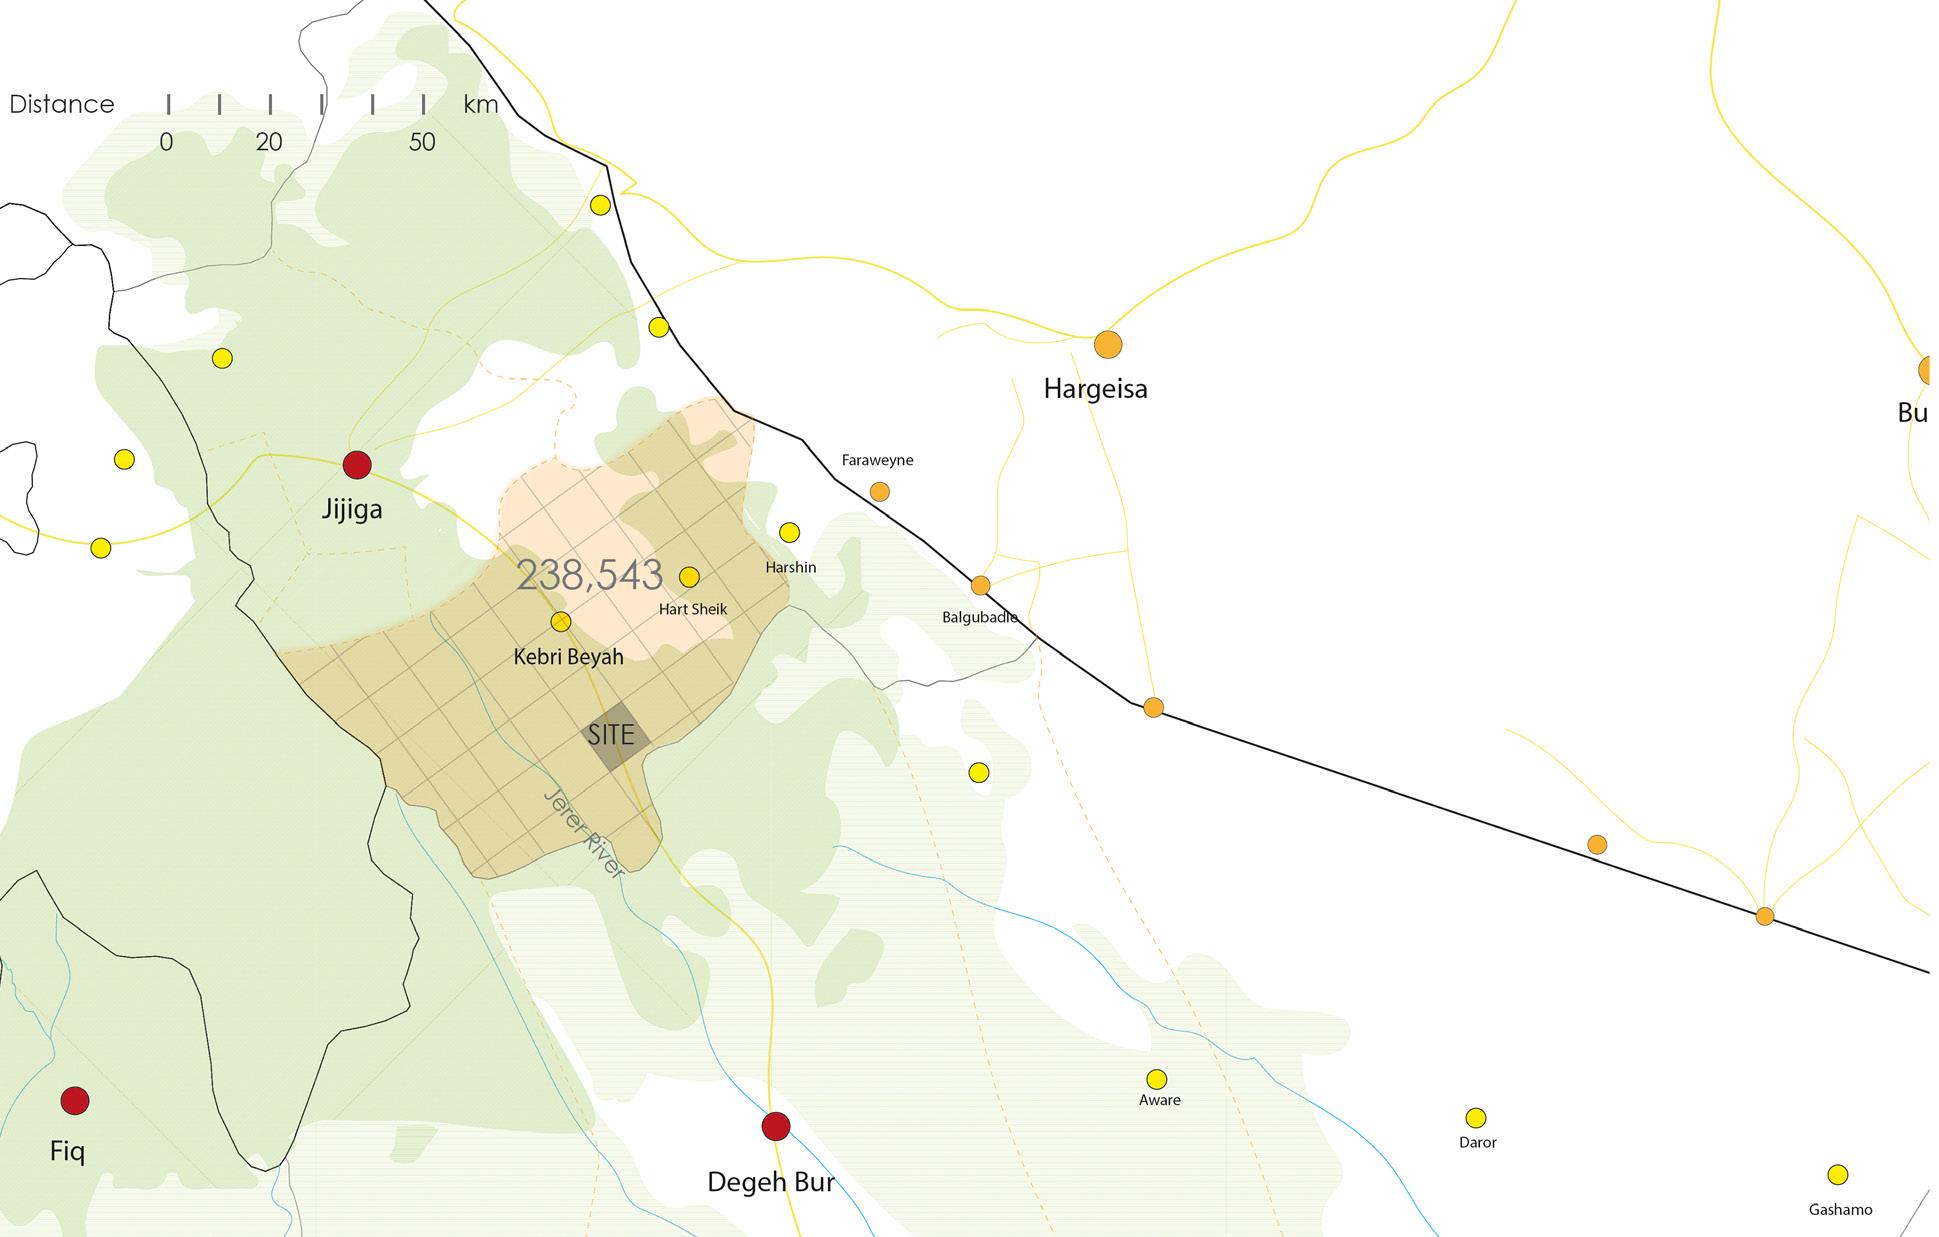
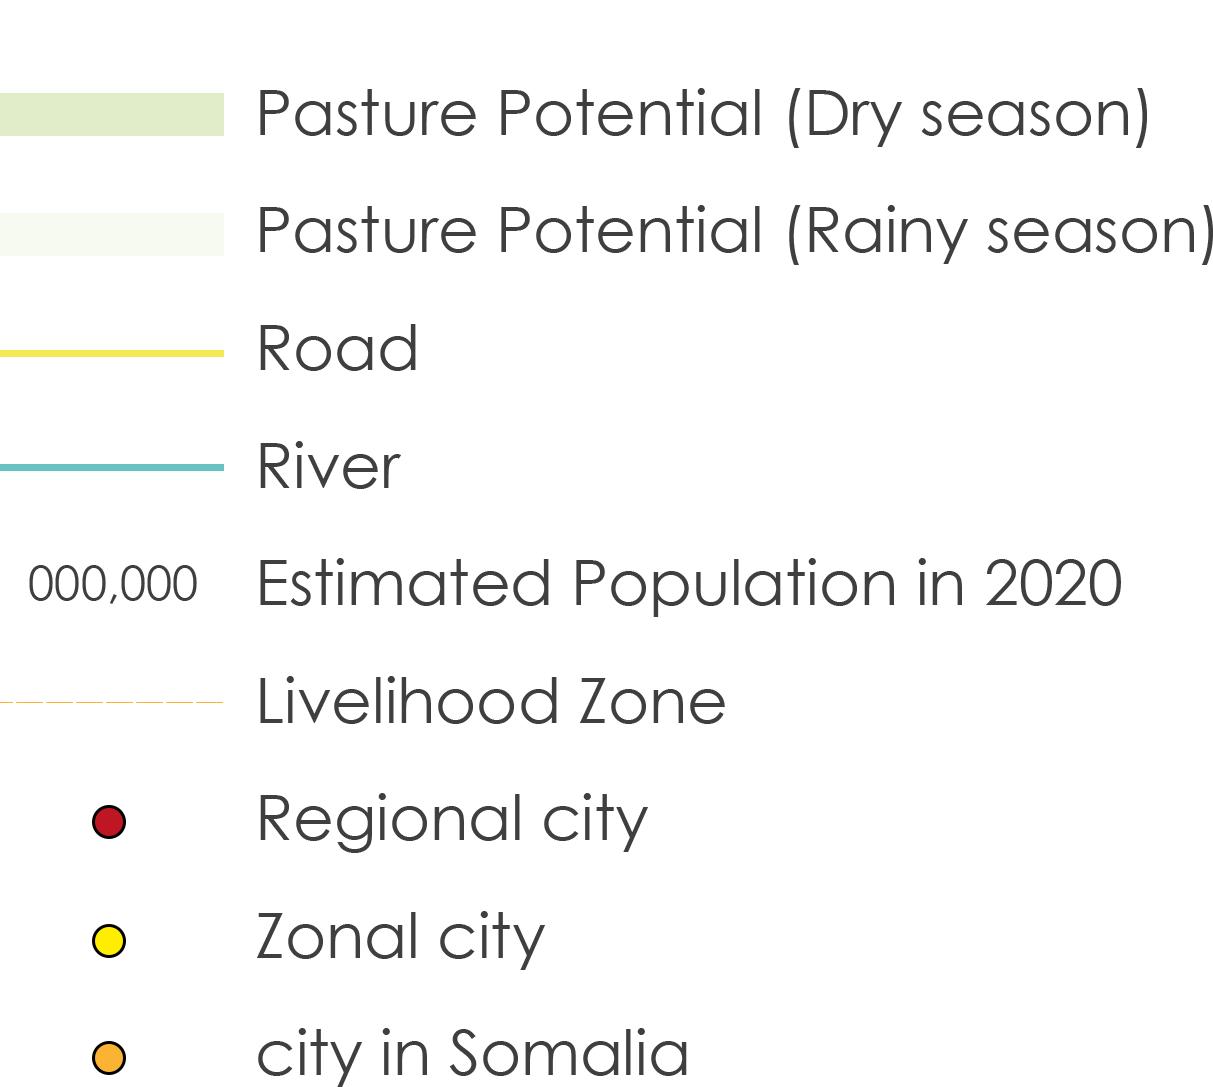
Top Left: Map showing the relationship between our site and the surrounding pasture potential in both dry and rainy seasons
PASTORAL NOMADS
02 - 3.1.1
Pastoral nomads move with their herds in irregular patterns following seasonal showers, trying to escape the dry season. They perfected their housing forms for their nomadic way of life in which settlements are demountable making them easy to be assembled and disassembled temporarily throughout their journey. Although the availability of demographic and statistical data on mobile pastoralists is not easy to keep track of, it was clear that the proportion of nomads has declined over the past few decades due to climate change.
Housing Typologies and Settlements
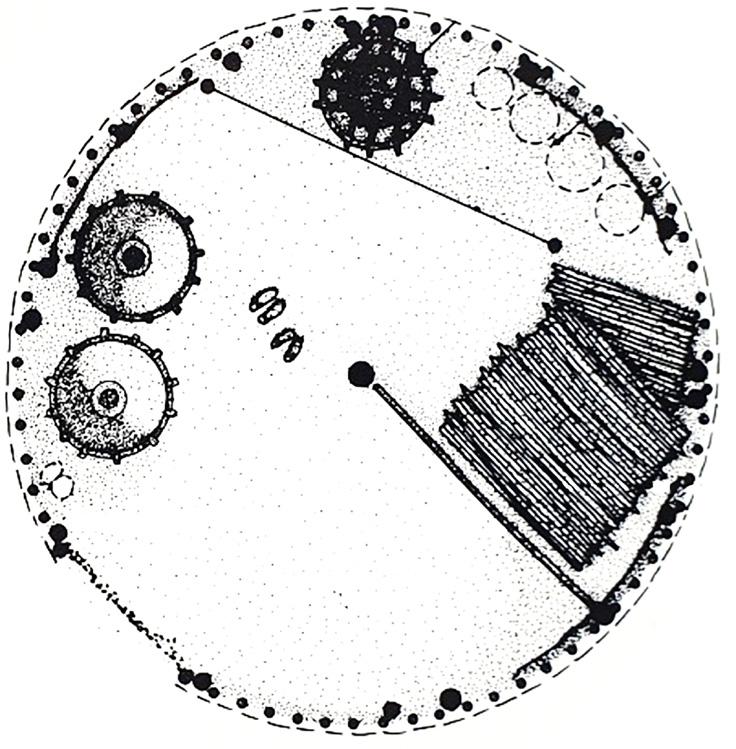
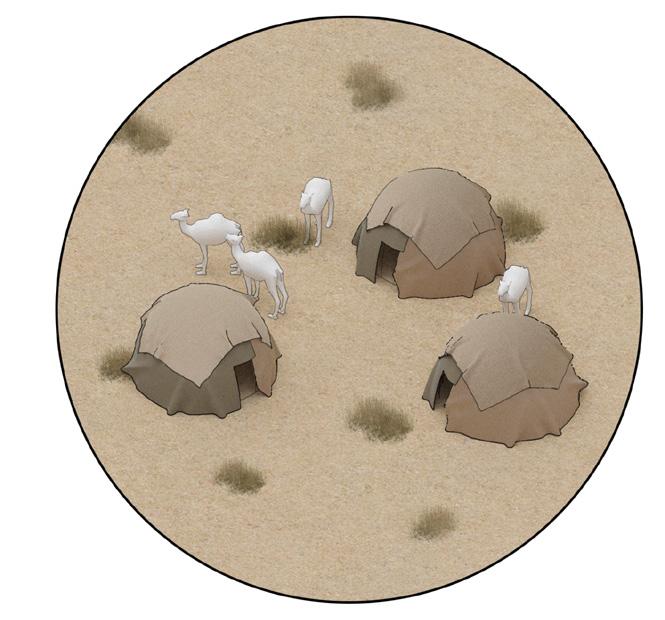
The nomadic shelter in Somali is called Aqal; it represents a simple form of an armature tent optimized for the nomadic life and harsh environmental circumstances. It is separated into two areas: one at the back, which holds the sleeping area, and one at the front, which is used as a living area. There might also be an outer uncovered veranda for cooking and gathering activities
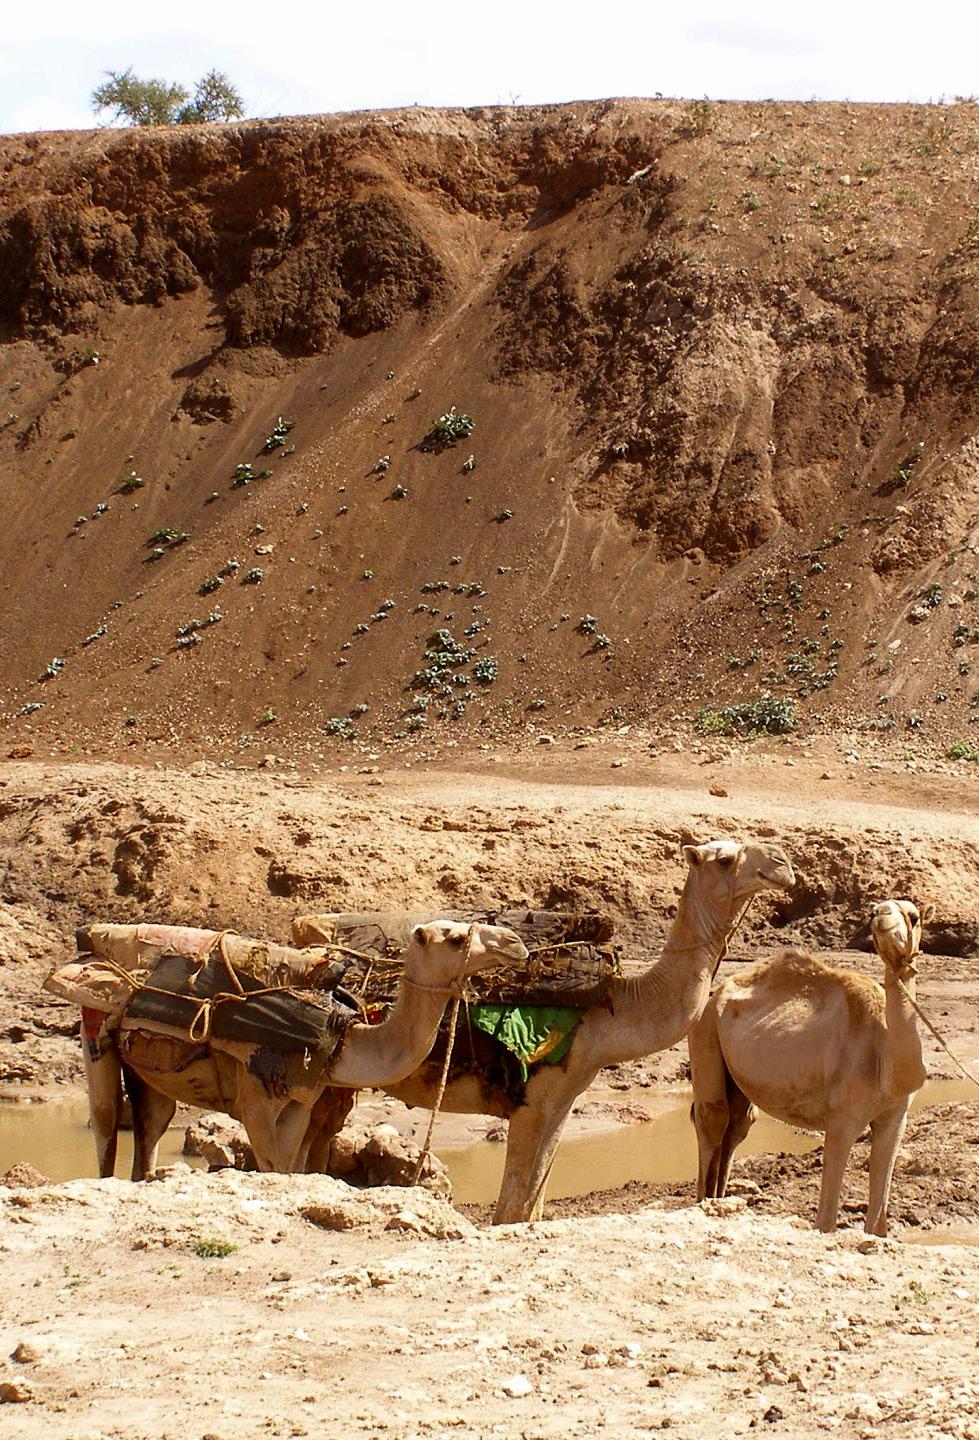
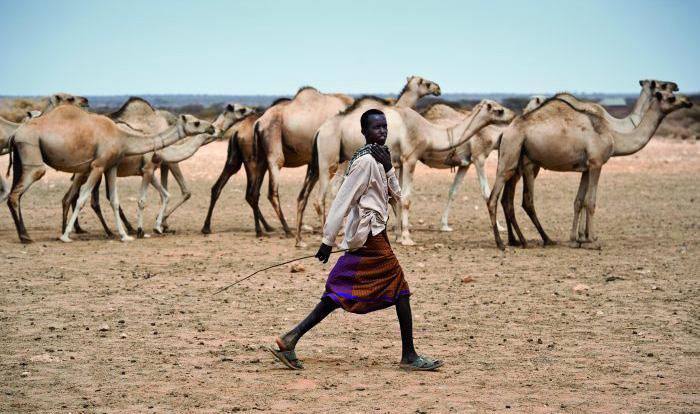
FIG 2 A typical pastoralist herding camels in search of pasture in the Somali region
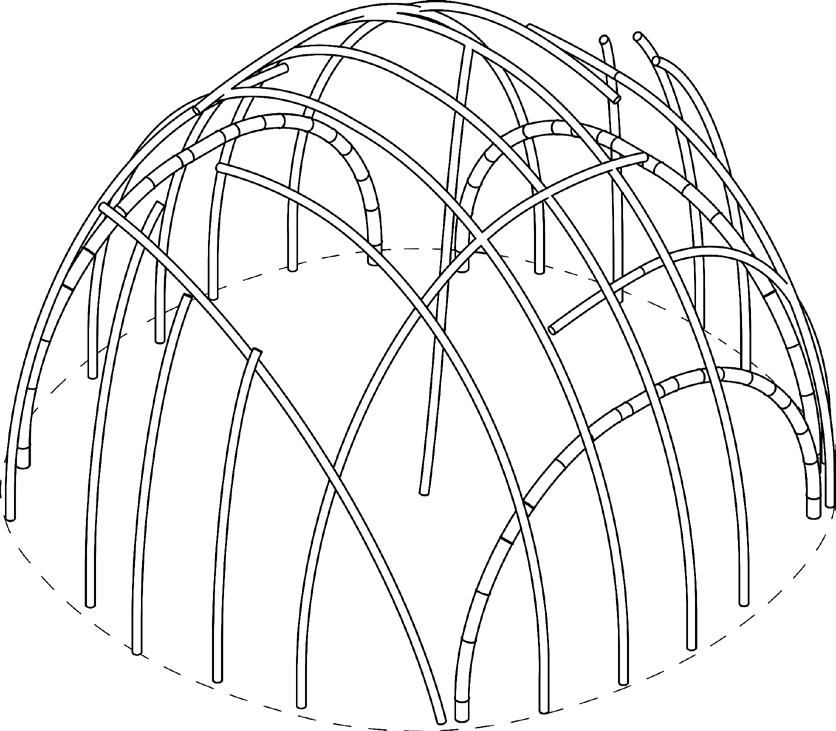
Structural diagram of the construction of a Somali Aqal
Floor plan showing various mats and storage containers
The Aqal is a hemispherical dome, 1.5-2.13 m in height with an elliptic base, constructed of 3 parts: semicircular shaped poles that give it its strength and form, vertical poles for reinforcement, and layers of woven mats for covering and decoration. This portable hut is mainly of female construction as they are responsible of gathering wood, mounting and dismounting the house, carrying it on camel backs and maintaining its components.
The Aqal takes its shape from the curved poles known as dhigo, which can be divided into two categories. Qabax, the thicker curved poles, are the main structural supports obtained from the acacia tree roots and expected to last from ten to twenty years. It is worth mentioning that nomads never touch the trunk or the foundation root as its removal would destroy the tree itself, but they use instead its lesser roots of 12 meters.
Lool are the thinner curved poles made from flexible reed-like rods that help implement the shape and hold the coverings in place. The second vital component is the tall vertical poles (udubs) which are used to support the framework of the house and partition it.
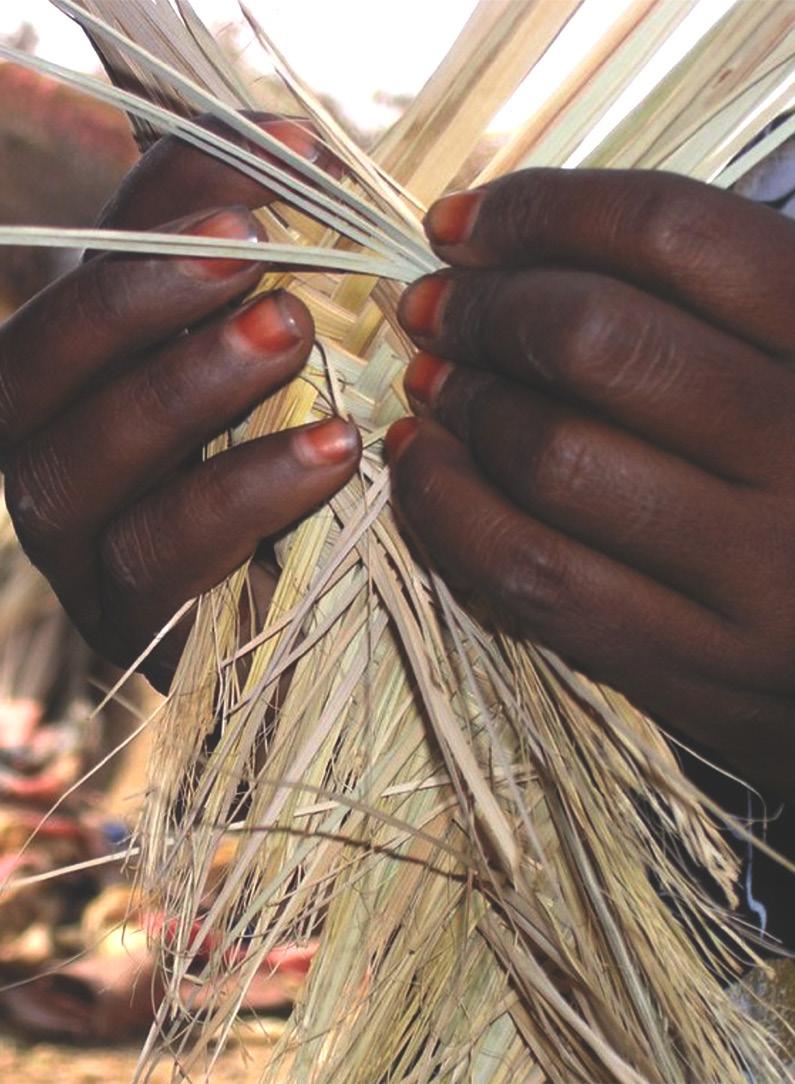
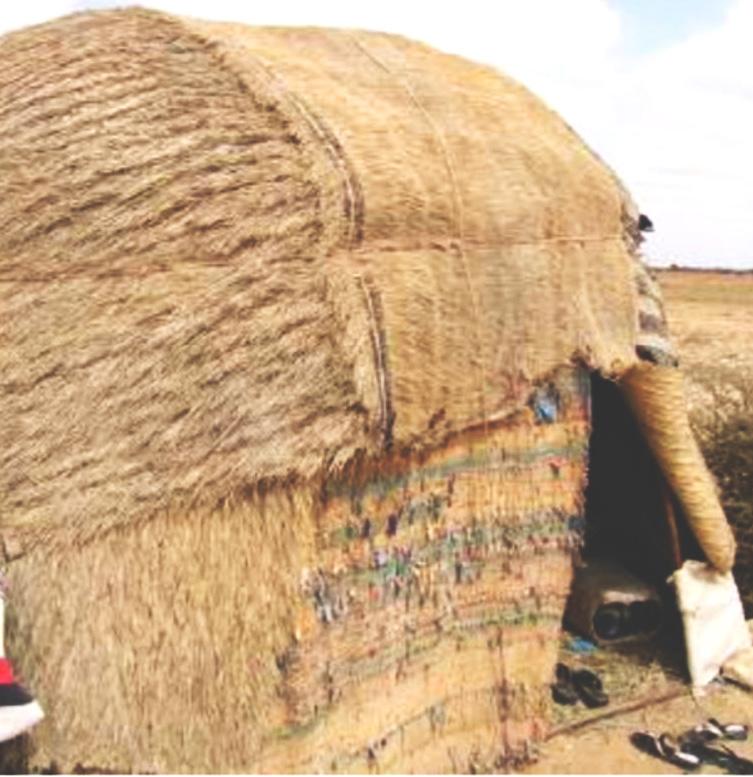
As Soon As the frame of the house is completed, it is covered usually by animal skin or woven mats made of local grass; These mats are handmade for which specific types of grass are gathered from woodland after days of scouting. When the grass is collected, it is assembled and interlaced, and followingly a single long sheet of mat is made. Hundreds of single plaits are then interweaved to form a large mat covering the hut. Once finished, the huts are fastened to the ground diagonally and horizontally not to be blown away by storms. During rainy seasons waterproof plastic sheets called shiraac are used to protect the huts on top of the mats.
A Somali nomadic moving camp consists of an average of 20 huts in which each group of huts is surrounded by a hedge for the protection of both residents and livestock from predators. The structural framework, the mat cover and the entire household items of the mobile hut are tied to the back of a camel and taken along when moving to new pastures.
FIG 5 Left the initial phase of the interweaving process of a nomadic grass mat done by a somali nomad
FIG 5 Right A mobile nomadic hut (Aqal) after assembling the different grass mats near Kebri-Beyah
Schemtaic of a typical moving pastoralist nomads camp with tree branches separating the different families.
Limitations
While the domed Aqal has a stiff and aerodynamic shape which withstands the strong desert storms, it is only of restricted suitability for long-lasting settlements. It is limited in size due to its structural grid and cannot satisfy the rising demand for larger living spaces and the development of new building types (schools, shops etc.) which require extended structures. Moreover, the construction materials are not suitable for building large scale settlements as they depend on the acacia roots which can be hardly available in large quantities with the desired specifications.
TRANSHUMANT PASTORALISTS
02 - 3.1.2
Transhumant Pastoralists move seasonally, aiming to guarantee their livestock’s survival during the dry season by moving to higher lands. They are part of an agricultural system that combines permanent arable agriculture with cyclical movement of livestock; If a village has no access to nearby pastures, part of the camp organizes transhumance to a distant place where forage and water can be found for their livestock. On the other hand, the other part stays permanently with a small number of animals providing their daily feed. These permanent settlers are responsible for cultivating the land.
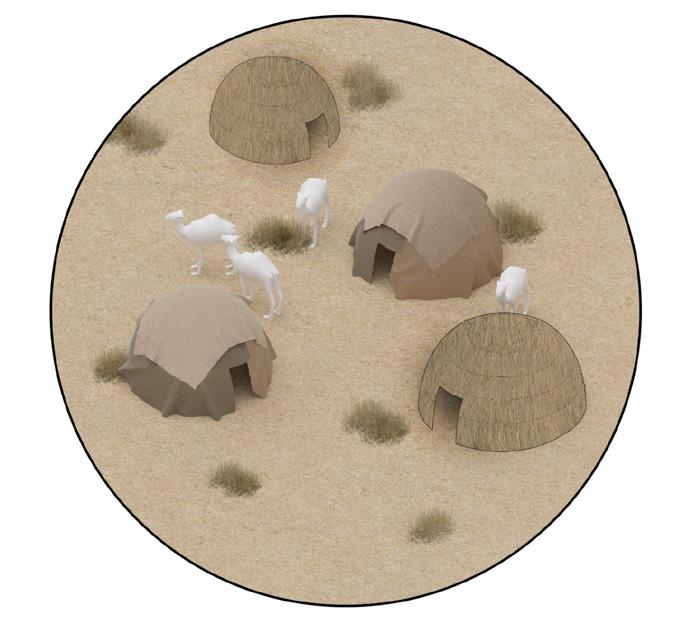
Transhumant pastoralist settlements are a combination of coexisting temporary and permanent structures accommodating the two described different lifestyles.
Housing Typologies and Settlements
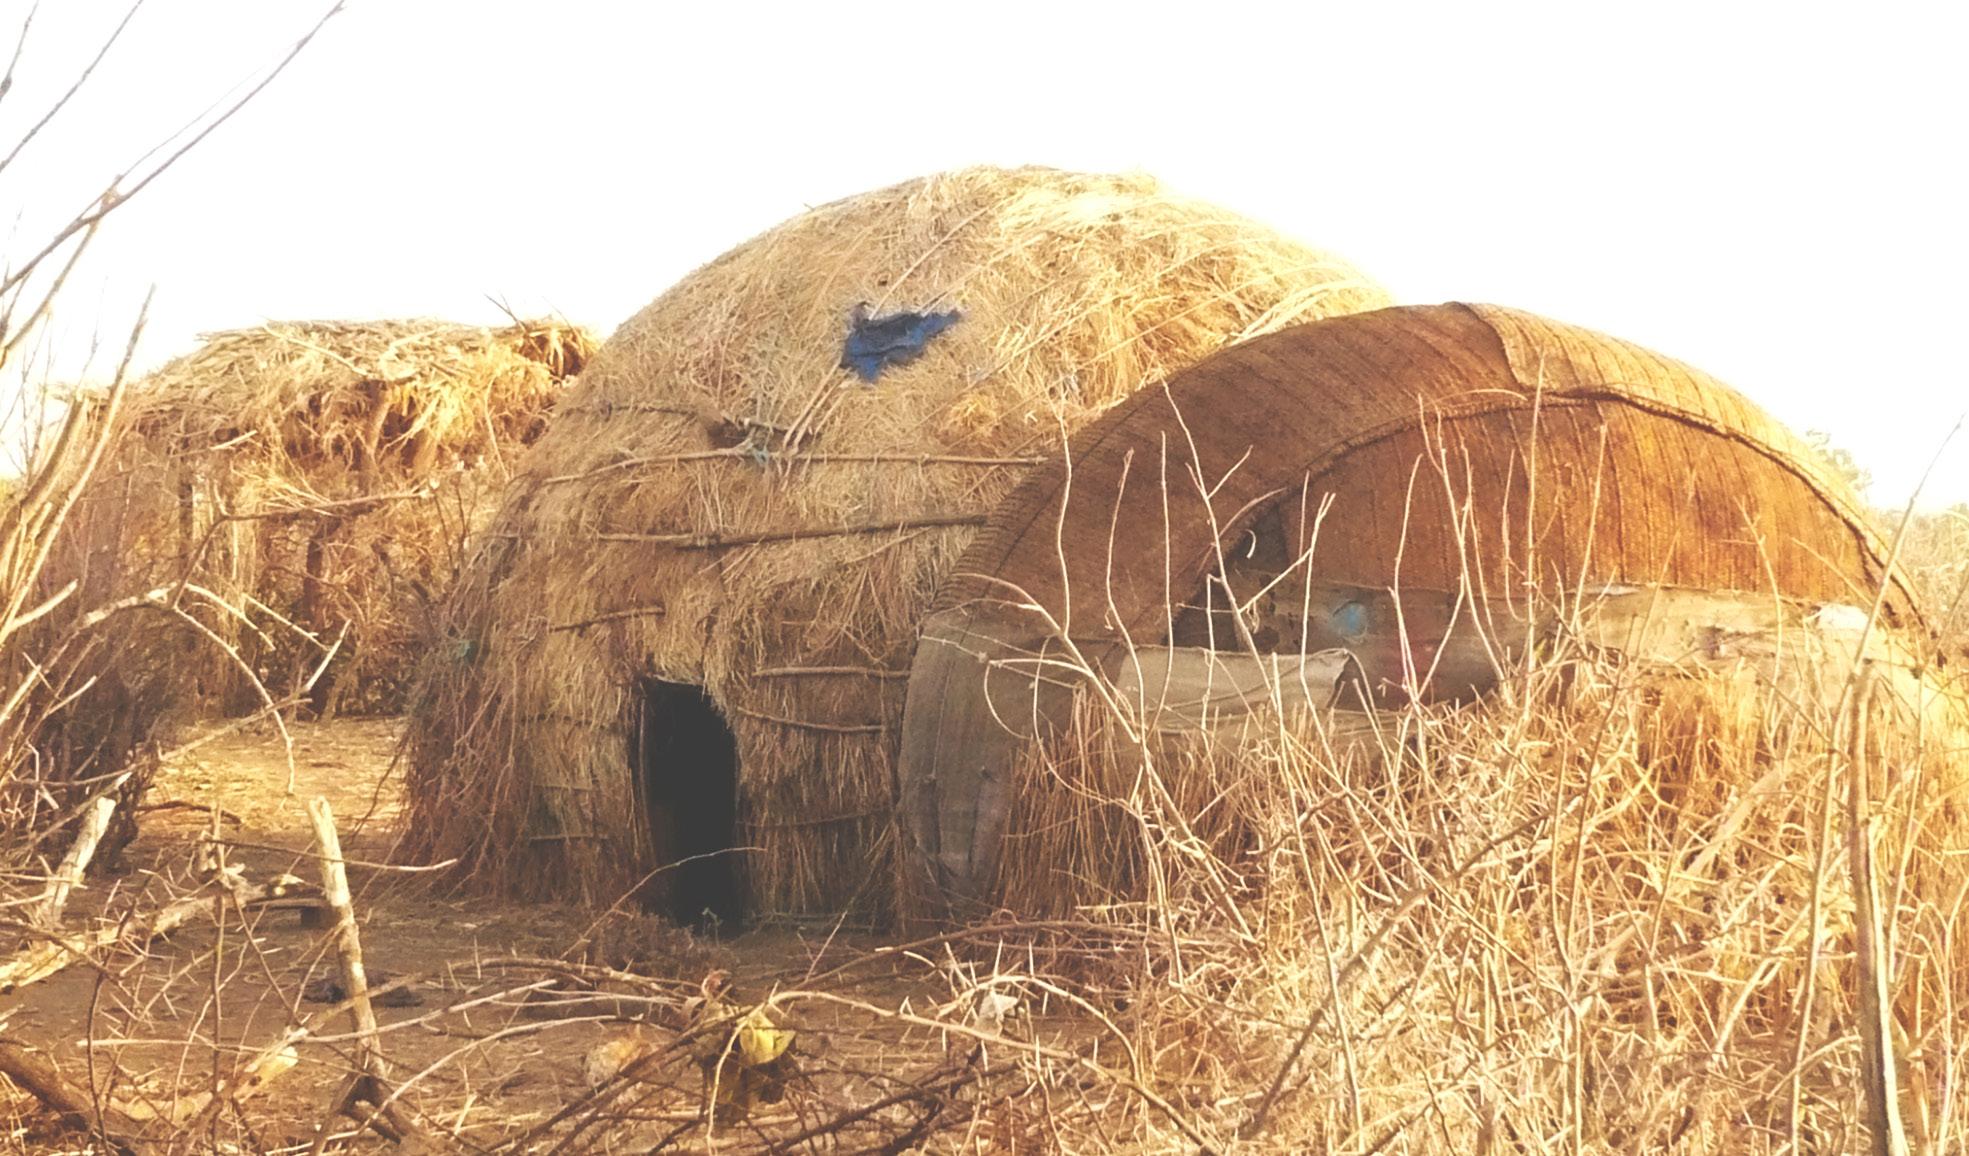
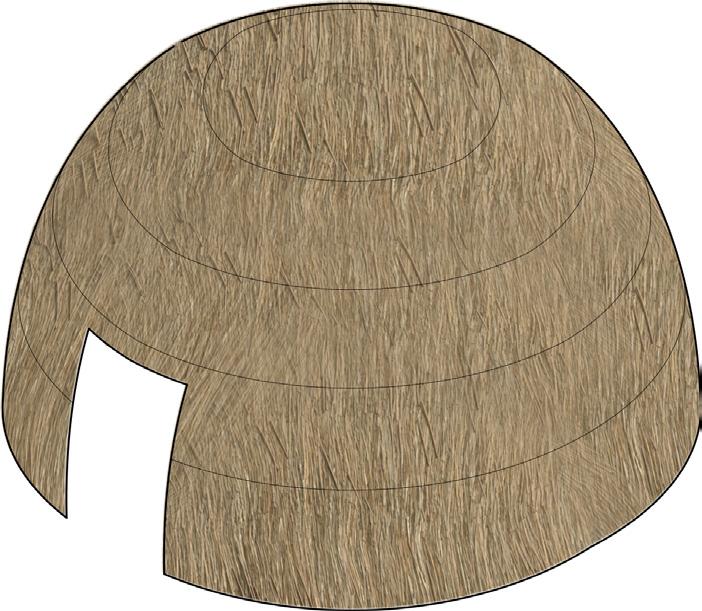
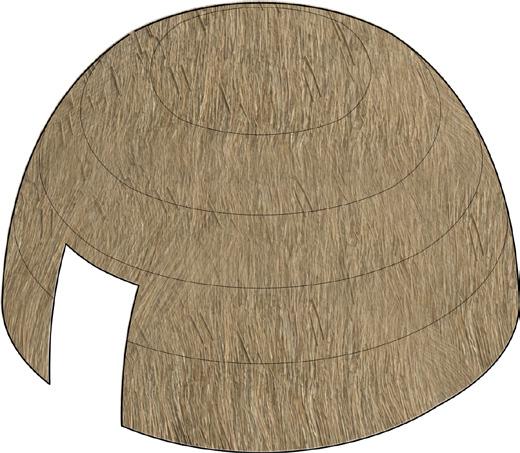
Along with the previously described Aqal shelter used for the temporary housing of pastoralists, a new type of a permanent dwelling is developed in the Transhumant settlement adapting to different conditions; This house is constructed with a similar structure to this found in the Aqal, but it has a different covering approach mainly consisting of several layers of grass.
FIG 5 Two neighbouing permanent and temporary shelters owned by a transhumant pastoralist family in Afar region near Somali
Temporary Shelter
Construction Time: 1 day
Dwellers: 2-3 people
Duration: Months
Area: 5 m2
Coverings: Grass mat
Permanent Shelter
Construction Time: 2-5 days
Dwellers: 2-5 people
Duration: Years
Area: 5-8 m2
Coverings: Grass bundles
Compared to the mobile Aqal, the poles of the primary structure of theses permanent dwellings are denser, arranged more irregularly and less systematically; They are also dug deeper into the ground, resulting more stable structures. While the thatched structures remain in the settlement, the mobile mat huts are taken along when moving to new grazing grounds.
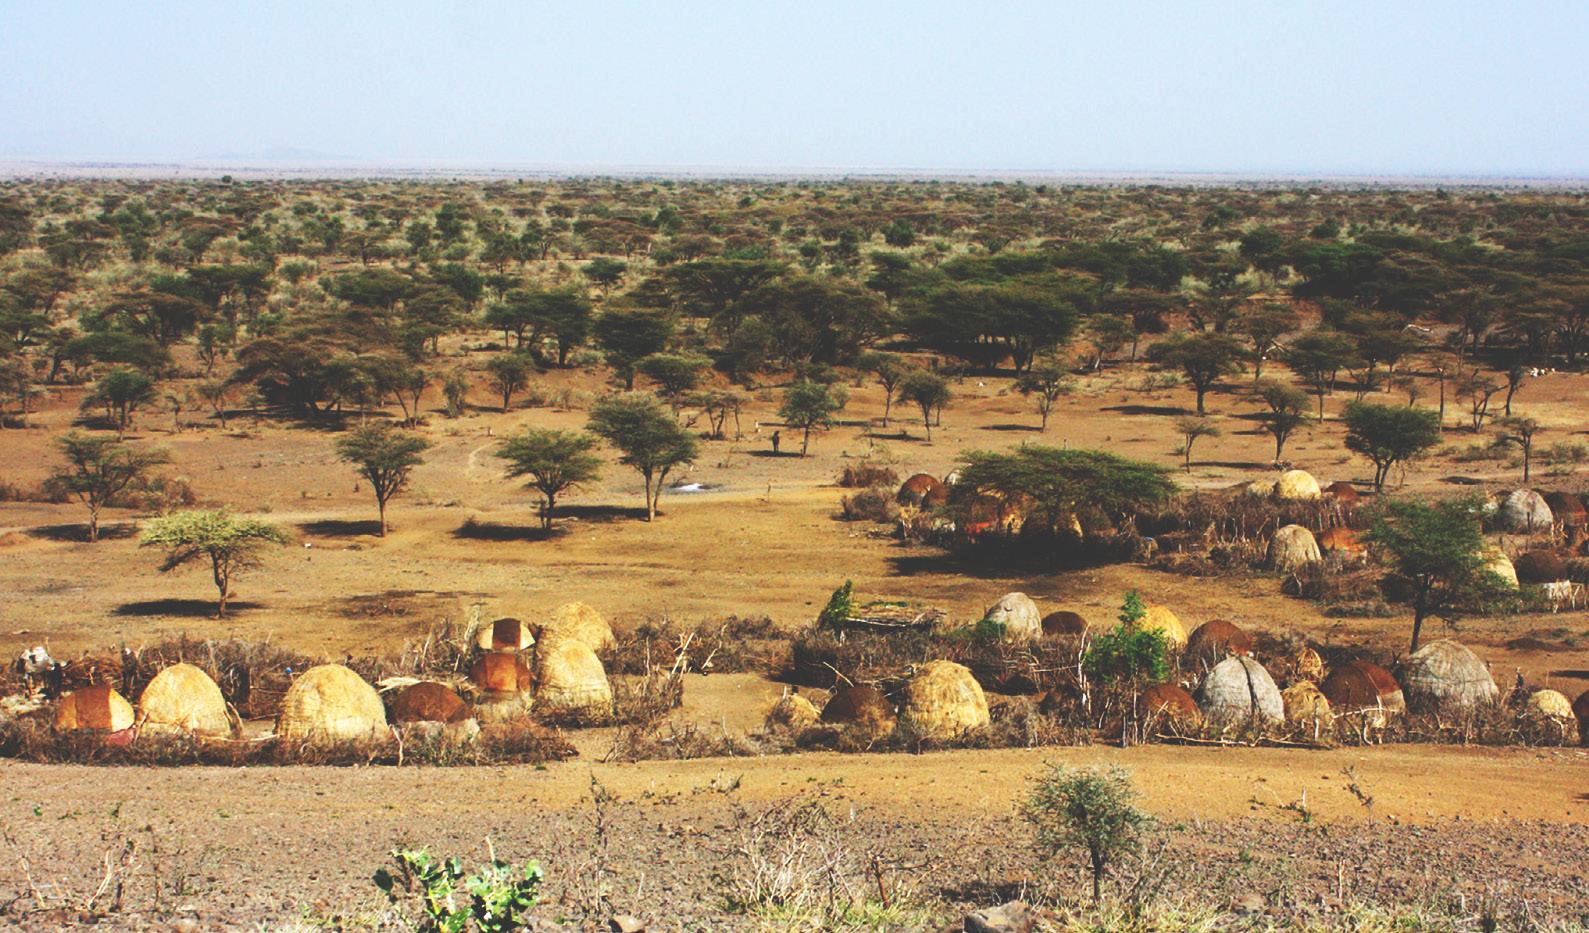
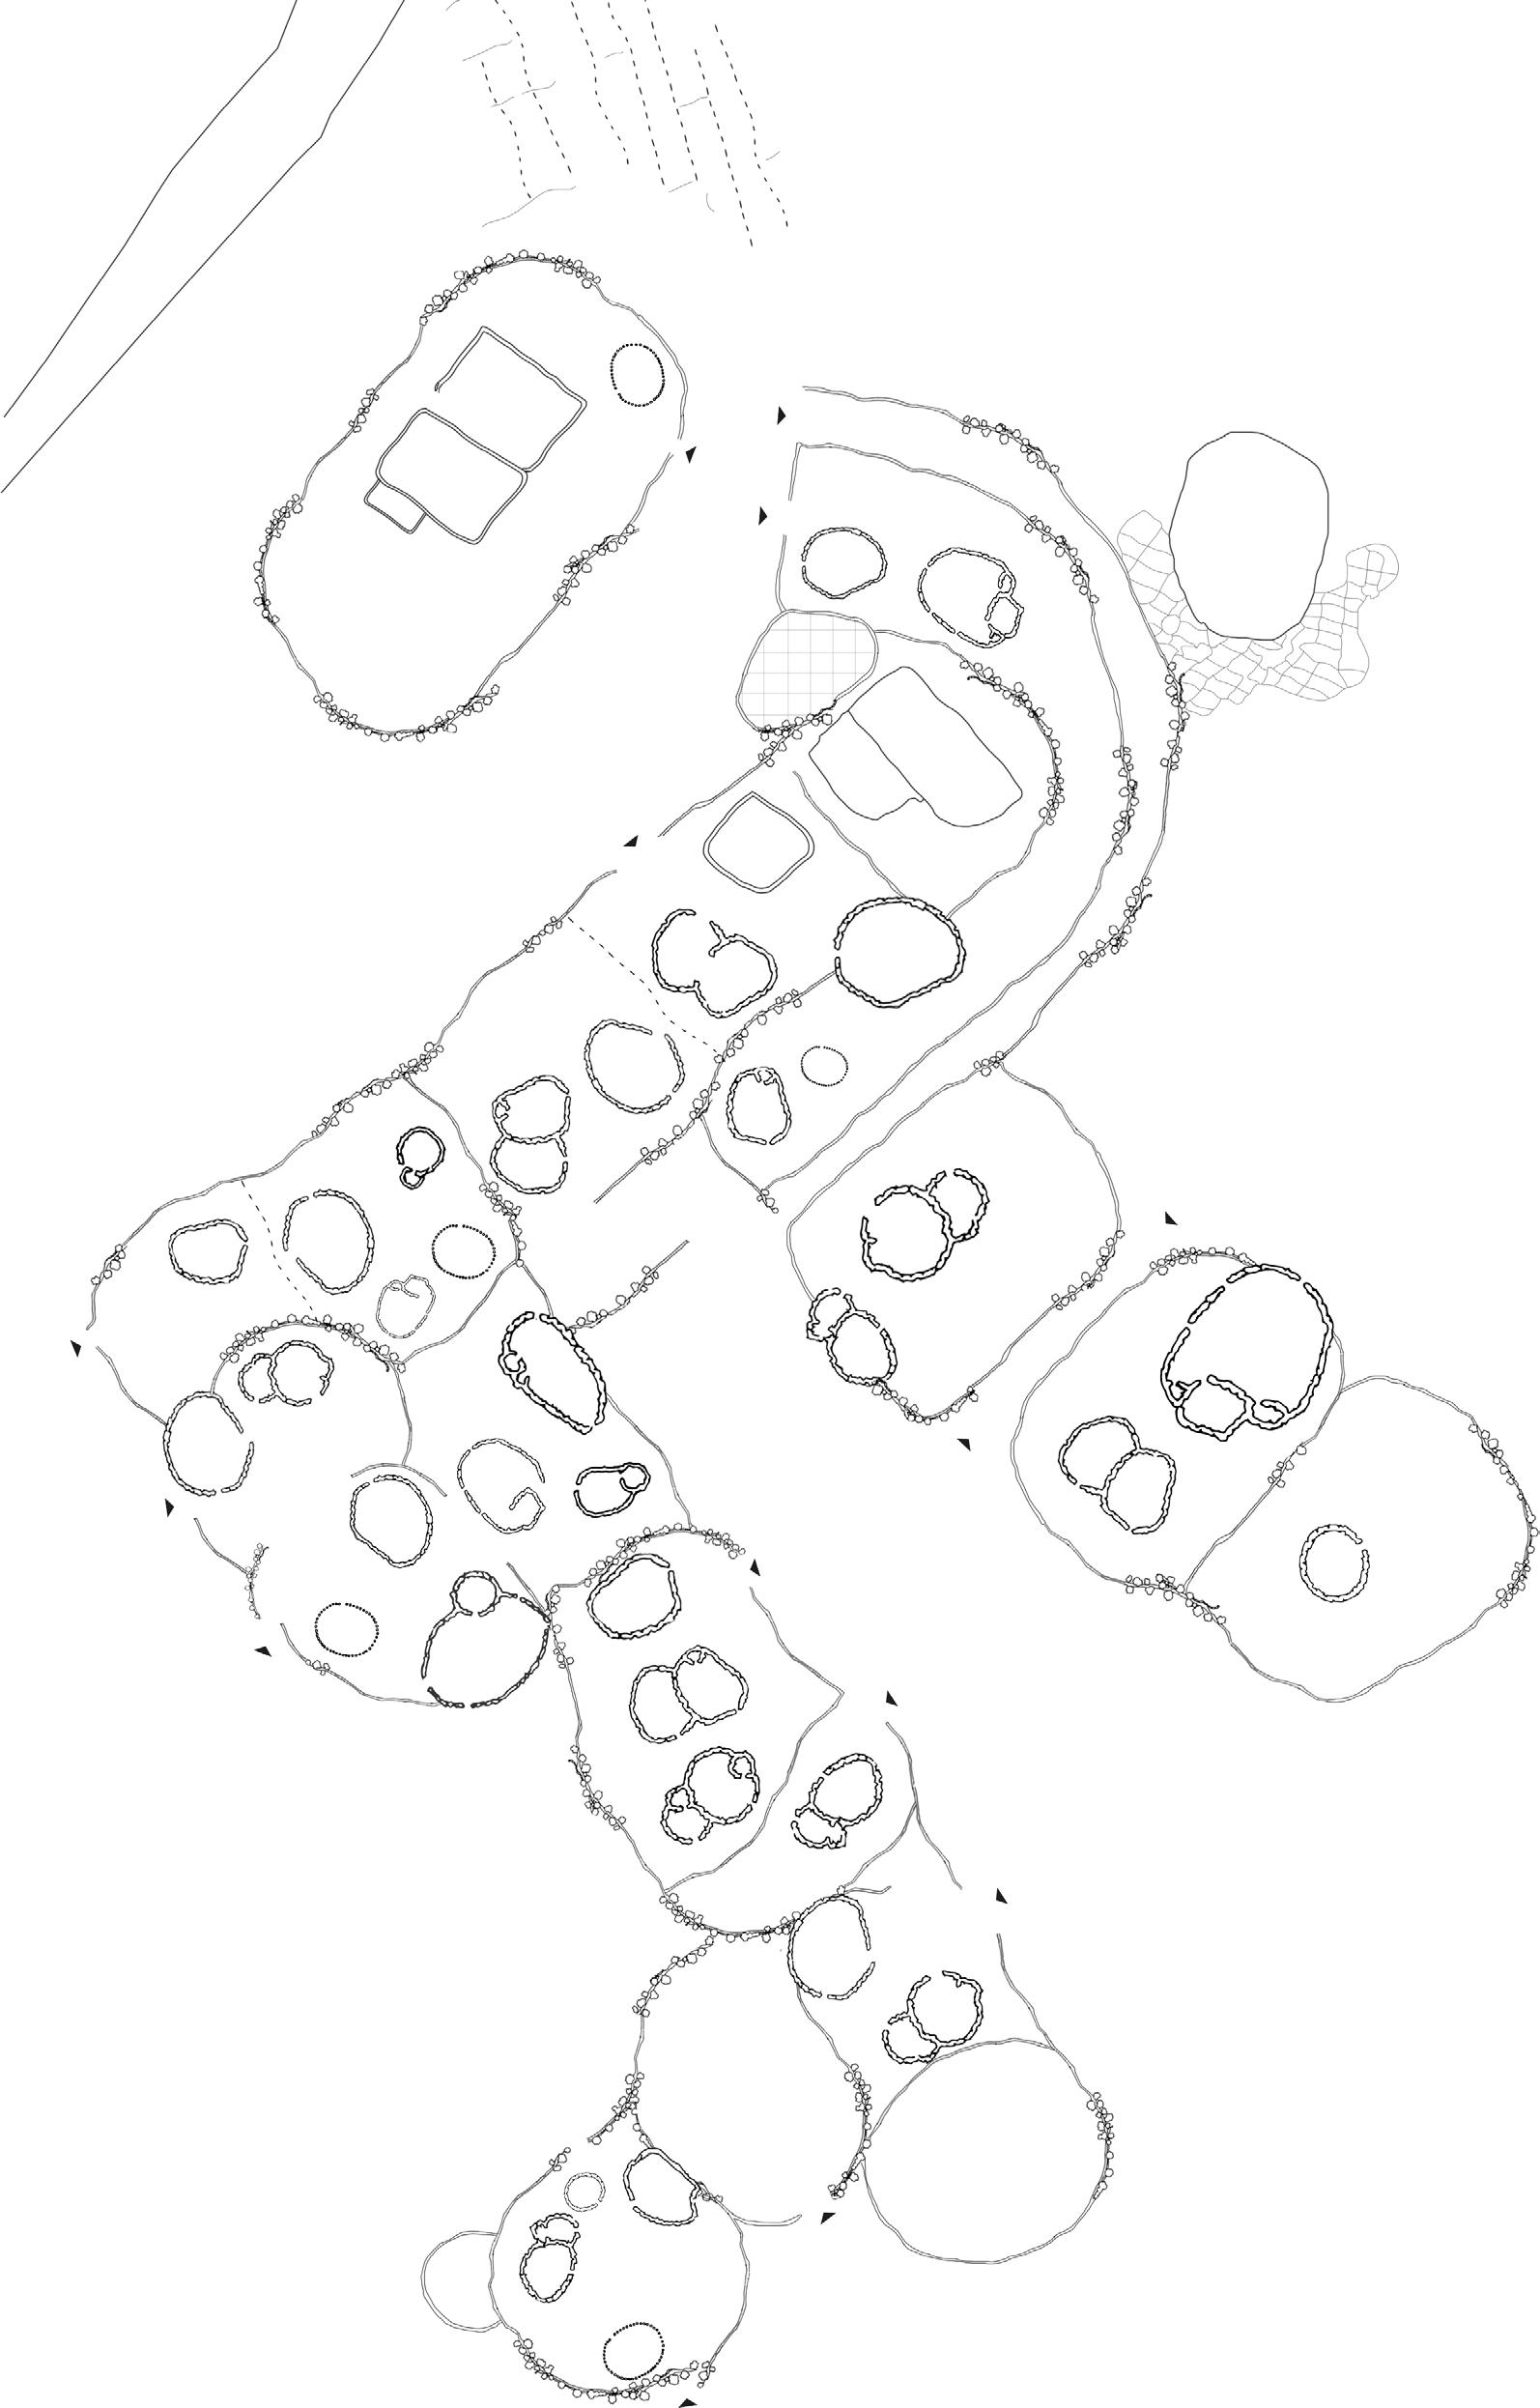
At a settlement scale, the property of one household consists of a fenced area with several huts and animal enclosures. The fencing strengthens the ownership of the structures; Moreover, it protects the inhabitants and their animals. The cattle enclosures on the other hand consist of simple fences made of branches. Their construction is very similar to that of the Aqal with straight rods open at the top rather than bent poles. This social unit is integrated with other units comprising a settlement of the extended family which includes up to sixty households.
Limitations
Although the new shelter is providing a sense of permanence to the settlement, its material represented in grass needs to be constantly renewed when mobile pastoralists return. Moreover, the interior of these dwelling is of a poor quality as using bundles of grass makes it hard to have ventilated openings; additionally, it attracts different desert insects.
FIG 6 A transhumant pastoralist camp with multiple family clusters comprising of both permanent and temporary structures
Floor plan for a transhumant pastoralist camp near Somali Region with different animal enclosures and one open tank for water storage
INTERNALLY DISLACED PERSONS (IDPs)
- 3.2
According to the Displacement Tracking Matrix (DTM) conducted by the International Organization for Migration (IOM) in Somali region and published in August 2019, more than a million displaced individuals comprising around 175 thousand households are identified in around 400 displacement sites in the Somali region ; Most of whom are originally pastoralists. over 25% of these households are living in shelters below regional and cultural standards and 25-50% in 56 sites are living in overcrowded shelters. Moreover, the shelters of 51-75% of IDPs are fully destroyed in their place of origin.
While a percentage of these displacements are conflict-induced related to competition for land and resources, the vast majority is climate-induced mainly caused by the prolonged droughts Eastern Ethiopia has been facing since 2015 which forced people to flee their original habitat and settle elsewhere.
Once people are displaced, they are temporarily housed in different settlement options including host families, rural self-settlements, self-settled camps, and planned camps. Their shelters are often built informally near their places of origin in self-settlements, and at times they receive emergency shelters from international organizations in planned camps. IOM has been managing and monitoring planned camps by doing a bimonthly site assessment and generating a DTM to evaluate conditions and needs in Camps.
We focused on IDP camps within Fafan zone as it is our potential area of intervention and especially KebriBeyah Region. “Iswad Camp” is where most IDPs live in the region; their number has been slightly fluctuating since 2017, when DTM reports started, with a fixed number of 1,320 households .
FIG 7 (Top Left) Damaged water tank in an internally displaced persons site in the Fafan zone. Photo taken by IOM officials
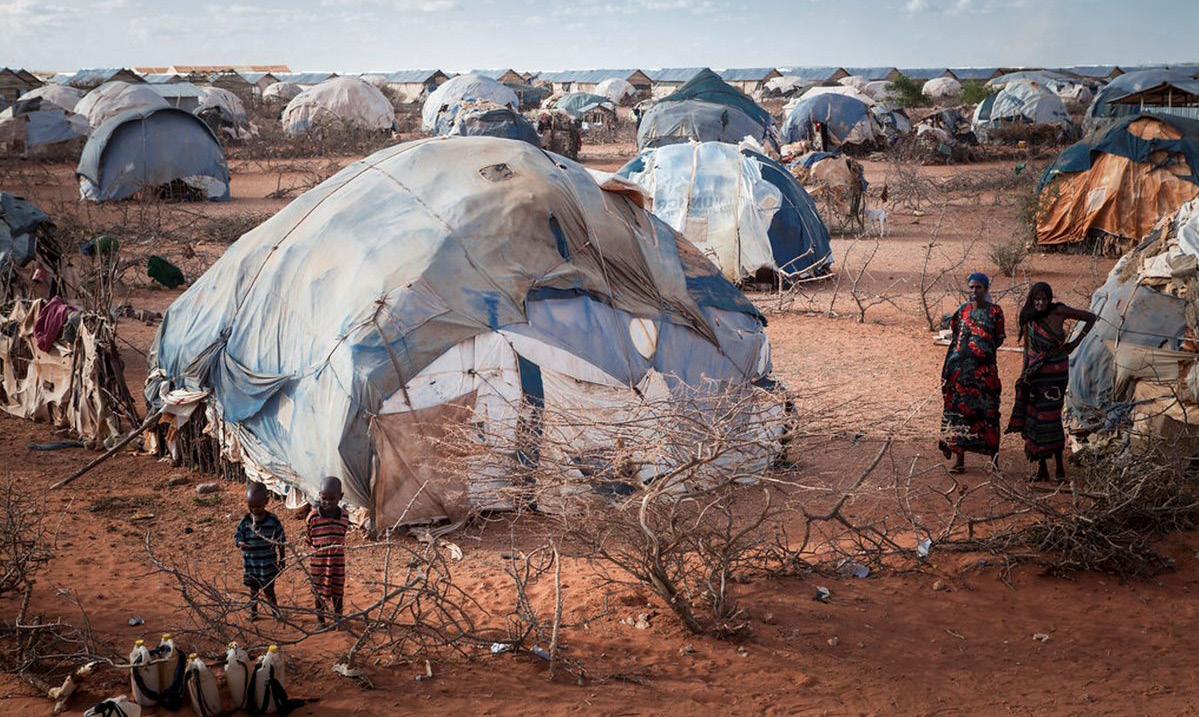
FIG 10 (Bottom Left) Iswad IDPs camp in Fafan zone with several plastic and cloth temporary shelters. Photo taken by IOM officials
02 - 3.2.1
ISWAD CAMP IDP households are mainly pastoralists out of which only 12% still own livestock; They collect an average of two 20-litre water jerrycans/buckets per day and their latrines are mostly non-functioning. The main water distribution point is on-site and within a 30-minute walk for a one-way journey. Once at the water distribution point, they queue for an average of 16-30 minutes for drinking water, which they complain to be of a bad quality.
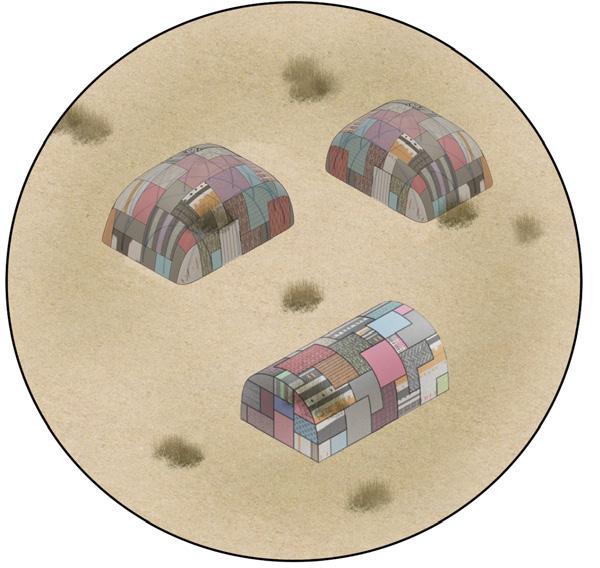
Housing Typologies and Settlements
IDP shelters are inspired by the nomadic hut ‘Aqal’ as they have a similar structure invv addition to some elongated hemispherical forms in 2 different types. Their makeshift shelters are of a poor quality built of locally available thin wooden poles, tree branches, reeds, and twigs tied together with ropes forming the skeleton of the shelter. The wooden formwork is then covered with cloth, plastics (by IOM) and sometimes with animal skin. The area of these shelters is usually around 12 m2 accommodating 5-6 people. Small fences made of bush branches are sometimes built around shelters for privacy and security purposes.
FIG 12 An internally displaced person in front of his worn out shelter in a photo illustrating the general bad living conditions of IDPs in the Somali Region.
Photo taken by UNHCR officials
Tybe A Specificstions
Construction Time: 1-7 days
Dwellers: 5-6 people
Duration: 6-9 months
Area: 12 m2
Coverings: CGI- cloth- Plastics
Tybe B Specifications
Area: 15 m2 M2 M2
Construction Time: 1-7 days
Dwellers: 5-7 people
Duration: 6-9 months
Coverings: CGI- cloth- Plastics
Limitations
IDP shelters are not durable as they last about six to nine months, and after that, they become damaged and unusable. Additionally, the option for expanding is very limited, which does not adapt to the changing configuration of a household overtime and its needs to reorganize its living space. In Conclusion, these dwellings are built to be temporary, but they are not; they stay in use for years and even decades.
A schematic diagram of a typical IDPs camp in Ethiopia showing the different overcrowded housing enclosures.
02 - 3.3
REFUGEES The Refugee situation is another face of displacement that Ethiopia, especially the Somali region, has been facing for decades. According to the UNHCR refugee operational portal, the Somali region is currently hosting about 200 thousand refugees originally from Somaliland in 8 different sites ; Most of whom have fled civil war in their home country seeking protection and aid in Ethiopia. Though repatriation initiatives were taken to return these people back to their homes, none were of a total success. Coming back to their countries, these refugees find themselves in a desperate situation in which armed conflict restricts opportunities, drought severely affects livelihoods and aid is the only reliance for survival.
Kebri-Beyah region has been the site of a refugee camp since 1991 as it lies only 70 km away from the borders. The camp originally housed about 10,000 refugees and returnees from Somaliland and it was the only camp to remain open while UNHCR managed to close down other camps in the region between 1997 and 2005; This is related to the influx of more refugees from south-central Somalia escaping the lethal combination of conflict and drought. Currently, the camp occupies an area of around 1.55 km2, and it houses around 14,600 refugees. This number has been changing over the past years due to the growth of Somali refugees and the relocation of some to either nearby camps in the region , or to the USA.
FIG 21 (Bottom Right) A Somali refugee family in front of their new transitinal shelter provided by IOM
FIG 20 (Top Left)
A Somali refugee sitting infront of her shelter that is covered in blankets in Kebri-Beyah refugee camp. This photo was shared by the UNHCR.
KEBRIBEYAH CAMP
02 - 3.3.1
Kebri-Beyah camp refugees are mainly rural pastoralists who faced similar circumstances in their home country as IDPS causing them to abandon their background and work mainly in either farming or small-scale trading in different shops scattered around the camp. They rely on poor water facilities as the whole camp is provided by only 33 water taps; out of which 5 are only operating. Thus, they resort to harvesting rainwater in self-built rain collectors and storing it in big tanks, which leads to weak hygiene conditions. Moreover, latrines and showers are public and shared between several households; They are mostly defective, of a bad condition and not sufficient for their number.
Housing Typologies and Settlements
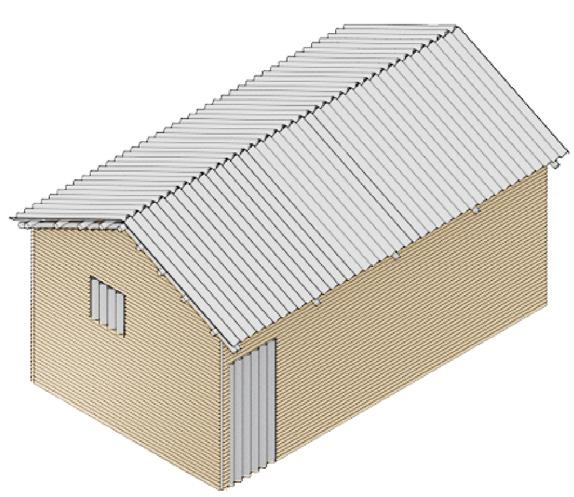
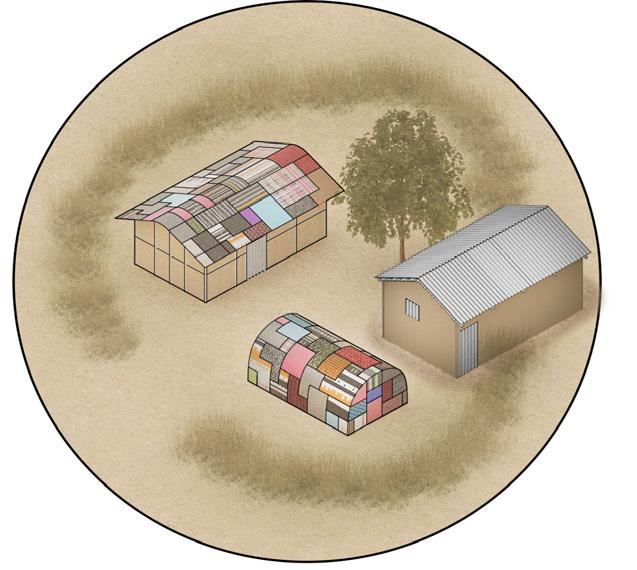
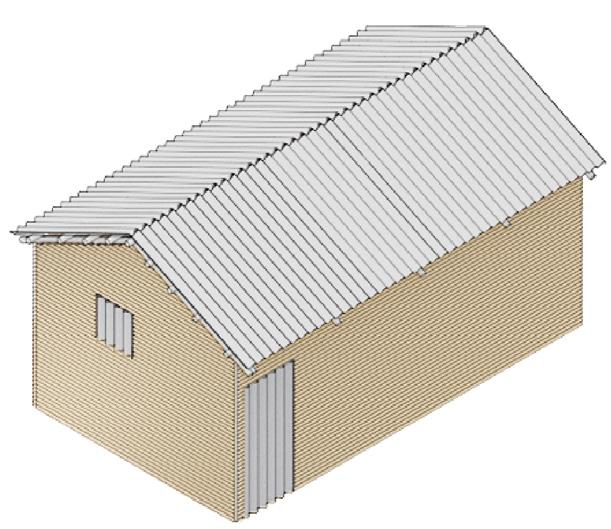
Refugees live in shelters similar to those of IDPs mainly made of poor-quality locally sourced wood branches covered with fabric and corrugated iron. Occasionally UNHCR provides refugees with more formal shelter solutions known as the transitional shelter; its design consists of a wooden wattle support structure, bamboo slices walling as plaster, and a roof covered by either durable corrugated iron (CGI) or fabrics. These shelters can be constructed in one week and they have an area of 21 m² that can house 3-4 people.
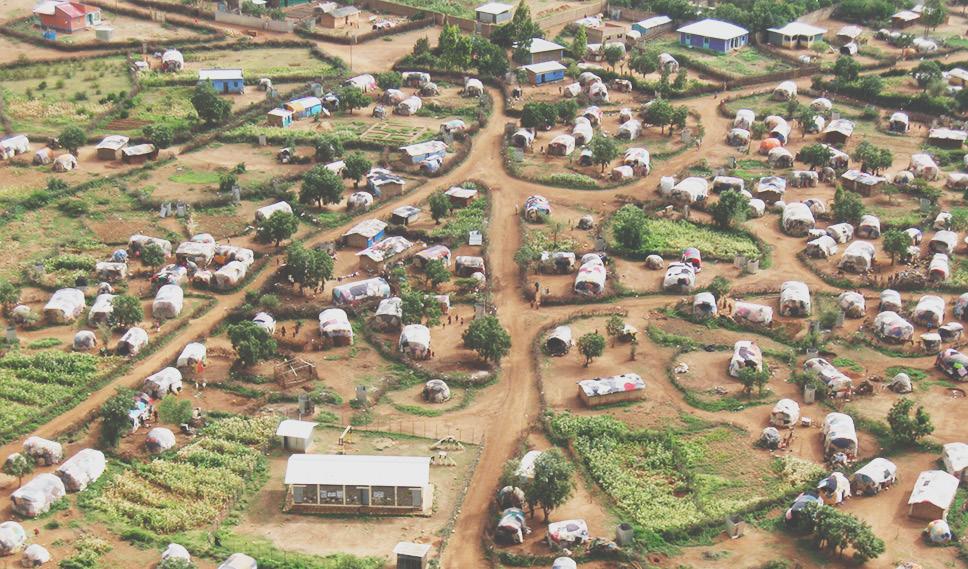
FIG 22 An aerial view of Kebri-Beyah camp showing the poor shelters people are inhabiting and the different facility buildings made out of clay, conctete and CGI roofs.(Google Earth Images)
Transitional Shelter
Construction Time: 7 days
Dwellers: 3-6 people
Duration: 2-4 Years
Area: 21 m2 M2
Coverings: Bamboo- CGI/ Cloth
Limitations
In addition to the limitations described for the IDP shelters, the transitional shelter provided by the UNHCR is no satisfactory alternative. Not only does it require significantly larger quantities of wood for construction (one to two trees per m2), but also bamboo cannot be sourced locally in this region and it must be transported from further locations. In addition to that, it uses CGI which is not a sustainable solution due to long distance transports, high cost and low quality of processing.
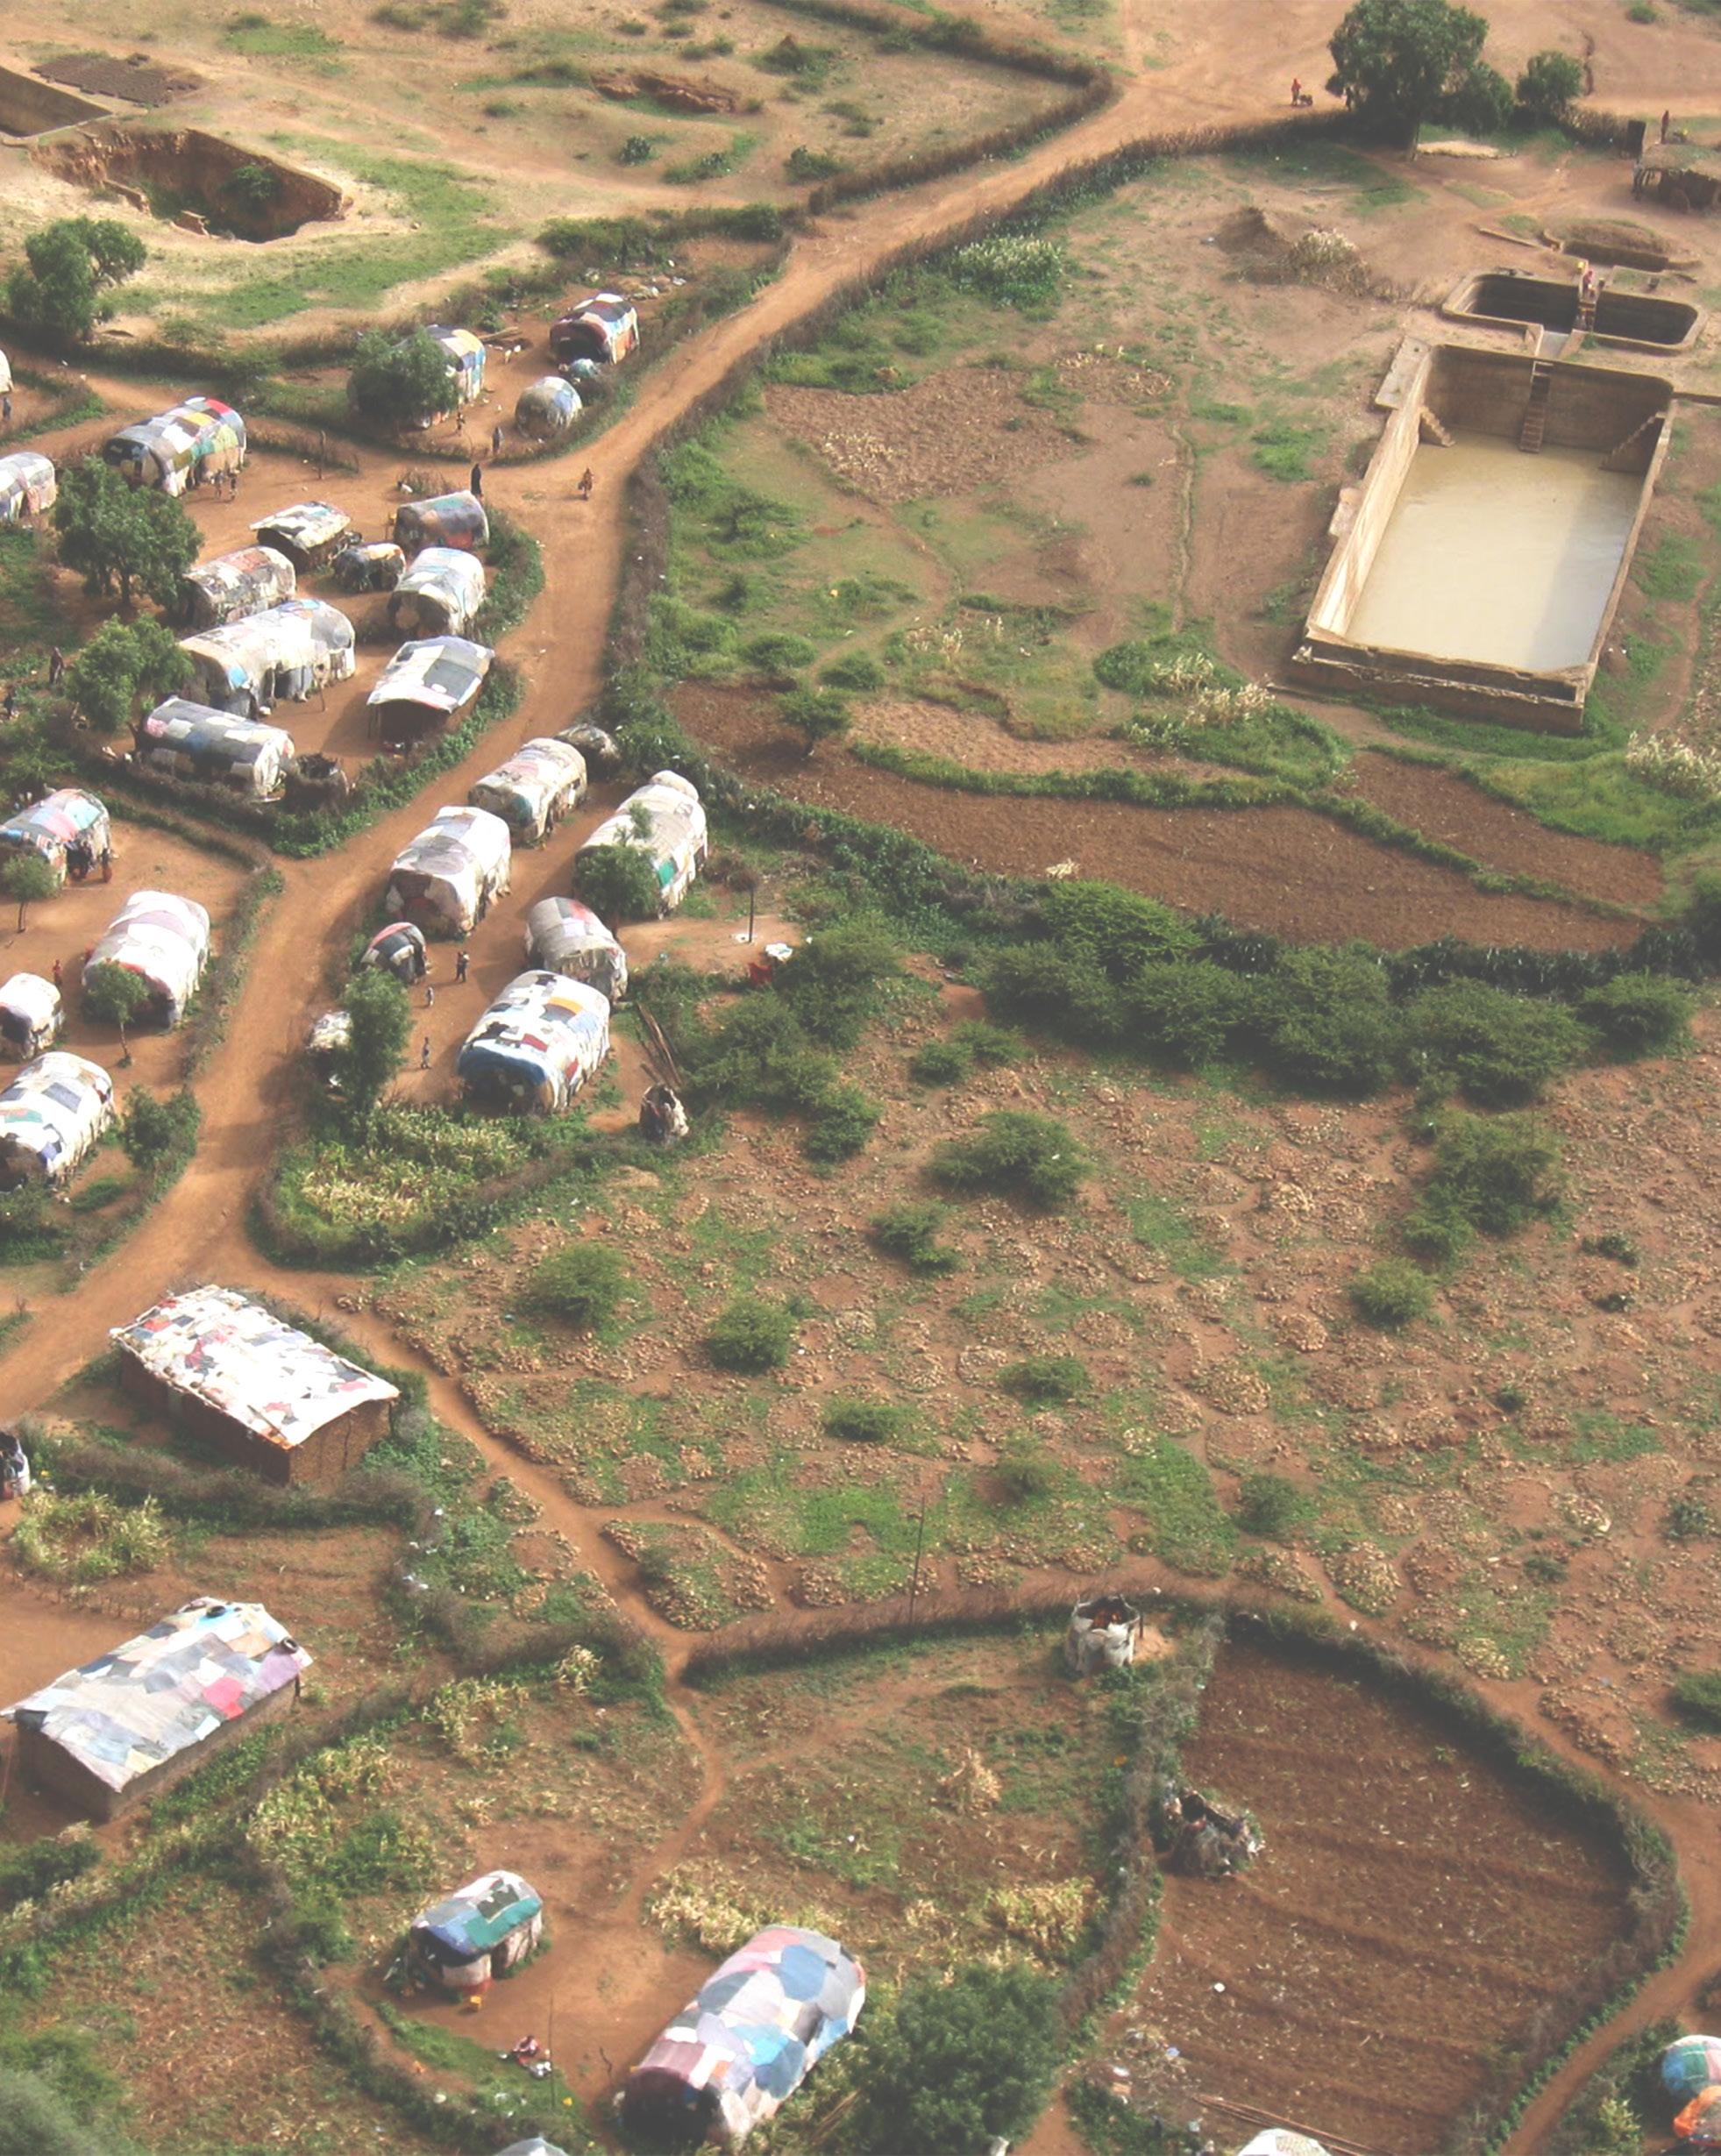
FIG 23 An aerial view of Kebri-Beyah camp showing an empty water storage tank and the different farming plots cultivated by the refugees( Google Earth Images)
CONCLUSION By Investigating the situation of the vulnerable groups in the Somali Region, especially the Fafan zone, and having a closer look into their living conditions and humanitarian needs, we were driven towards adopting a strategy that can host these exposed groups of people in a hybrid settlement system where inhabitants can be gradually relocated from the IDP and refugee camps existing in the region, in order to offer them humane more stable conditions. In addition, the proposed settlement can temporarily house the severely climate affected pastoral nomads and transhumant pastoralist during the dry season to ensure their survival along with their livestock.
02 - 3.4
The design of the new dwellings is to be abstracted from the traditional building practices which were clearly suitable for a temporary lifestyle with the potential of a few to transform into long-lasting ones when needed. Furthermore, available natural materials are to be further investigated allowing for an implementation of a self-sufficient system for a rural settlement.
Consideration of the previously explained limitations exerted by the different settlement types is to be thoroughly taken into the design.
Pastoral Nomads
Internally Displaced Persons
Transhumant Pastoralists Refugees
Pastoral Nomads Shelter
Adaptiveness
Quality
Duration
Sustainability
Transhumant Pastoralists Shelter
Adaptiveness
Quality
Duration
Sustainability
IDPs Shelter
Adaptability
Quality
Duration
Sustainability
Refugees Shelter
Adaptiveness
Quality
Duration
Sustainability
Finally, assessment of the local housing typologies was conducted in order guide us through design process, these typologies are assessed according to their potential to adapt and transform to different conditions, quality of the material used and living space, duration and sustainability.
02 - 4 FROM TEMPORARY TO PERMANENT
Towards A Hybrid Logic
To design a settlement strategy that can fit the varying vulnerable groups in the Somali region, we must consider the patterns in their population change along with their preferences and the projected future changes to their situation.
The number of internally displaced persons has been increasing throughout the past years and is expected to continue rising within the next years with subsequent growth in emergency shelter needs. At the same time, 90% of the IDPs already existing in the Somali region prefer local integration as a more durable solution to permanently settle within local communities.
Also, by analysing the situation in Kebri-Beyah refugee camp and its increasing inhabitants, it was found that 56.8 % of the population is under the age of 18 , meaning that more than half of the residents were born in the camp and have lived there all their lives; Furthermore, it is unexpected for them to return to their country anytime soon due to the ongoing political and climate issues; These refugees end up living most of their life in a temporary camp with poor shelters meant to be used for only a few months and don’t have the qualities for permanent usage.
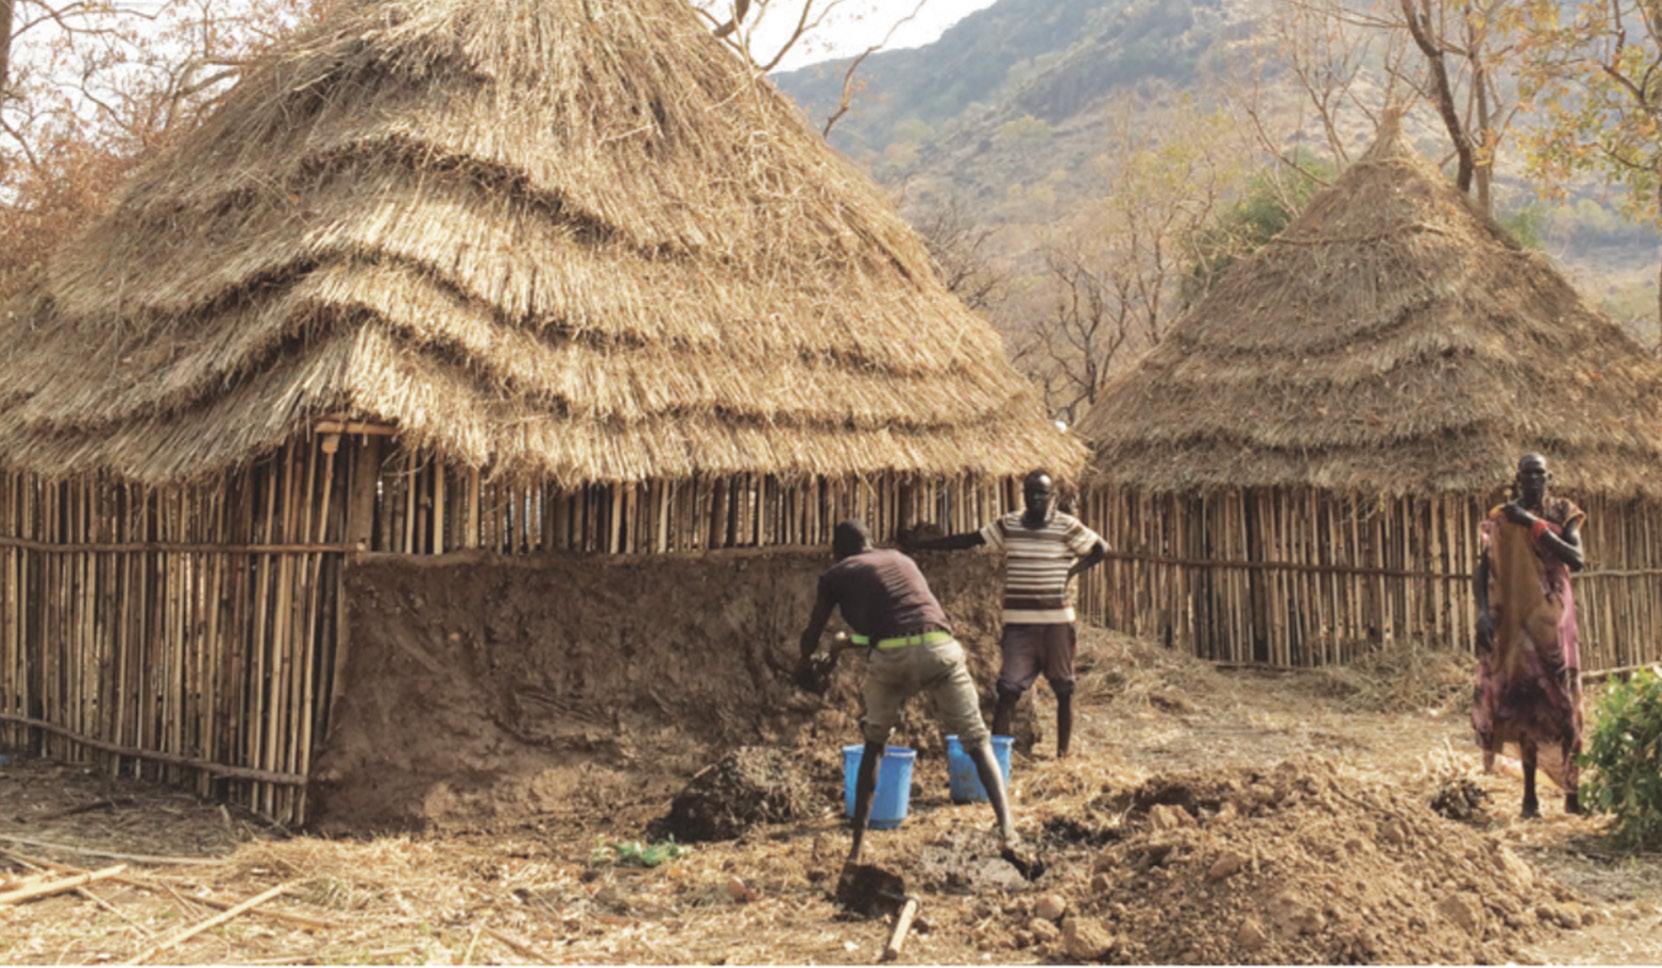
FIG 40 Refugees plastering the walls of a transitional shelter with mud, made from soil, sourced by the refugees themselves in areas agreed with authorities and host communities in southern Ethiopia.
Photo tshared by UNHCR officials.
Here to say, the Somali pastoralist situation is no different from either IDPs or refugees in terms of vulnerability and the need for a proper shelter where they could settle down if contextual circumstances forced them to. While a proportion of them are ending up in IDP and refugee camps due to the changing environmental and economic conditions, more and more are getting settled down along the trading routes; This is causing new settlements to emerge where pastoralists are turning into permanent Agro-pastoralist settlers. The dominant construction method of the newly settlements is the so-callevvpole walls plastered with clay and thatched roofs ; This technique is considered a highly unsustainable building technology especially in such arid region with scarce vegetation where every tree is extremely valuable, and yet trees are being uprooted on a big scale.
All of that together has encouraged us to propose a settlement strategy with architecture adapting to the emergent and changing living conditions. Our aim is to provide a framework for the design of a transitional shelter that can work as an emergency housing solution once newly displaced persons arrive, and would also have the ability to transform into a permanent one after a certain amount of time has passed. This design is also intended to help pastoralists maintain their cultural lifestyle by hosting them temporarily during harsh seasons, and finally offering them an alternative sustainable solution if they decided to permanently settle down, one that adapts with their former lifestyle and more importantly, with their ecological environment.
For that, we are investigating locally available materials and different emergency solutions that can both fit the local lifestyles and have the potential transform into permanent dwellings.
LOCAL MATERIALS
02 - 4.1
Earth
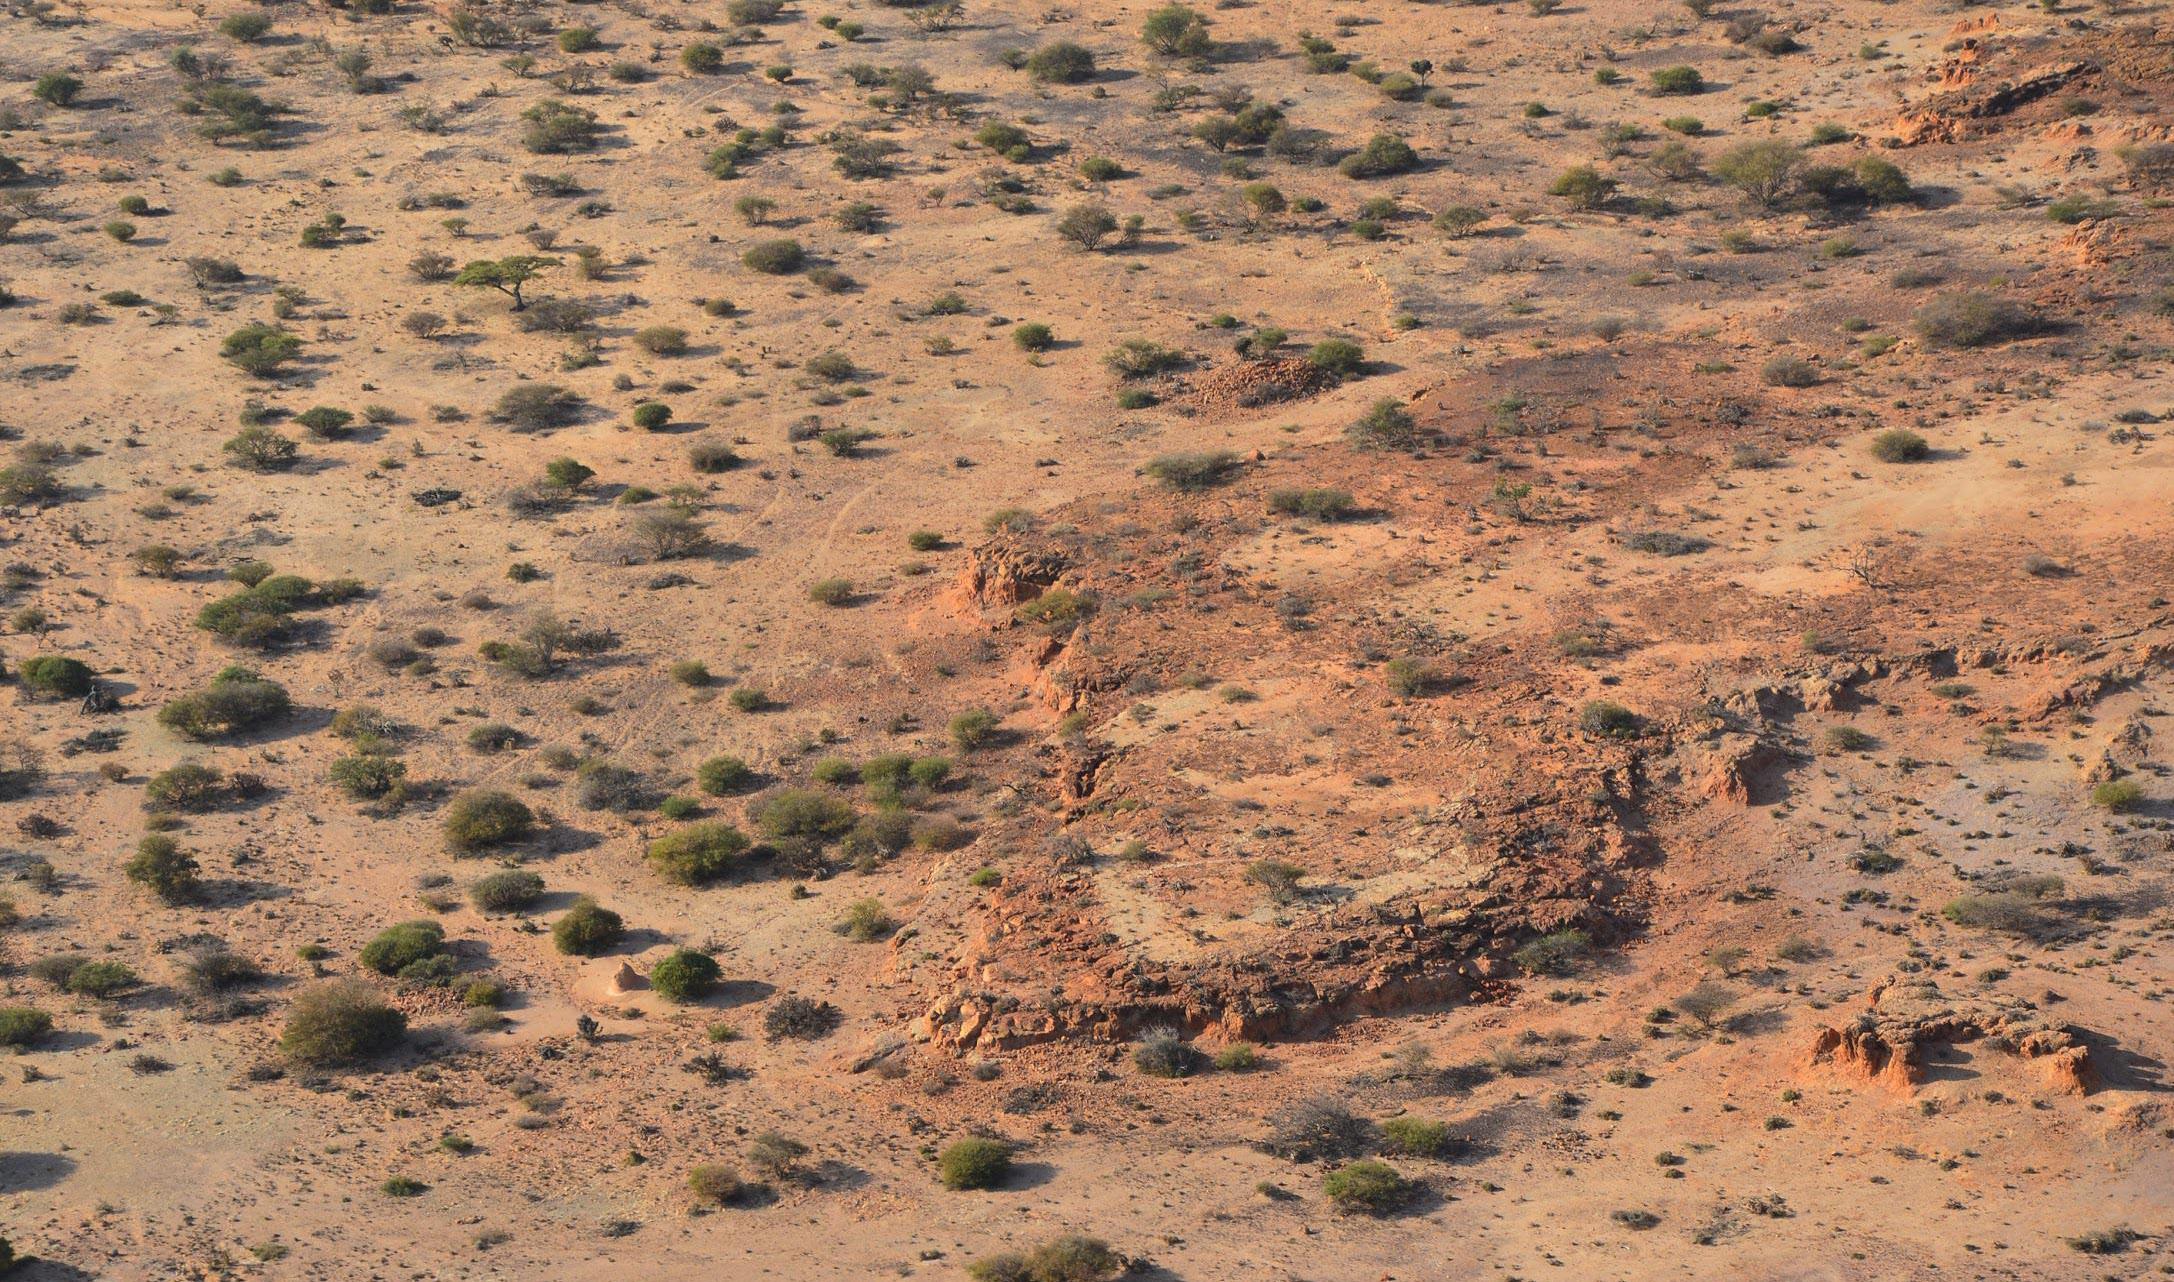
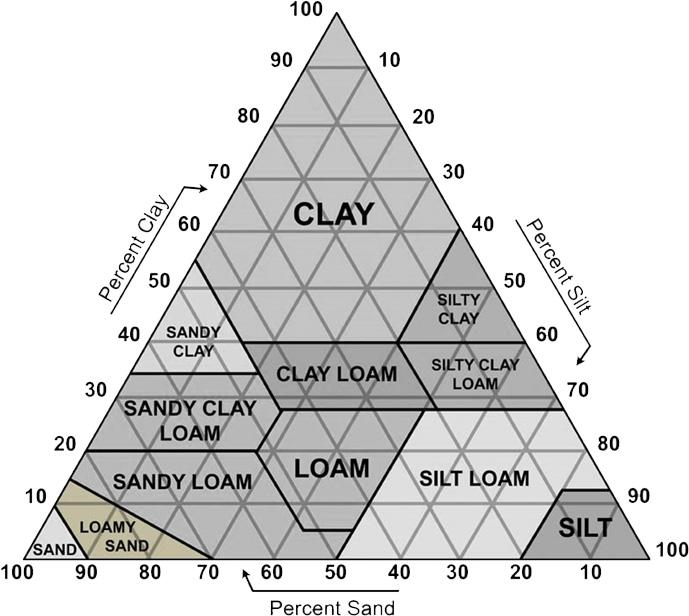
Earth is the only building material sufficiently available directly in the Somali region with varying soil types and textures. According to the soil geo-database of Ethiopia presented by (Berhanu et al), the soil type of our site is called Petric Calcisols, and the textural class is Loamy Sand; This class can be neither classified as clay or sand as it has a 70-90 percentage of sand, 10-15% clay and a remainder percentage of silt.
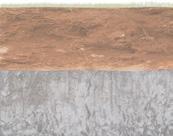
This loamy sand layer has a 1 meter thickness and it lies above a much deeper layer of indurated or cemented layer of sandstone.
The soil textural classification triangle shown illustrates precisely where our soil class stands amongst all earthern soils.
FIG 20 an Aerial view of the land surrounding our propsed site showing soil texture and the scattered vegetation available in the area. (Google Earth Images)
Somalis depend mainly on wood for construction in their different housing typologies. However, the supply of wood for building is running short and good quality timber is becoming scarce due to deforestation. Interestingly, Somali pastoralist nomads use wood in a very sustainable way as only branches or roots that quickly regrow are used for construction, thus the tree itself is not harmed.
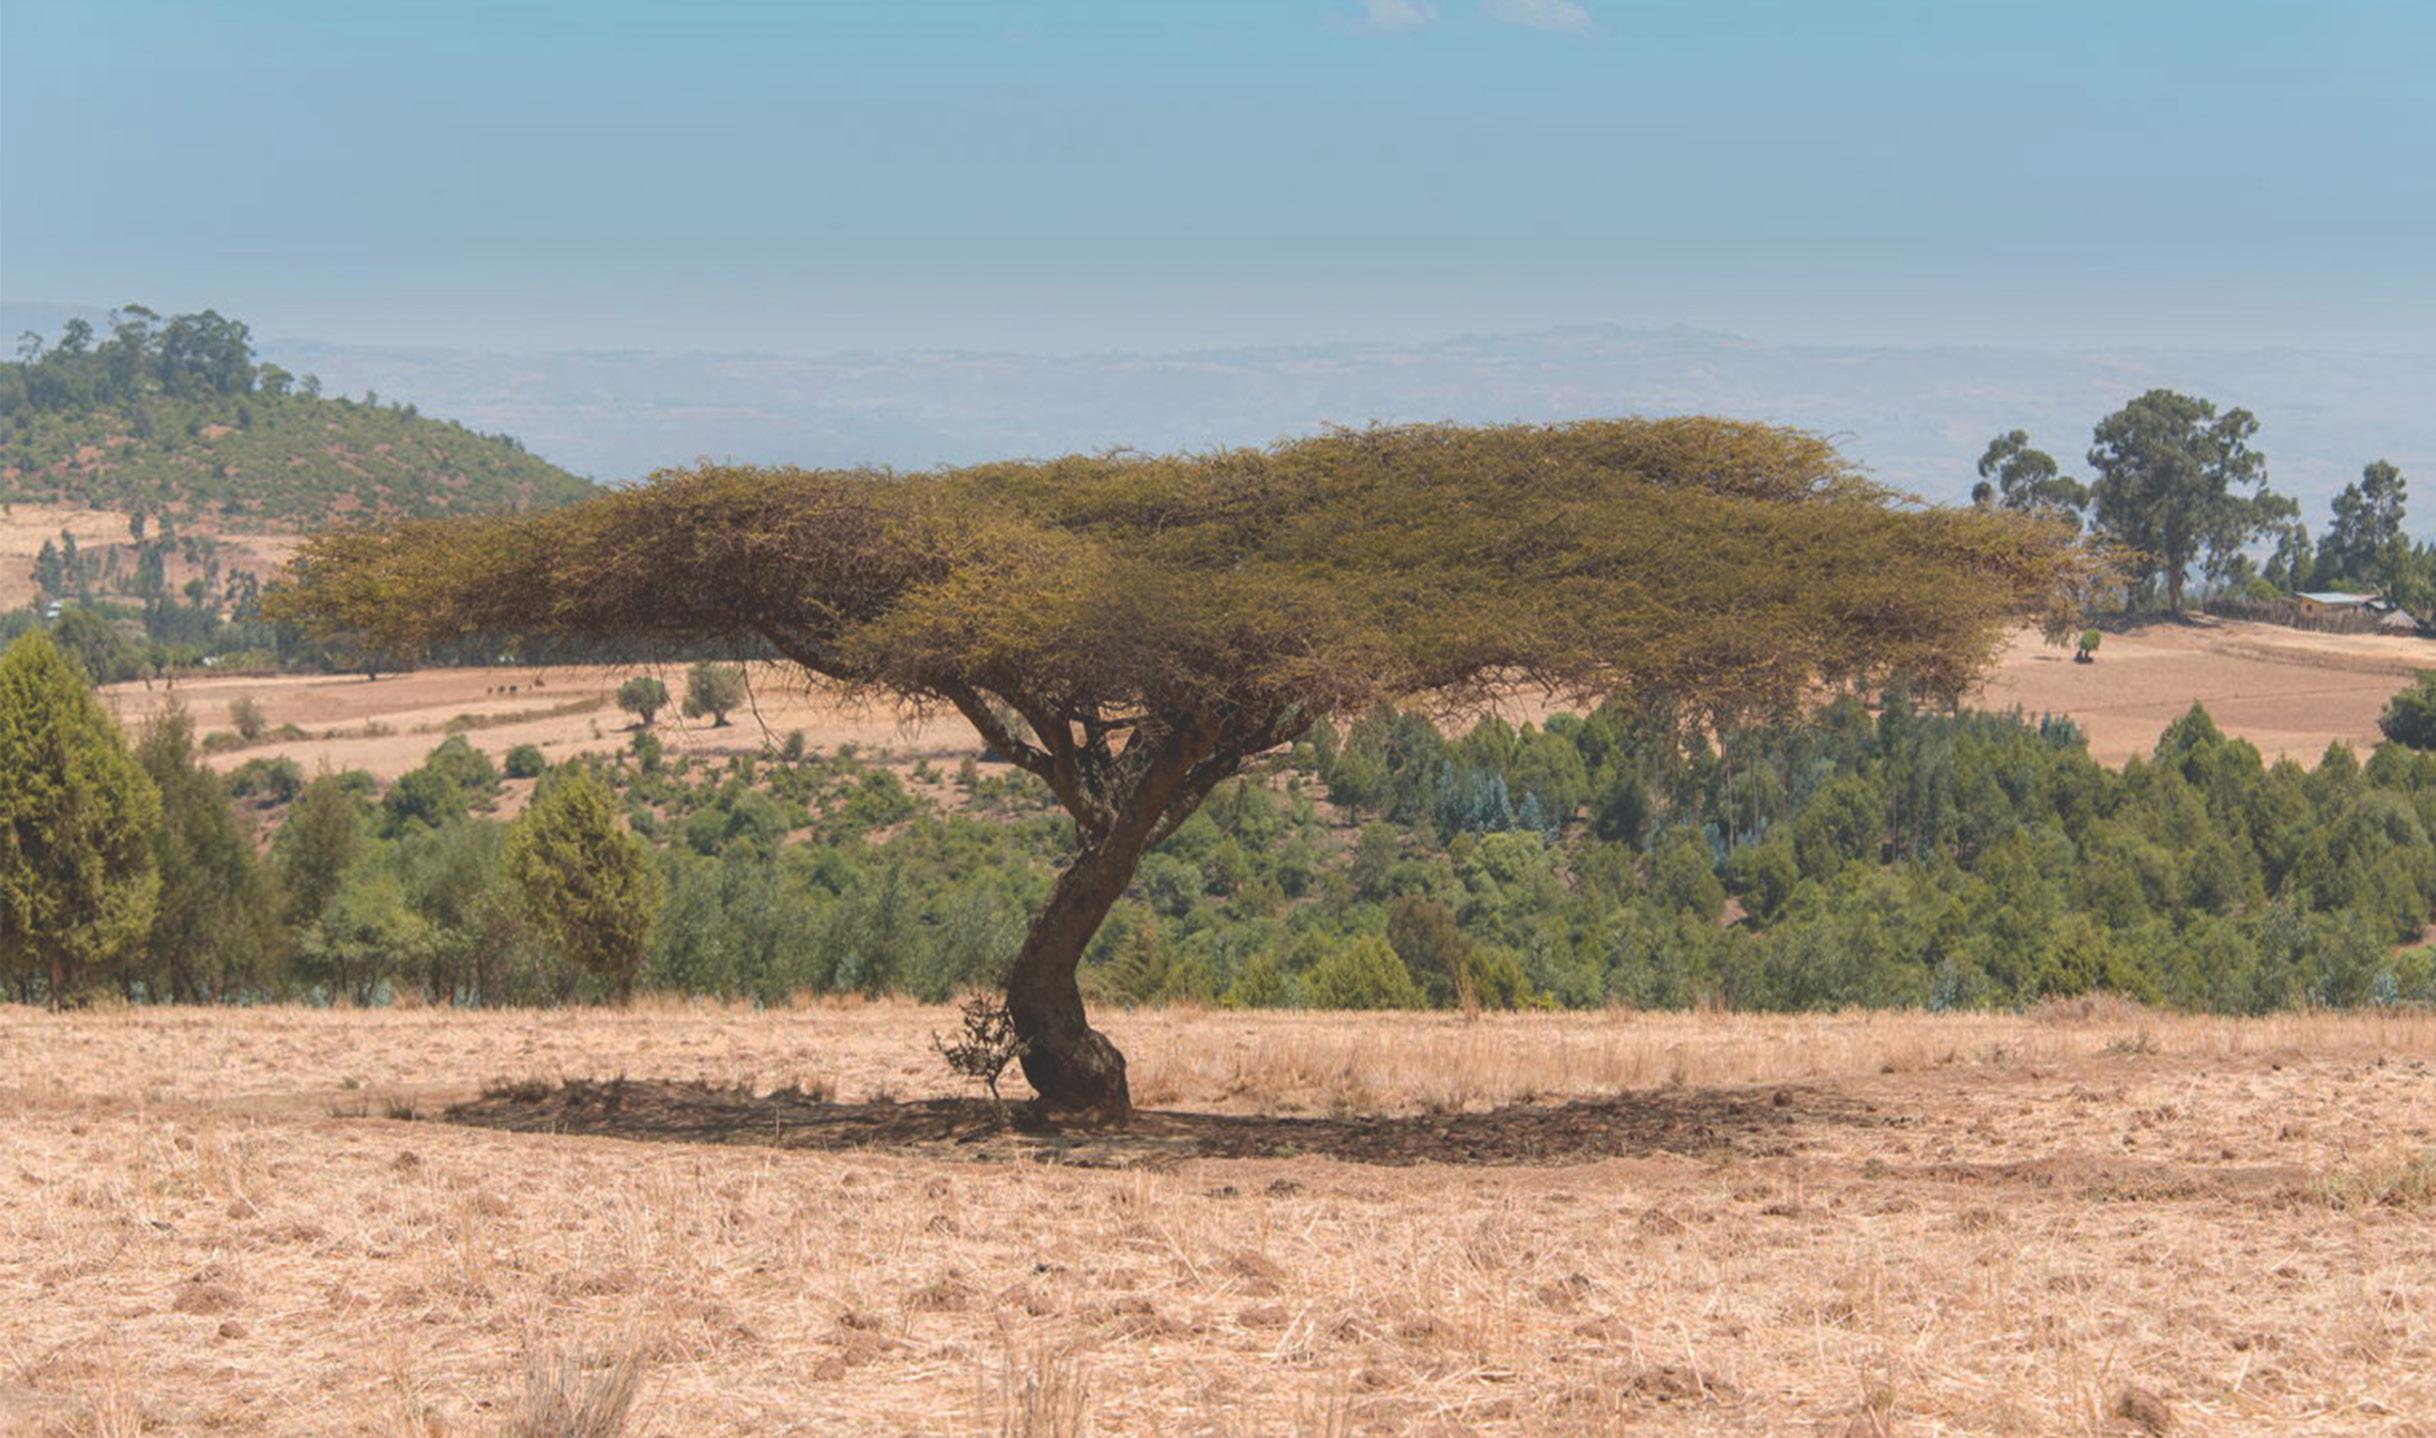
To further define the local tree species used around our site, it was important to understand its vegetation classification type. According to the atlas of vegetation in Ethiopia presented by (Friis et al), it was found that our site lies within the Acacia-Commiphora woodland and bushland proper type. This class is known for its drought-resistant trees and shrubs where the most common trees used for construction are Acacia trees.
Based on H.N. Le Houerou’s research on browse plants in the Fafan region, it was concluded that the most common species, used by pastoralist and Agropastoralists, available around our site are by order: Acacia nolitica, Acacia tortilis, Acacia bussei, Ziziphus muritani. Wood
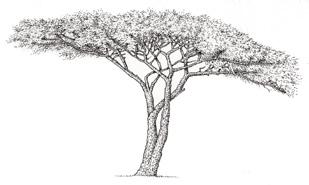
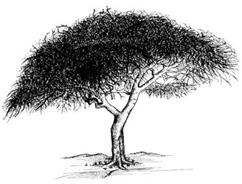
Acacias grow slowly with a final height of 3 to 5 m, and a spread of 8-13 m. Their branches range between 10 mm and 40 mm2 in thickness with varying length ranging from 20 to just over 150 cm.
The specific use of these trees was further detailed by Prussin , where he illustrated the following:
Acacia nilotica: branches used for tent pickets and lateral bars; roots are used as thick curved poles.
Acacia tortilis: roots and bark are made into rope; roots are also used as house poles.
Acacia bussei: roots are used for bent armatures; bark is braided into ropes.
Ziziphus Muritania: branches are used for tent pickets and bent into arches for barrel-vaulted tents
Grass is abundant in that semi-arid area of somali where the most common species are the Andropogon greenwayi and panicum turgidum ; these are mainly used in weaving the mats used for tent sidewalls and also, for making ropes.
Grass
FIG 50 Acacia nolitica tree in the semi dry region of Ethiopia surrounded by short shrubs (Google Earth Images)
T r e e s / S h u r b s LOCAL AVAILABILITY G r a s s E a r t h
Ziziphus muritania
Andropogon greenwayi
Acacia nolitica
Loamy Sand
Acacia tortilis
Sand Stone
Acacia bussei
Panicum atrosanguineum
TRANSITIONAL SHELTERS
02 - 4.2
EMERGENCY SHELTERS
02 - 4.2.1
A Transitional shelter is often comparable in quality to that of the emergency shelter; however, its main advantage is that, with affordable upgrades, its quality can be improved. The design of our shelter is intended to reflect on the vernacular construction forms and materials and develop a transformation process informed by the habitual and emergent patterns of action.
Emergency shelters are then explored, assessed, and compared to further develop the concept based on the different results.
An emergency shelter is temporarily populated when people are unable to live in their previous residence and mainly provided by organizations or governmental emergency management departments. However, most shelters are less durable to maintain for long periods, and storage for future use is mostly a problem. The construction time and labour required to build the dwelling, and transportability are also key factors to consider when designing a temporary housing. We chose 4 types of these shelters based on their ability to be fastly constructed and their previous use in somehow similar scenarios.
Fabrics
Construction time
Local Material Usage
Durability
Transformation
Modularity
Vernacular Adaptation
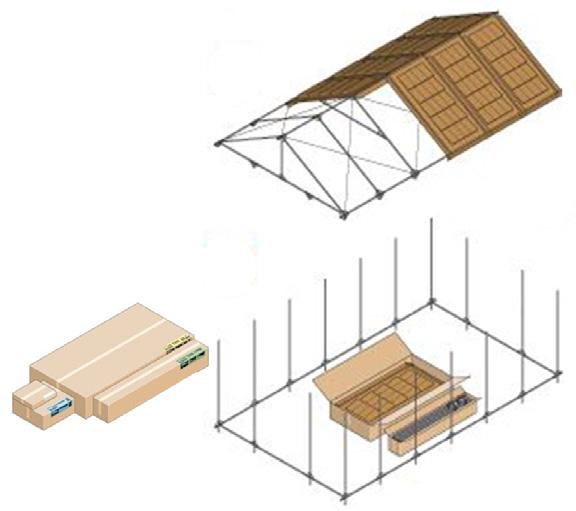
Deployable Structures
Construction time
Local Material Usage
Durability
Transformation
Modularity
Vernacular Adaptation
Inflatables
Construction time
Local Material Usage
Durability
Transformation
Modularity
Vernacular Adaptation
Kit of Parts
Construction time
Local Material Usage
Durability
Transformation
Modularity
Vernacular Adaptation
Conclusion
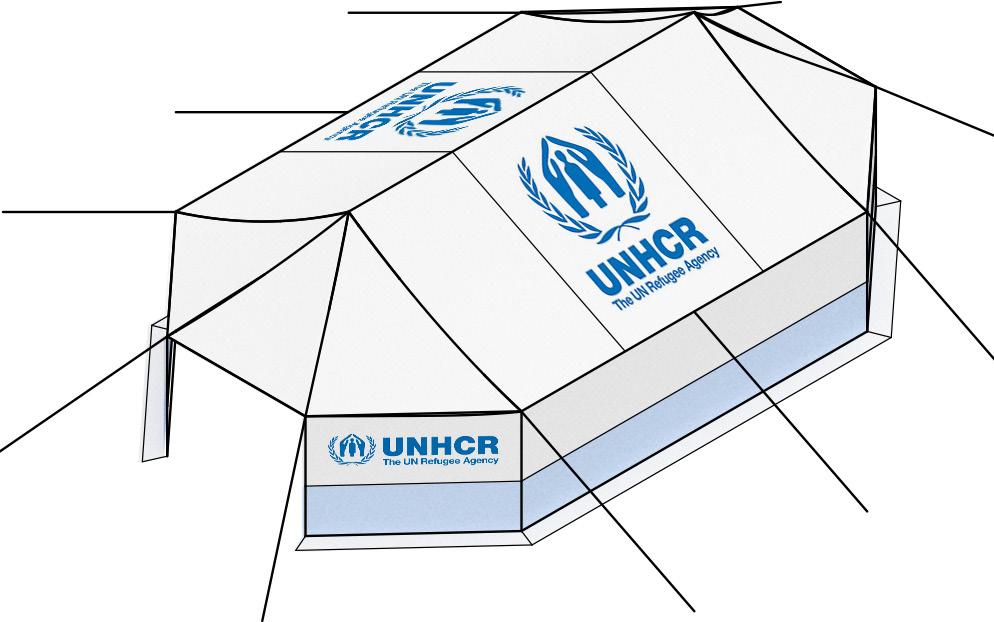
According to assessment findings, deployable structures have showed a significant potential in nearly all aspects. Their main advantage is the ability to be constructed out of small tree branches already available in vast amounts within the region. Combined with different natural fibres, their ability to adapt and transform can be further enhanced.
Low-tech Balloon System UNHCR Family Tent UNHCR
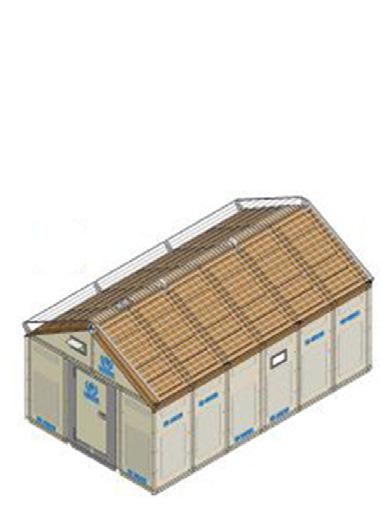
Refugee Family House, UNHCR Deployabe Dome, SMIA
TRANSFORMATION Inspired by the wattle and daub technique developed by Agro-pastoralists, in which they use earth as a coating and plastering material to add more permanence to their different structures, we propose Bio-shotcrete in this section as a potential transformation strategy using earth as is the most abundant building material sufficiently available in the region.
02 - 4.2.2
In this traditional practice, different clay mix layers are sequentially coated by hand on a light wooden formwork resulting in wall panels used for either discrete construction or building monolithic shells. As this technique is considered highly unsustainable due to the amount of wood needed for its construction; an alternative approach is proposed.
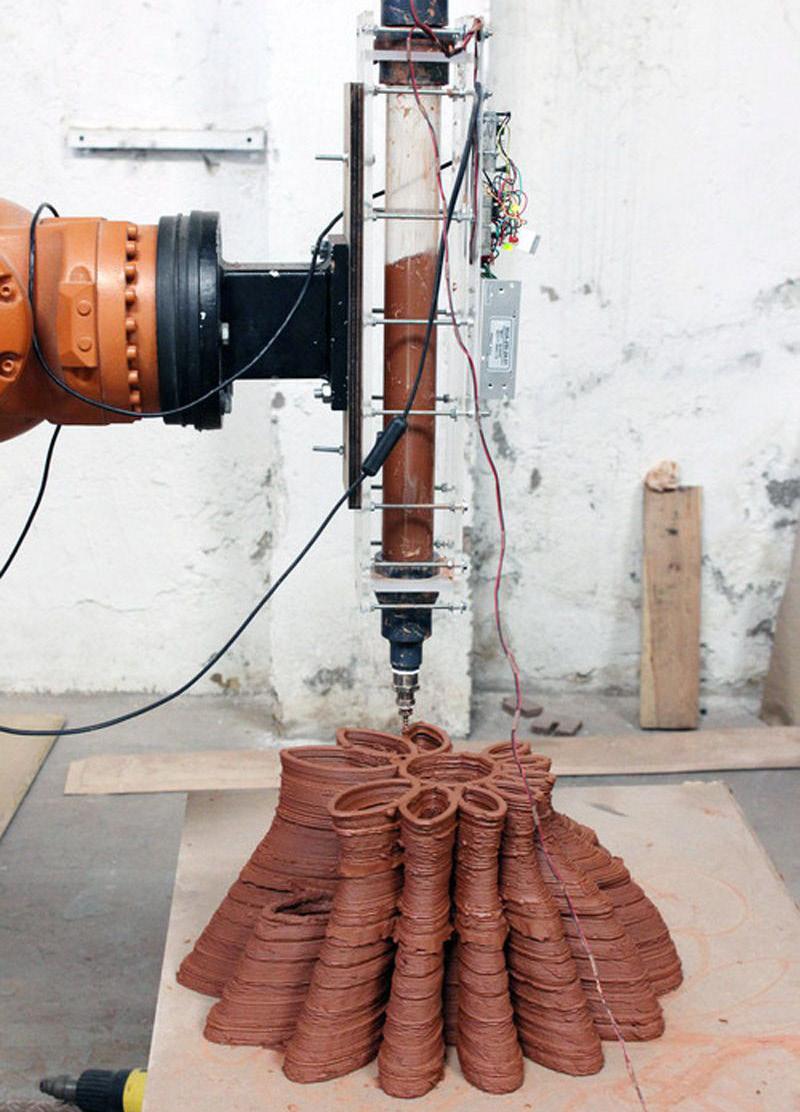
Several experiments carried out mostly in academic environments in recent years propose to revisit clay as a traditional building material and to study possible formulations and applications using different technologies; These experiments feature additive manufacturing with two types of clay deposition: extrusion and spraying, both of which have a long history using shotcrete (both wet and dry concrete mix).
FIG( Left) Robotic additive manufacturing of clay material developed in the Institute of advanced architecture in Catalonia
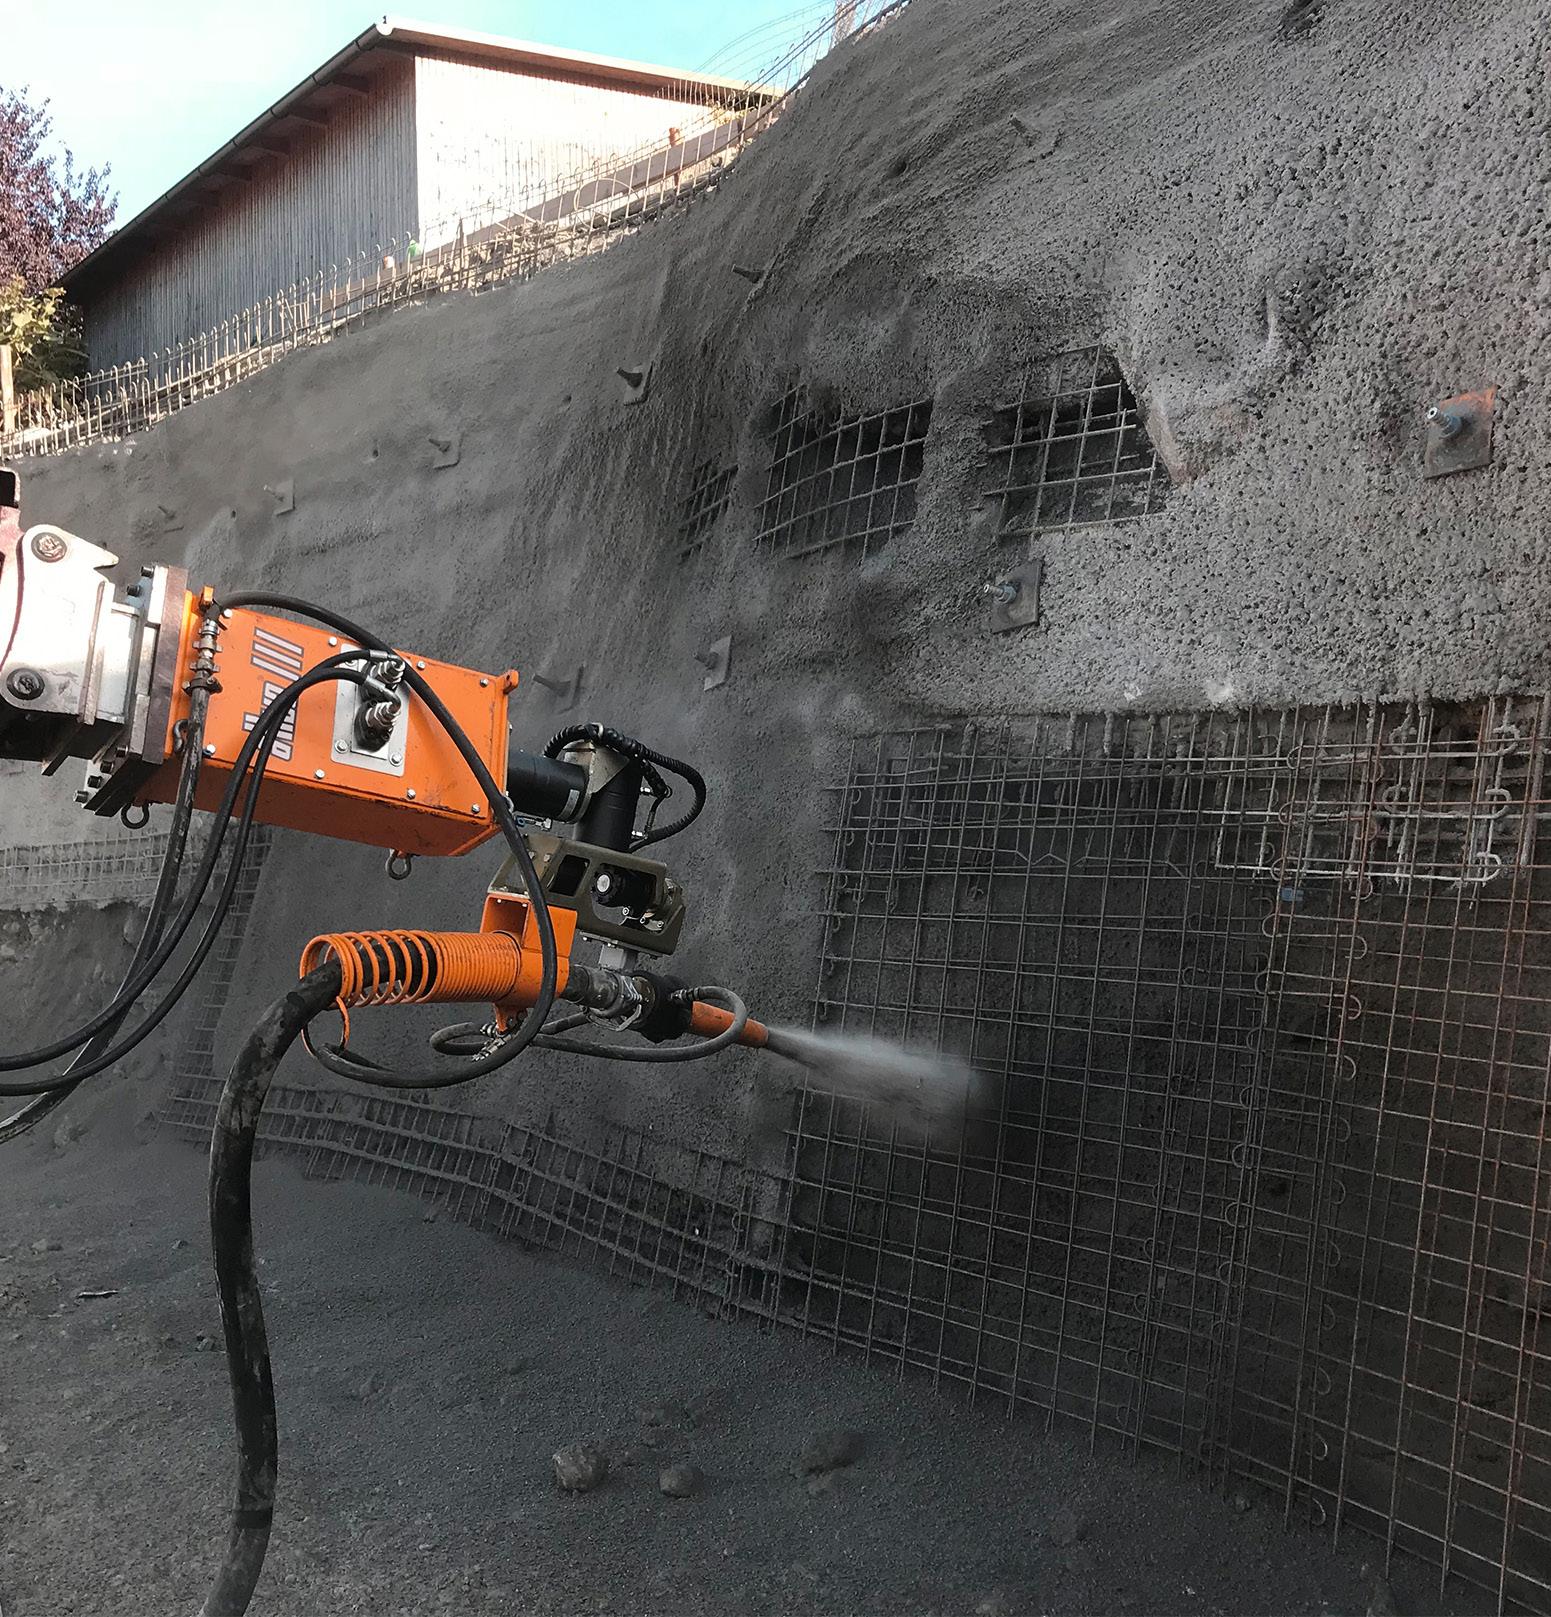
FIG 50 Spraying of concrete (shotcrete) over a mesh formwork in a construction site using a pipe connected to air compressor
Robotic-Arm
Initial experiments on these couple of techniques revealed that extrusion requires high precision in terms of distance, velocity of deposition and shape, and on the other hand, spraying allows a higher level of imprecision in terms of distance nozzle/surface; That led us to lean towards spraying as a potential technique for it is more suitable to be taught in an environment of rural inhabitants with little technological knowledge.
Bio-Shootcrete
“Bio-shotcrete” is a term used to refer to clay spraying; it lies at the intersection between shotcrete and wattle and daub. It is a novel technique developed by multi-disciplinary designers and engineers aimed at formulating a more sustainable version of the current shotcrete industry by using clay as the matter instead of concrete, smaller equipment, and a temporary light formwork of natural fibre textiles. A precise process must be followed for its implementation, consisting in the careful formulation of different clay layers and in the correct deposition phasing, all aimed at achieving matter/surface adhesion and added control in the resulting thicknesses necessary for the construction of large-scale earthen shells in a matter of days.
Past experiments explored two specific technologies using bio-shotcrete: robotic arms and drones; These two techniques are compared and accordingly, a strategy is chosen to be further developed.
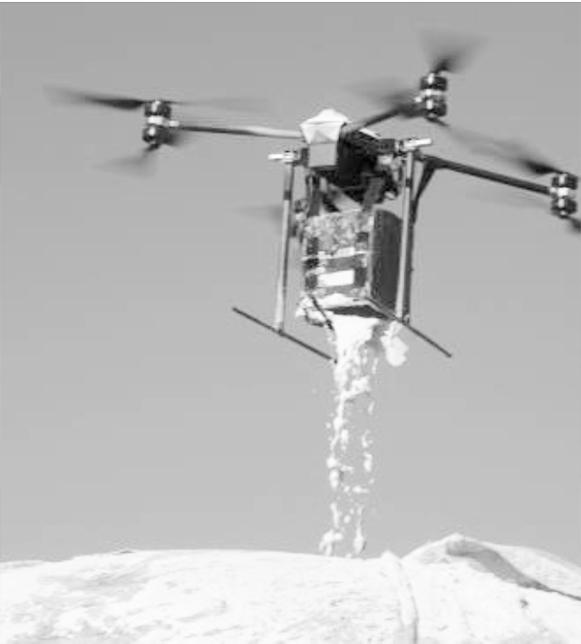
FIG 50 Drone clay spraying over an inflatable formwork as a test developed at the Barcelona drone center in 2018
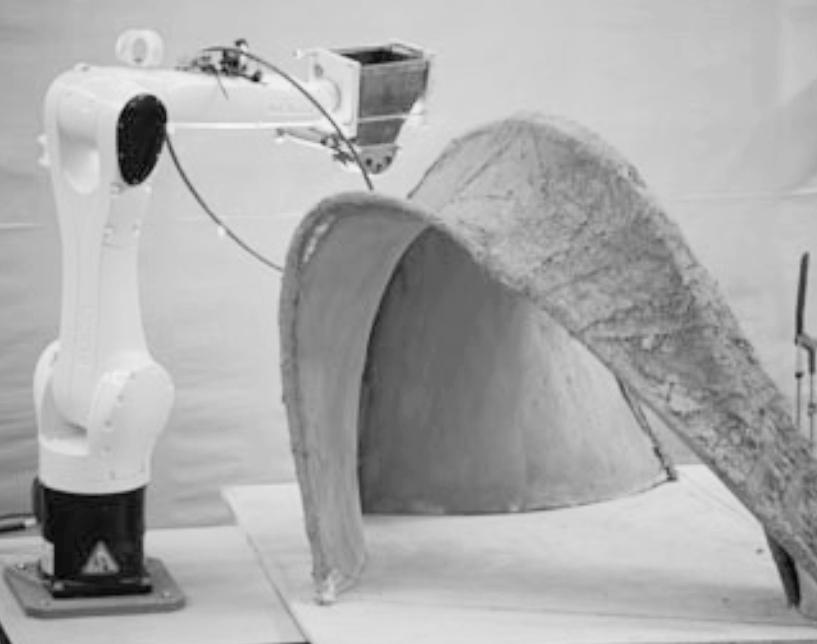
FIG 50 Self-standing shell after robotic bio-shotcrete as an experiment developed in Sweden in 2016.
The use of robotic arms shows limitations such as the arm’s reaching capacity, the cost and size of the equipment, and the difficulty of transporting these heavy apparatuses to remote sites.
On the other hand, using drones can overcome these limitations and additionally allow for a constant feed of material if connected to a mortar spraying machine pipe; however, flying drones is harder to operate.
The integration between matter and drone actions must be carefully choreographed. For that, different factors should be considered before conducting experiments.
Material Mix: A mix should be formulated precisely in the correct deposition phasing with different clay layers
Material Container: A container must be continuously stirred to avoid creating disparities in the coating. Material transport: For its deposition, suitable feeding mechanism is needed; A pipe connected to a ground air compressor is suggested.
Sprayer output format: For the discharge, clay material must be in a hydric state compatible to viscous.
Drone Actions
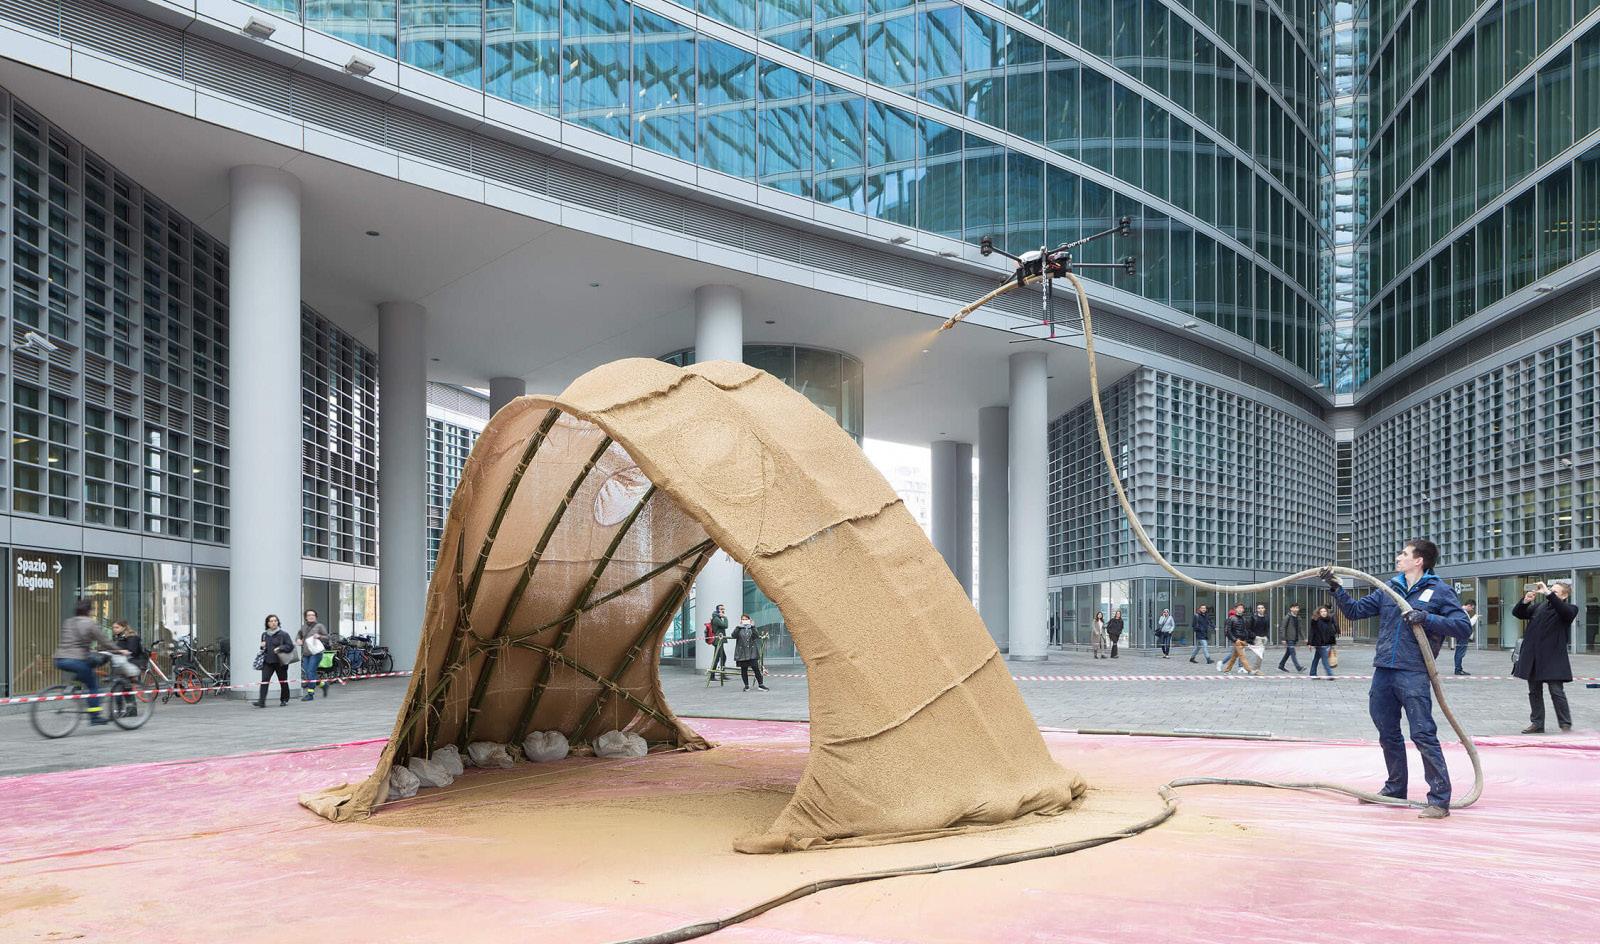
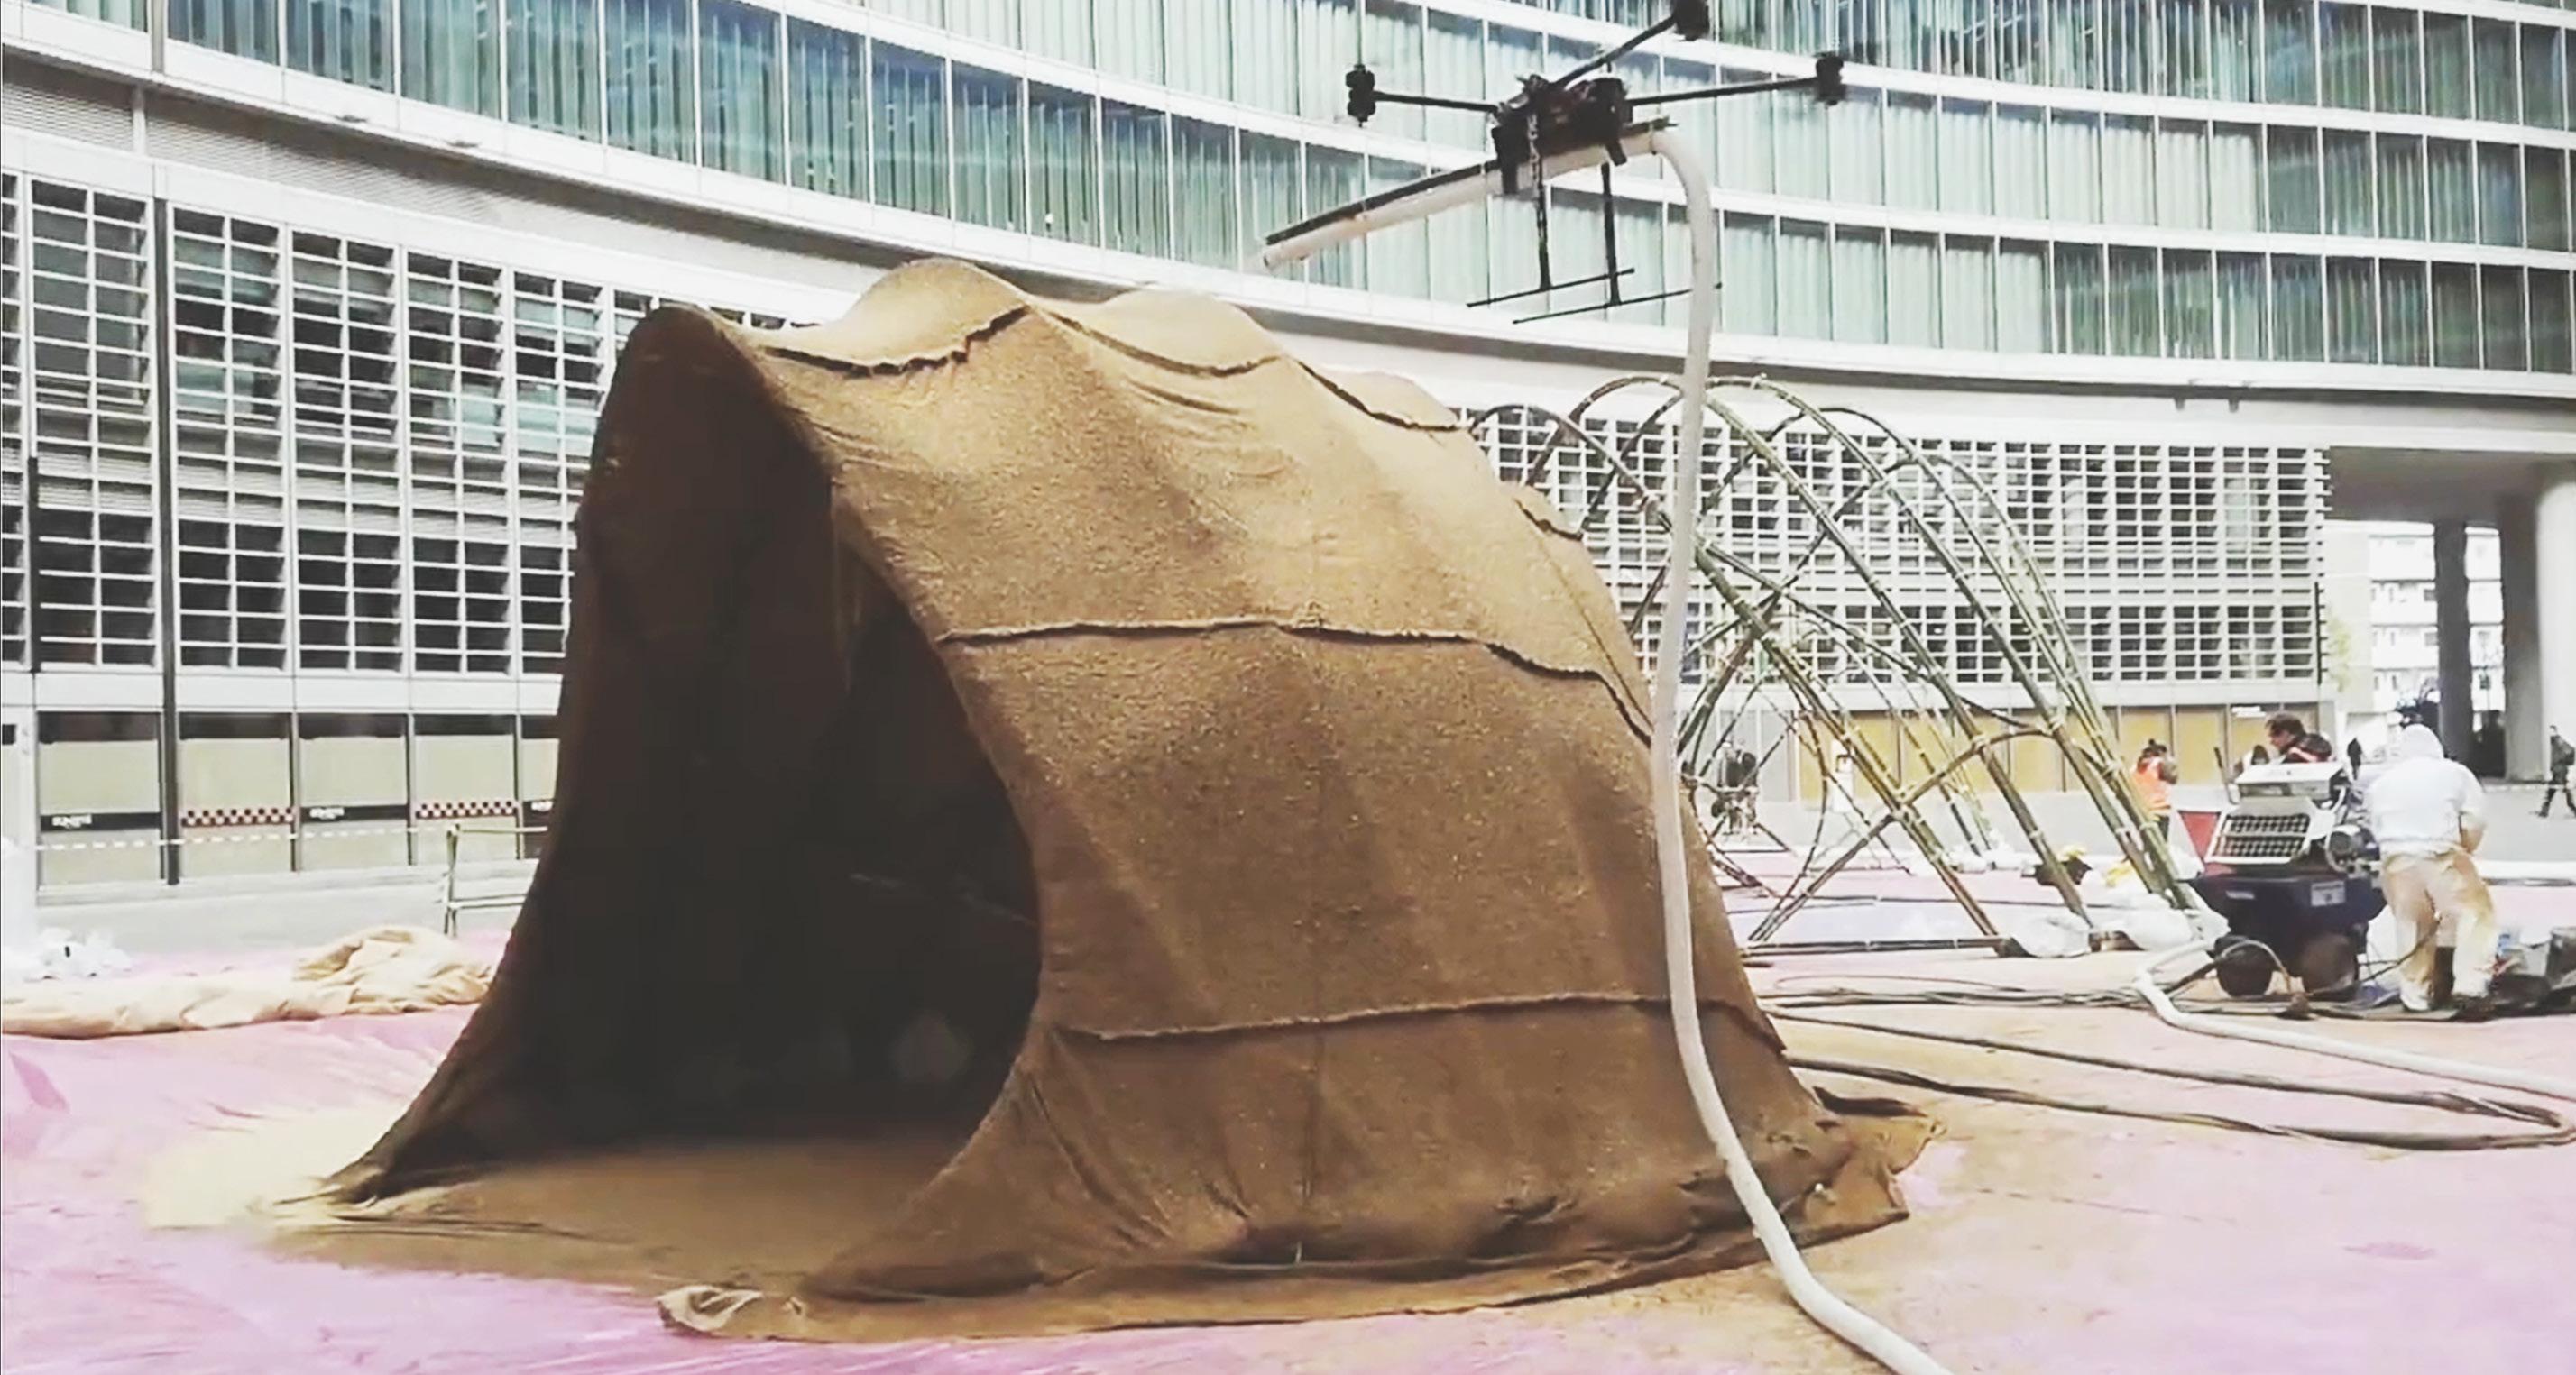
FIG 60 “Terramia project”, the latest iteration of drone bio-shitcrete on a large scale structure exhibited in Milan Design week in 2019
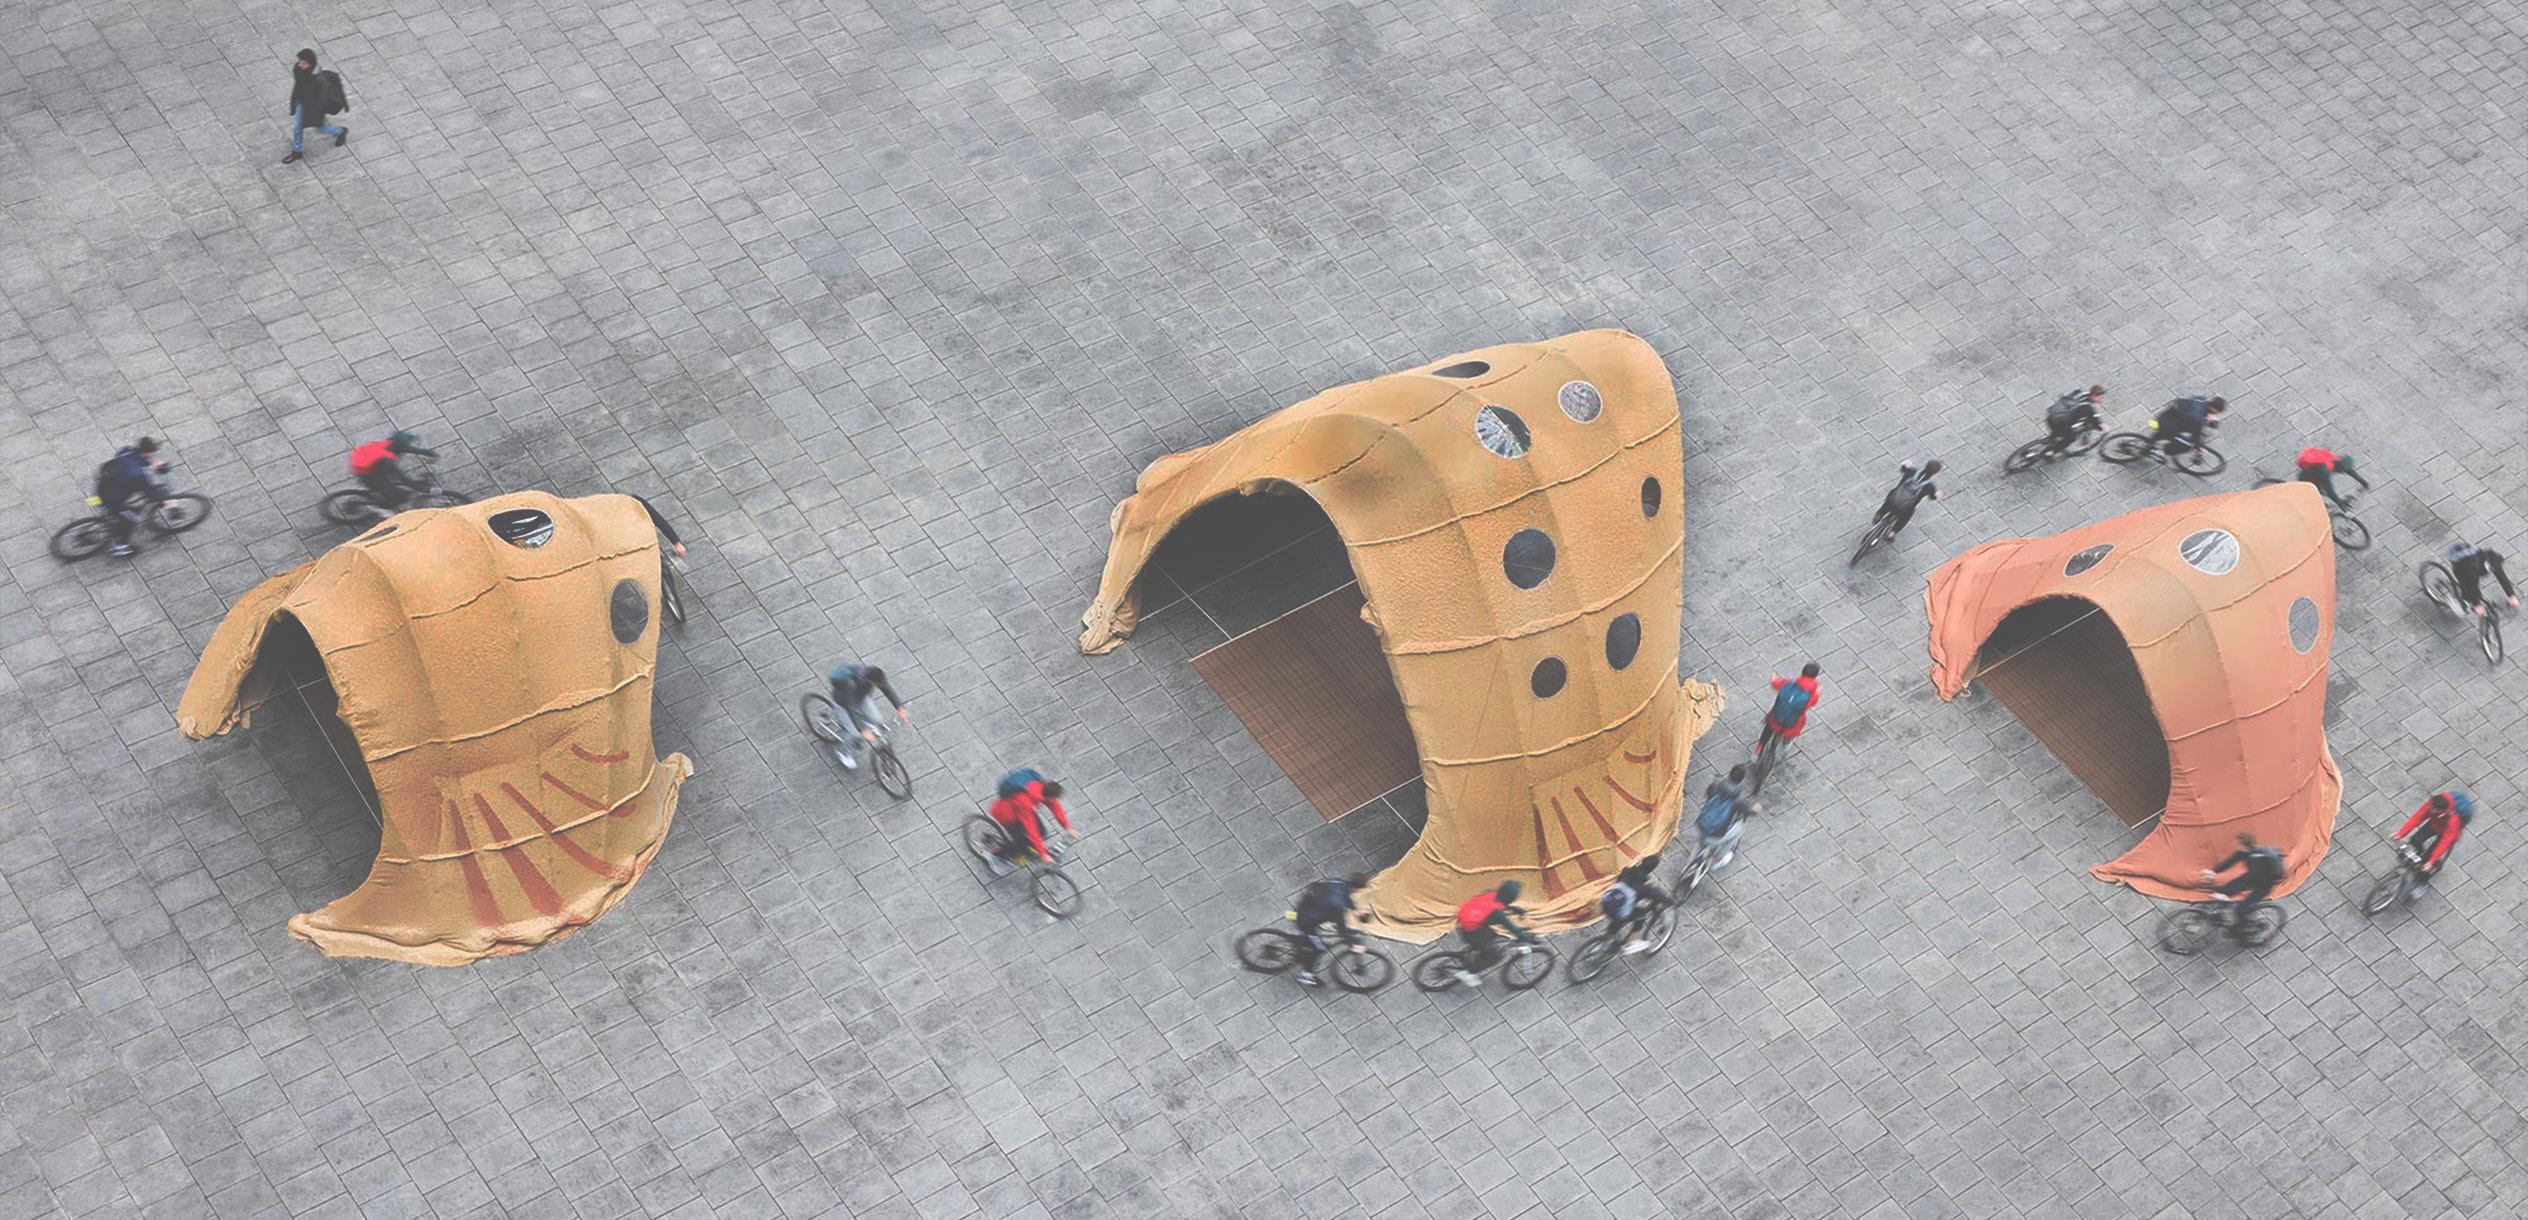
Our proposal is based on the outcomes of the latest iteration of the Bio-shotcrete project called “Terramia” which aimed at allowing large constructions to happen on site. Their final design showcased the bio-shotcreting of a 7.8 x 6.7 temporary bamboo structure covered with jute fabric. They proposed using a 2 m wide drone, manufactured by RC Take Off and developed by UC Louvain, which is fitted with 50 cm high legs for safe landing when spraying tools are attached. It can carry a maximum weight of 30 kgs.
Bio-shotcrete requires the careful formulation of mixtures to achieve a desired performance in terms of solid crust adhering well to the previous layer or initial surface. Therefore, each deposition layer has a different composition in which grains, fibres, density, and the proportion of clay which acts as a binding agent, and water can considerably differ. Three main types of layers are essential for successful results:
1. The liquid layer for the initial spray called “barbotine” which forms a homogeneous solid thin crust replacing the initial light formwork. This layer increases adhesion for the following layers.
2. Middle layers containing fibres, clay, water, and sands are helping to give thickness without overloading the delicate formwork, and to absorb excess moisture.
3. The upper coating contains stabilizing agents.
Based on the latest research, separating wet from dry matter proved to be the most efficient technique for bio-shotcrete. Accordingly, we decided to explore the showed mixture consisting of only natural materials since it is predictably the most suitable for our site conditions. On top of that, a final layer of cactus solution is proposed as a stabilizer and also a waterproof layer for the prospect of rainwater collection.
Material Mix
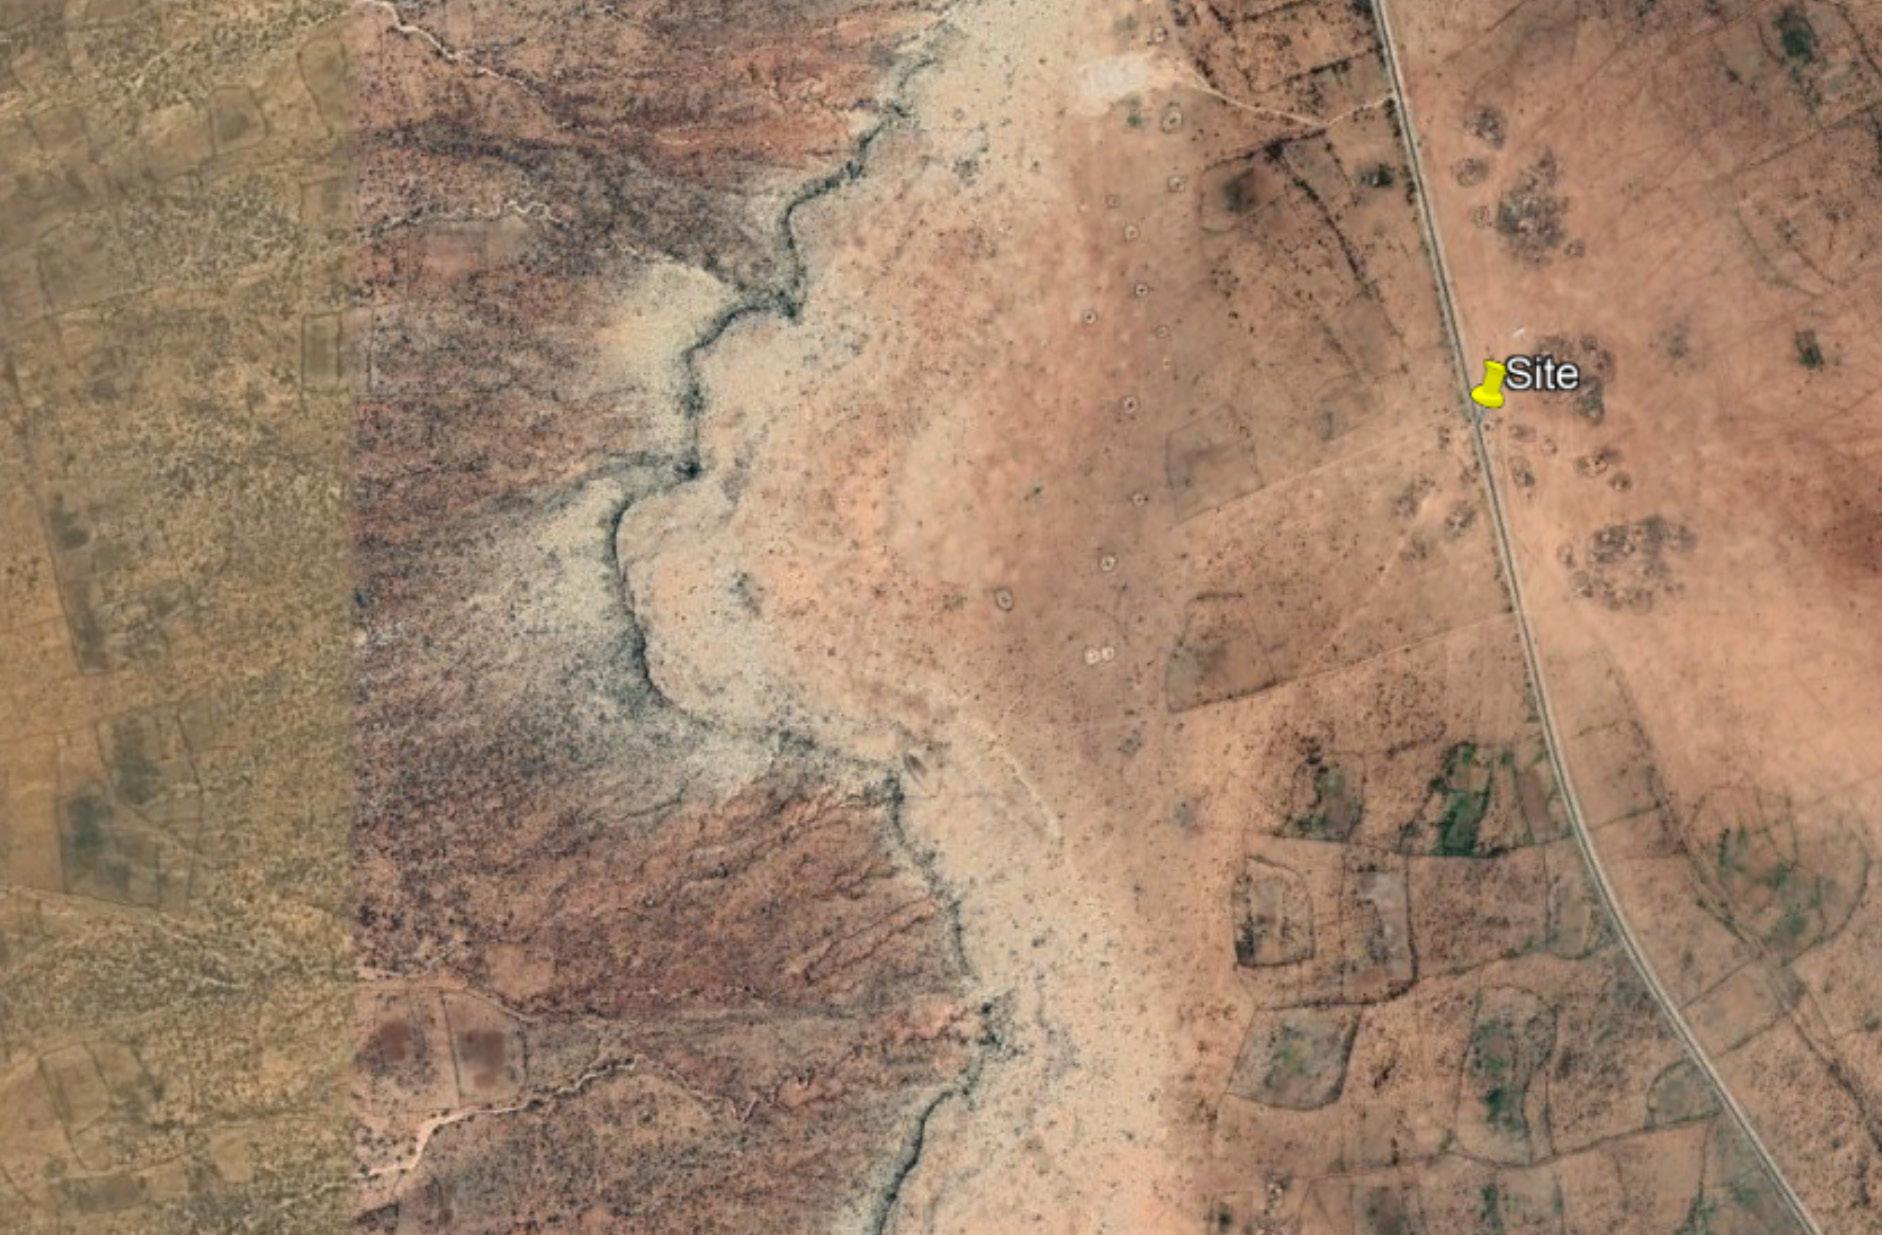
FIG 50 A satellite view of our site and its context.Our site has a soil containing of only 10-15% clay, however, we can see it lies just a few kms away from clay plains (3 km) formed by seasonal rivers, which we are planning to also use. (Google Earth Images)
Mixtures- Separate Wet and Dry Mixes
Phase 1
Phase 2
Water- 2 U
Water- 2 U
Stabilizers
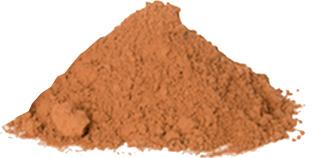
Clay- 1 U
Clay- 1 U 5 mm Sand- 1 U
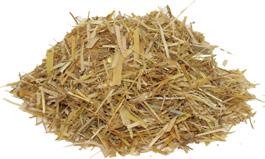
Straw- 1 U
Cactus Solution- 3U
Machine Specifications
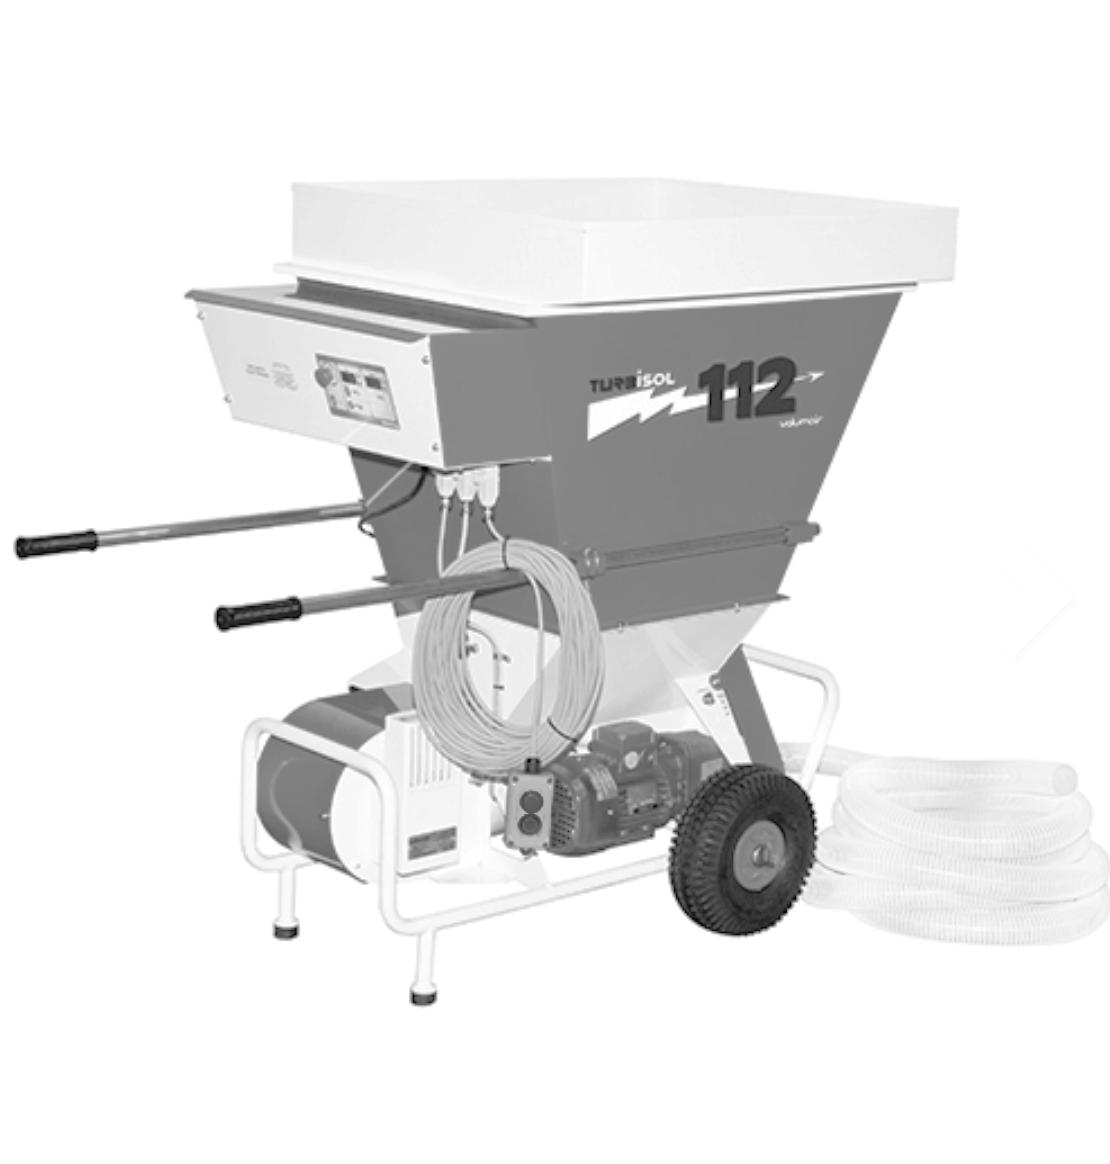
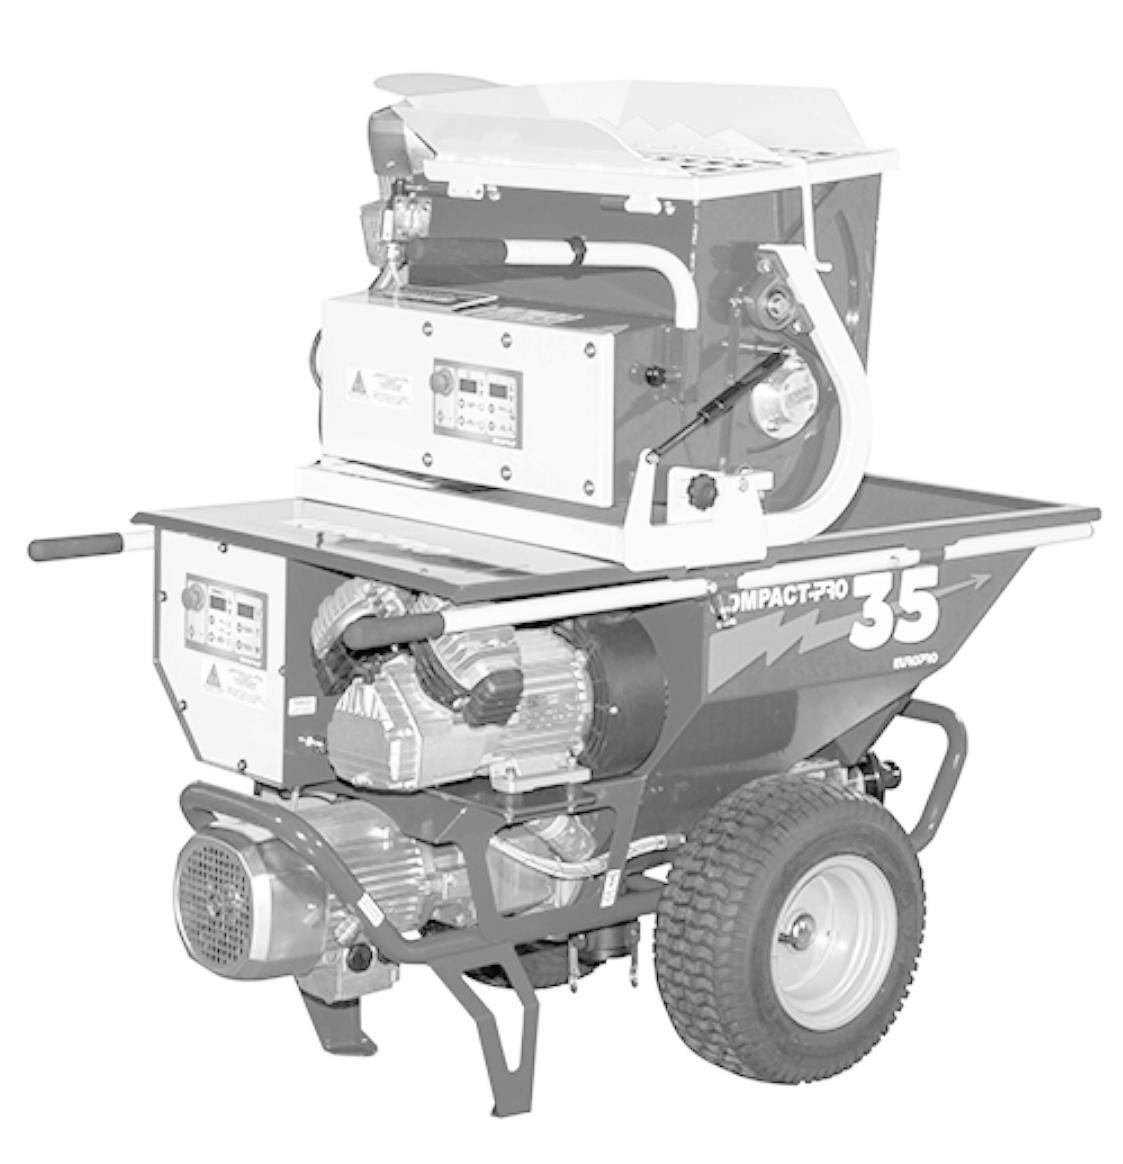
For spraying and blowing actions, two Euromair pump machines are used in the state of the art projects; Those are equipped with 20 m long hoses fitted underneath the drone increasing reachability.
Spraying: Project CP 35 E.W: I Verison, with black nozzle ref: 10048
This machine is composed of a spraying machine and a sequential mixer. It is equipped with a double helical paddle on a horizontal arm which ensures a rapid and homogeneous mixing, a water doser, a speed control and a rotation direction reversing function. It weighs 143 kg and has a tank capacity of a100 liter.
Blowing: Turbisol 112 ref. 30394, with 63mm hose diameter
This one weighs 95 kg and has a capacity of 220 litres, its applications are specifically related to dry fibres.
These machines are designed for human use as they allow for a high level of precision; Incorporating them with drone actions guarantees a professional process with accurate results.
FIG 61 (Top Right) Drone spraying actions with a pipe attached to Euromair blowing machine apparent in the background.
FIG 60, (Right) Euromair spraying machine
FIG 60, (Left) Euromair blowing machine
FIG 62 Three different-scale pavilions exhibited by MUDD architects as a part of the Terramia project after drone bio-shotcrete over a jute formwork fixed on bamboo rods
02 - 4.3
MATERIAL SYSTEM Based on the outcomes of our initial research, we are proposing a material system which we believe has the ability of achieving an adaptive system that can meet the needs of the different groups in the region, transitional from temporary to permanent.
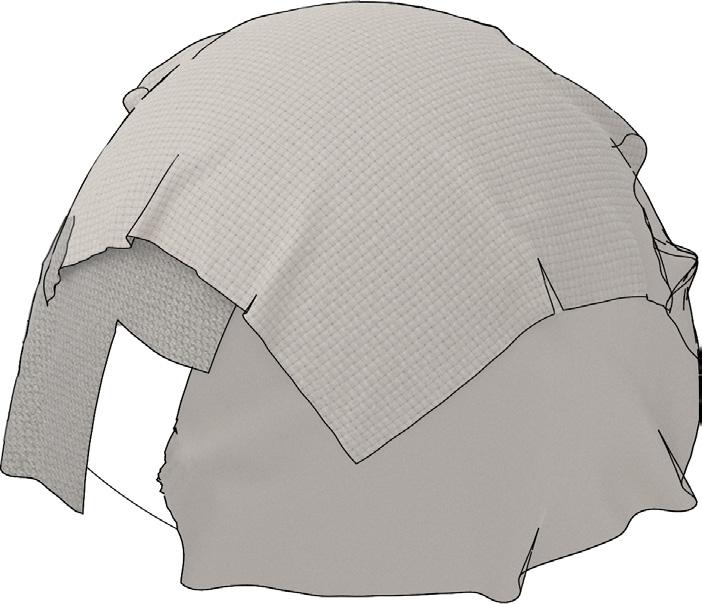
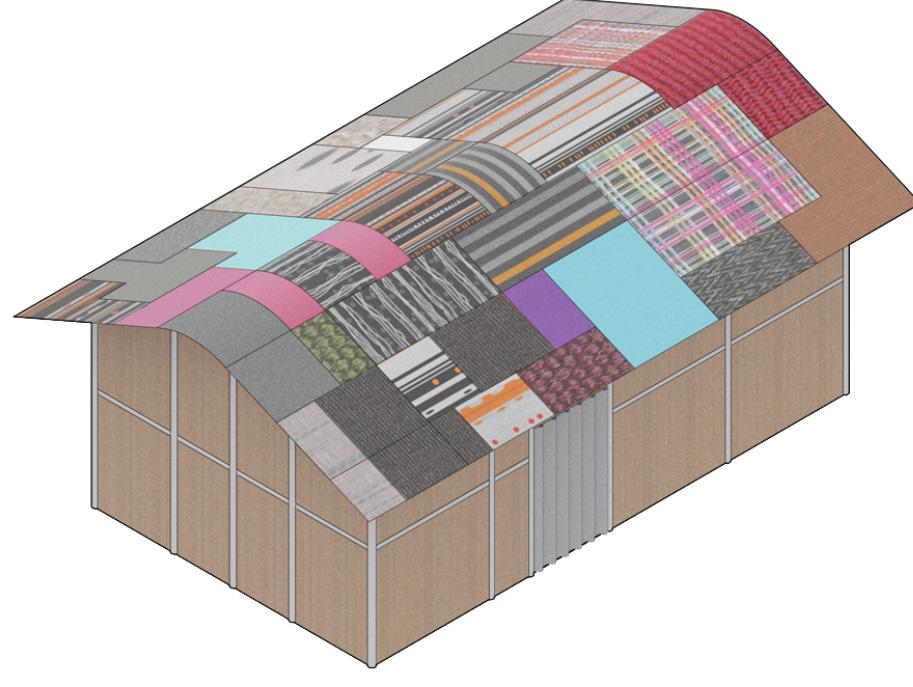
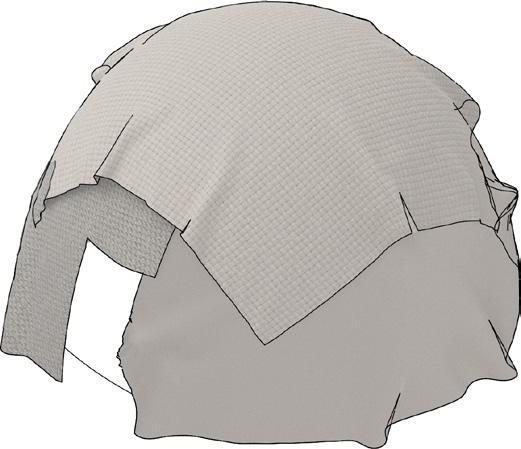
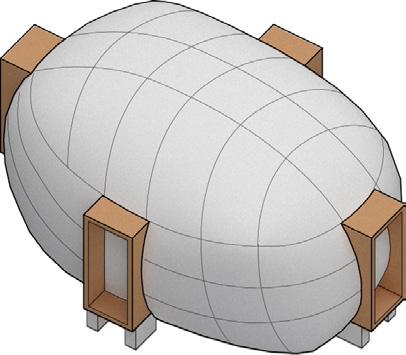
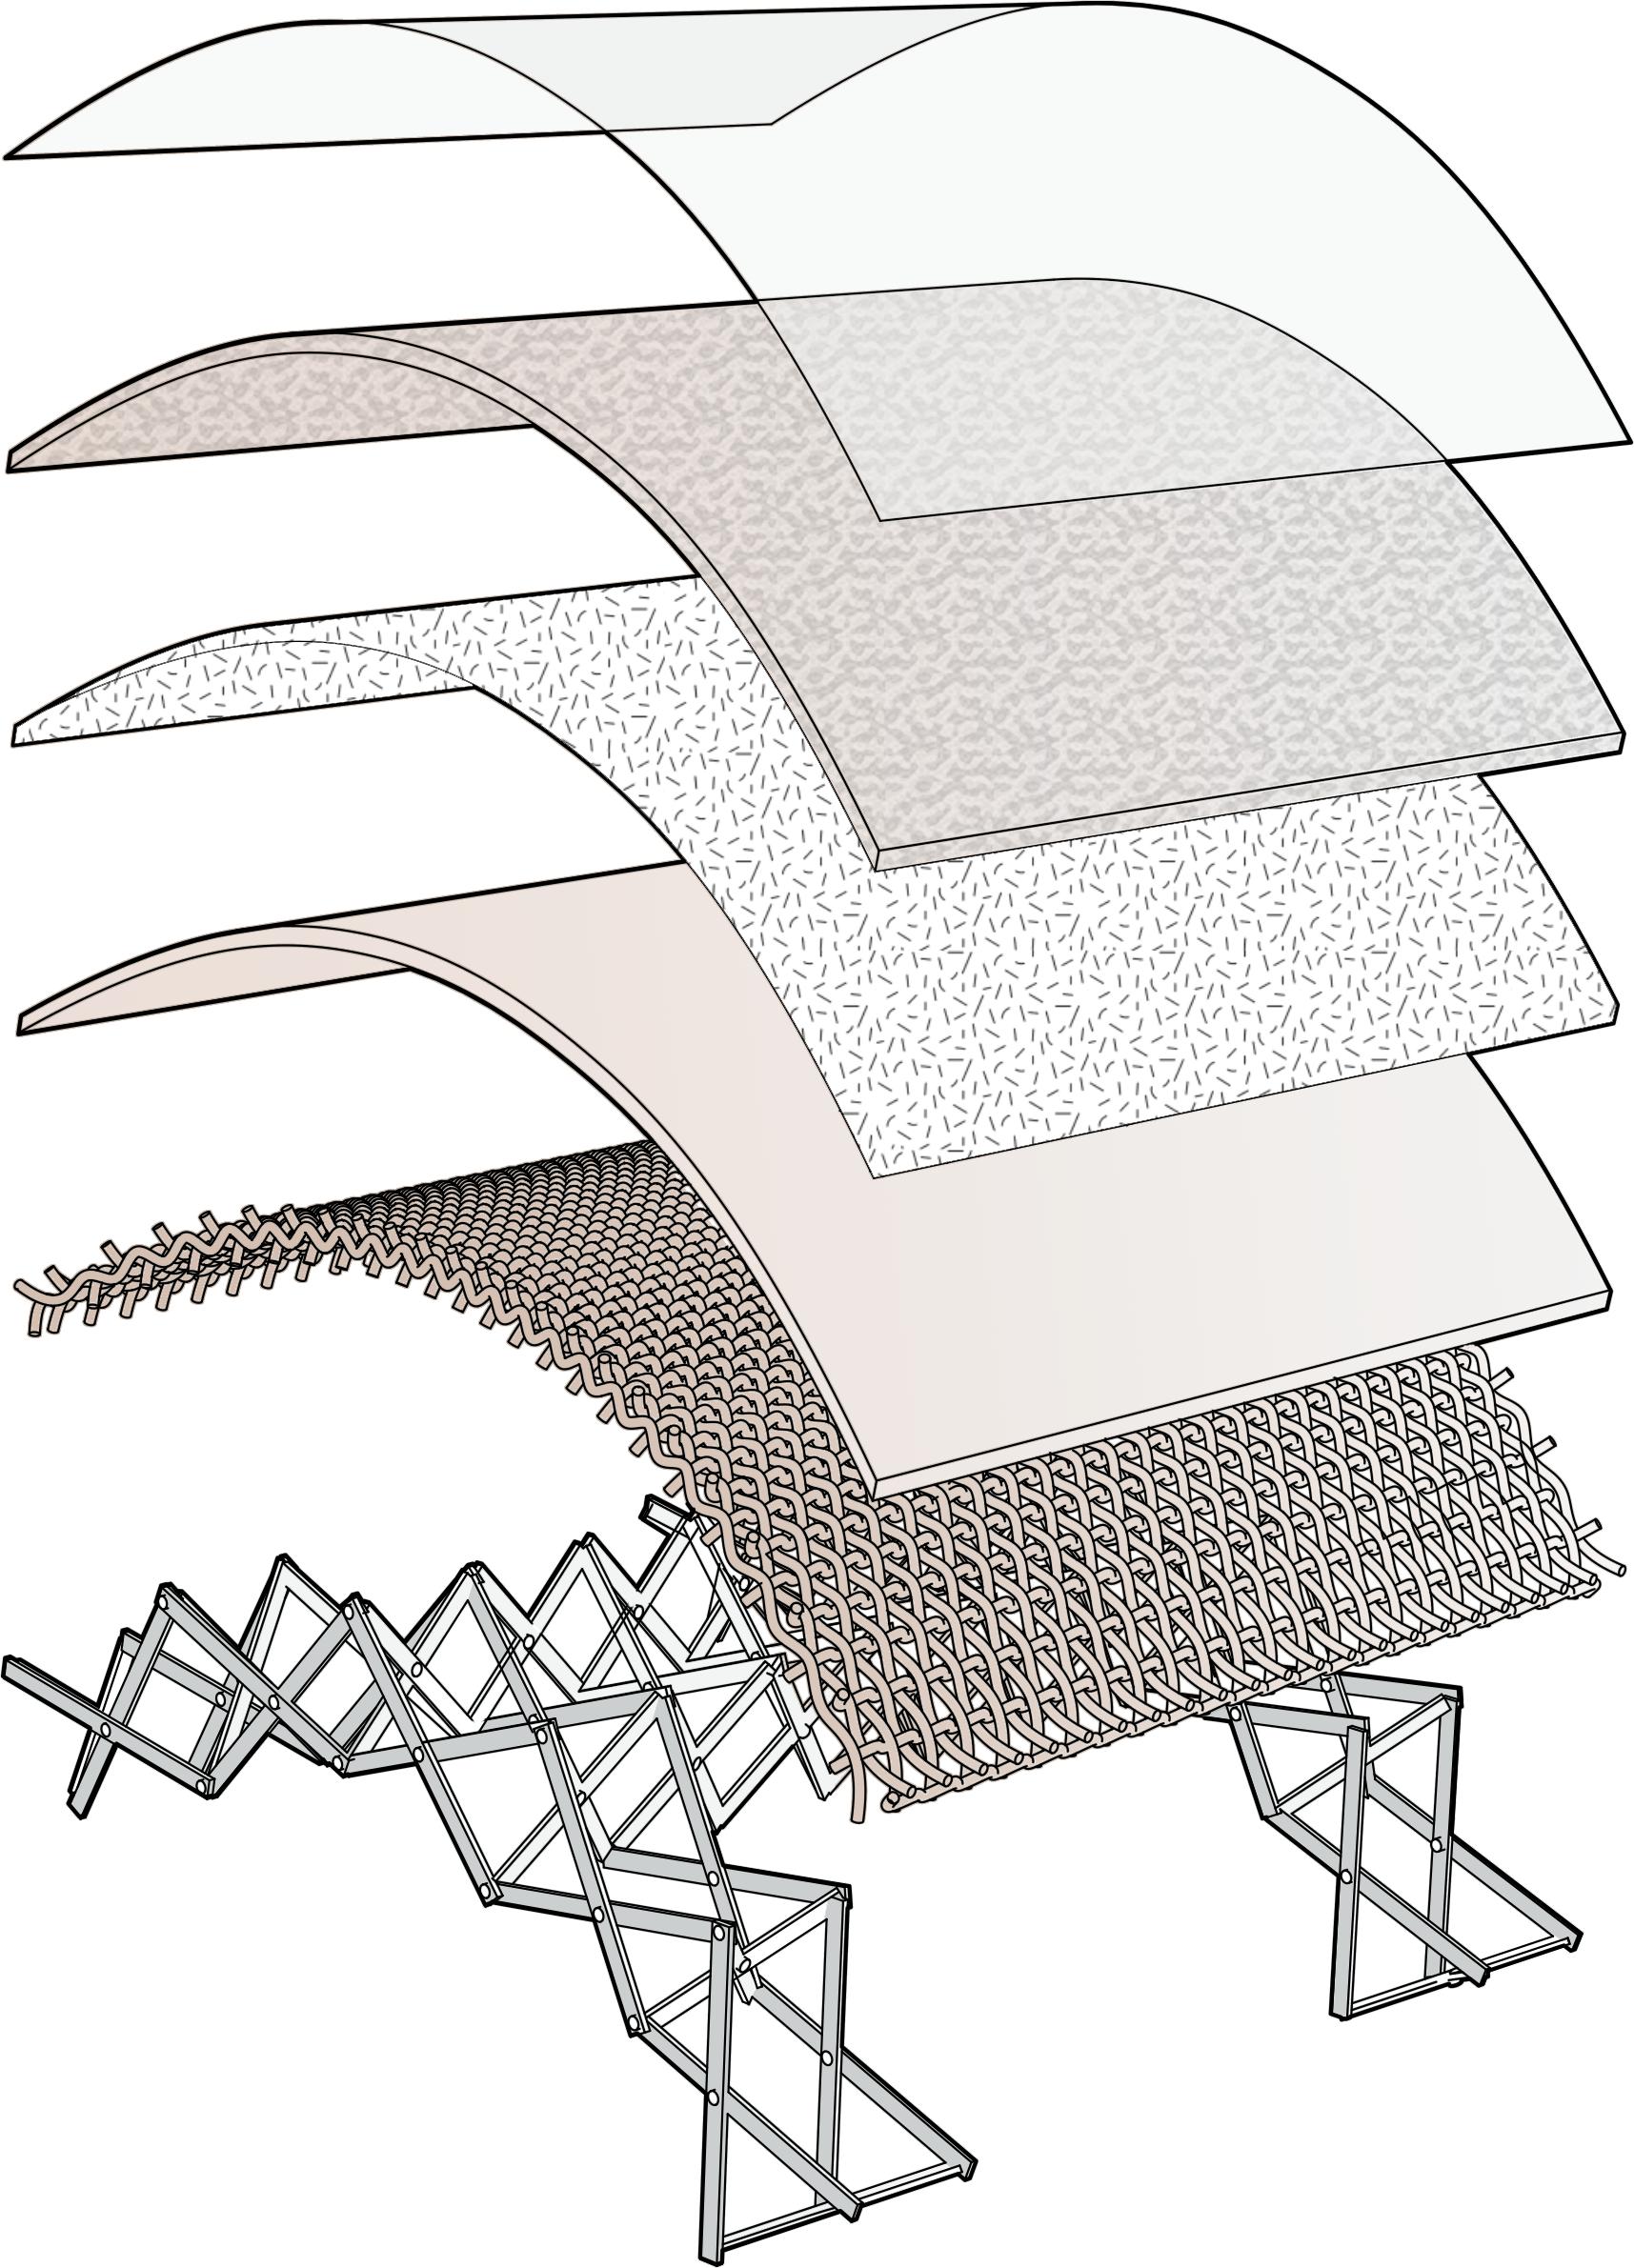
Inspired by vernacular practices, this system is composed of a deployable structure potentially constructed from tree branches, a fabric formwork represented in the nomadic grass mat which pastoralists have a wide knowledge of.
In the case of transformation to a more permanent dwelling, the nomadic mat would serve as a lost formwork for the multiple coatings of alternating sprayed wet and dry layers.
The dry fibrous layer is to be sprayed while the initial layer is still wet for a better layers’ adhesion. Viscous layers on the other hand need to be totally dry before spraying next layers which takes an average of 4 to 5 hours.
WATER MANAGEMENT STRATEGY
02 - 5.2
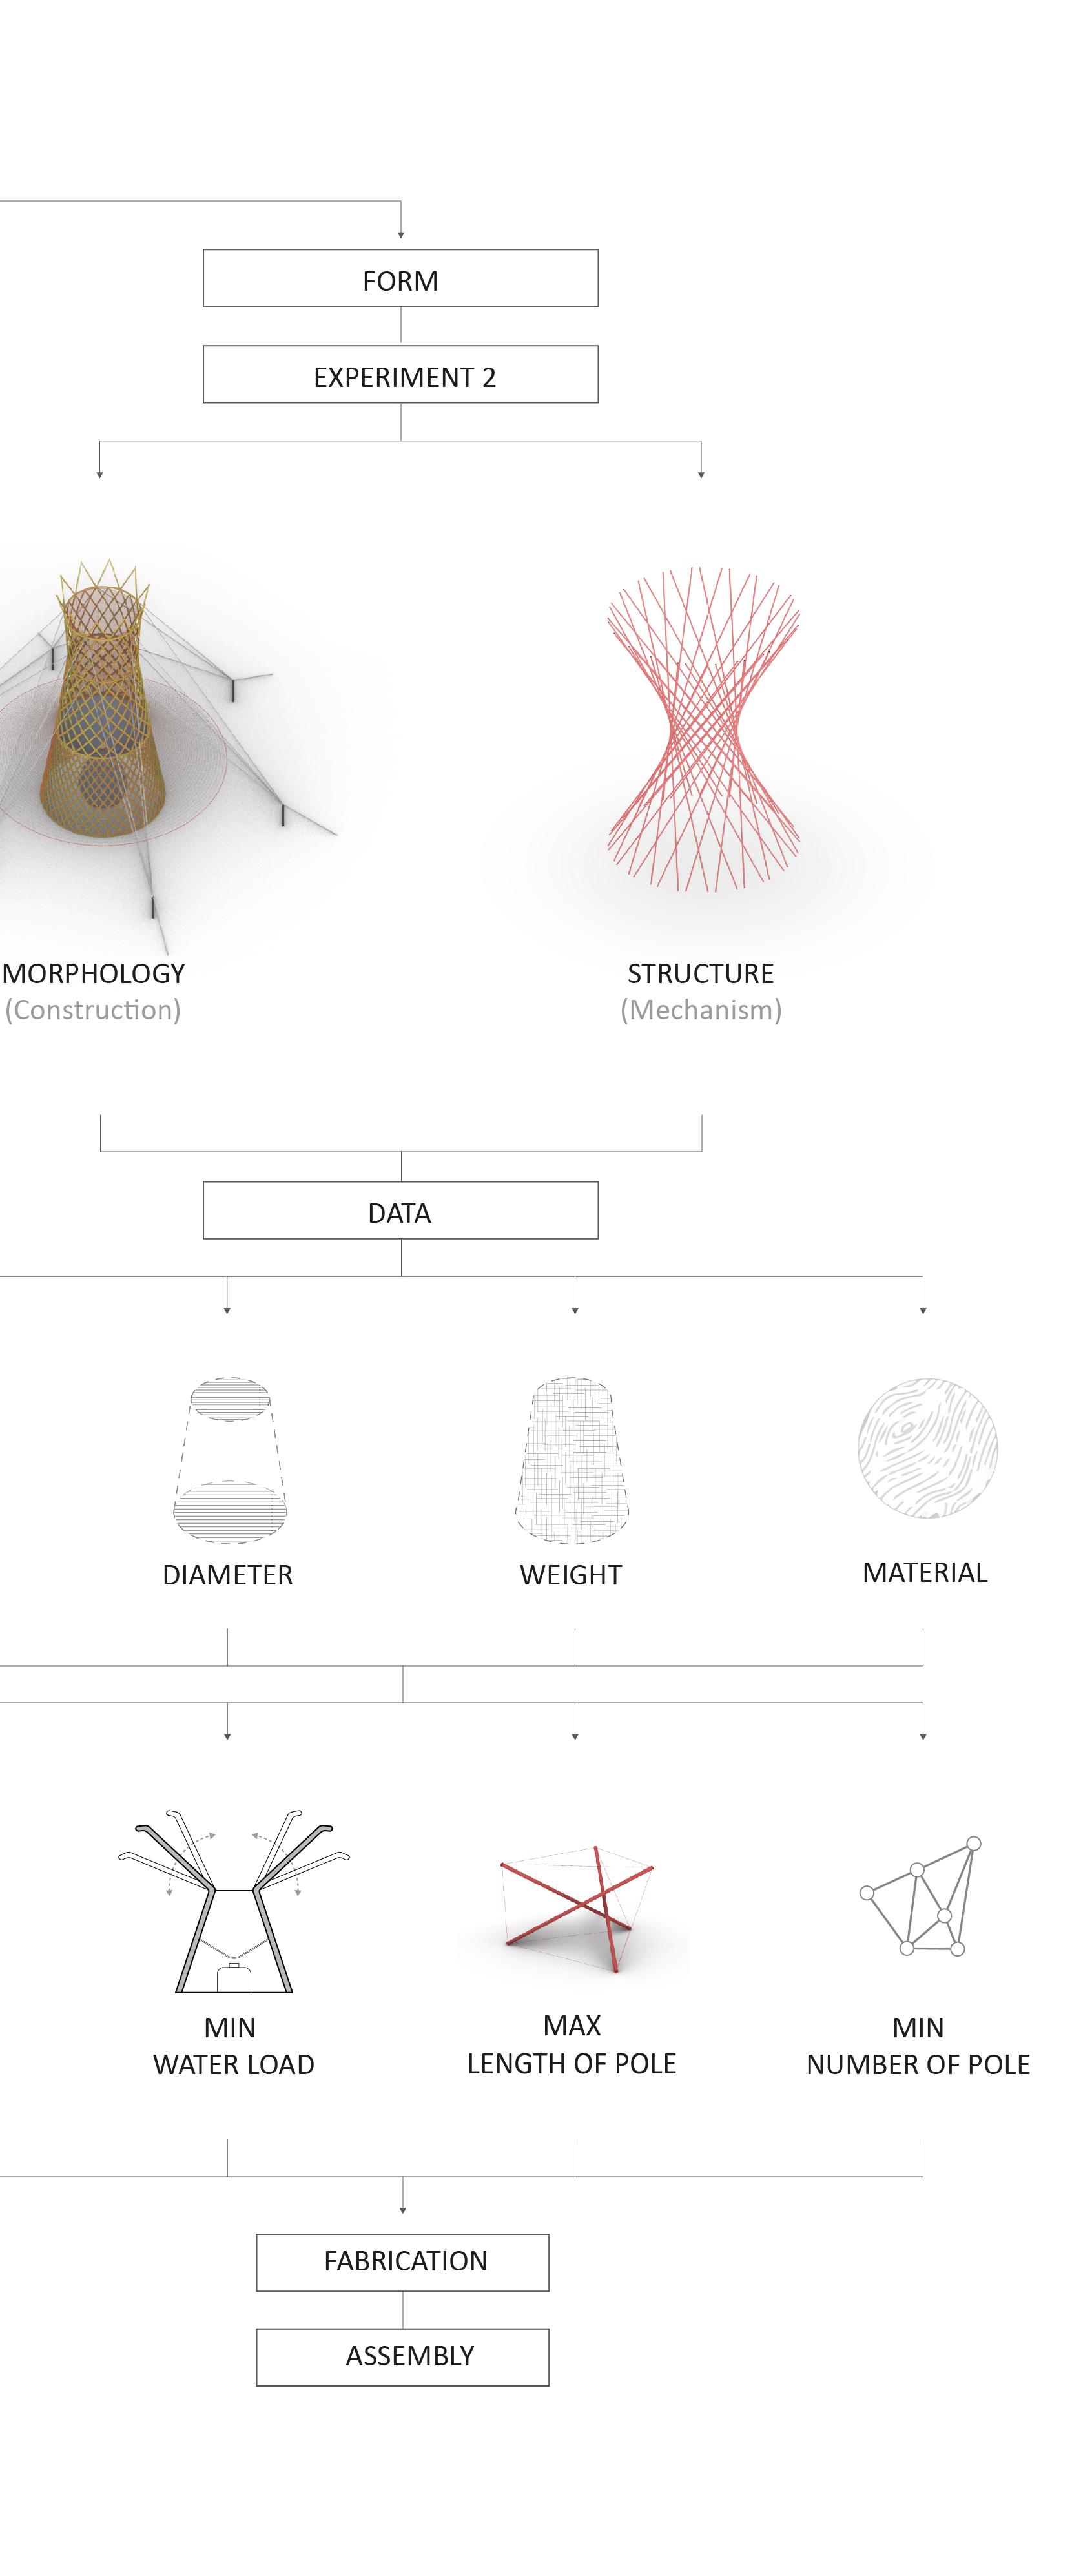
WATER HARVESTING TOWER
02 - 5.2.1
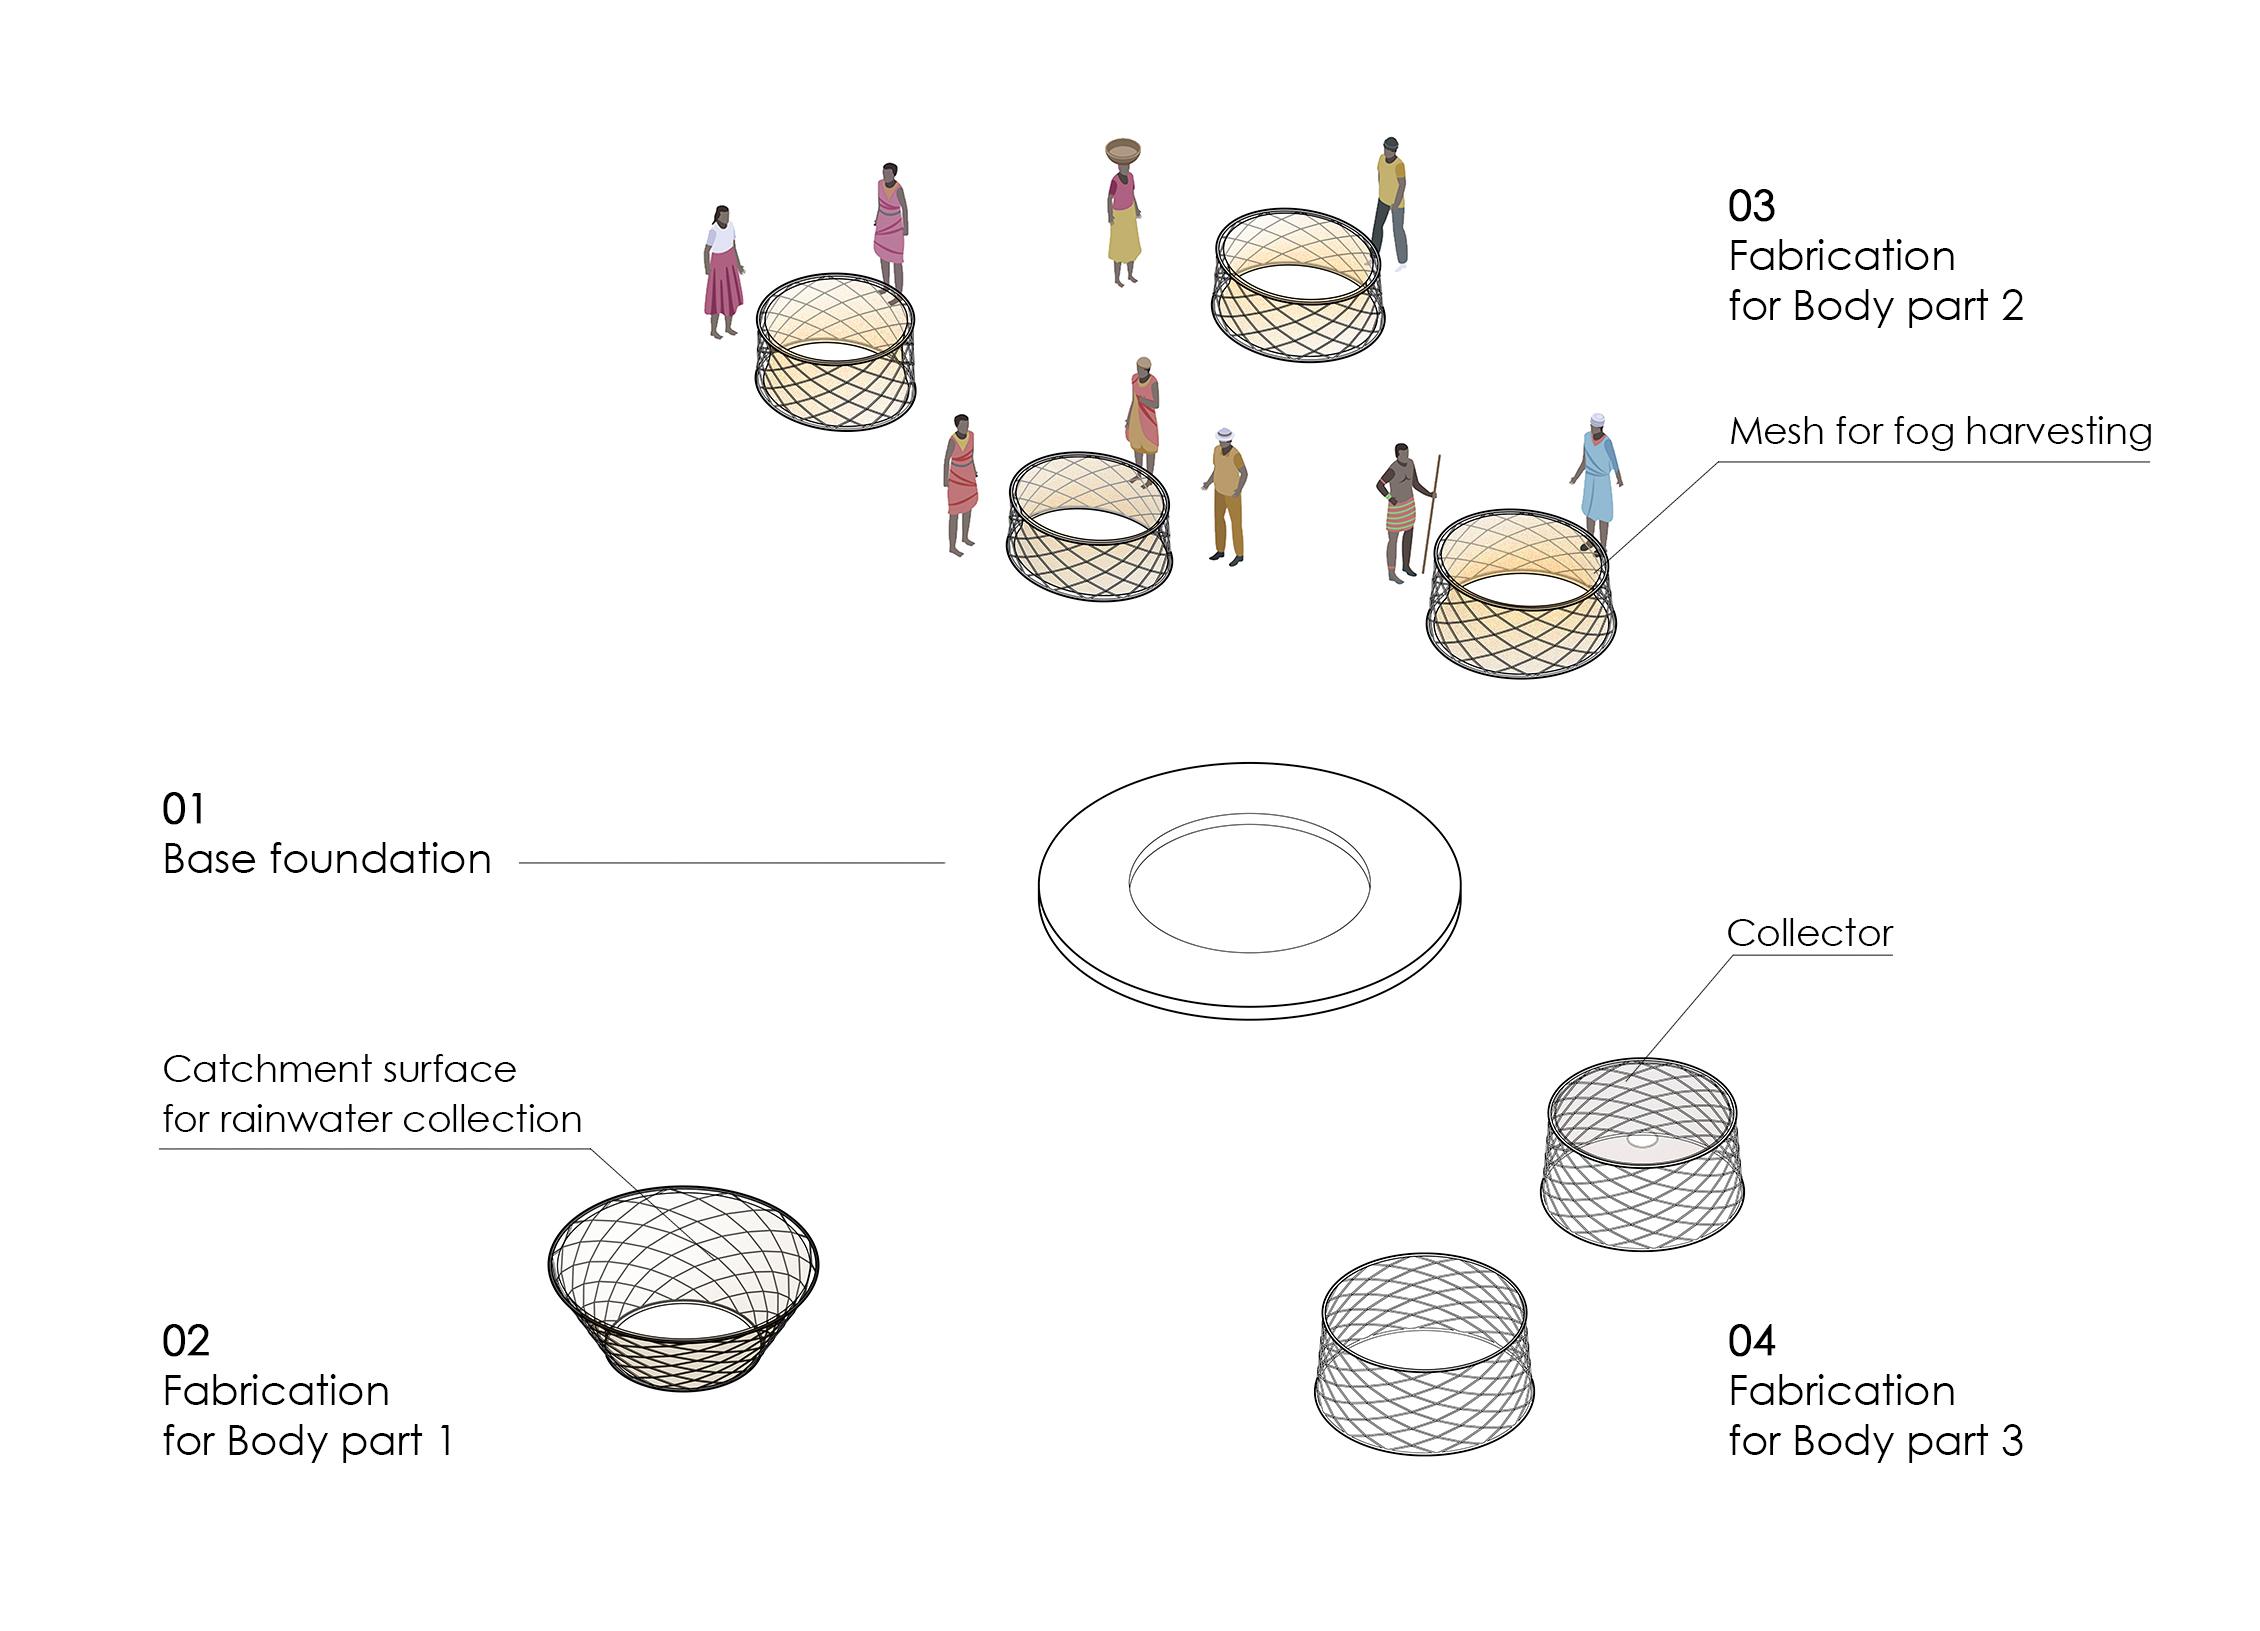
Three main water resources are to be harvested and managed: surface water from seasonal rivers and nearby wells, rainwater, and atmospheric water. Fog and dew would be harvested from the atmosphere using different strategies incorporating traditional and modern techniques. All the water is to be stored after harvesting, and then distributed according to the needs of both human consumption and livestock-crop survival.
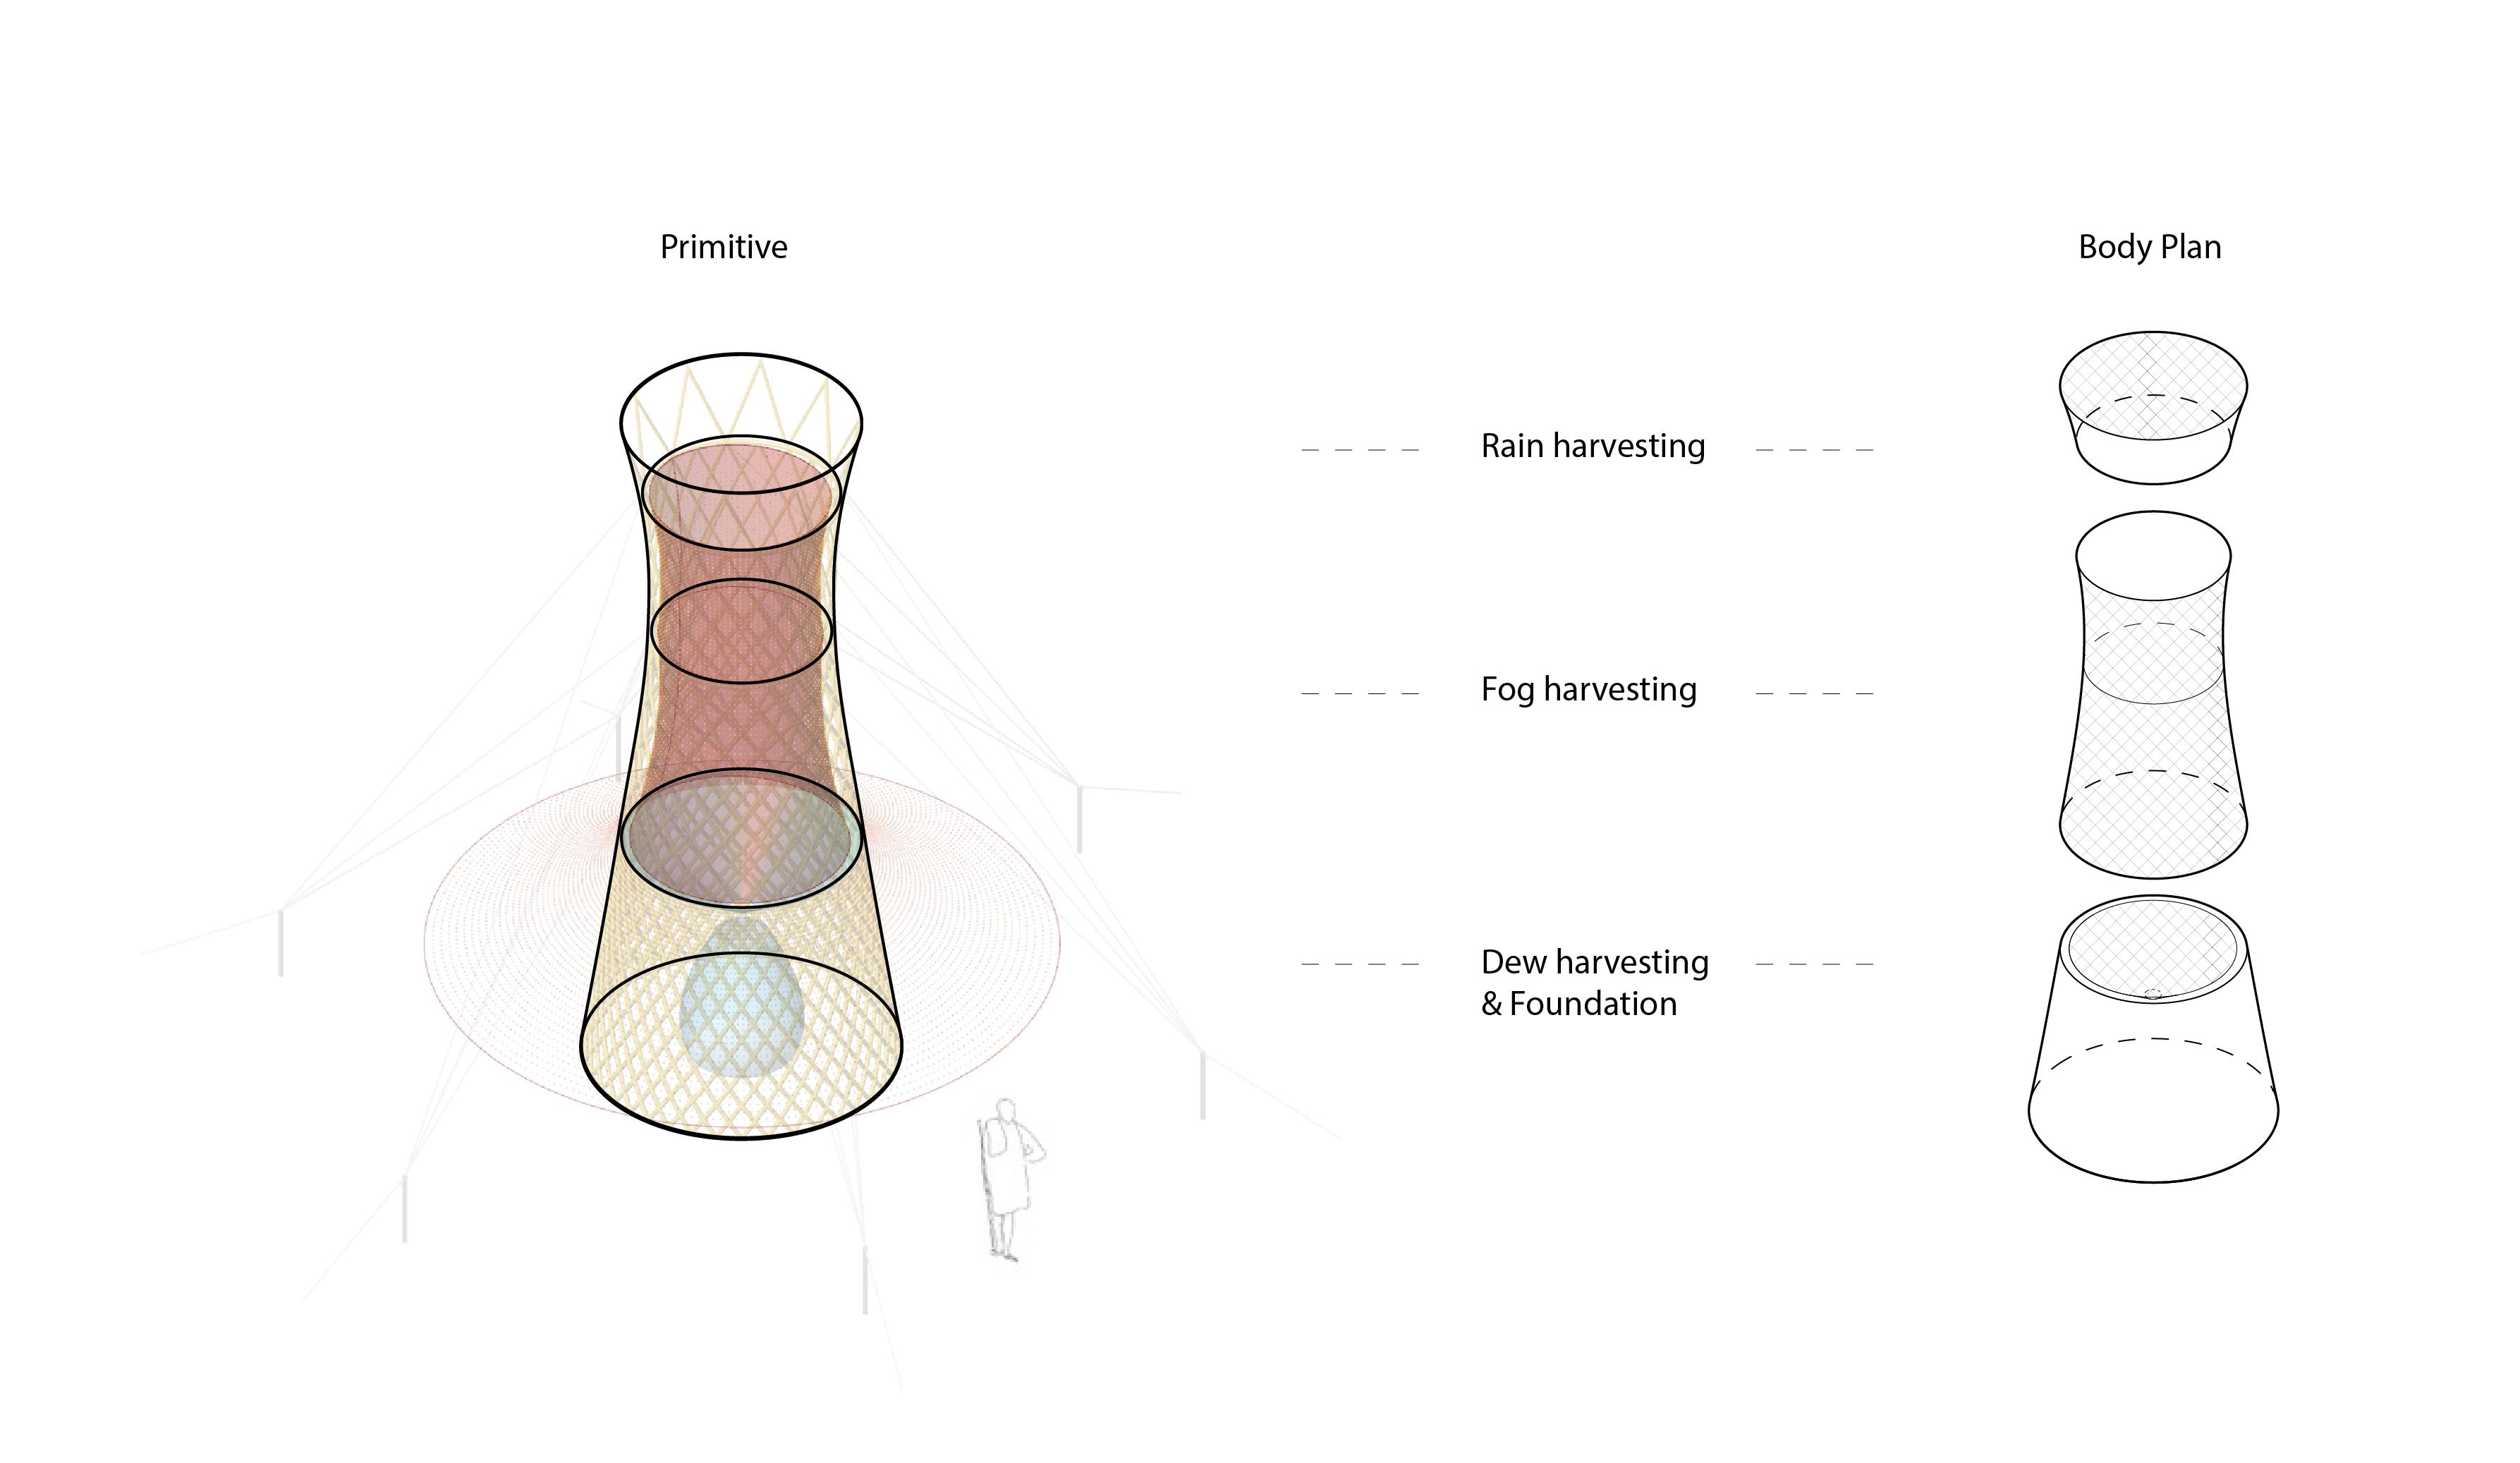
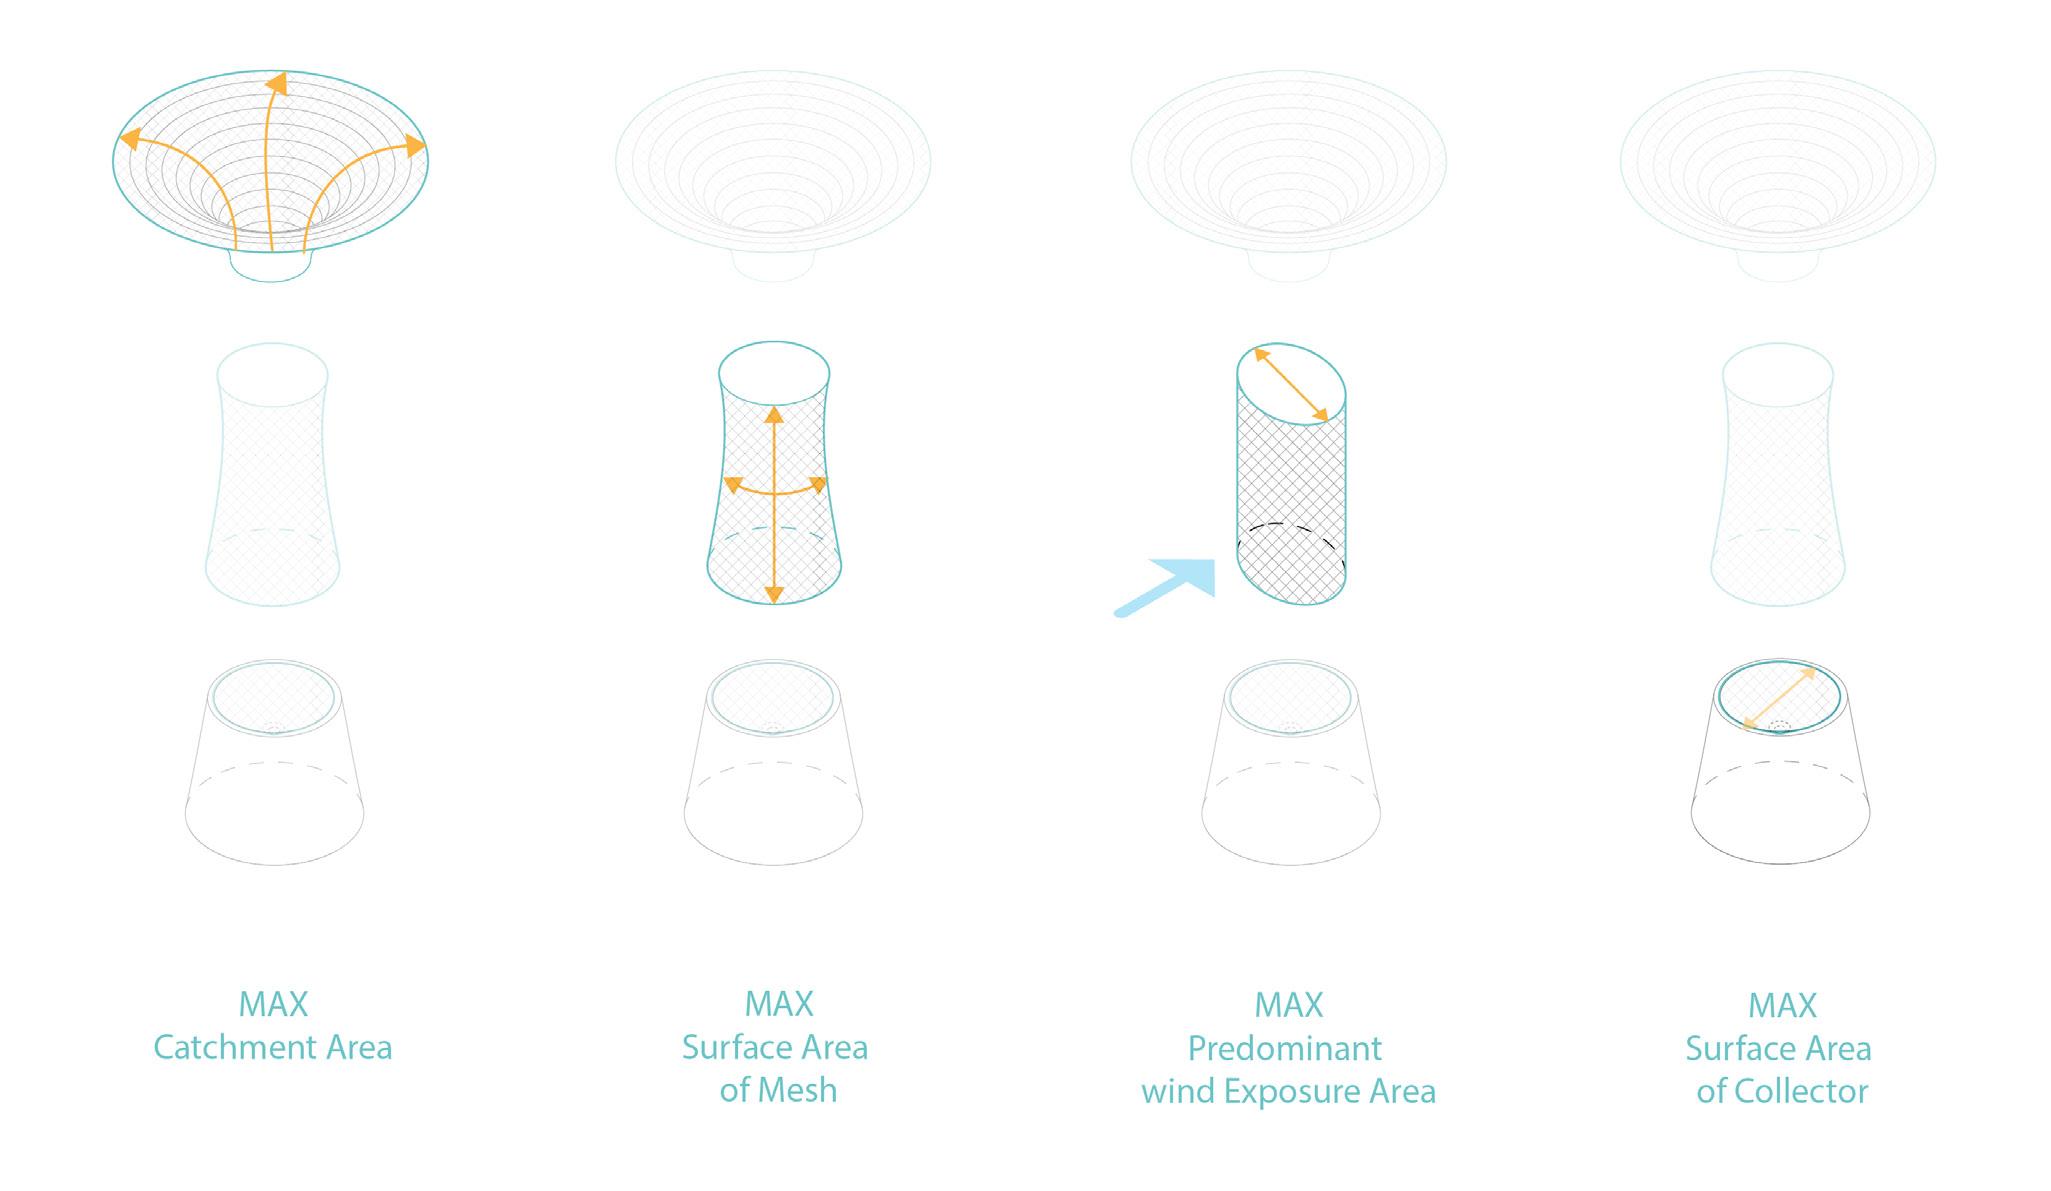
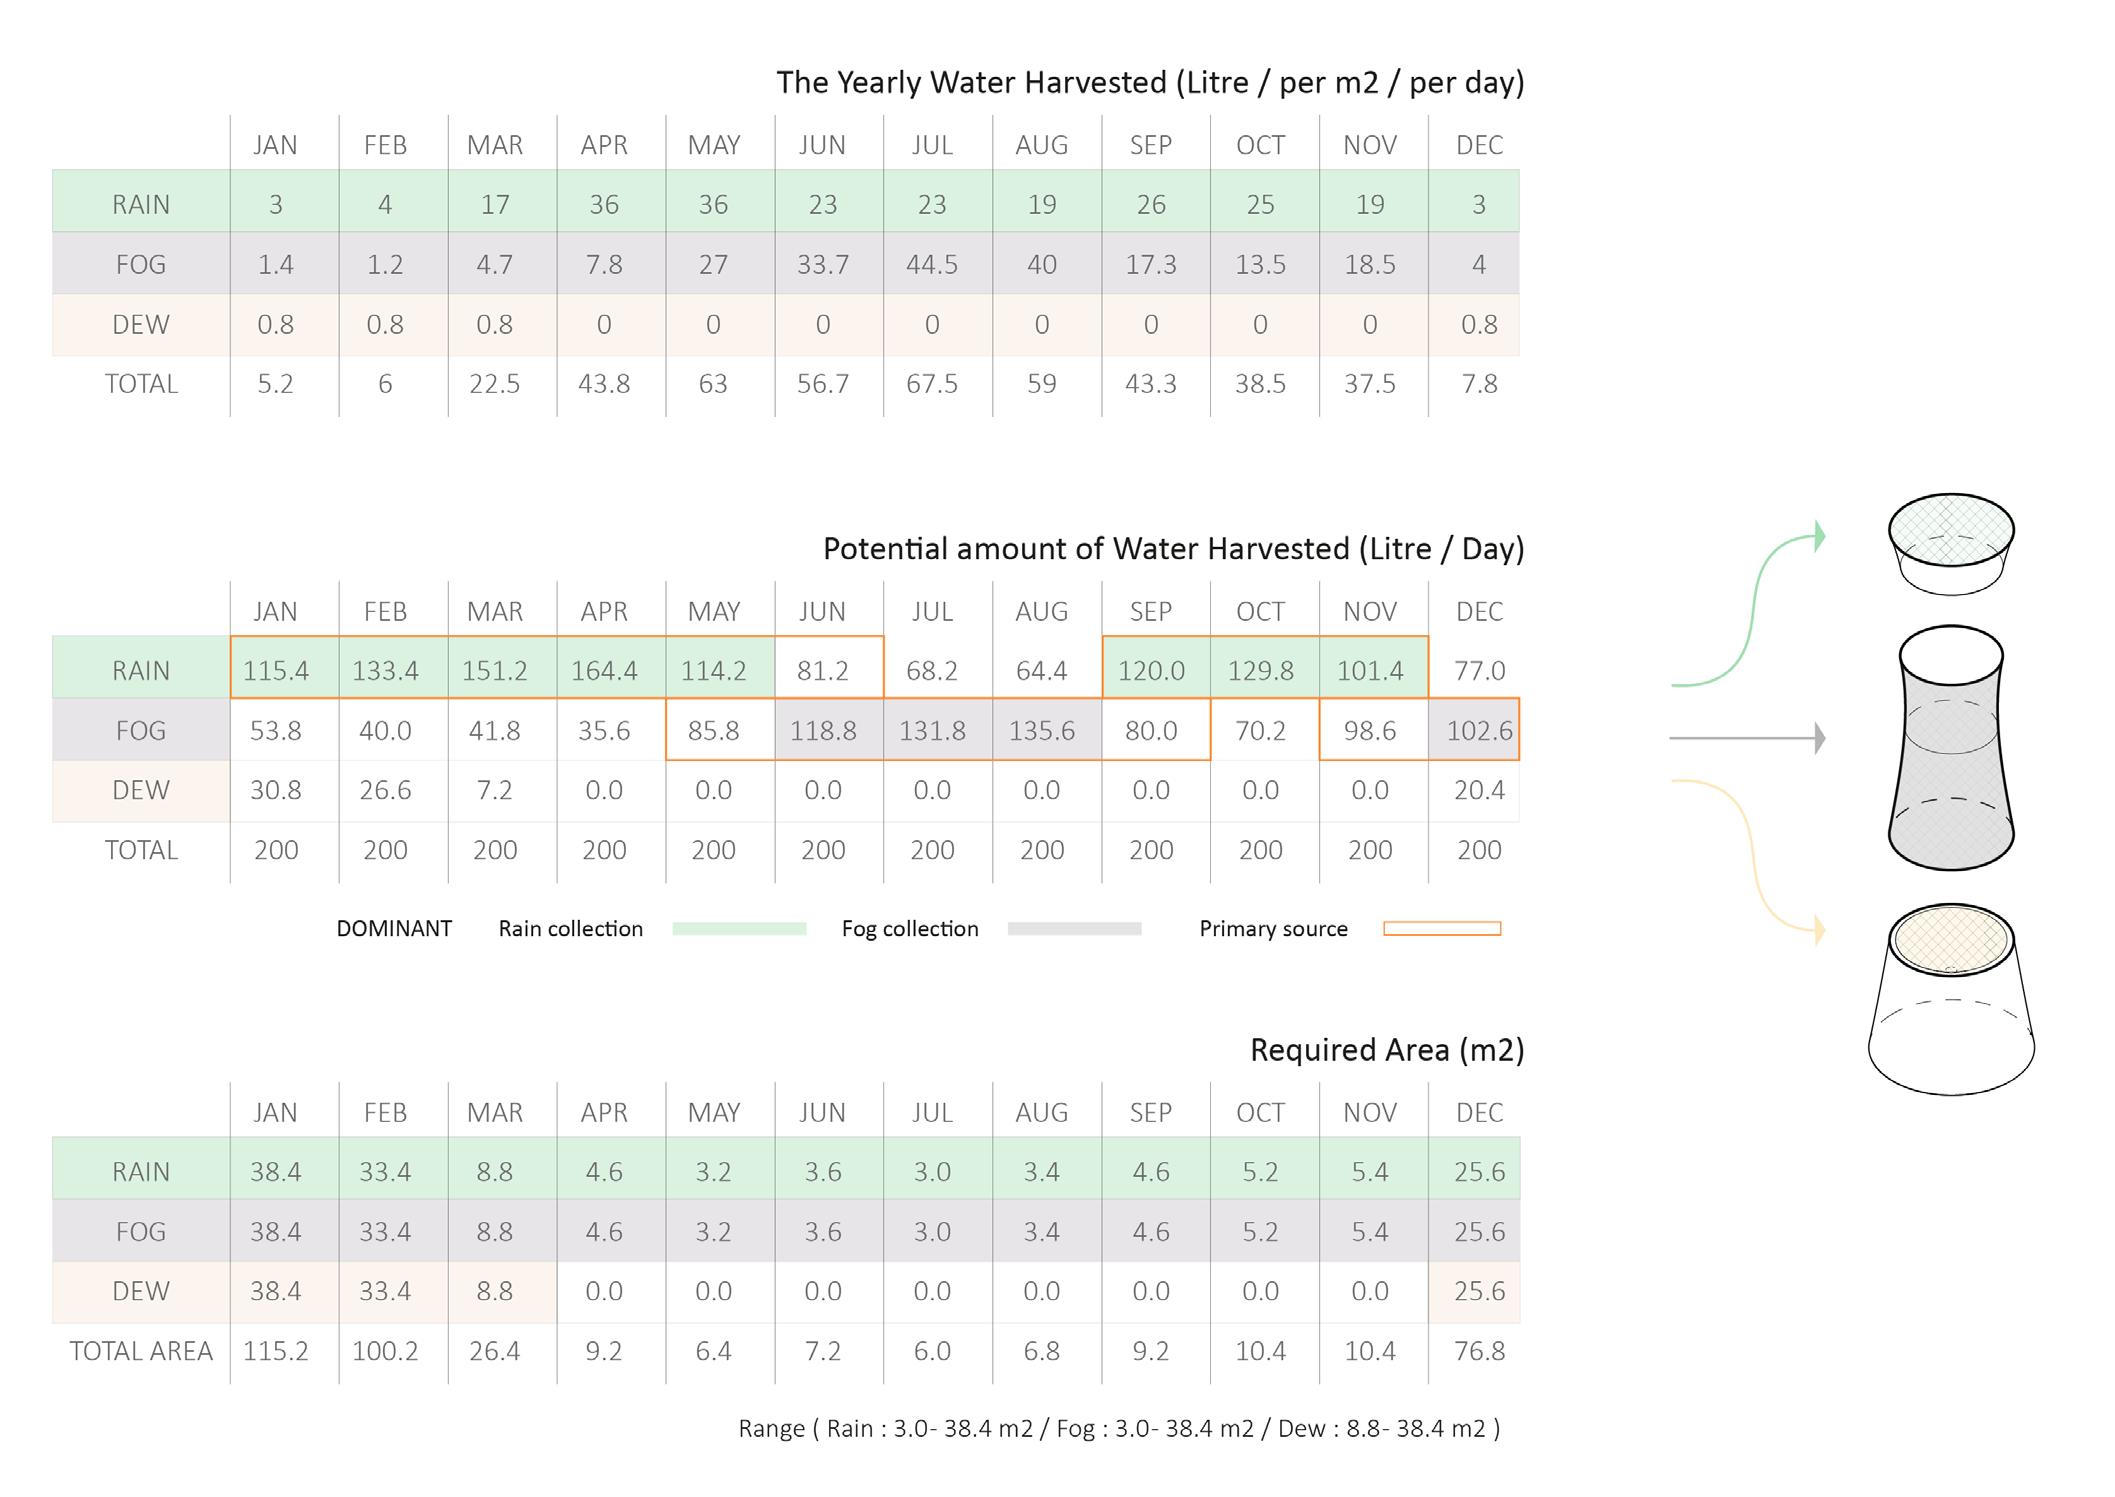
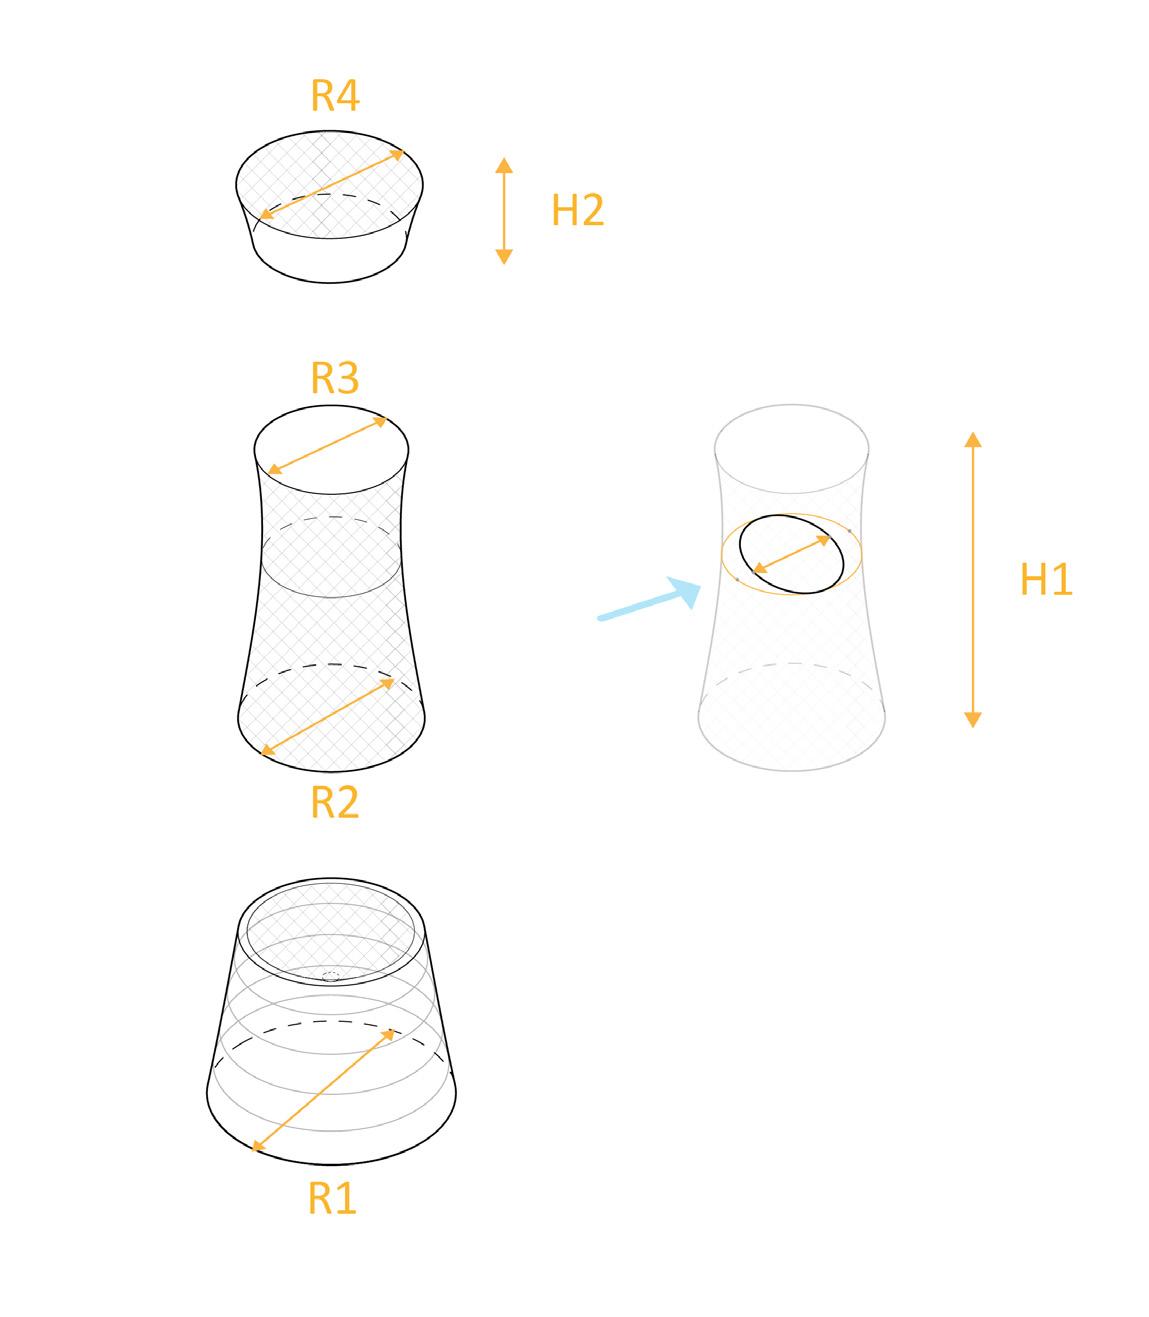
Our water harvesting device will be designed to harvest rain, fog and dew depending on the season, and weather conditions in the site. The amount of potential harvested water is shown in the diagram to the right, and below are the detailed methods of calculating each type.
Based on the historical weather data of Kebri-Beyah provided by Meteoblue , the average monthly precipitation values were extracted to calculate the potential amount of rain that could be harvested per one m2 along the year.
In order to anticipate the amount of possible fog water harvested by a mesh structure per m2, a methodology was followed which scientists developed to assess the feasibility of implementing fog collectors as a mean to harvest water in a specific site before installation.
The relative humidity required for water harvesting from air would be equal to or larger than 69% according to this group of Iranian researchers who developed the following formula to calculate potential harvested Fogwater:
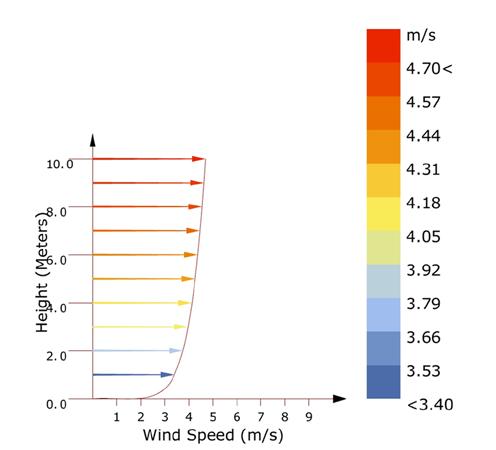
Where WH3 is the potential water harvested over 3 hours (L/m2), Eeq is the device efficiency which is around 10–30% depending on the device type and the climatic conditions of the region, U2 is the wind velocity(m/s) at around 2m height and Finally Mt is the absolute humidity (gm_3).
For our calculations, the device efficiency used was 20%, and hourly historical climate data were obtained through Meteblue history+
Rainwater Harvesting
Fog Harvesting
Radiative Cooling
To conclude, from March to November, focus would be on rain and fog due to high humidity and precipitation values while dew would be mainly harvested from December to February. Dew Harvesting
Dew harvesting by radiative cooling is mostly done when the view of the sky is as full as possible; This mainly occurs from December to February- the dry season- in which the average cloud coverage is less than 15% . Calculations were based on the maximum expected yield of 0.8 L/m2 at night explained by (Jarimi et al)
ROOF WATER
COLLECTION
02 - 5.2.2
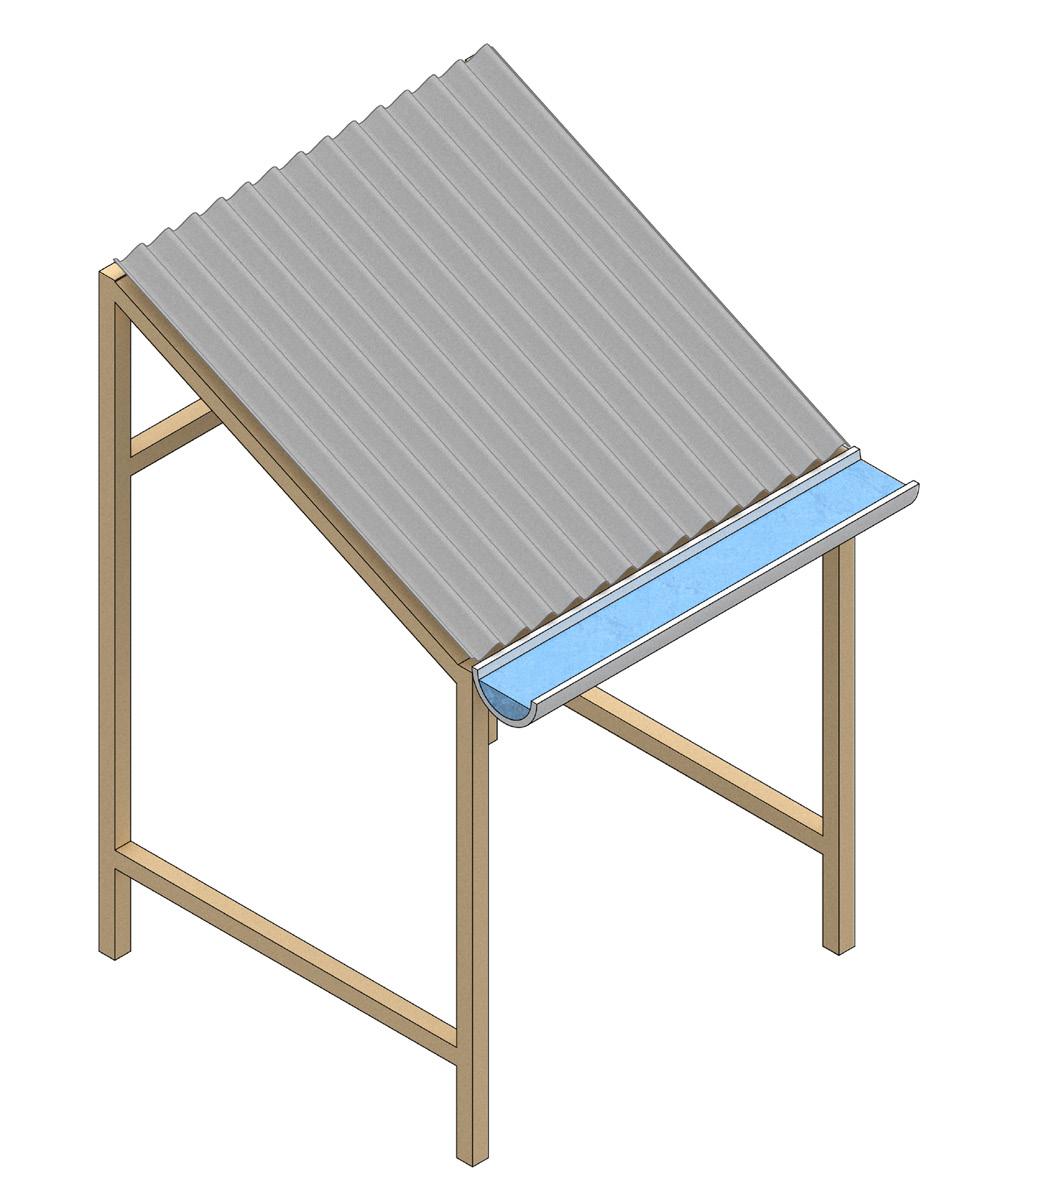
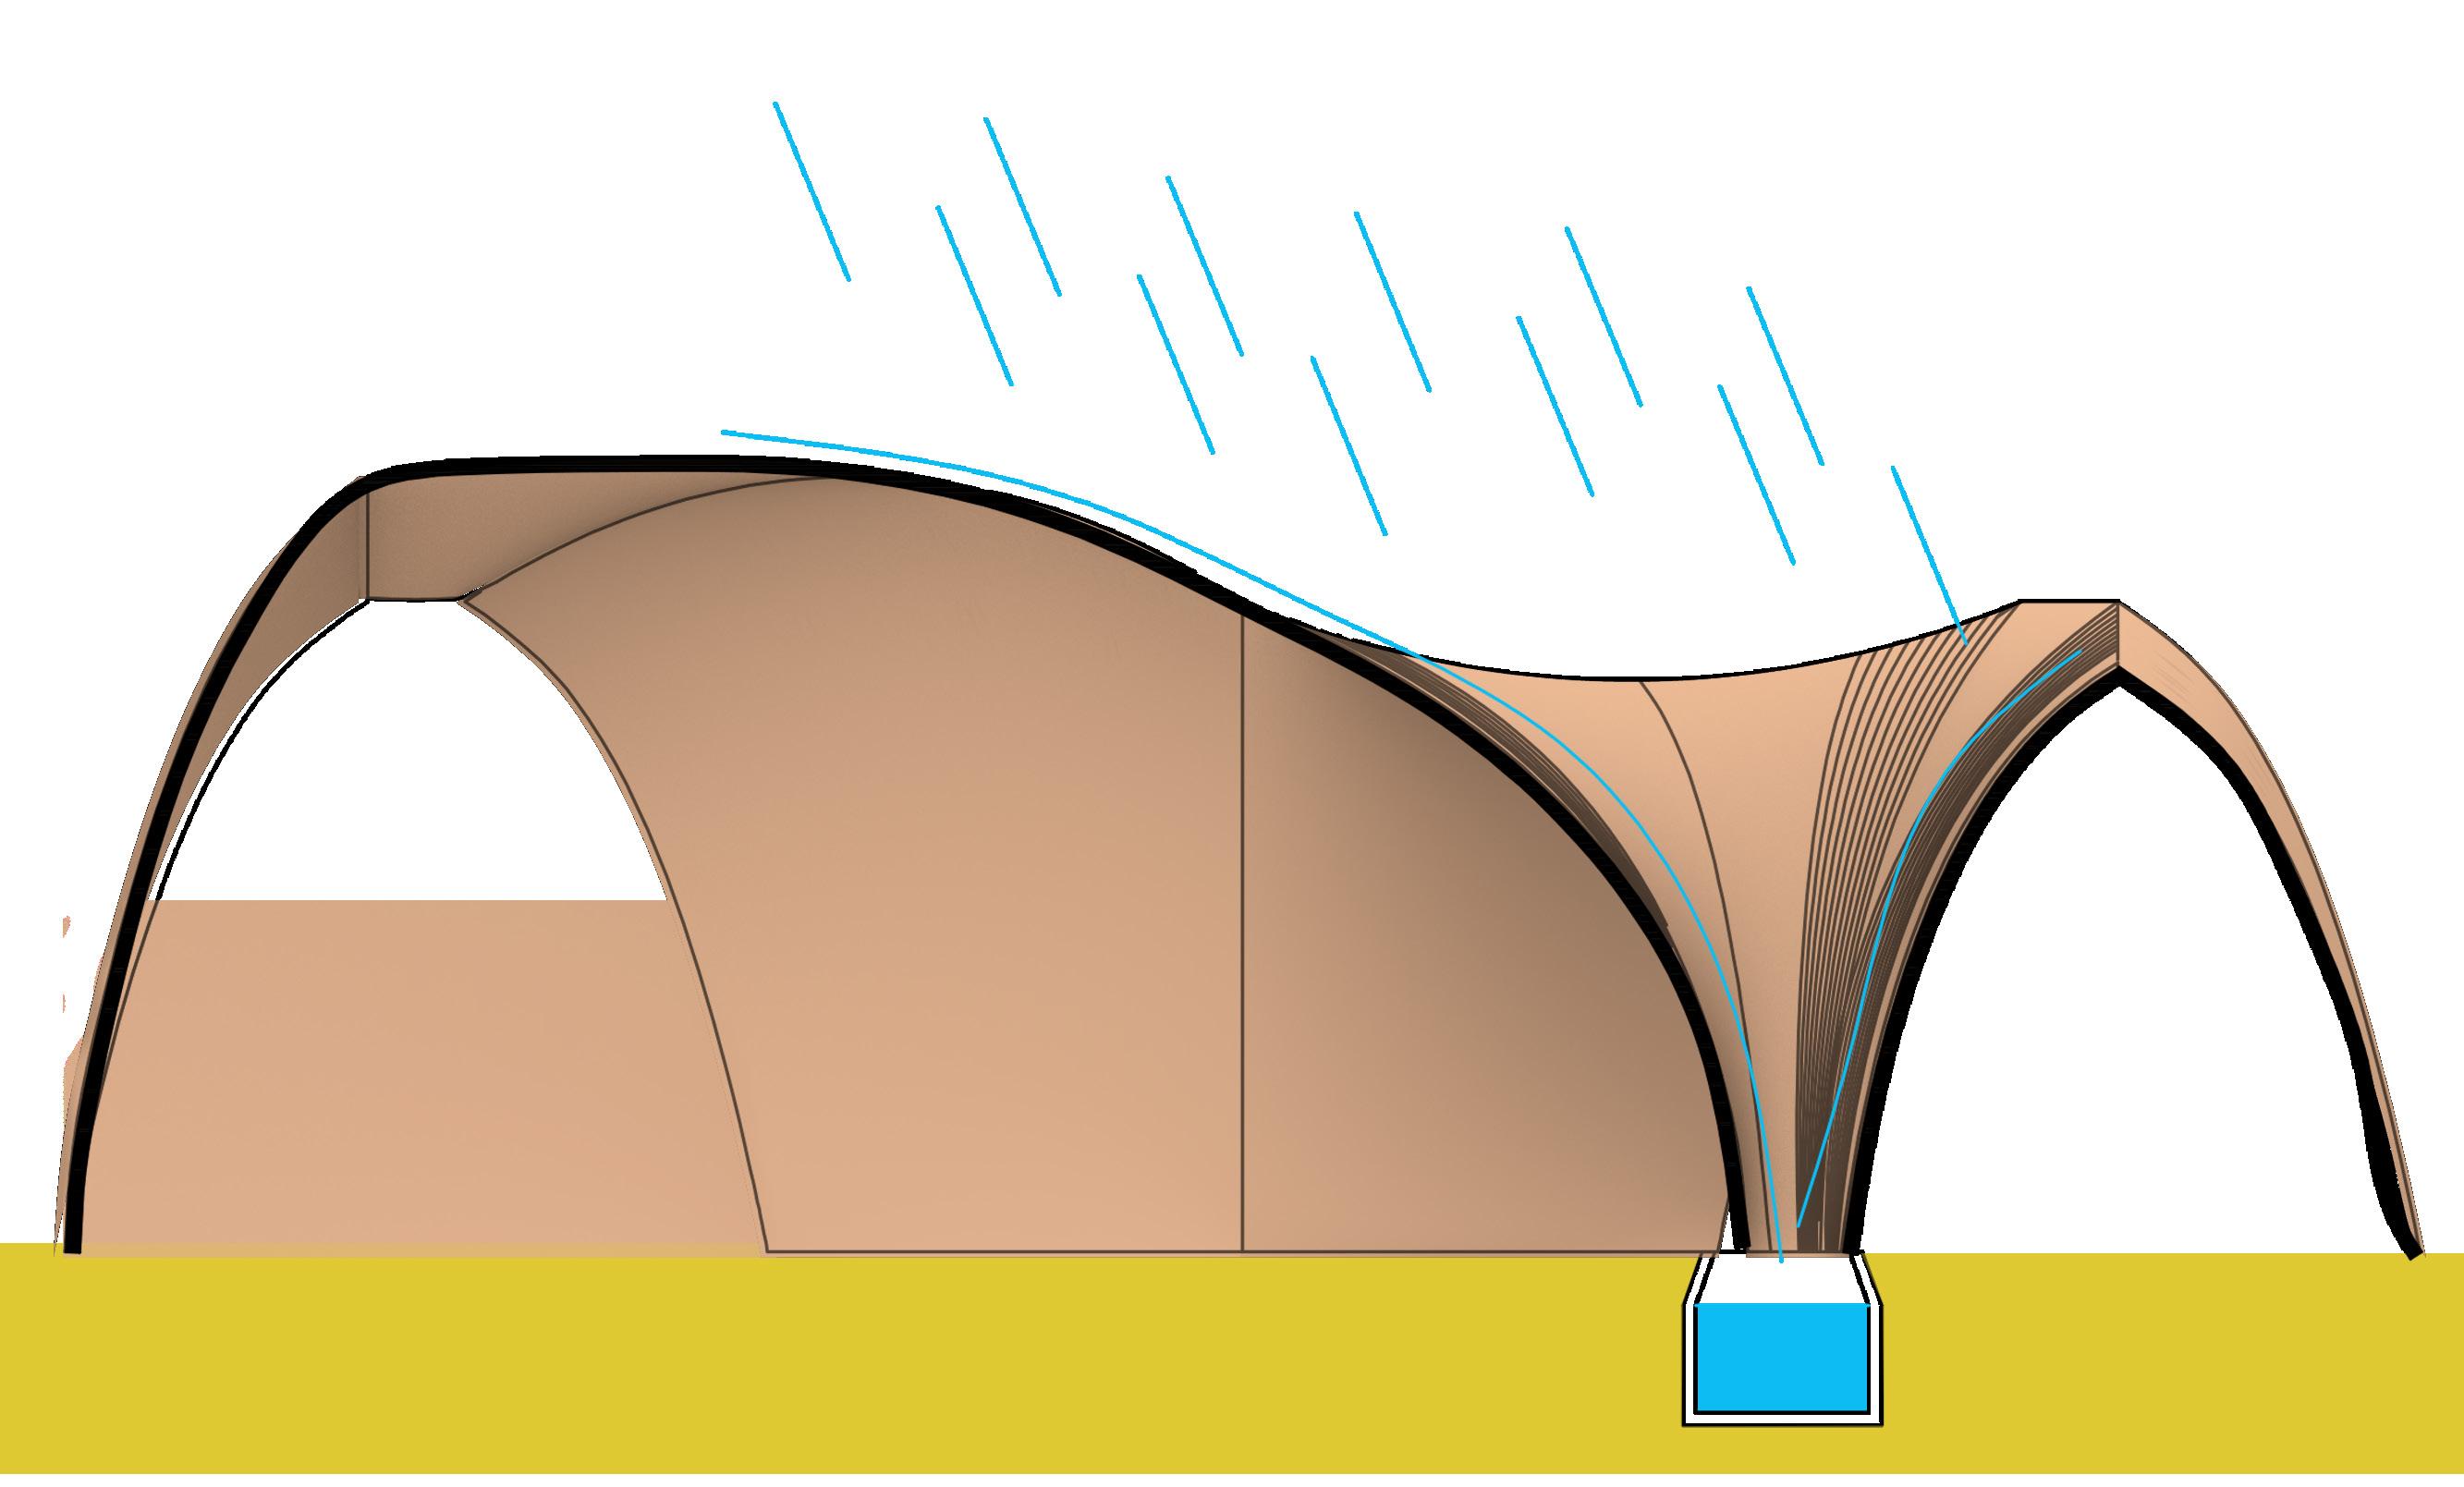
Rain water harvesting is currently practiced in the Somali region of Ethiopia through the use of water collection ponds known as Birkas. Since these are at a ground level, the risk of water pollution via surface run-off is very high. For this reason, and to increase the potential rain water already being collected by the water towers, our strategy proposes catching water from the housing roofs into underground water storage tanks. This would relate the amount of water collected with the size of the household, since the roof area exposed to rain would be bigger as the house expands to accommodate more people.
The idea is to use a mechanism to divert the first flush under a rain event, since it may pollute the storage tank by carrying matter deposited on the roof during dry days, such as dust and bird faeces. However, since the collection surface is elevated, the risk of water pollution with animal waste would be considerably lower than the one currently happening in water harvesting ponds.
DRY TOILETS
02 - 5.2.3
The definition of a waste management approach for arid contexts, should help reduce water use to the minimum and avoid the pollution of aquifers. The chosen strategy for our site, since groundwater is deep and covered by a hard rock layer, is to use a Fossa Alterna dry pit system. It consists of the creation of two 1,5 metres deep pits where cover material is introduced after defecation. These pits are used sequentially, once the first pit is full, it starts degrading and the second pit starts filling. By the time the second pit is full, the first one should have gone through a 1-2 years degradation process and will therefore contain a dry earth like mixture that can be safely removed and used as a natural fertilizer (Ferreira, 2019)30. This considerably reduces the use of water for sanitation purposes and generates a valuable resource for land fertilization.
CONSTRUCTION CYCLE STRATEGY
02 - 5.3
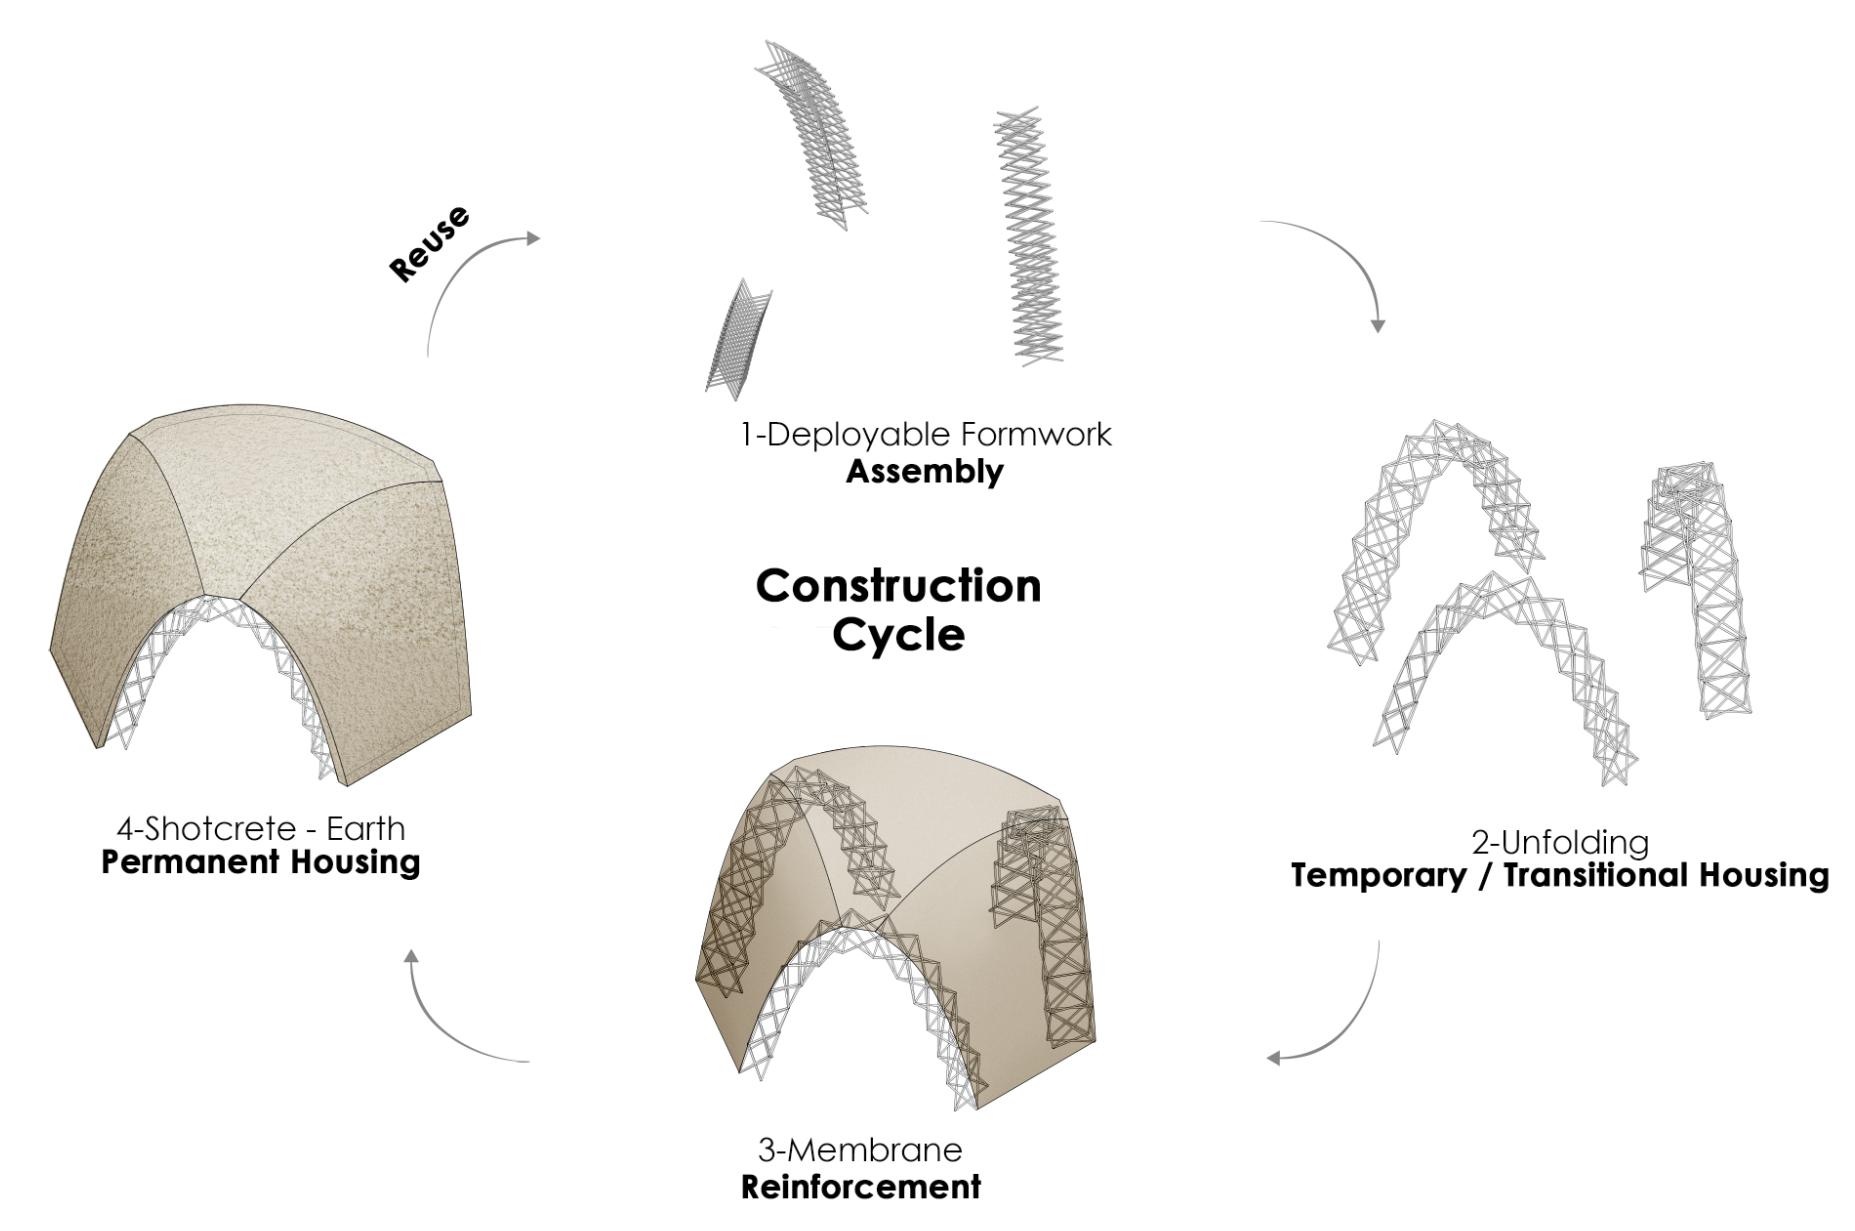
The use of the proposed deployable system allows a flexibility we think is necessary for this project. By adding a membrane layer, these structures can act as emergency shelters for the newly displaced persons, nomads, and seasonal pastoralists. They can also be further updated by permanent settlers by shotcreting earth layers over the fabric formwork creating selfstanding structures.
If temporary settlers choose to leave the camp after a short period of time (months’ time), the structure can be folded and stored to be either reused as it is or rehabilitated adapting to different functions and housing sizes.
Permanent structures on the other hand can…………….. if the settlers returned to their homes in years’ time.
02 - 5.1
DESIGN REQUIREMENTS
Abstracting data of area and number of housing units & towers required.
Based on the domain studies, data of design requirements are abstracted for the housing units, water harvesting towers, livestock and agriculture. This data, would inform the design strategy and the design simulations to be conducted. The requirements are categorised into two; architectural and settlement scales. 1 x = 4-6 people 600 kg/house per year = 30-60 sqm
ARCHITECTURAL SCALE
02 - 5.1.1
At an architectural scale, each housing unit will range between 30 – 60 sqm in floor area of habitable space for an occupancy of 4 - 6 people respectively.
Based on our hypothesis, the design proposal aims to provide land for agriculture and livestock husbandry to every housing unit in order to help rehabilitate its occupants, who are the stakeholders of the settlement.
Studies indicate that an average person in the arid regions of Africa utilises upto 100 kilos of Sorghum per annum.Therefore, each unit would require upto 500sqm of land to cultive upto 600 kilos of Sorghum and Teff, which is primary crop used for consumption.
Additionally, the proposal also provides land of upto 500 sqm for livestock husbandry that can cater to nearly 40 animals per housing unit.
Therefore, each housing unit will require an area of 1000 sqm to 1060 sqm to house upto 6 occupants and support their agricultural and livestock requirements.
Settlement Population
Requirement Breakup =12000 people x 2000 units x 500 towers
Total Requirement
Number of Housing Units
Number of Towers
Pastoral Nomads = IDPs = Refugees = 1 Tower for every 4 Housing units + +
300 units
500 units
1200 units
Total Area of housing = 2.10 - 2.80 sqkm
SETTLEMENT SCALE
02 - 5.1.2
At a settlement scale the design proposal of the settlement aims to cater to the needs of upto 12000 people.
Therefore the settlement will require land for upto 2000 housing units. Wherein, 1200 housing units will be provided for the refugees and upto approximately 500 housing units for the IDPs. The design proposal will also provide land for upto 300 housing units for the pastoral nomads.
Therefore, the settlement design will require a total area between 2.10 sqkm to 2.80 sqkm of land to facilitate the housing requirements of upto 12000 people.
Source : UNHCR Handbook for Emergencies
02 - 5.2
SETTLEMENT HIERARCHY
Hierarchy of scale for settlement planning
From our preliminary studies in the domain chapter, we first abstracted design requirements which needed to be addressed for a population of 12,000. With this information the overall settlement is divided into various scales based on population, density and distribution Finally, abstracting the area required for water catchment ponds, agricultural land required for fodder cultivation and housing for the each settlement block.
2- 5.2.1
1 Family 1 group 4 to 6
1
Modular Planning for Refugee Camps
The UNHCR handbook for Emergencies outlines modular planning guidelines for refugee camps. This suggests the breakup for the camp from the smallest module of the family to the overall camp module as indicated in table 1.1.With this information, the hierarchy of elements which make the proposed settlement can be divided into 4 scales, i.e., family, cluster, block, and sector.
Hierarchy of Scales Composition
Table 2-5.2.2 Proposed Adaptation for Settlement Planning
2- 5.2.2
to
Proposed Adaptation for Settlement Planning
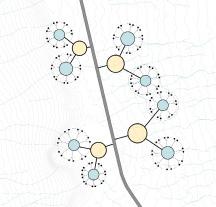
Each family would comprise of 4-6 people occupying one housing unit. A group of 16-20 housing units make a settlement cluster. An aggregation of 16 such clusters would make a settlement block and 4 such blocks would make a settlement sector.
Two such settlement sectors make the settlement module which can accommodate a population of more than 12,000 people.
Table
Table
Proposed Settlement Block Sizes
With the different scales of the settlement and the design requirements having been established, the areas required for each block are abstracted as indicated in table 1- 5.2.3.
Each settlement block would require between 0.36 sqkm to 0.48 sqkm of land to accommodate a population of up to 1900 people and facilitate land required for fodder cultivation, water irrigation and housing.
Table
02 - 5.3
DESIGN STRATEGY
Architectural and Settlement design strategies.
Based on the design requirements and the settlement hierarchy, the design strategy for the arrangement of settlement block is articulated, which can be categorised into two; Architectural scale and Settlement Scale.
Housing Unit ( 4 - 6 people )
Shaded Community Space
Communal Water Point
Housing Unit
Water Collection
Grey water collection & Recycling
Architectural Scale
02 - 5.3.1
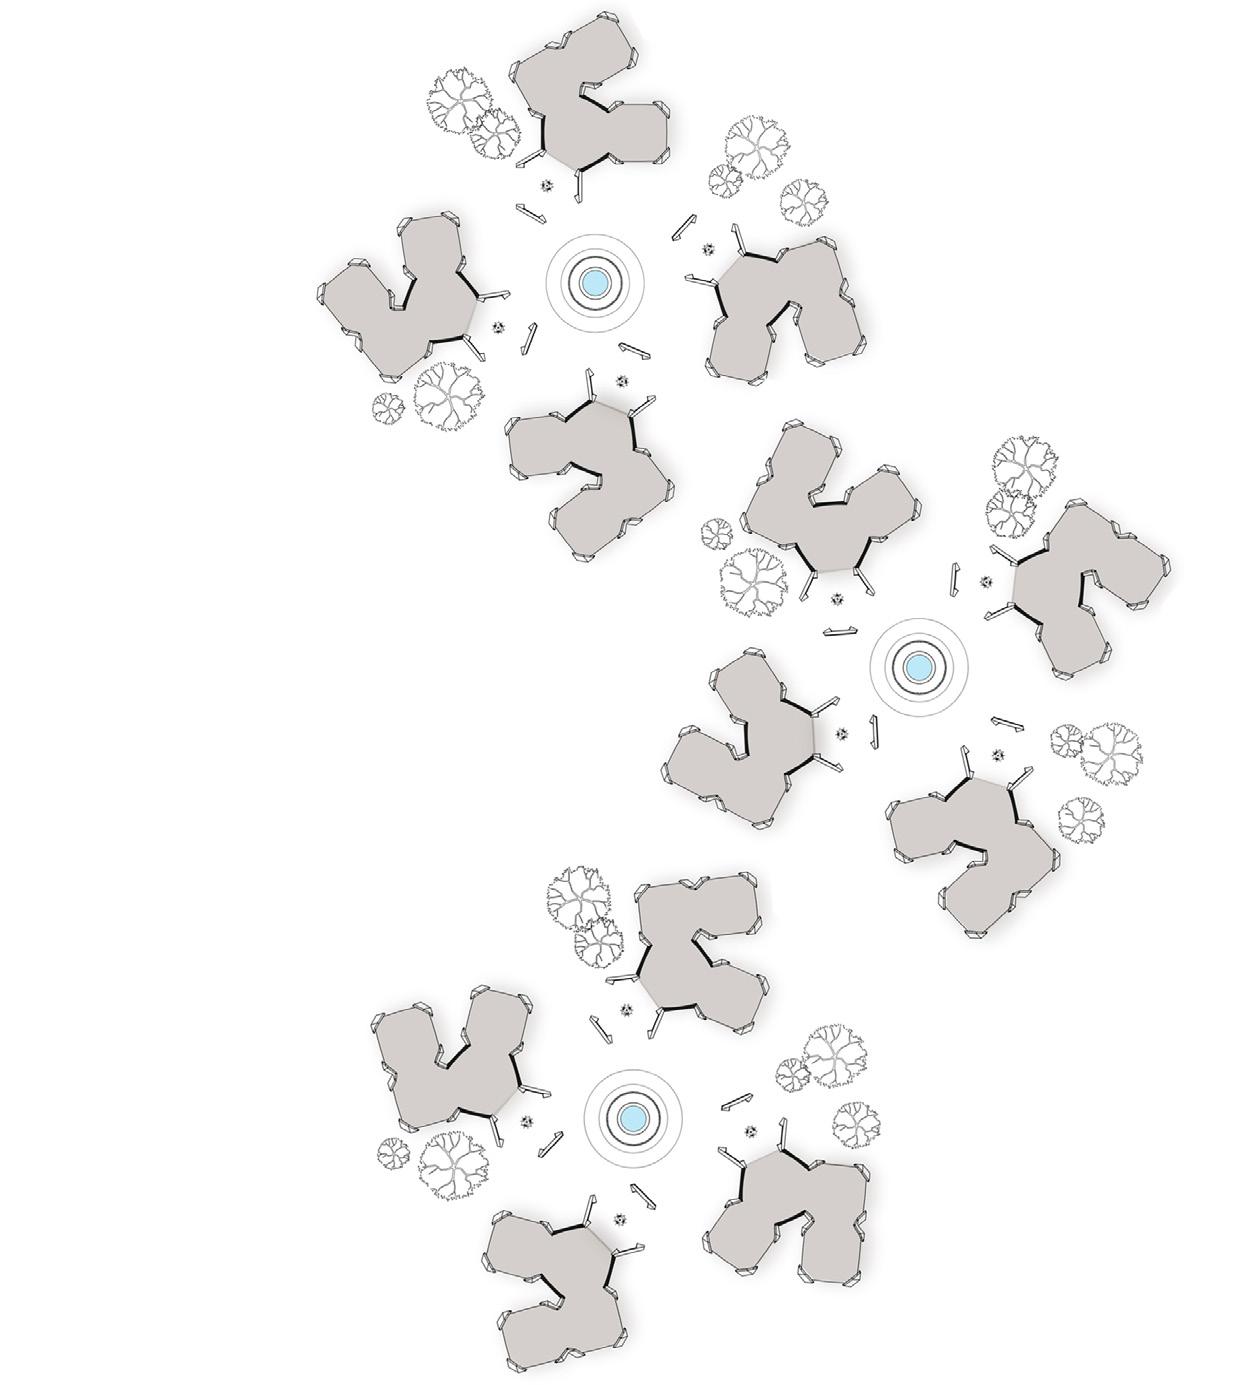
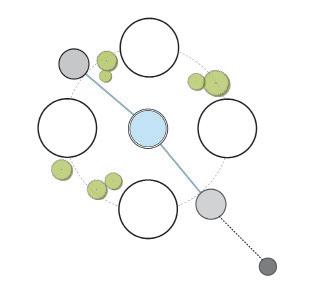
The architectural scale focuses on the design and development of a housing sub - cluster within a settlement cluster. The proposal for every subcluster primarily consists of housing units and water harvesting towers.
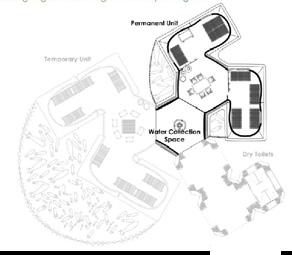
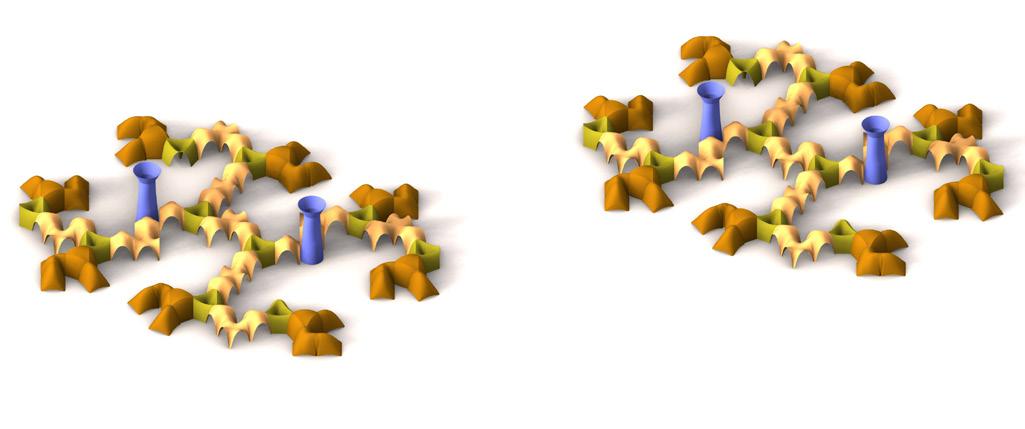
The design of the every housing unit will comprise of a habitable space to accommodate upto 6 people and a water collection point, that can harvest rainwater runoff from the roof . Four such housing units with shared bathrooms will be developed around a water harvesting tower, which would establish a communal space to be utilised by related/ unrelated families living in every sub-cluster. By establishing a shared communal space around the water harvesting tower, the aim is to provide the occupants with a sense of ownership and responsibility towards the tower.
Each sub-cluster would have a grey water collection and recycling set up, collecting waste water from the shared bathrooms, which would be recycled and used
Land
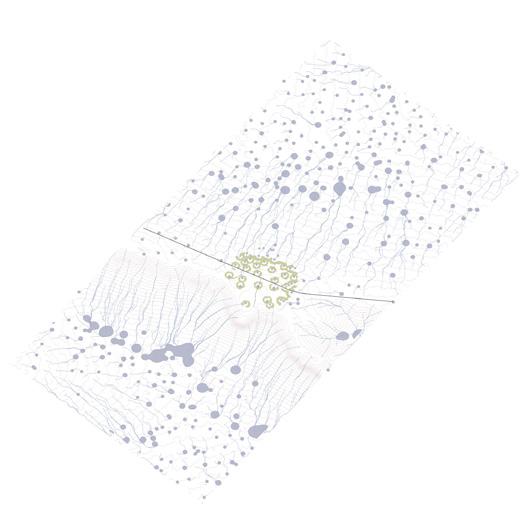
Settlement Scale The settlement scale looks at the planning and distribution of a settlement block comprising of 16 settlement clusters based on the data inferred from the terrain analysis and settlement distribution experiments.
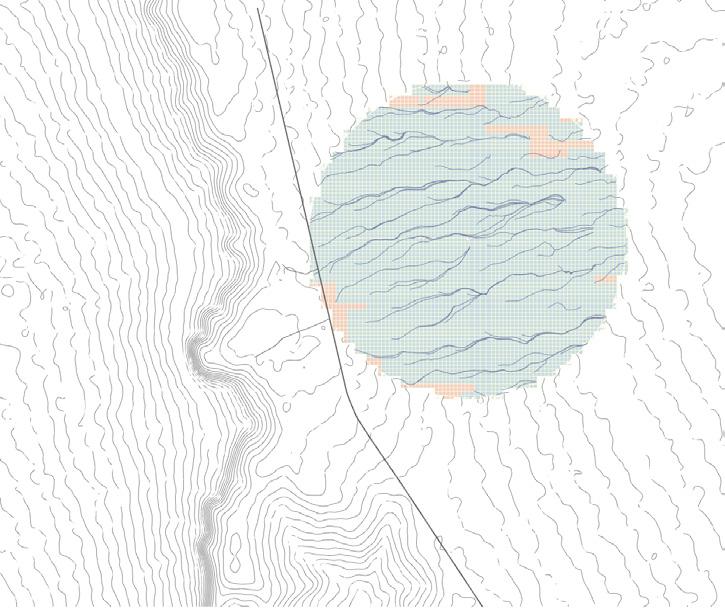
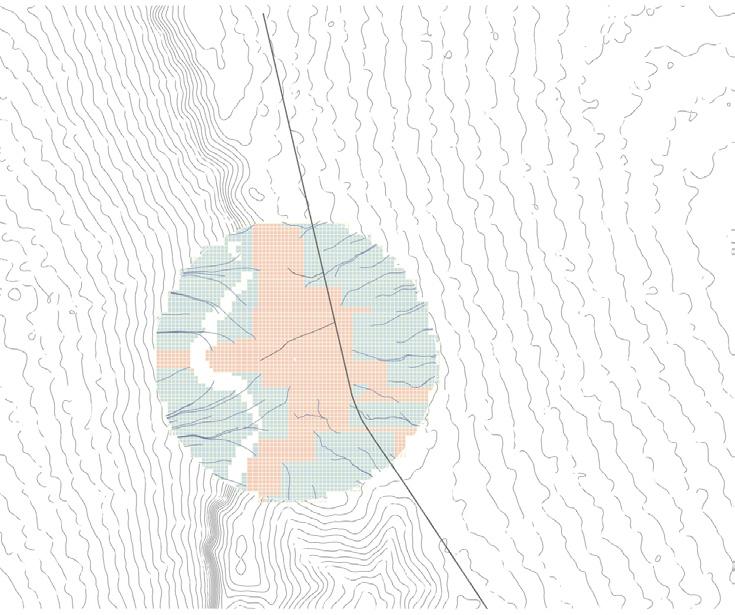
The strategy of the settlement block proposes a water catchment pond for each block, which would emerge along the natural water drainage that will facilitate the water requirement for the cultivation of fodder. The agricultural land required for fodder cultivation would be located around the catchment pond along with the sub-cluster distributions.
The recycled grey water from the sub-cluster will be integrated into the agricultural patterns,such that the water would drain through the agricultural fields before leading into the water catchment ponds dedicated for the purpose of irrigation.
Schematic diagram of a sub-cluster
02 - 5.3.2
Communal Water Point
Grey water collection & Recycling
Water storage for Irrigation
surrounding the water pond used for fodder cultivatioon
The use of multiple digital tools to aid in the process
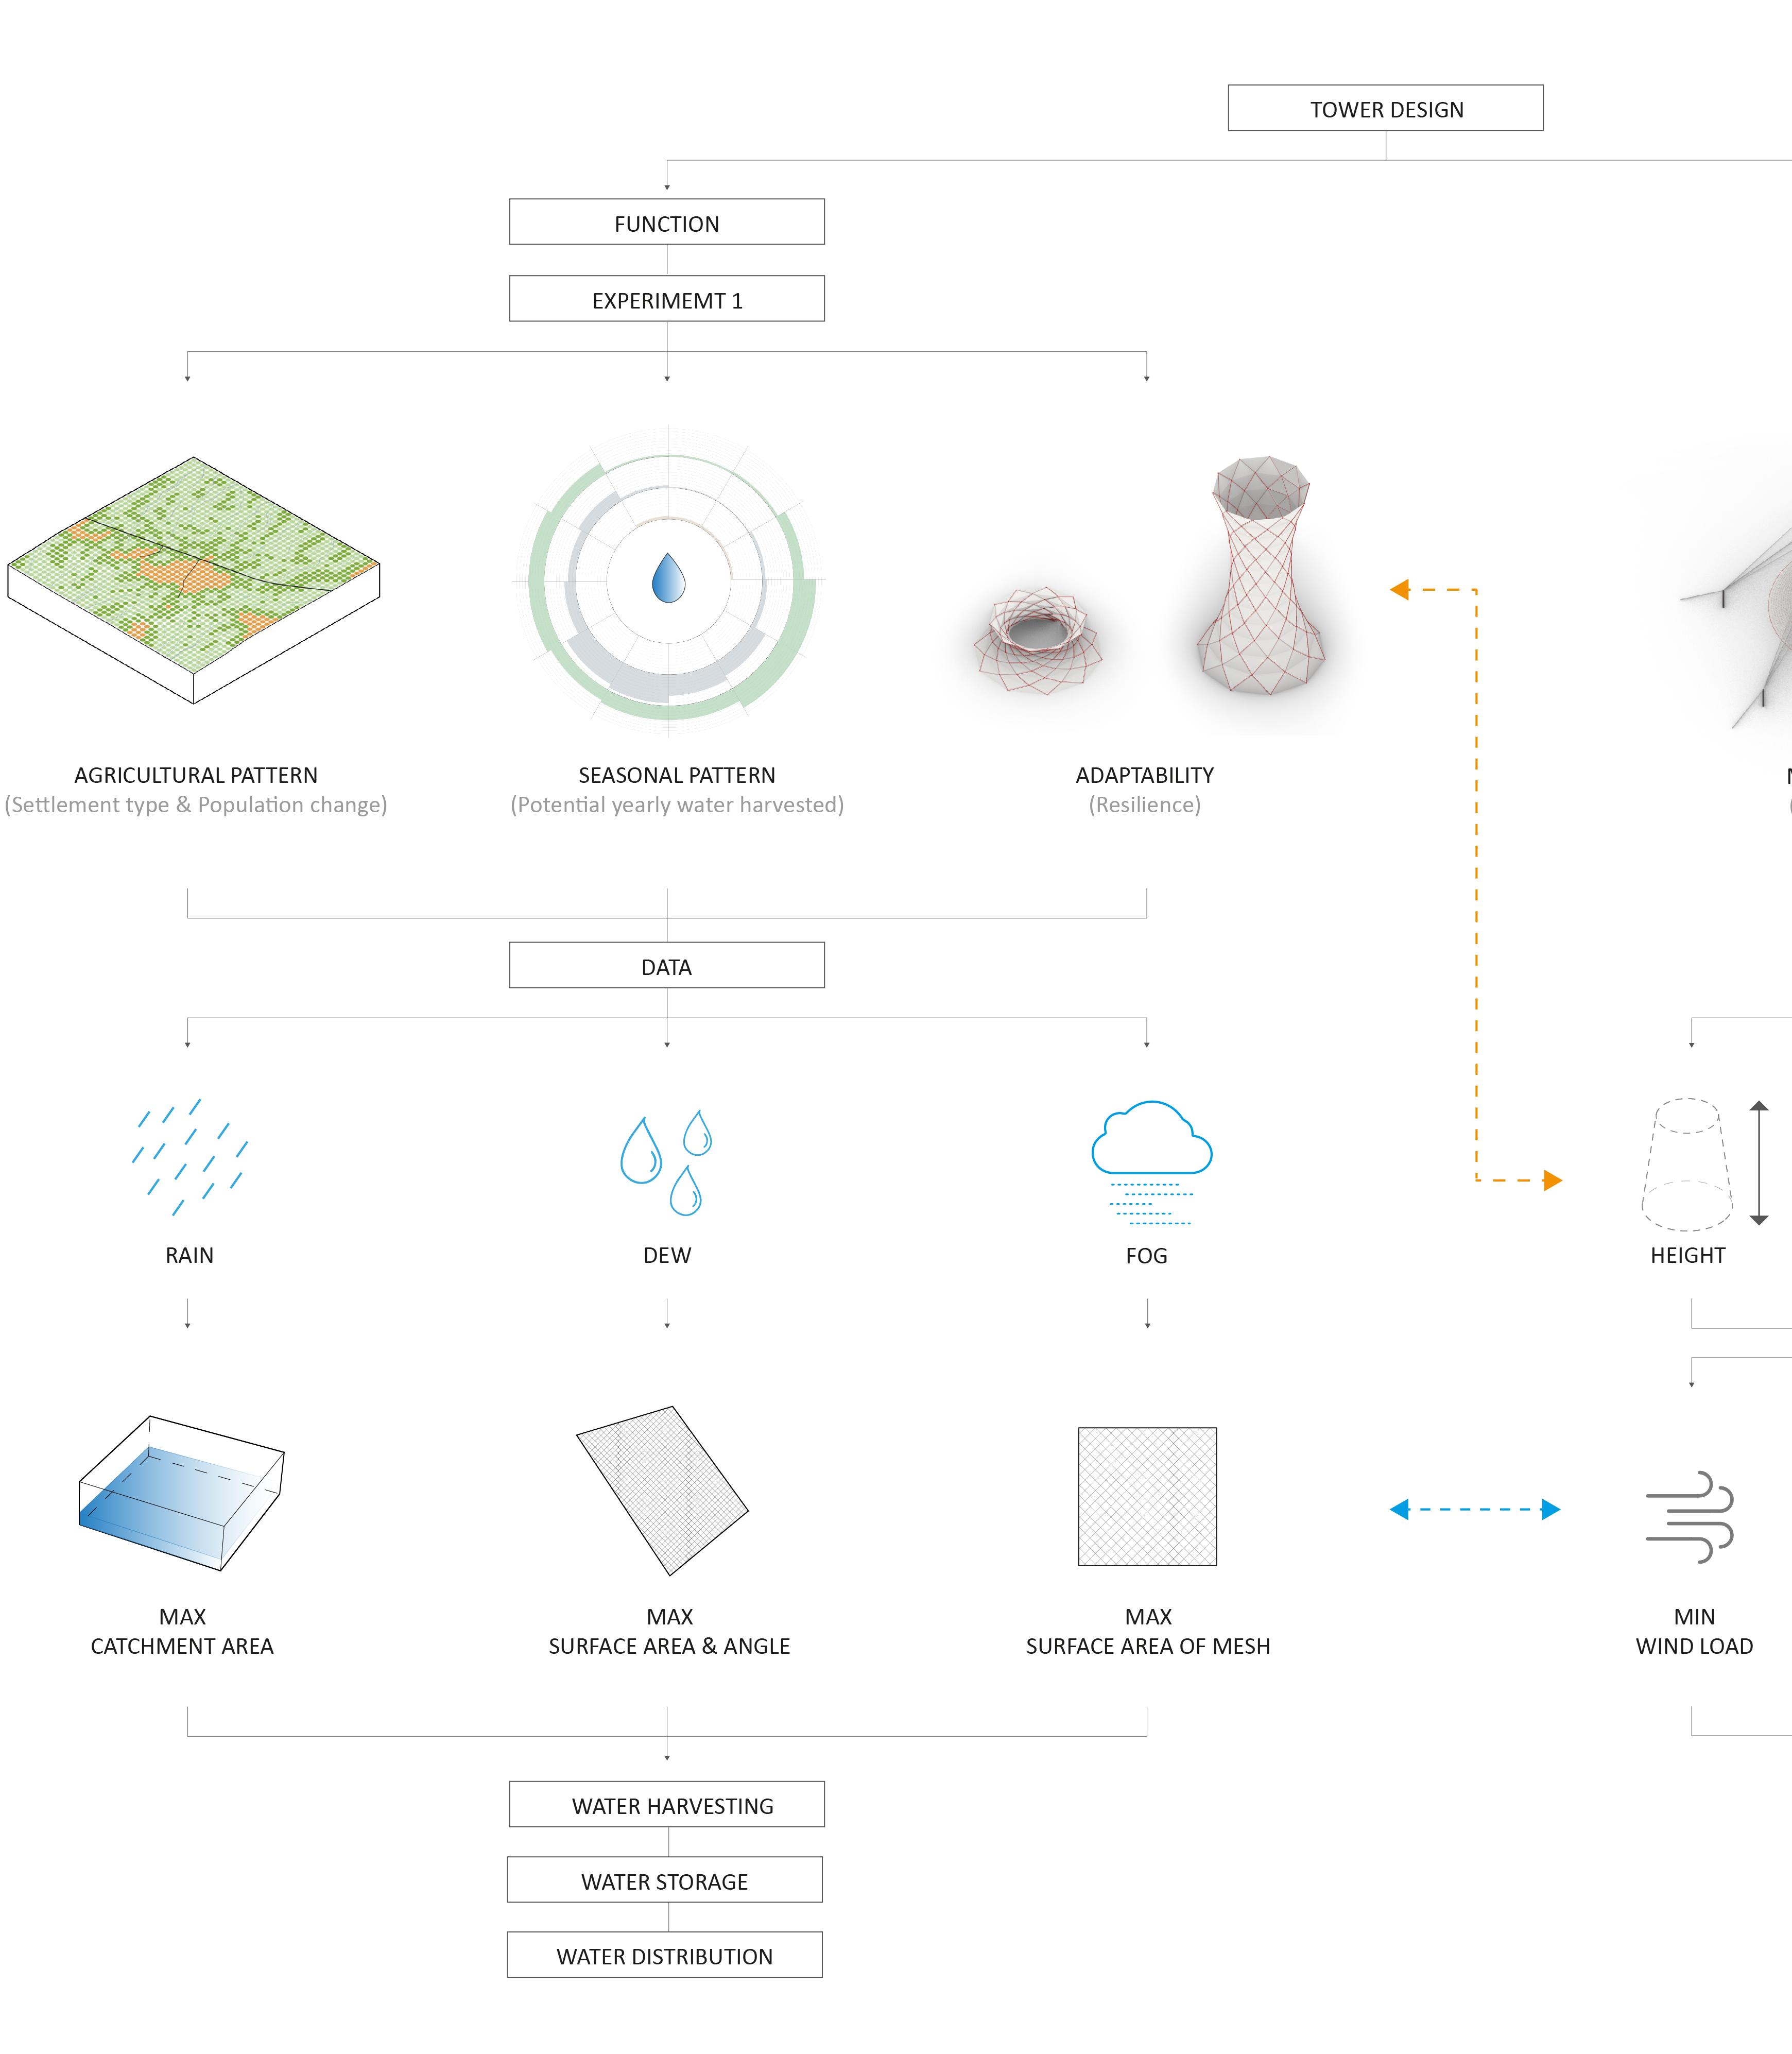
The research from the domain chapter helped extract data for several parameters which would inform the process of analysis and design at various scales of material, architectural and settlement systems. Digital simulations for these scales are carried out primarily using Grasshopper, a visual programming language that runs within Rhinoceros 3D computeraided design application. This enabled work-flows which provided information feedback loops between the different digital simulations.
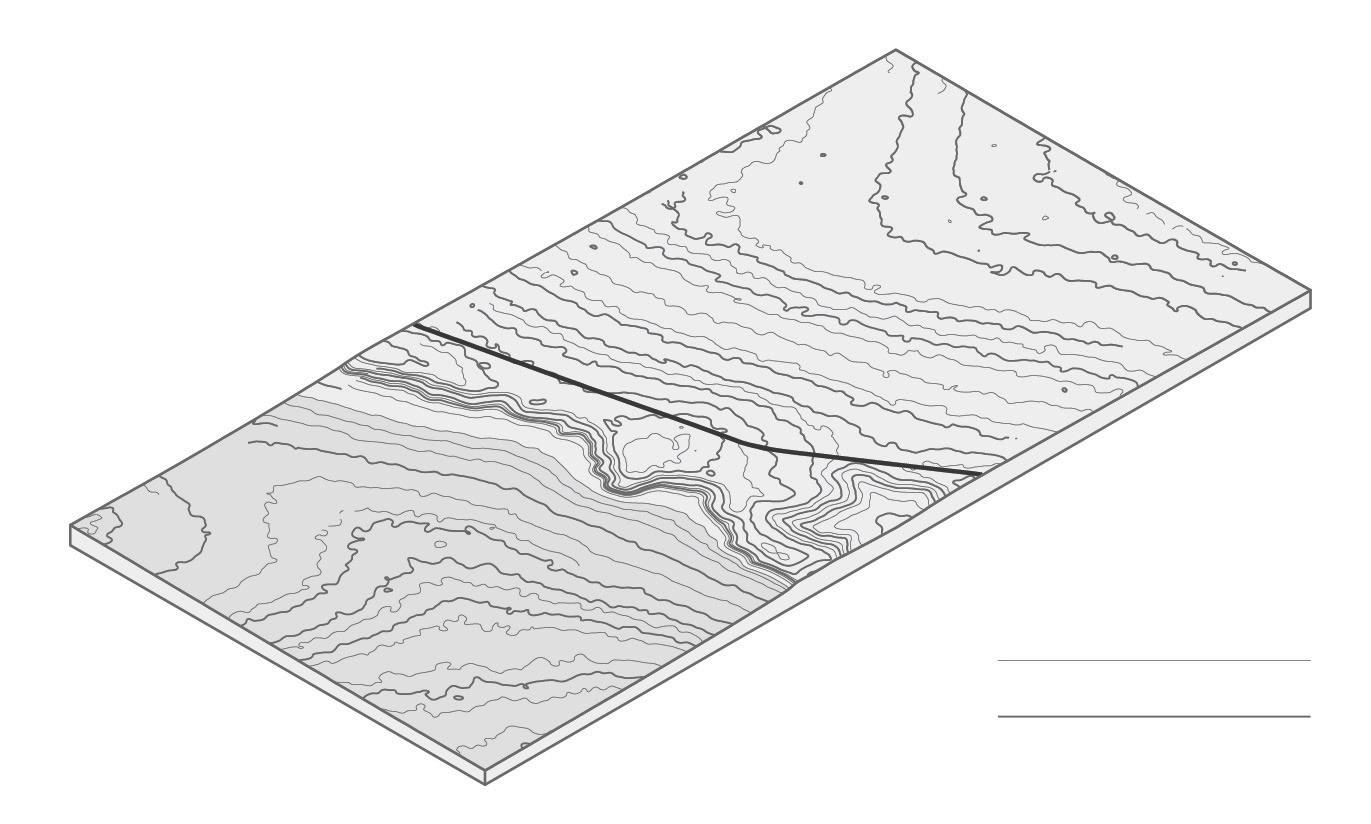
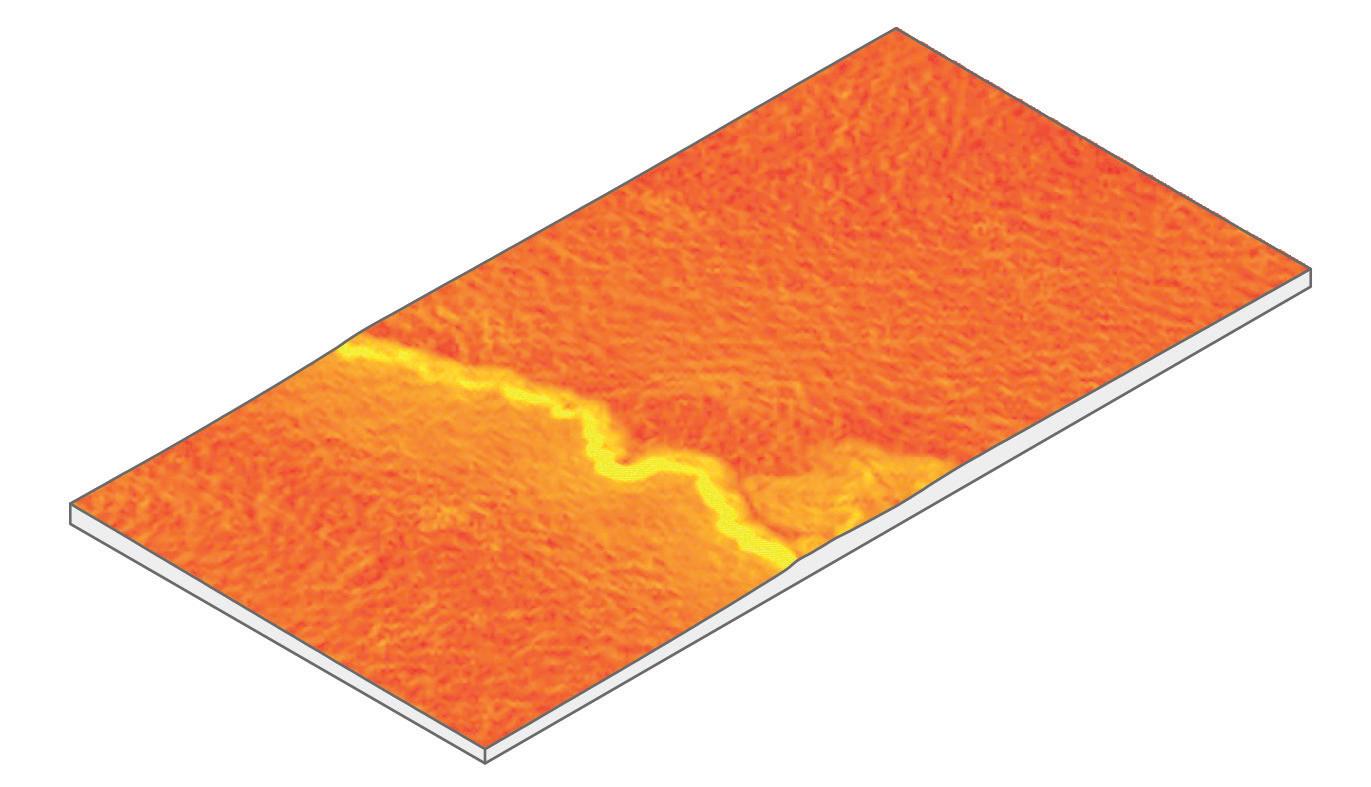
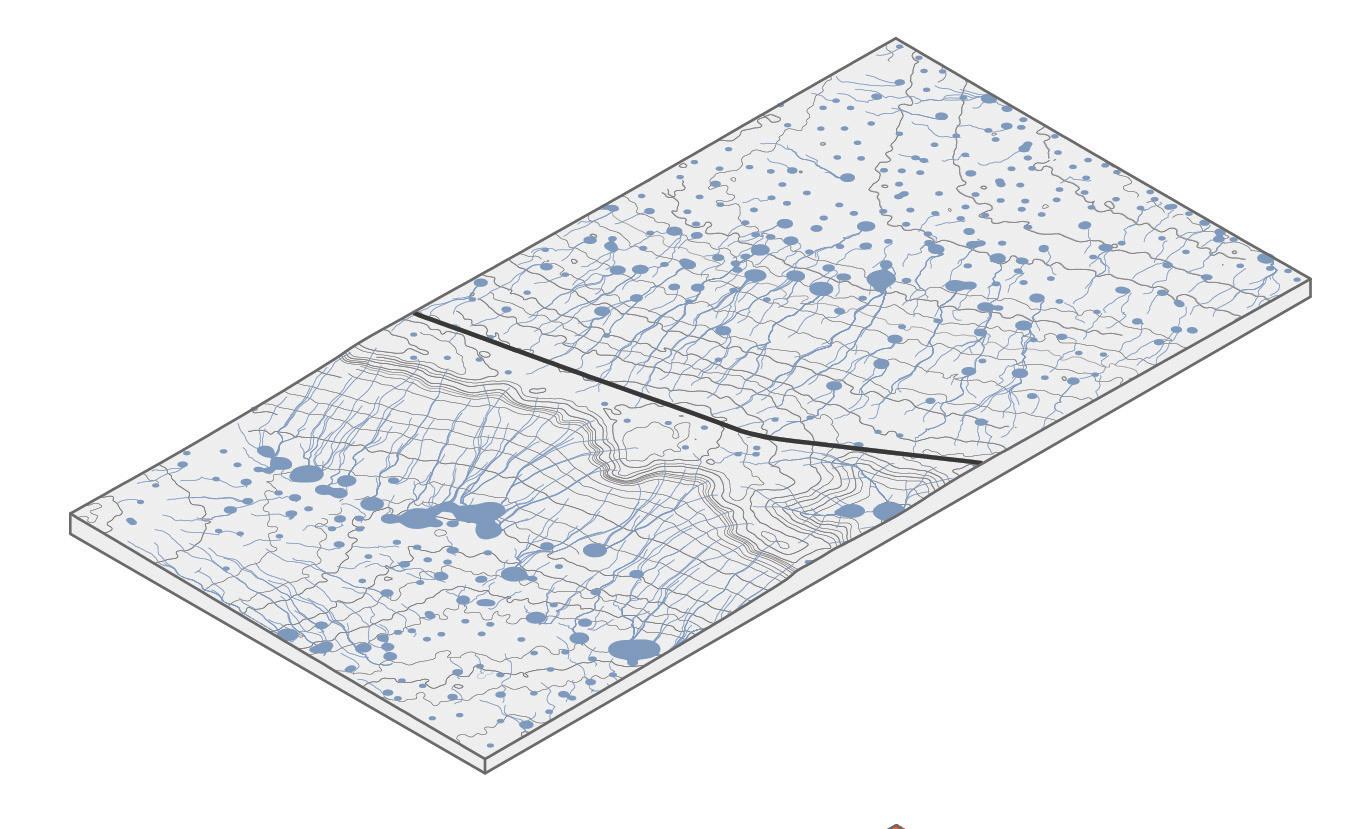
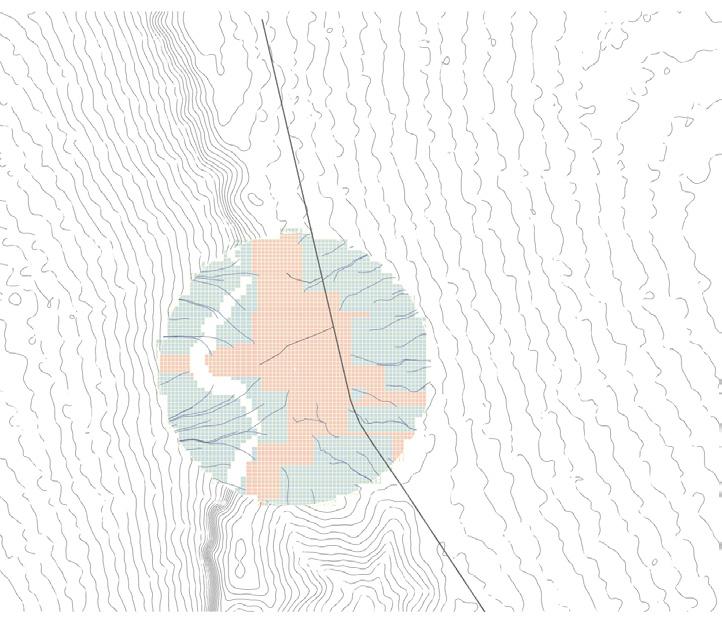
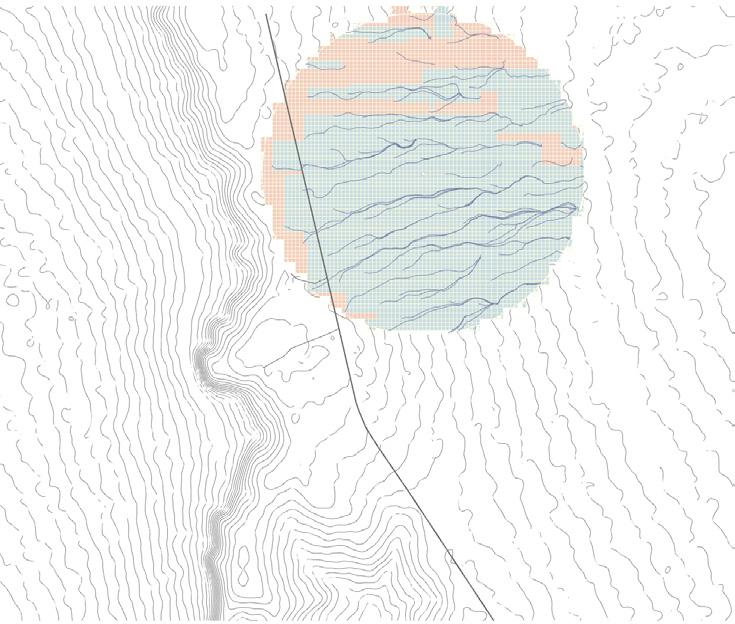
At a settlement scale, Understanding the topological pattern of human settlements and their geographical associations is vital to understand the drivers of land use and land cover change. Topographical Analysis helps establish the relationship not only between natural features such as stream flows and gradients but also its relationship to man-made features such as settlement patterns and growth.
In order to outline the design strategy, the topographical analysis is implemented to understand the elevation, gradient and drainage features of the terrain with its respective impacts. The analyses are conducted on a digital terrain model of 175sq. km area to generate data sets that will inform the process of settlement distribution and planning
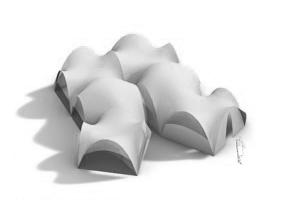
At an architectural scale, finite element analysis is conducted to enable an iterative process of designing the morphology of the of the water harvesting towers and the housing units. The results of these simulations when combined with environmental parameters and the parameters extracted from the settlement experiments, will inform the digital simulations for housing unit clustering .
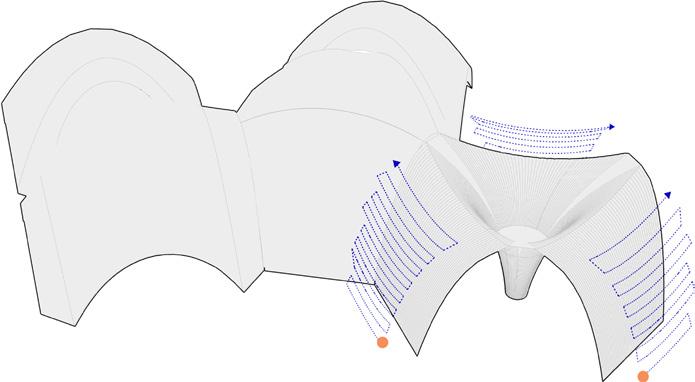
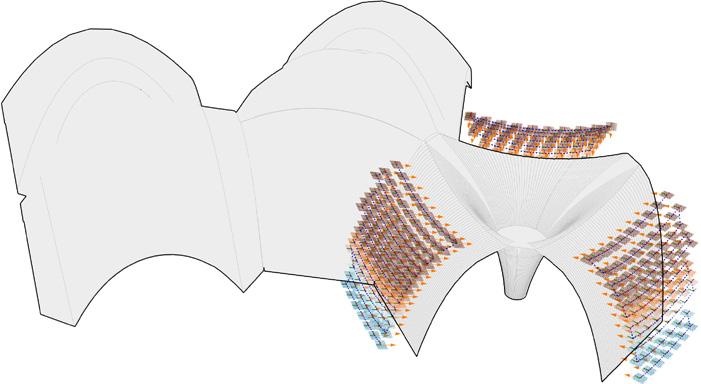
At the material scale, the aim is to conduct digital simulations for innovative fabrication strategies suitable for the materials studied. Digital tools are used to explore the fabrication technique of Bio-Shotcreting using drones and testing the drone path trajectory for the results of the housing unit experiments.
03 - 2.1
DESIGN ANALYSIS
Digital tools used for analyses at various scales
TOPOGRAPHICAL ANALYSIS
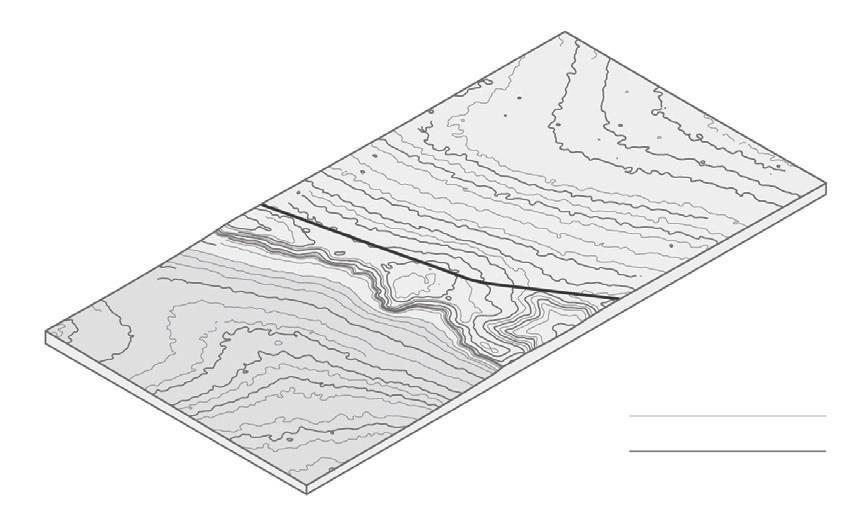
A digital terrain model (DTM) or digital elevation model (DEM) is a 3D representation of the terrain elevations found on the earth’s surface. The DEM is generated using data from Shuttle Radar Topography Mission (NASA) which provides surface morphology of the site packaged in 1°x1° tiles.
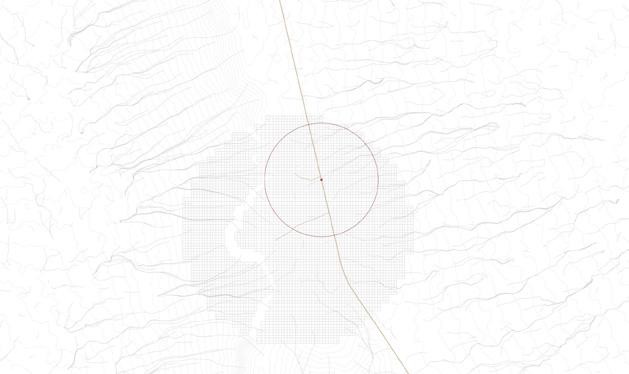
The digital elevation model is then sliced parallel to the horizontal plane at 5m intervals to generate a 2D contour map of the site. From the generated contour map, data of the site elevations (highest and lowest points), site profile and slope aspect can be extracted. Generating a 2D contour map facilitates the process of planning and proposing site interventions.
03 - 2.2
SLOPE ANALYSIS
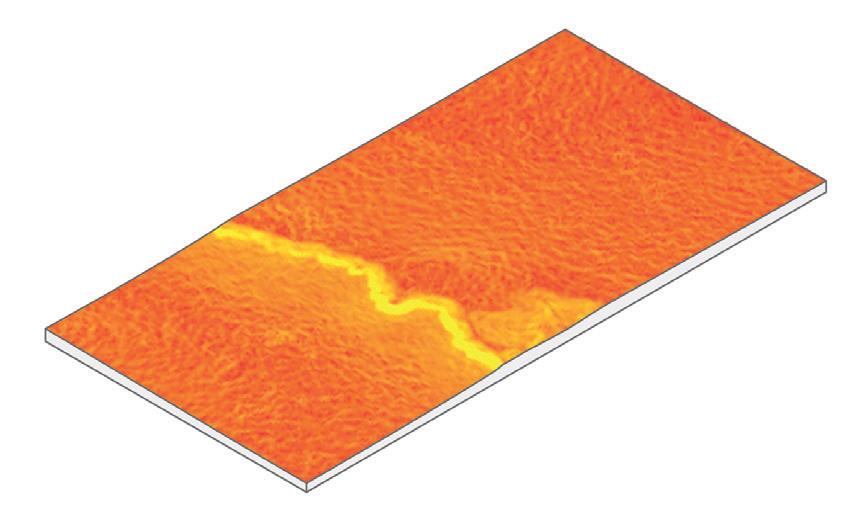
Slope analysis measures the change in elevation of a terrain. It comprises of two components – gradient and aspect. The experiment focuses on the slope gradient analysis, wherein the slope in percentage is calculated at various points on the site.
The slope gradient analysis is implemented on the DEM surface which is then converted into a mesh. The slope angle for the mesh vertices are then calculated with respect to the universal Z-axis. The number of mesh vertices generated determines the output resolution. Thus, larger the number of mesh vertices, higher the resolution of the analysis. The tool used for slope analysis is Bison, a landscape plugin for Grasshopper.
Data from the slope analysis will inform the site’s land use planning. It will also help determine the species of crops that can be cultivated, based on the gradient of the region. The natural slope of the site along with data from the drainage analysis will help determine the watershed boundaries.
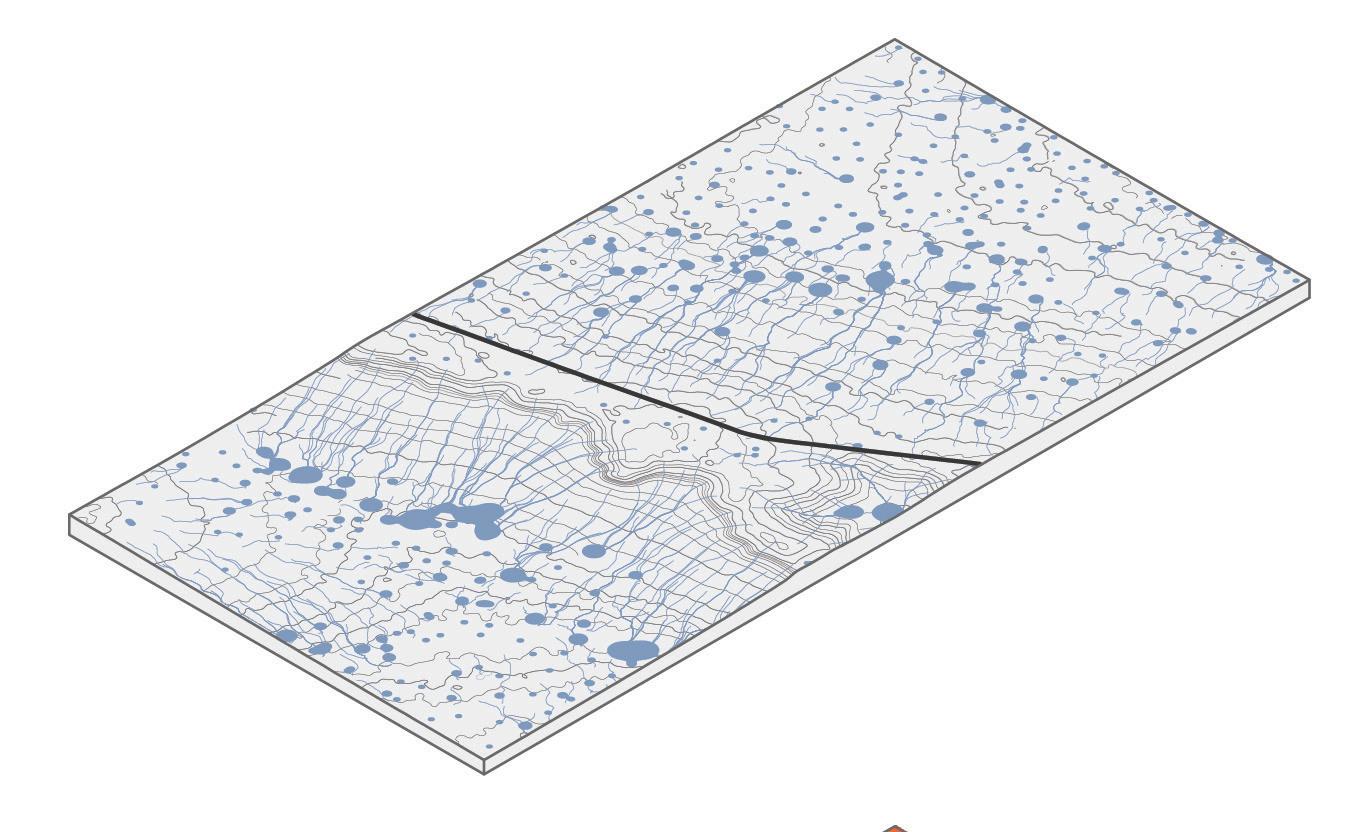
Hydrological analysis is implemented on the DEM to establish a water system model, which is used to study the hydrological characteristics and simulation of surface hydrological process to make a forecast for the surface hydrological state in the future. The tool used for hydrological analysis is Ground Hog, a plugin for Grasshopper which enables modelling landscape features within a parametric design process.
The experiment focuses on simulation of rainwater runoff streams, establishing their respective water shed boundaries and their catchment ponds. Data from this analysis can then be used in the planning of the settlement with its associated water distribution network, agriculture and forestry.
03 - 2.4 FINITE ELEMENT ANALYSIS
Finite element analysis ( FEA ) is a computerized method for predicting how a geometry reacts to real-world forces, vibration, fluid flow and other physical effects. Element analysis works by breaking down the global geometry into a large number of finite elements. Mathematical equations are used to predict the behaviour of each element which is then combined to predict the behaviour of the global geometry. The tool used for FEA analysis is Karamba 3D, a parametric structural engineering tool which can be used in Grasshopper.
In the project, FEA analysis is used in the process of defining the morphology of the housing units. The digital simulations focuses on minimizing the displacement values of the geometry whilst changing other design parameters related to modularity.
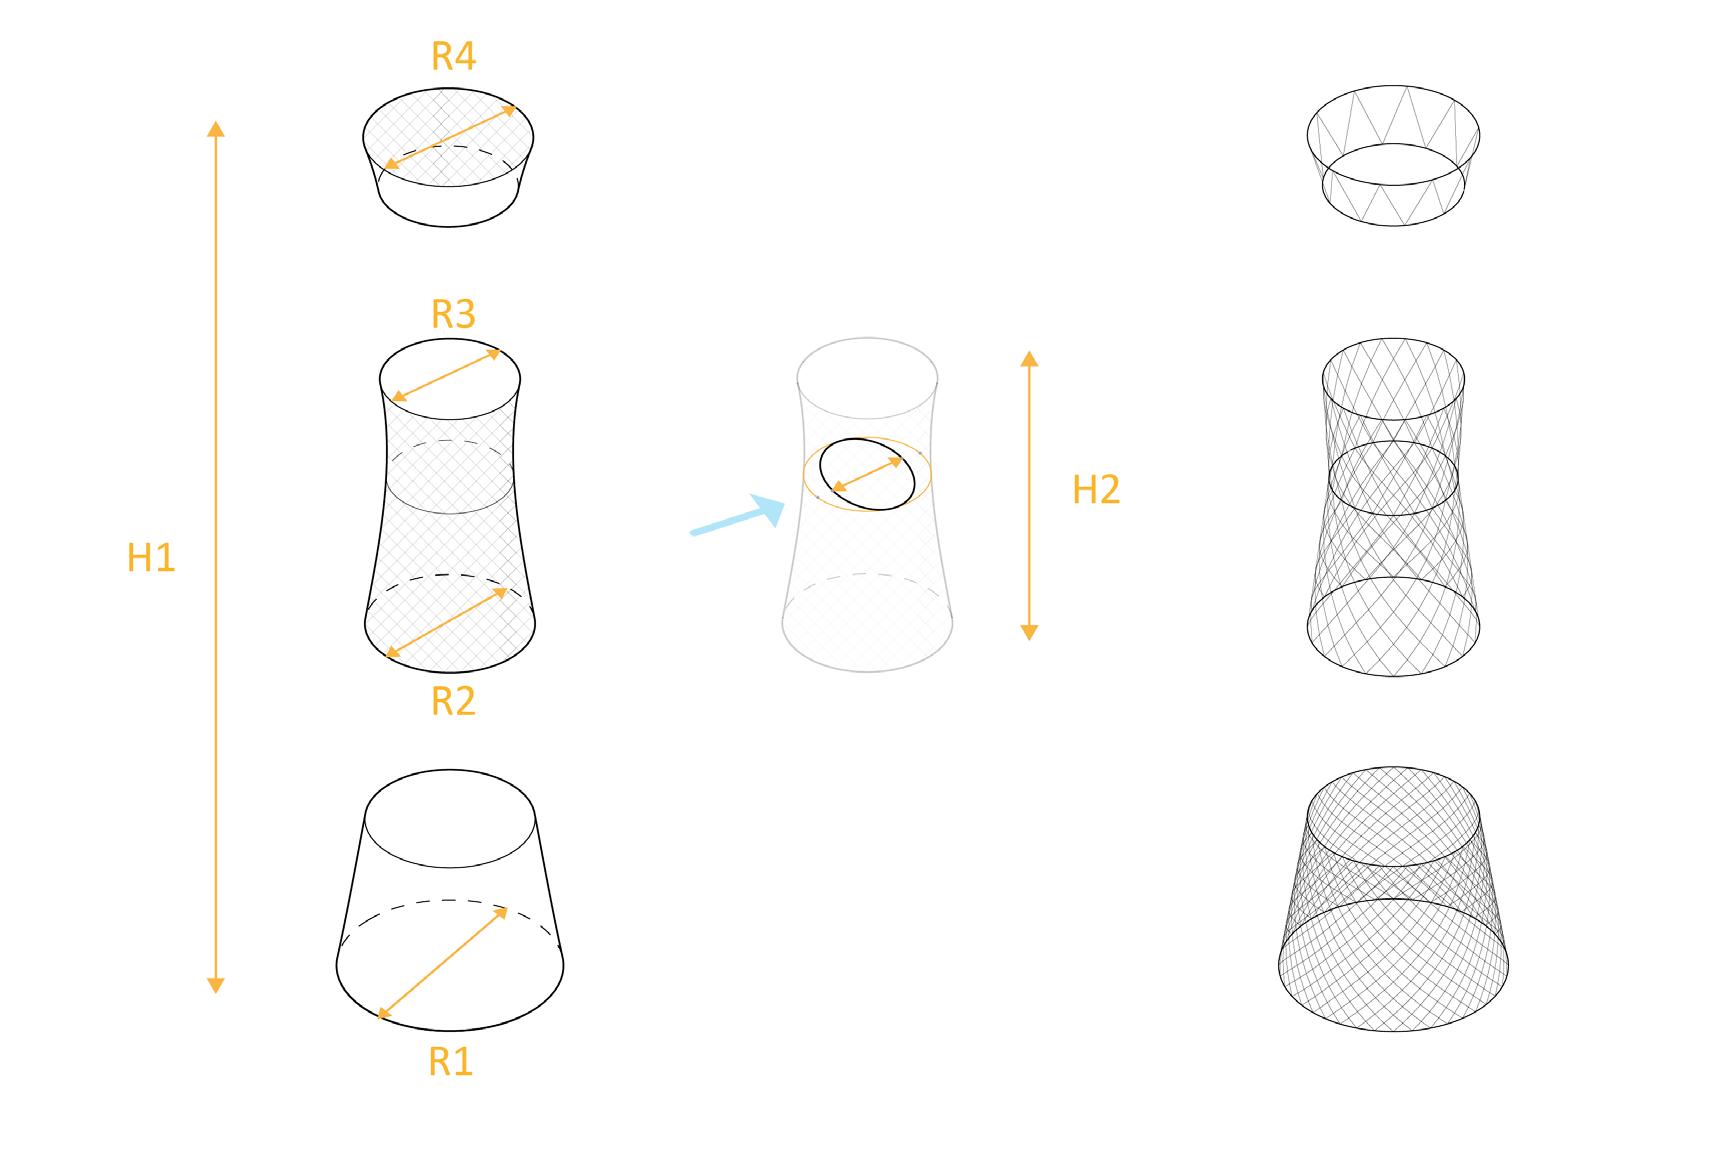
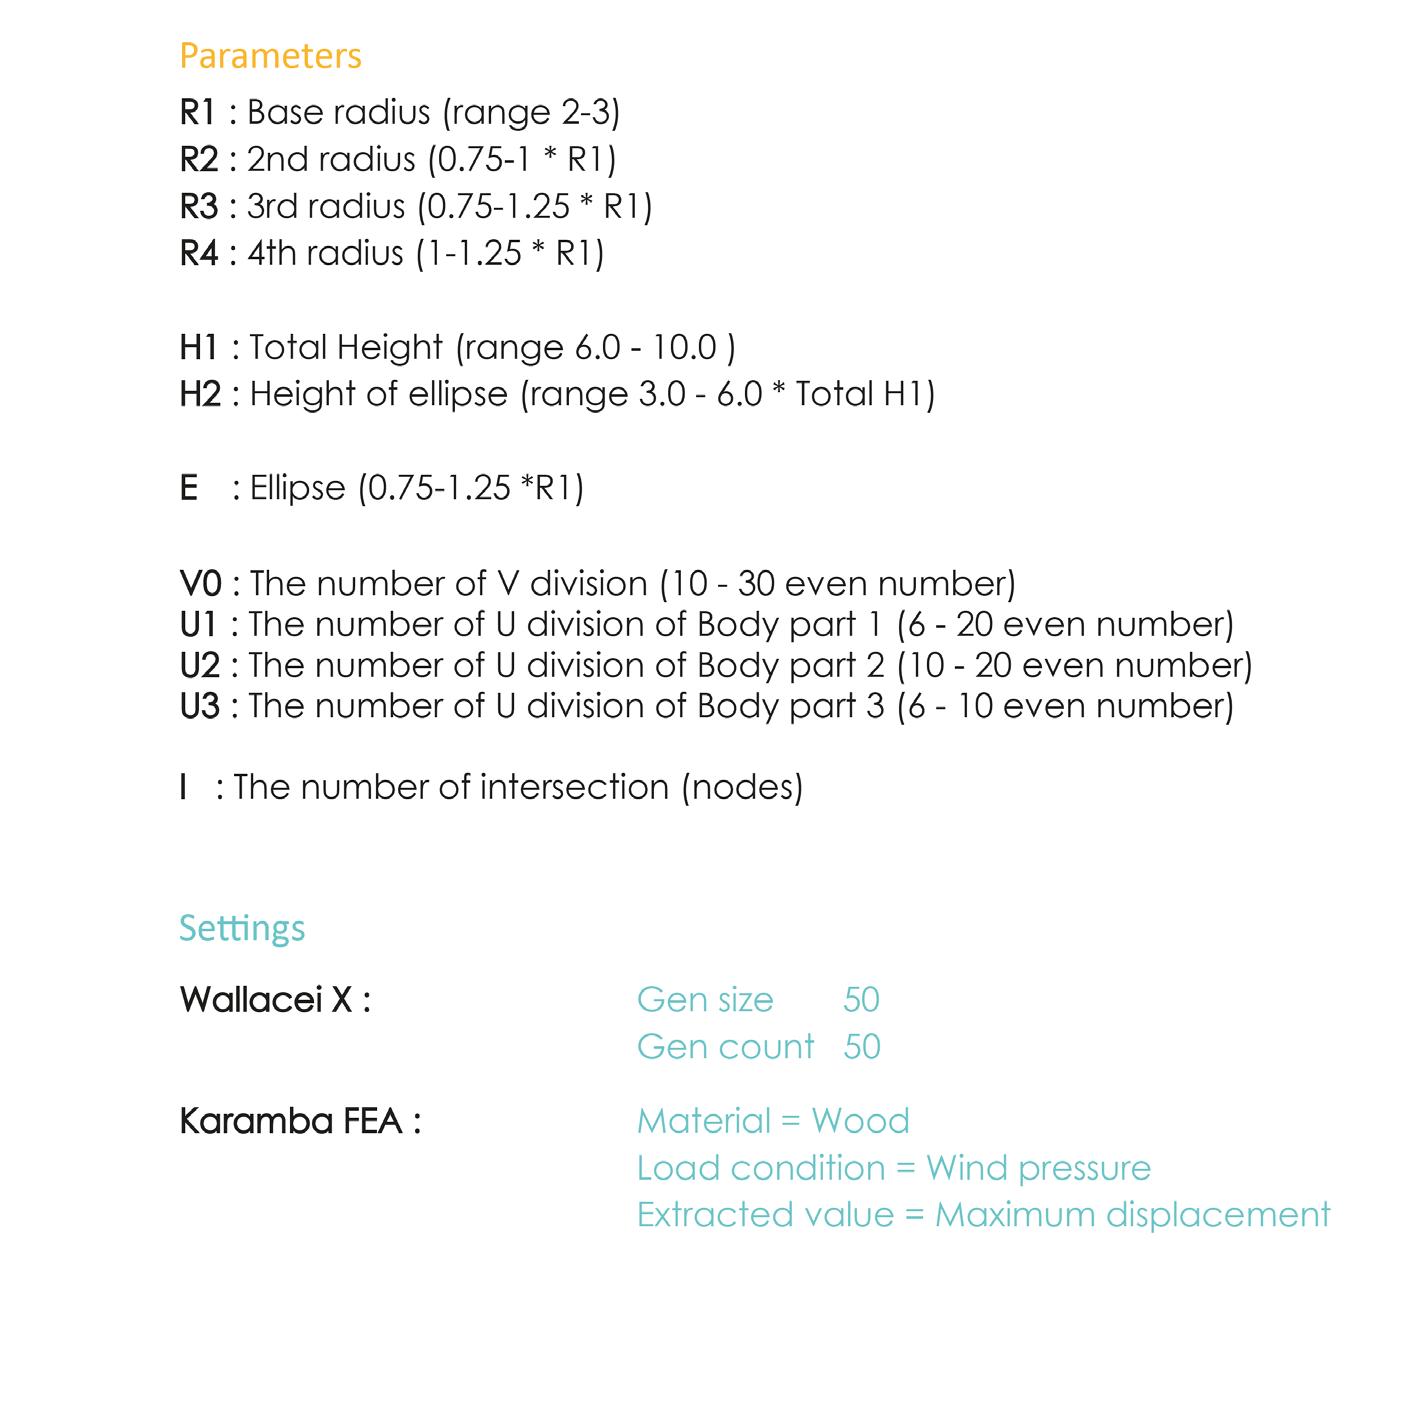
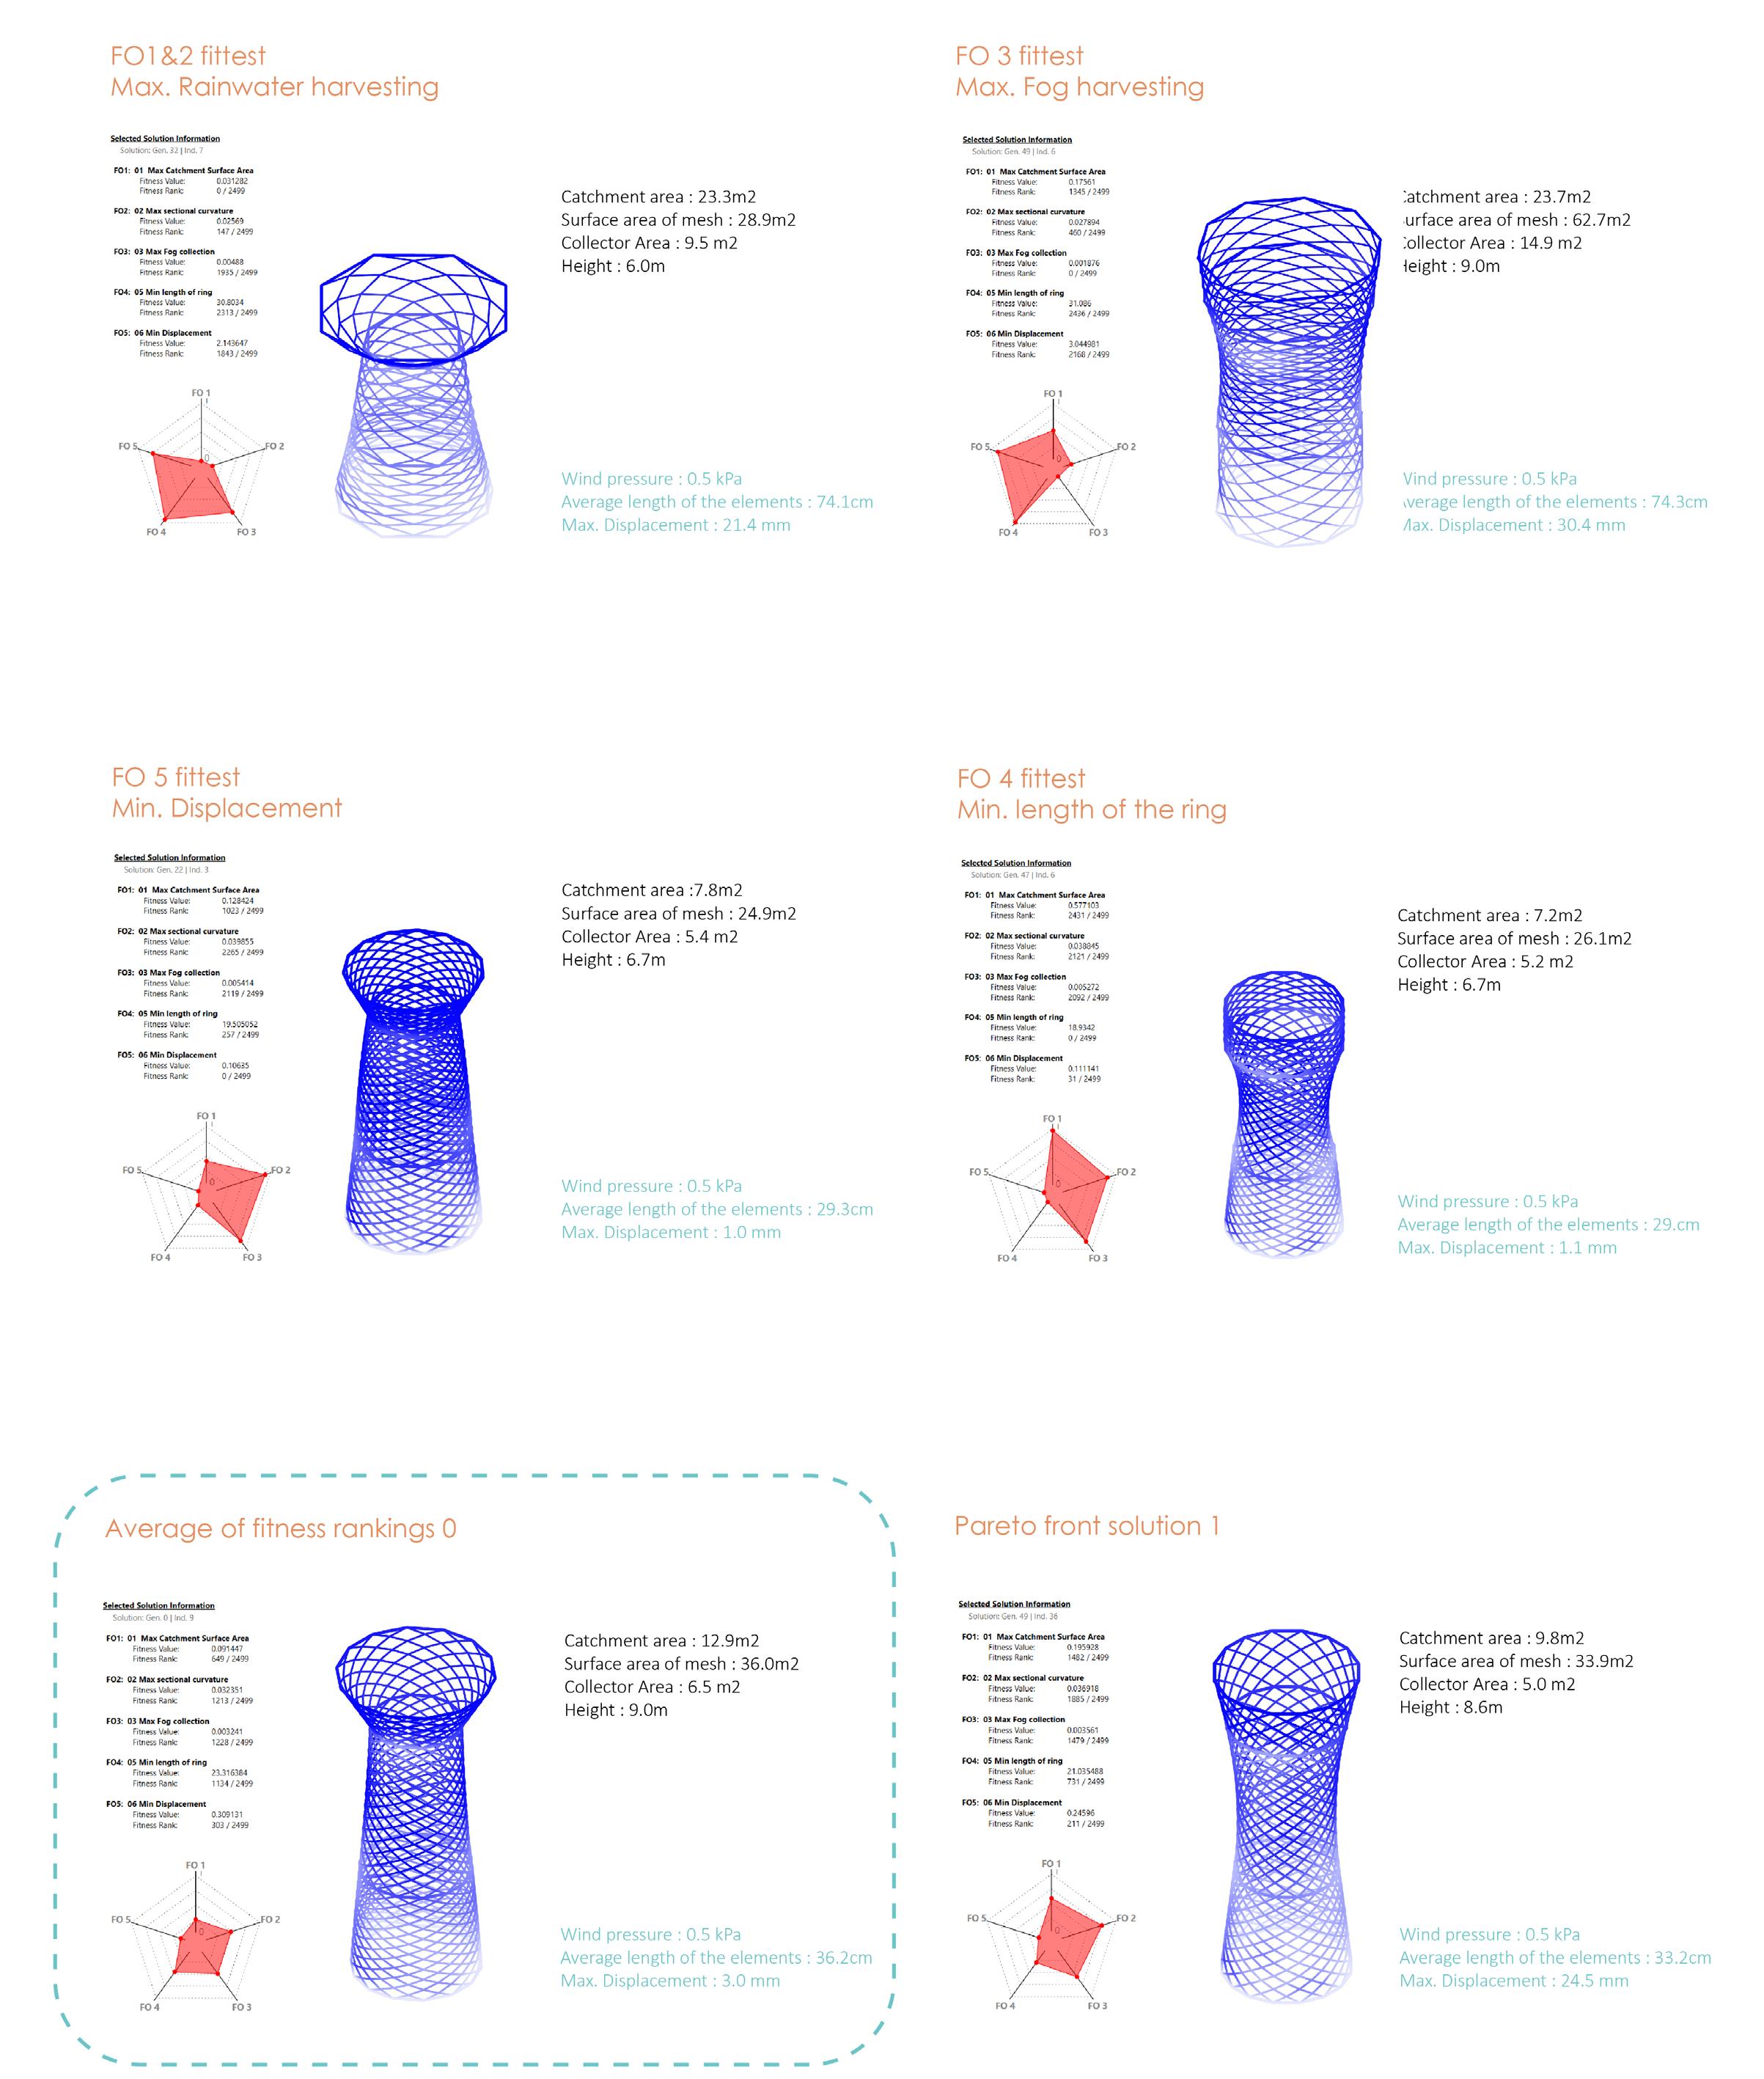
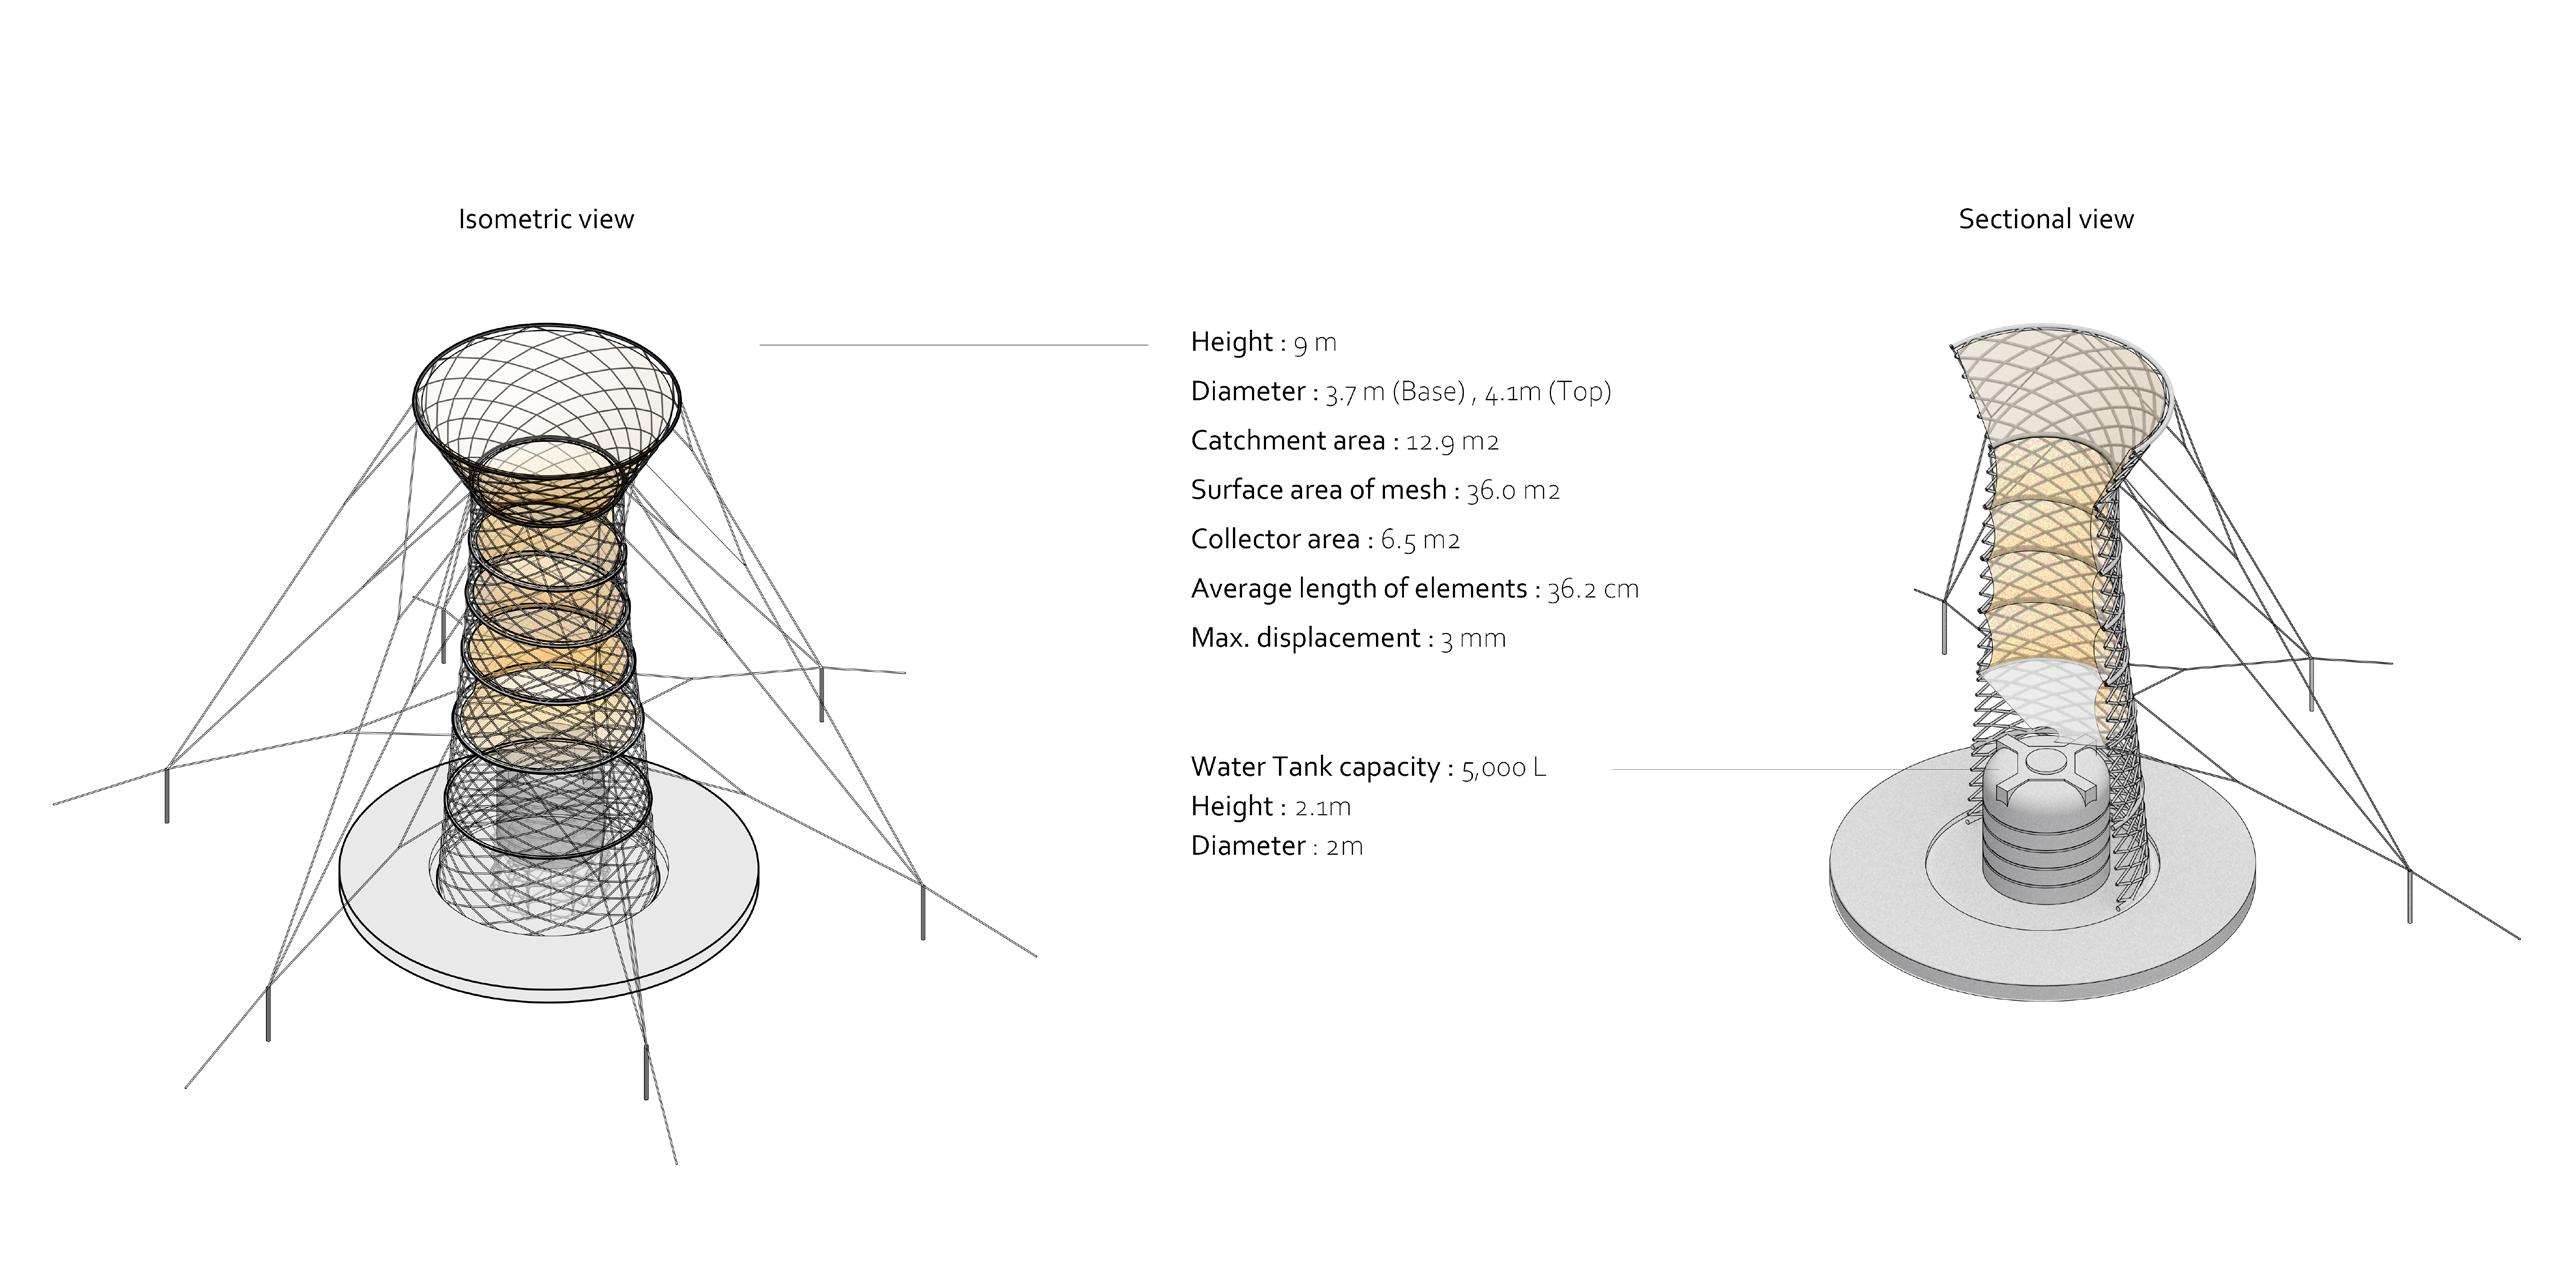
It is also used in the design of the water harvesting towers, to minimize the displacement values of the tower morphology due to wind loads whilst being optimized for its water harvesting potentials.
03 - 2.5 SHADOW ANALYSIS
Shadow analysis is a study which evaluates the extent to which a building casts its shadow on the surrounding area. Shadow analysis is used within the generative design process to evolve buildings to perform better in relation to the sun.
In this project, shadow analysis is conducted as an evaluation parameter for the clustering simulations in order to create shaded spaces and minimizes evaporation of soil moisture which becomes an important part of the design decision, given the location of the site; semi-arid region of Africa.
A vector-based shadow study is conducted for the clustering experiments, using occlusion , a native grasshopper component which calculates the number of vector hits being occluded by the clusters resulting in the values for the shadow that is cast.
03 - 2.6
COMPUTATIONAL FLUID DYNAMICS
Computational fluid dynamics or CFD, is the analysis of fluid flows using numerical solution methods to analyze complex problems involving fluid – fluid, fluid – solid or fluid – gas interactions in a given environment . CFD tools can be used to calculate surface pressures, heat transfers and velocities. This project uses Butterfly, a plugin for grasshopper which can be used to run advanced CFD simulations.
CFD simulations were used to extract wind velocities based on seasonal patterns to inform the tower morphology experiments.
03 - 3
DESIGN METHODS
Digital tools used for design techniques at various scales
03 - 3.1
GENERATIVE ALGORITHMS
Multi-objective optimization is a method of multiple-criteria decisionmaking, involving multiple evaluation parameters (objective functions) to be optimized simultaneously. When two or more contradicting parameters are evaluated, a range of solutions are generated .
Typically, there does not exist a single solution that simultaneously optimizes each of the objectives. Instead, there exists a (possibly infinite) set of solutions called the Pareto optimal solutions.
A solution is called a pareto optimal solution if none of the objectives can be improved in value without compromising the performance of the other objectives. This method of evaluation provides the designer with the ability to select the best performing solution from a range of solutions in accordance to objectives need to be optimized.
In this project, multi-objective optimization is used at multiple scales at different stages of research development. The tool used is Wallacei, an evolutionary multi-objective optimization engine for Grasshopper.
03 - 3.2
DEPLOYABLE STRUCTURES - SCISSOR GRIDS
Deployable structures are structures that can change shape significantly so as to change its size. They can be collapsed and assembled to create self supporting structures. Scissor grids are a type of deployable structure consisting of articulated bars. They provide the ability to achieve large volume expansions through an easy to control deployment process. Deployable scissor grids can quickly transform between different configurations making them particularly fit for mobile and temporary applications.
In this project, deployable scissor grids are used for the design of temporary housing units. Once these shelters become permanent, the deployable structures are collapsed and reused.
03 - 3.3
DRONE SHOTCRETE - PATH PLANNING
Drone Shotcreting offers new and innovative ways of fabrication using local materials and accessible technology . This technology offers a new kind of shotcrete allowing freeform and remote constructions to be made easier and more affordable.
In this project drones are used to spray clay mixtures onto natural fibre mats which are supported by the lightweight deployable structures in order to create a uniform, lightweight shell structure. Ivy, a plugin for Grasshopper is used for mesh analysis and segmentation in order to generate the paths taken by the drone for shotcreting.
Workflow indicating experiments at various scales.
The workflow of the research development is broadly categorized into the MSc Phase and the M.Arch Phase. The workflow is read from the left to the right outlining the flow of data from the experiments conducted at various scales at different stages of the project.
In the M.Sc Phase, the aim is to focus on the architectural systems. Therefore, at a settlement scale, the goal is to conduct thorough analyses of the terrain and its environmental conditions in order to select a suitable study patch for settlement distribution and planning. This would allow data to be extracted for a typical settlement block that would inform the block planning simulations.
At an architectural scale, the housing unit morphology and water harvesting tower morphology, form find experiments are initiated simultaneously. Results of the housing unit morphology informs the drone trajectory planning for Bio-Shotcreting. Further to this, the housing unit modules are combined defining the spatial qualities and overall morphology of the housing units. A study patch of the settlement block is extracted with its datasets informing the setup of the block planning simulation. Results from the cluster planning and tower design simulations act as drivers for the design the spatial distribution of the clusters in the block and to establish relationships between the clusters and the towers leading upto the final MSc design proposal.
M.Arch Proposal
M.Sc Proposal
Topographical Analysis
Slope Analysis
Hydrological Analysis
Gradient ( %)
Contour Interval
- 2
SITE ANALYSIS
Terrain and Hydrology analysis of the site.
The topographical analysis conducted indicates a majority of the site to the West to be at a lower elevation of approximately 1375m above sea level. Whilst the remainder of the site to the East having a higher elevation of upto 1580m above sea level.
Slope Analysis
The slope gradient analysis indicates the gradients of the site to be in range between 0 to 25 % . The region highlighted in yellow to the West indicates a steep drop with a gradient of upto 25% . The vast majority of the site towards the East has gradual slope gradients of 5% and lower which would favour the development of the settlement as slope gradients of 10% and lower are considered favourable for construction.
The drainage analysis shows several long natural water drainage channels along the steep slope to the West. To the East smaller lengths of drainage channels and pools which could potentially be developed to help improve soil conditions to favour the cultivation of agriculture and livestock grazing lands.
1. Determine hierarchy of scales in the settlement planning
2. Determine area of land required for fodder cultivation for livestock.
3. Estimate volume of water catchment
1. Determine study patch on selected site extents for settlement planning. Selection based on :
- Slope of terrain - Area of land required - Proximity to the road - Area of water catchment land available
Settlement Planning Experiments
3
1. Determining morphology of housing units and their relationship with the towers.
2. Determining relationship between multiple housing units in a settlement block, based on morphology , sociology and environmental factors.
1. In the selected study patch, determining the distribution of the hierarchy of scales of the settlement
2. Determining public facilities in proximity to the road and identifying water catchment ponds around which the settlement blocks will grow.
3. Establishing network relationship between public facilities, settlement blocks and the highway.
Data
1. Site Selection
Hierarchy
2. Settlement Distribution
3. Settlement Block Planning
Experiment 4
4.1 Agriculture and Hydrology Data
1. Determining agricultural practice patterns to increase per sqm produce based on terrain and environmental parameters.
2. Incorporating drainage of the recycled grey water into the agricultural system
4.2. Settlement Planning
1. Establishing the relationships between settlement blocks, public spaces and the overall settlement.
2. Data from experiment 2 and 4.1 will be used to rerun the settlement distribution experiment to plan the settlement with network evaluation objectives.
- 3
SETTLEMENT PLANNING
Workflow indicating breakup of experiments.
The settlement planning involves the analysis and synthesis of multiple data sets pertaining to various factors related to the site conditions and planning principles. These data sets are derived from or related to one other. Therefore, in order to manage these data sets effectively, the settlement planning experiment is divided into a subset of experiments based on a hierarchy such that the results of each experiment inform the next as outlined in the workflow.
The experiments can be categorized into two scales, regional and settlement scales .The regional scale focuses on the planning of a typical settlement block module, whilst the settlement scale focuses on the planning of the over settlement.
The M.Sc phase will focus of experiments 1 to 3, wherein, experiment 1 is conducted to identify a study patch favorable for establishing the settlement. The results of this experiment along with data gathered from establishing the hierarchy of scales for the settlement will inform the settlement distribution. Experiment 2 focuses on distribution of the settlement blocks within the domain of the selected study patch. A settlement block is extracted from experiment 2, considered as typical, to inform the settlement block planning experiments.
04 - 3.1
EXPERIMENT 1
Selection of suitable study patch for settlement distribution
GOAL
The goal of the experiment is to extract a study patch of 25sqkm for settlement distribution and planning from the larger site extents. The aim is to find a study patch with terrain slope gradient less than 10 degrees favourable for construction, land with higher soil moisture probability and in proximity to the highway favouring easy accessibility.
The experiment subdivides the site into a grids of 60m x 60m and uses evolutionary multi-objective algorithms to test each grid for slope and water catchment, whilst identifying the location of the study patch in proximity to . man-made and natural features on site.
1. Search Space
3. Location of point ( Assumed centre of study patch )
CONDITIONS
2. Distance of point from highway
4. Area of Study patch
The setup consist of a point on curve which is allowed to traverse the path, north an south of the existing highway. From this point, a circle is defined with a radius ranging between 1km to 1.5km which represents the distance from the highway.
A point on curve of this circle, is established which is representative of the centre of the study patch to be defined. The point is allowed to traverse the circumference of the circle enabling a larger domain of search for the study patch.
A bounding box of 25 sqkm is constructed with this point as the centre, thereby defining the region of the study patch.
FO1 : Maximise area of search space
The search space is set in a range of upto 30 sqkm. This patch is divided into 60m x60m grid for higher resolution of analysis.
FO3 : Minimise difference between parched and catchment areas
Catchment area - area of land surrounding a water drainage channel
Parched area - area of with no water drainage channel
FO5 : Minimise distance from periphery to centre
The minimise the overall growth the settlement, to prevent a vastly spread out distribution and to minimise the travel distance to the centre.
FO2 : Maximise catchment area
Catchment area - area of land surrounding a natural water drainage channel having relatively higher soil moisture
FO4 : Minimise distance from centre to road
The point in the centre is representative of the centre of the study patch. The gene for distance is set between 1km1.5km, wherein 1km is the ideal walking distance based on transit based urban planning.
FO6 : Minimise slope of search space
From the slope analysis, the average slope percentage for each grid is calculated. Slopes upto 10% are considered as favourable for construction.
FO1 fittest : Maximise area of search space
FO2 fittest : Maximise catchment area
FO3 fittest : Minimise difference between parched and catchment areas
FO4 fittest : Minimise distance from centre to road
fittest : Minimise distance from periphery to centre
: Minimise slope of search space
FO5
FO6 fittest
Average of Fitness Ranks
RESULT
The experiment was conducted for 50 generations with 10 individuals each, generating 500 possible solutions for the study patch. To better understand the results of the experiment, we extracted the fittest individuals for each of the fitness objectives.
It can be inferred from these results that for every individual only three objectives are being improved and the deviation of the results is decreasing towards the later generations.
Therefore we decided to go with the fittest individual of the average of fitness ranks. This individual displays maximum area of the study patch to be in the region of higher soil moisture probability and is in proximity to the highway. This region also has the lesser overall slope values which would favour construction.
- 3.2
SETTLEMENT DISTRIBUTION
Distribution of settlement blocks in the domain of the study patch
EXPERIMENT 2
GOAL
Having extracted the study patch from the site selection experiment, the objective of the settlement distribution experiment is to enable a network of decentralised public facilities which would include schools, markets, clinic and distribution centres.
The setup follows the principles of network centrality wherein the public facilities behave as a nodes from which the settlement blocks are distributed on the study patch. The aim is to maximise the distance of these facilities from the highway in order avoid settlement distribution along the highway hindering accessibility and movement and to maximise the settlement distribution in the fertile regions of the site . The experiment also includes objectives establishing the relationship of the public facilities with the highway and the settlement blocks.
For the settlement blocks, the aim is to maximise the area of the blocks distributed along the regions of higher water catchment potential. It also includes objectives governing the relationship of the blocks with the highway and the public facilities.
Public | Public
1. Maximise distance of public facilities from highway
2. Maximise area of public facilities
3. Maximise Area of the block
4. Maximise area of fertile land ( Catchment area )
Block | Block
5. Maximise distance of block from highway
6.Minimise distance of block from public facilities
CONDITIONS
The study patch comprises of 60m x 60m grids, bounding boxes are defined for the settlement block and public facilities to identify the grids that would be located within them, representing the distribution of the blocks and the public facilities.
The setup consists of 4 points which can traverse the path of the highway curve with a spacing in range of 400m - 800m set between the points. ( i.e 0.25 - 0.5 miles).
From each point, a circle of radius in range of 400m - 800m is defined, which is the distance from the highway where the public facilities are to be established.
A point on curve on these circles which can traverse the path of the circumference of the circle determines the node representing the public facilities. A circle of area range between 42000sqm to 54000sqm defines the bounding box for the public facilities space.
From each of the four public facilities nodes, a circle of radius between 400m to 800m is set to define a pair of points on it representative of the centre of the settlement blocks, such that from the centre of any settlement block to the highway via the public facilities node is always in the range between 800m to 1600m ( 0.5 miles - 1 mile ). As per transit based network planning, 1 miles is the ideal walking distance between any point to a transit hub.
Each pair of points can traverse the circumference of the respective circles to find the suitable location, and a circles of area range between 0.36sqkm to 0.48sqkm defines the bounding box of the settlement blocks.
1. Search Space
5. Public Facilities - Area
2. Distance between points
6. S.Block - Distance from public facilities
3. Public Facilities - Distance from Highway
7. S.Block - Location in search space
4. Public Facilities - Location in search space
8. S.Block - Area
RESULTS
The experiment was conducted for 50 generations with 20 individuals each, generating 1000 possible solutions for the study patch. The fittest individuals for each of the objectives were extracted to understand how the objectives are affecting the aggregations of the settlement blocks and the overall settlement distribution.
We decided to choose the fittest individual of the average of fitness ranks as it exhibits a relatively spread out distribution which could facilitate further growth of the settlement, whilst still being in proximity to the highway. The settlement blocks are largely distributed along the areas of high water catchment probability with the catchment ponds lying on the paths of the natural water drainage channels. The area of the settlement blocks also indicate a larger domain which
CONCLUSIONS
Few of the individuals indicate division of the settlement blocks due to the culling of grids with slope gradient values larger than 5% affecting the distribution patterns. Additionally, few individuals demonstrate overlapping and intersections of the networks between the public facilities and the blocks ,which could be eliminated by restricting its genes or investigated further to develop complex networks in the future experiments.
However, the chosen individual seems fit to be carried forward to extract terrain data to inform the block planning experiments which could further inform the settlement planning experiments. .
04 - 4 HOUSING UNITS
Experiment workflow
Experiment 1
Experiment 3
Experiment 2
In order to set a process for the definition of the houses form, we worked with a series of multi-objective optimization experiments driven by genetic algorithms using Grasshopper for Rhino combined with Wallacei x optimization plugin and Karamba FEA plugin.
For the design we decided to work with a modular approach, which could allow the buildings to be built in stages throughout time and to adapt to different household sizes.
Modularity also has an important significance for Somali culture, since they live in tents covered by rectangular mats, where the size of the tent is defined by the number of mats they are built with, having the capacity to increase or decrease their size with each new assembly.
As an initial form we started with a quadrangular based shell, as it has the potential to grow bi-directionally, making it versatile to adapt to changing terrain conditions. The quadrangular base also respects the construction logic of the vernacular Somali nomads’ huts, made out of four sides that are tied together to create a dome. Furthermore, the presence of four quadrants in the housing units has a symbolic meaning to African nomadic tribes, as it sets a balance between public and private, sacred and profane.
In the first and second experiment we varied the height and width of the catenary arches in the extreme of the shells, aiming to define a 10 m2 module working efficiently under self-weight conditions. For the third experiment we combined six modules in different ways through subsequent mirroring operations and evaluated environmental impacts on the house and the way site conditions were affected by its different positions and combinations.
Lowest
Shell Surface Area
Polygon Points Relative Position
Covered Area closest to 10 m2 Lowest Displacement
Catenary Arch Height
EXPERIMENT 1 Goal
04 - 4.1
Sinclastic or Anticlastic
Experiment 1 consists of the definition of a 10 m2 shell structure with a quadrangular base and four catenary arches one on each side of the base. The aim is to find a shell structure covering 10 m2 with a 6 cm thickness and the lowest possible displacement.
Conditions
Throughout the experiment, the relative position of the quadrangular corners is changing, as well as the height of the arches, and the shell is being drawn in either a Sinclastic shape or an Anticlastic one. The process is carried out by trying to simultaneously optimize the Surface Area of the shell, the covered area and the displacement values generated by a Finite Element Analysis using Karamba plugin.
As the material to run the FEA, Concrete was used and not a mixture of clay and sand which is the material we are planning to use for the construction. This choice has two main reasons: the first one being that the final mix we are planning to use and its material properties are not defined yet; the second one, that these experiments are not focused on finding the FEA values of the final shell, but to test the relative structural performance of the potential candidates according to their geometry.
Curvature
Parameters
Pa X Coordinate = Range +(2 to10)
Pb Y Coordinate = Range +(2 to10)
Pc X Coordinate = Range +(2 to10) Y Coordinate = Range +(2 to10)
Catenary Arc Lengths L is growing by adding a number = Range (2.50 to 4)
Height H of the shell is changing by adding a number to the connecting arches = Range (1.01 to 1.10)
Curvature of the shell is defined by the direction of the gravitational force affecting the connecting arches = Range ({0,0,1} or {0,0,-1})
Settings
Wallacei x : Gen size 50 Gen count 50
Karamba FEA:
Shell thickness = 6 cm
Material = Concrete
Load condition = Self-weight
Extracted value = Maximum displacement
FO1 fittest: Min. Displacement
Displacement: 0.014 cm
Covered Area: 4.47 m2
Shell Surface Area: 6.51 m2
FO2 fittest: Covered Area
Displacement: 0.051 cm
Covered Area: 10 m2
Shell Surface Area: 13.20 m2
FO3 fittest: Min. Surface Area
Displacement: 0.0147 cm
Covered Area: 4.19 m2
Shell Surface Area: 6.03 m2
Average of fitness rankings 0
Displacement: 0.038 cm
Covered Area: 10.13 m2
Shell Surface Area: 13.03 m2
Pareto front solution 1
Displacement: 0.048 cm
Covered Area: 8.84 m2
Shell Surface Area: 17 m2
Pareto front solution 2
Displacement: 0.046 cm
Covered Area: 9.89 m2
Shell Surface Area: 12.70 m2
Average of fitness rankings 0
Displacement: 0.038 cm
Covered Area: 10.13 m2
Shell Surface Area: 13.03 m2
Results
Having a generation count of 50 with 50 solutions per generation, this experiment generated 2500 possible solutions. To better understand the results of this first experiment we extracted 6 different solutions, the one with the lowest displacement value, the one with a covered area closer to 10 m2, the one with the smallest shell surface area, the average solution for all 3 fitness objectives, and two pareto front solutions. By looking at the six extracted solutions, we can see all of them have an anticlastic shape, that the displacement value ranges between 0.014 cm and 0.051 cm, and the shell surface area varies between 6.03 m2 and 17 m2. In order to have a clearer idea on how the shape could affect the structural performance of the shell we ran a second experiment evaluating the compression instead of the displacement.
Lowest Shell Surface Area Covered Area closest to 10 m2 m2
Polygon Points Relative Position Catenary Arch Height Sinclastic or Anticlastic min.
Compression Lowest Compression
EXPERIMENT 2 Goal
04 - 4.2
For the second experiment, the goal was to find the shell geometry that was working the most efficiently in terms of compression, for a 10 m2 covered area and a 6 cm thickness, to compare the results with those obtained in Experiment 1.
Conditions
The conditions of this second experiment remain the same as in the first one, with the exception of the value extracted from the FEA.
The relative position of the quadrangular corners is changing, as well as the height of the arches, and the shell is being drawn in either a Sinclastic shape or an Anticlastic one. Throughout the experiment, the Surface Area of the shell, the covered area and the compression values generated by a Finite Element Analysis using Karamba plugin for Grasshopper are trying to be simultaneously optimized.
The selected material for the FEA, in this experiment is also Concrete, as the aim of this experiment is also to test the relative structural performance of the potential candidates according to their geometry.
Parameters
Pa X Coordinate = Range +(2 to10)
Pb Y Coordinate = Range +(2 to10)
Pc X Coordinate = Range +(2 to10) Y Coordinate = Range +(2 to10)
Catenary Arc Lengths L is growing by adding a number = Range (2.50 to 4)
Height H of the shell is changing by adding a number to the connecting arches = Range (1.01 to 1.10)
Curvature of the shell is defined by the direction of the gravitational force affecting the connecting arches = Range ({0,0,1} or {0,0,-1})
Settings
Wallacei x : Gen size 50 Gen count 50
Karamba FEA:
Shell thickness = 6 cm
Material = Concrete
Load condition = Self-weight
Extracted value = Maximum Compression
FO1 fittest: Min. Compression
Compression Stress: - 0.0083 kN/cm2
Tension Stress: 0.1110 kN/cm2
Covered Area: 6.57 m2
Shell Surface Area: 10.95 m2
FO2 fittest: Covered Area
Compression Stress: - 0.0416 kN/cm2
Tension Stress: 0.2020 kN/cm2
Covered Area: 10 m2
Shell Surface Area: 13.45 m2
FO3 fittest: Min. Surface Area
Compression Stress: - 0.0274 kN/cm2
Tension Stress: 0.0736 kN/cm2
Covered Area: 4.27 m2
Shell Surface Area: 6.00 m2
Average of fitness rankings 0
Compression Stress: - 0.0137 kN/cm2
Tension Stress: 0.1220 kN/cm2
Covered Area: 9.89 m2
Shell Surface Area: 14.42 m2
Pareto front solution 1
Compression Stress: - 0.0456 kN/cm2
Tension Stress: 0.1830 kN/cm2
Covered Area: 8.05 m2
Shell Surface Area: 10.53 m2
Pareto front solution 2
Compression Stress: - 0.0328 kN/cm2
Tension Stress: 0.2030 kN/cm2
Covered Area: 10.20 m2
Shell Surface Area: 13.10 m2
Average of fitness rankings 0
Compression Stress: - 0.0137 kN/cm2
Tension Stress: 0.1220 kN/cm2
Covered Area: 9.89 m2
Shell Surface Area: 14.42 m2
Results
For the second experiment we also extracted 6 different solutions according to the same criteria chosen for Experiment 1, the one with the lowest displacement value, the one with a covered area closer to 10 m2, the one with the smallest shell surface area, the average solution for all 3 fitness objectives, and two Pareto front solutions. Here the results show us that the sinclastic shell is the one performing the best in terms of compression stress. The compression stress value ranges between - 0.0083 kN/cm2 and - 0.0456 kN/cm2, and the shell surface area varies between 6.00 m2 and 14.42 m2. Apart from the minimum compression fittest solution and the Average 0 solution, the rest of the extracted solutions show anticlastic shells. Given these results we decided to work with both sinclastic and anticlastic modules for Experiment 3, taking the parameters of the Experiment 1 Average 0 solution and changing its curvature to make it either sinclastic or anticlastic.
Rotation
position of the Mirror Plane
EXPERIMENT 3 Goal
04 - 4.3
Having generated a structural shell module that can change between an anticlastic and a sinclastic shape, the idea of this experiment is to understand the possible search space emerging from applying subsequent mirroring operations on those modules to define a 60 m2 house. The aim being to have a set of housing solutions to choose from according to their position regarding the sun and the predominant wind direction. Trying to maximise the shadow it projects on the ground, to minimize the surface area perpendicular to the predominant wind direction and to reach a compact configuration, where a bigger central space is achieved, and linear arrangements are avoided. The reason for trying to achieve this central space is that the nomadic houses are divided in a bigger space for cooking and social activities of the family, and a smaller area where the dwellers sleep, separated from the social space via a screen. A central public space would allow for the house to grow on its edges by adding more private spaces to sleep.
Conditions
Throughout this experiment, the rotation angle of the initial module is changing, as well as the relative position of the mirror plane. The mirror operation is performed twice alternating between sinclastic and anticlastic shells to create a 3 modules unit, which is then again mirrored according to a changing plane position. The result is a six modules house which is being evaluated by the genetic algorithm scripted with Wallacei x plugin for Grasshopper.
Parameters
Initial Module Rotation = Range (0 to 359ª)
Mirror plane 1 = Range (0 to 3)
Mirror plane 2 = Range (0 to 2)
Mirror plane 3 = Range (0 to 7)
Settings
Wallacei x : Gen size 50
Gen count 100
Size of search
Space 3.5 e5
Mirror 1 Mirror 2
Mirror 3
FO1 fittest: Footprint Compacity
Area Exposed to SSW wind: 74.60 m2
Aproximate Shaded Area: 17.33 m2
FO2 fittest: Max. Shadow
Area Exposed to SSW wind: 89.43 m2
Aproximate Shaded Area: 39.11 m2
FO3 fittest: Min. Area Exposed to SSW wind
Area Exposed to SSW wind: 49.06 m2
Aproximate Shaded Area: 25.77 m2
Relative Difference btw rankings 0
Area Exposed to SSW wind: 62.36 m2
Aproximate Shaded Area: 25.77 m2
front solution 1
Area Exposed to SSW wind: 61.90 m2
Aproximate Shaded Area: 21.77 m2
front solution 2
Area Exposed to SSW wind: 64.55 m2
Aproximate Shaded Area: 20 m2
Pareto
Pareto
Relative Difference btw rankings 0
Area Exposed to SSW wind: 62.36 m2
Aproximate Shaded Area: 25.77 m2
Results
Having a generation count of 100 with 50 solutions per generation, this experiment generated 5000 possible solutions. To evaluate them, we extracted 6 individuals, the one performing the best in terms of compacity, the one with the maximum shadow casted on the ground, the one with the minimum Area Exposed to the SSW wind, the one with the lowest relative difference between fitness criteria and two Pareto front solutions. The extracted solutions show us two main ways of grouping the modules, a linear configuration and a V-shaped configuration with different sizes and conditions for the central space contained. Even so, the variation between the V-shaped solutions does not seem very big. We can see that the set of possible solutions is pretty narrow when working with the repetition of the same module. For this reason, we decided to run a fourth experiment for a triangular based module, in order to have more than one type of volume to combine in the generation of the house morphology.
Lowest Shell Surface Area
Covered Area closest to 10 m2
Lowest Distance Between arches
EXPERIMENT 4 min. Displacement
Lowest Displacement Value m2 min.
Tension
Lowest Tension
Stress Value
Catenary base size Catenary Arches Relative Position Sinclastic or Anticlastic
04 - 4.4
Goal
For the fourth experiment, the goal was to find the shell geometry of a triangular base that was working the most efficiently in terms of displacement, for a 10 m2 covered area and a 6 cm thickness.
Conditions
For this experiment, three catenary arches are joined together to form a shell within a triangular boundary. The size of the arches base is changing, but their arc length remains the same, therefore changing their shape between a wider and flatter arch and a higher and narrower one. The relative position of the arches is also changing, and the shell is being drawn in either a Sinclastic shape or an Anticlastic one. Throughout the experiment, the Surface Area of the shell, the covered area, the distance between arches and the displacement and tension values generated by a Finite Element Analysis using Karamba plugin for Grasshopper are trying to be simultaneously optimized.
The selected material for the FEA, in this experiment is once again Concrete, as the aim of this experiment continues to be to test the relative structural performance of the potential candidates according to their geometry.
Parameters
Base size of the arches (LA) is scaling down by a factor = Range (0.5 to 0.95)
Catenary Arc Lengths (LB) remains constant = 6.5 m
Curvature of the shell is defined by the direction of the gravitational force affecting the connecting arches = Range ({0,0,1} or {0,0,-1})
The relative position of the Arches is changing by moving the position of their center points (PA; PB; PC) = Range (0.15 to 0.85)
Settings
Wallacei x : Gen size 50 Gen count 50
Karamba FEA:
Shell thickness = 6 cm
Material = Concrete
Load condition = Self-weight
Extracted value = Maximum displacement = Maximum tension stress
FO1 fittest: Covered Area
Displacement: 0.038 cm
Max. Tension: 0.070 kN/cm2
Covered Area: 10 m2
Shell Surface Area: 20.03 m2
FO2 fittest: Min. Surface Area
Displacement: 0.036 cm
Max. Tension: 0.156 kN/cm2
Covered Area: 11.68 m2
Shell Surface Area: 13.50 m2
FO3 fittest: Min. Displacement
Displacement: 0.014 cm
Max. Tension: 0.044 kN/cm2
Covered Area: 11.10 m2
Shell Surface Area: 16.81 m2
FO4 fittest: Min. Tension
Displacement: 0.020 cm
Max. Tension: 0.035 kN/cm2
Covered Area: 11.46 m2
Shell Surface Area: 16.51 m2
FO5 fittest / Average 0
Displacement: 0.038 cm
Max. Tension: 0.073 kN/cm2
Covered Area: 10.59 m2
Shell Surface Area: 24.12 m2
Pareto front solution 1
Displacement: 0.021 cm
Max. Tension: 0.085 kN/cm2
Covered Area: 11.52 m2
Shell Surface Area: 16.88 m2
FO5 fittest / Average 0
Displacement: 0.038 cm
Max. Tension: 0.073 kN/cm2
Covered Area: 10.59 m2
Shell Surface Area: 24.12 m2
Results
Having a generation count of 50 with 50 solutions per generation, this experiment generated 2500 possible solutions. To better understand the results of this first experiment we extracted 6 different solutions, the one with with a covered area closer to 10 m2, the one with the minimum surface area, the one with the lowest displacement value, the one with the lowest tension, the average solution for all 5 fitness objectives, and one pareto front solution.
The results from this experiment show us that the anticlastic shapes are working better structurally than the sinclastic ones and that the fitness objectives are being equally addressed by having catenary arches of the same dimensions on all three sides.
04 - 4.5
CONCLUSIONS These module experiments gave us a better understanding of how the shell structural performance was being affected by its curvature direction, sinclastic or anticlastic, and by the catenary arches dimensions and relative position. From the first attempt to combine the modules to generate a 60 m2 we understood we needed different modules in order to increase the variation between our solutions and to better differentiate the spaces inside the house.
The average 0 solutions in the shell experiments show a balanced equalization between the different objectives we were aiming to fulfil, and could work as base modules to modify in order to get to a housing design.
04- 5
BIO-SHOTCRETE APPLICATIONS
Aerial Coverage Path Planning
The origin of Bio-shotcrete is rooted in the formulation of a suitable material mixture and application sequence, robotic tooling strategy, and the development of precise robotic actions; These actions must be carefully calibrated to achieve surface adhesion and consistent crust forming.
We focused on computationally investigating drone spraying actions to have a clearer idea about their possibilities and limitations since it’s a new field still widely unexplored.
DRONE TRAJECTORY PLANNING
04 - 5.1
This experiment applies Graph Theory towards mesh geometry exploration and uses it in coverage path planning (CPP) for aerial bio-shotcrete. An advanced algorithm is used to compute the minimum spanning path for the mesh graph, which is then developed into a trajectory for drone spraying. The resulting flight path is to be converted into custom-formatted instructions for the vehicle, allowing for an automatic flight mode.
Goal Settings
The purpose of this experiment is to address simple geometric flight patterns for drone bio-shotcrete, considering the vehicle’s motion restrictions while covering the entire target environment with energy efficient paths.
Path algorithms are used on the base geometries, creating subsequent stripes based on the naked edges of the geometries. Two different CPP approaches are explored by either defining the edges as separate curves or as a single continuous polyline.
Method 1: Edges as one polyline
Method 2: Edges as 4 curves
Parameters
Trajectory type Spiral from bottom to top from bottom to top
Flight patterns are generated according to pre-defined restrictions by the latest research on aerial bioshotcrete. A few parameters are crucial for optimum drone actions, and they need to be kept within certain ranges.
It was concluded in that research that the distance to surface appeared to allow dramatic variations in values without affecting performance, while the ideal speed of 80cm/s of the drone spray is crucial for an optimum result.
Method 1
Software: Ivy
The diagrams show different mesh divisions after applying a modified Kruskal’s algorithm to get the minimum spanning path based on the two previously explained methods. The resultant divisions are the main setup for CPP generation.
Method 2
Continious Stripes
Segmented Stripes
The diagrams on the next page show two different CPP patterns generated within the recommended parameters in which the distance to surface is set to 20 cm in order to minimize path length, and the tilting angle is set to 10o to be suitable for both spraying and blowing actions.
Each point along the path (waypoint) represents a navigation command to the vehicle, such as take-off or move to a specific location, and contains information about the orientation, latitude, longitude, and altitude. The two displayed patterns consume energy differently derived by their path length, time to complete a mission and number of turning manoeuvres.
Mesh Division
CPP Generation
CPP 1
CPP 2
Back and Forth Pattern- From bottom to top
Spiral Pattern- From bottom to top
Evaluation
The two resultant Spiral and Back and Forth patterns are evaluated based on their structural and energy efficiency.
CPP 1
Uniform load distribution
Path length
Mission time
No. of turning manoeuvres
CPP 1
Uniform load distribution
Path length
Mission time
No. of turning manoeuvres
Mission time is calculated assuming the drone speed is consistently 80 cm/s.
Results
Although the spiral pattern has a greater potential to distribute material loads on the fabric formwork homogeneously, it shows poor results in terms of energy consumption. This can be referred to how drones operate as they need to decelerate, rotate, and accelerate every time they perform manoeuvres, resulting in significantly increased time and energy consumption. On the other hand, the back and forth pattern shows a promising energy-aware performance; however, it poses the risk of a structure-collapse due to non-uniform load distribution.
CONCLUSION
- 5.2
Based on evaluation results, the use of multiple drones seems appropriate to guarantee a homogeneous material application while adopting efficient back and forth patterns for the different structures.
It must be noted, however, that though using drones in Bio-shotcrete actions can guarantee a more efficient use of materials, a coherent distribution, a precise spraying sequence, and a reduced construction time, the findings of our research seems too complex to be applied by local inhabitants for an even more intricate housing configuration. It is worth mentioning that this technique is still under investigation and most precedents were developed as exploratory experiments in a scientific environment; They required very highly skilled engineers and drone professionals to guarantee a successful bio-shotcrete application.
Therefore, we leaned towards replacing drones with human labour based in the settlement, providing them with equipment needed and guiding them through the bio-shotcrete logics and requirements. We believe this approach would offer new jobs for the displaced persons and increase their feeling of belonging to their new houses.
Physical tests are to be further investigated in the MArch phase in order to generate a precise map those inhabitants can follow, one that is customized for human bio-shotcrete application with precise information detailing the suggested mixtures, matter flow, trajectories, distance to surface and machine specs.
Warka Tower as a primitive
04 - 6 WATER HARVESTING TOWER
Form-finding
This set of experiments explores the relationship between form and collection performance concerning different water harvesting strategies, through the use of evolutionary computation principles.
The purpose of these experiments is to generate an optimized morphology and structural system while increasing the performance according to the changing seasonal patterns that cause different weather conditions. The aim is to achieve an optimized morphology capable of responding differently to the changing weather conditions.
The initial form-finding process for the Water harvesting tower design begins from the Warka Tower’s morphology and structure. We will divide this project designed by Architecture and Vision into three main body parts in a vertical way and conduct a series of experiments to maximize the water harvesting performance on each one of them according to their capacity to harvest water in the different seasonal patterns. The top part will be maximized for Rain water collection, the middle part for Fog harvesting and the lowest section for structural foundation and dew harvesting.
Workflow
The following workflow shows the changing parameters with which we aim to achieve the best shape possible in each different weather scenario. The two main aspects to be considered when designing a water harvesting tower are function and form, which we will try to optimize through the experiments
FIG 02 - 2.1.1
Daily water requirements for livestock during dry season
- 6.2 Experiment 1 WATER HARVESTING TOWER
Goal The purpose of this first experiment is to find the most suitable form to maximize the collection capacity for each one of the different water sources, as well as to understand the structural correlation with these optimal geometries. Furthermore, we are trying to understand the relationship between these best-performing tower forms and the transition from one geometry to the other according to the change in the seasonal patterns. This way, trying to design a responsive tower adapting to the weather conditions as efficiently as possible. Regarding these prevailing seasonal weather conditions, it is necessary to combine different strategies to collect water from Rain, Fog, and Dew, respectively. Maximizing the catchment area, and surface area of the mesh to achieve the daily required amount of water by combining all three water sources.
Conditions When it comes to assuming that each Water Harvesting Tower should support two houses with 12people, it should collect up to 200 litres of water per day to guarantee 15 litres of minimum safe water per person. The first chart shows the potential amount of water we can collect per m2 per day along one year, followed by the highlighted predominant water source in each month. This way, we started to focus on maximizing the most abundant water source for each season to achieve a better water collection performance.
The amount of water that can be harvested from rain is dominant during the rainy season from March to May and from September to November, and even during the few rain events occurring during the dry season. Just by increasing the ability to collect the rainwater, we can expect to meet the least amount of general water requirement. Hence, our primary goal for designing a tower would be to maximize the rainwater collection.
From June to August, it is possible to harvest much more water from fog to fulfil the daily required amount during the dry season. The wind rose on the site can be one of the parameters to affect the design morphology, by maximizing the exposure area in the predominant wind direction.
We can expect to harvest some water from dew during the dry season, going from December to February. However, since the amount of water obtained from dew is very low, it is unlikely that much it will have much weight on our strategy.
FIG 02 - 2.1.1
Daily water requirements for livestock during dry season
Dew Fog Rain
Result
Conclusion
The experiment was conducted to run for 50 generations with 50 individuals in each generation, generating 2500 possible solutions. To better understand the results of this first experiment, we extracted six different solutions, the one with the highest Rainwater & Dew harvesting, the one with the highest Fog harvesting, the one with the minimum number of poles and nodes, the average solution for all fitness objectives and two Pareto front solutions.
The results show us some critical problems. First of all, the body parts were not integrated at all in terms of maximizing the water collection performance from different water sources, that is, it was not easy to see as a single uniform sectional shape overall. Besides, the initial goal was to maximize the area of the mesh in the direction where the wind is dominant to collect much more water from the atmosphere. However, this makes the overall shape more complicated, which makes it harder to fabricate the tower on site. Since the above problems can cause severe issues and defects in dealing with structural performance in the future, it was necessary to adjust this part for further experiments.
- 6.3
TOWER
Goal
Conditions
For the second experiment, the goal is to find the refined geometry that can work efficiently in terms of structure in our site. Since Maximizing the Dew harvesting performance largely affects the overall form, but has a lower impact in the water collection, this experiment aims to exclude those transformations and to focus on the structural performance related to the rain and fog collection in more detail.
Other Factors that determine form and structure include the limited length of materials and climate conditions, limiting the size of the surface area and height of the overall morphology. The existing Warka Tower is made of bamboo, but it is not easy to get that material within our site due to different site conditions. We are expecting to build the tower using wooden acacia branches and roots of approximately 500mm long. Therefore, it is crucial to build a structured system with a minimum number of joints, which performs as a self-supporting structure.
On the other hand, there is also a relatively heavy wind load throughout the year, which is expected to be one of the structural design considerations. Since the wind load in the site is almost twice higher than that of the existing site conditions where the Warka Tower is placed, it can be proposed to consider the design to maximize the height only when the fog collection is performed.
FIG 02 - 2.1.1 Daily water requirements for livestock during dry season
- 6.3 Experiment 2 WATER HARVESTING TOWER
Tower Structural Capacity
Tower Structural Capacity
Warka Tower Wind resistance Analysis
To understand the resistance against wind pressure, we first analyzed the degree of deformation from the structure of the Warka Tower. When it comes to assuming that structural analysis is carried out on our site, the predominant wind pressure coming from the Southwest was set at 0.5kPa, and an average length of the elements was 32.5cm. Here the result shows us that the maximum displacement was 3.22mm.
Pareto front solution Wind resistance Analysis
Furthermore, we analyzed the two Pareto front solutions obtained from Experiment1. There were maximum displacements with 8.83mm and 19.70mm, respectively. The result shows the first solution performed better, which has a longer average length of the elements with having a uniform sectional curvature in terms of resisting against the wind.
Therefore, the aim is to find a beam structure covering up to 500mm average length of the elements and the lowest possible displacement.
Result The experiment was conducted to run for 50 generations with 50 individuals in each generation, generating 2500 possible solutions. To better understand the results of this second experiment, we extracted six different solutions. The outcomes include the one with the highest Rainwater harvesting and Fog harvesting, the one with the minimum number of poles, the one with the lowest displacement, the average solution for all fitness objectives and one Pareto front solutions.
Conclusion
The results show us that the one with the smallest average length of the elements and the shortest height is performing the best in terms of resisting against the predominant wind load. The revised fitness objectives for the 2nd experiment substantially constrained the size of the morphology in terms of structural performance, while at the same time maximizing the water harvesting performance. The best-ranked individual of the average of fitness ranks among the given solutions is expected to potentially harvest daily required water while structurally stable against wind and material aspects.
Final water harvesting Tower The selected water harvesting tower can store up to 5,000L in the water tank, and we are expecting the settled people to be able to use the water not only for basic hygiene but also elevating their life - style.
HOUSING CONSTRUCTION SEQUENCE ..................................................................................
TOWER CONSTRUCTION SEQUENCE ......................................................................................
05 - 1 HOUSING DESIGN
Shell rationalization and typological development
05 - 1.1 SHELL
RATIONALIZATION
After running modular experiments on shell structures we decided to take the average solutions from those experiments and rationalize them to get four different types of modules, two of them with a quadrangular base and the other two with a hexagonal one.
The quadrangular ones are both sinclastic shells, and they have a base of 4.40 x 4.40 metres with chamfer edges of 0.80 metres where they meet the ground. Both shells are achieved by using two types of arches. The A Arch has a 3.30 m base and a free height of 2.67 m. The B Arch on the other hand has a 3.26 m base and a height of 1.24 m in the middle.
Shell 1 is achieved by combining one A Arch with three B Arches, whereas Shell 2 is generated by placing two A arches perpendicular to one another on one vertex and two B arches perpendicular to one another on the opposite one. B arches are closed with a vertical panel of 0.5 metres high and a curved window on top of it. Shell 1 is meant to be used as a sleeping space connected to the central space of the house, while Shell 2 is meant to function as an expansion of the sleeping area, connecting the central space with Shell 1.
The hexagonal ones are made out of three A arches rotated at a 60 º angle from one another, and three supports of a 2.14 m long base connecting them.
Shell 3 is a sinclastic shell, reaching a maximum height of 3.20 metres at the middle, with three semi-circular openings, one on each support, at a 2.15 metre height each. Its height and morphology make it suitable to function as the central social space of the house. Shell 4 is an anticlastic shell, with a central vortex reaching the ground level via a 0.40 metre circular base. This shell reaches this morphology to become an open water-collection space to be used by the adjoining houses.
TYPLOGICAL VARIATION
05 - 1.2
The basic house is constructed by taking a Shell 4 and joining a Shell 3 on either side of the former. This is the starting point for a unit, having a single interior space of around 20 m2, with a low wooden division that separates the sleeping area from the living one. By adding a fence made out of branches on either one of the angles generated by both modules, a yard is constructed, where a few animals can be kept. This unit is big enough to accommodate one person.
If we add a Shell 1 sleeping module on either side of the central space in this house, a unit of around 30 m2 is constructed, being able to accommodate a couple.
With the addition of a second sleeping module on the remaining free side, the sleeping area is duplicated, therefore providing shelter for a small family with two children within a covered area of around 40 m2.
If the family was to have 6 people, a Shell 2 should be added on one side to expand the sleeping area reaching an interior space of approximately 50 m2. An additional yard to keep the animals could be built by adding a fence on the free space between the water collection module and the housing unit.
Single person
Couple
Small Family
Big Family
Dry Toilets
Finally the structure could house up to 8 people if a second Shell 2 was added to the smaller sleeping area, therefore reaching its maximum capacity, with a 60 m2 footprint. The open water collection module could be connected either to an additional permanent unit or to a temporary house during the dry season as well as to a canopy leading to the shared dry toilets.
Temporary Unit
Water Collection Space
HOUSING CONSTRUCTION PROCESS
Assembly Sequece and Material Application
Phase 1 The design logic developed for the final housing configuration aimed to provide a simple construction process in which each housing module can be constructed and assembled individually as a selfsupporting structure that is then joined together with its adjacent one, forming a continuous integrated shell at the end.
Fabrication would start from the water collection unit where foundations of wooden boxes filled with earth are installed and topped with a deployable wooden structure; This structure is composed of a number of deployable arches designed to support the edges of the various modules. Arches are further reinforced with either deployable beams for synclastic geometries or cables for anticlastic ones, shaping and supporting the fabric formwork fixed above. Additionally, the edges of these arches are designed to coincide and joined when put together.
The design of the deployable system is based on the use of identical, straight short wooden members made from the available tree branches. The number of these members is to be further optimized to generate a steady structure with a minimal amount of wood to reduce its weight and facilitate its folding and expansion properties.
HOUSING CONSTRUCTION PROCESS
Assembly Sequece and Material Application
Phase 2 In a permeant situation, bio-shotcrete is to be then applied on the final house to generate a single surface allowing for the grass mats to join the different housing units together and to minimize the gaps in between. After clay layers are dry enough, the structure can be folded and removed from below to be stored till used again.
Phase 2
Construction sequence of house modules and Drone bio-shotcrete
WATER HARVESTING TOWER CONSTRUCTION PROCESS
Assembly Sequece and Material Application
The illustration shows a series of construction sequences of the Water Harvesting Tower. The aim is to provide a simple construction process in which each tower module can be fabricated and assembled individually. Residents carry out a set of processes, in which they would fabricate each body part with local materials and carry them by hand until placing them on the base. Once the elements are put together, the tower needs to be assembled and attached to the stabilizing cables.
FINAL CLUSTERING ..................................................................................................................
06 - 1 CLUSTER EXPERIMENTS
Shell rationalization and typological development
16 - 20 houses per cluster
1 water collection space per house or every 2 houses
4 houses
By zooming into our settlement we get to a Cluster scale, where a small group of houses is interacting with the water harvesting towers. To define this Cluster Scale we are working according to the parameters set by the UNHCR with 16 to 20 houses per cluster. In our housing logic, 1 water collection space is shared between 1 to 2 houses. For the cluster scale, and to provide additional water to go through the dry season, 1 water tower is added every 4 houses.
As an initial cluster definition, we set a multi-objective optimization experiment in which we were connecting the houses with a covered pathway of deployable arches and fabric that determine the distance and relative position of the houses and therefore the total footprint of the cluster.
Number of connecting modules
Relative position of the connecting modules
Distance between 2 sub-clusters
Maximize Shaded Surface Area
CLUSTER EXPERIMENT
SETUP Goal
06 - 1.1
Minimize Footprint
Keep 100 m between Towers
The aim of this experiment is to explore different possible cluster configurations emerging from the interaction between housing units, where the shaded area on the ground is maximized, the footprint is minimized and the distance between towers is kept around a 100 metres distance.
Conditions
Throughout the experiment, the number of connecting modules is changing between 3 and 5, as well as their relative position, generating either a linear arrangement or a broken one with 90 degrees connections going to one side or the other. Once a group of 8 houses has been created the towers positions are located by finding the connection module equidistant to a group of 4 houses. This group of 8 houses and 2 towers is duplicated and rotated 180º to generate a second sub-cluster. The final position of this second group is determined by moving it in the direction of the catchment pool. The distance between the first and second half of the Cluster is changing throughout the experiment. The process is carried out by trying to simultaneously optimize the shaded surface area on the ground, the minimum footprint and a
distance between towers as close to 100 metres as possible.
The whole experiment is carried out using Grasshopper for Rhino as a modelling tool, and the multi-optimization plugin Wallaceix to generate different possible solutions coming from the combination of parameters, and to evaluate the results.
Settings
Wallacei x : Gen size 20 Gen count 31
FO1 fittest: Maximum Shadow
Shortest distance between towers: 25 m
Longest distance between towers: 105.21 m
Cluster Footprint Area: 2015.50 m2
Shortest distance between towers: 53.38 m
Longest distance between towers: 117.80 m
Cluster Footprint Area: 1992.94 m2
FO2 fittest: Minimum Footprint
Shortest distance between towers: 48.62 m
Longest distance between towers: 126.84 m
Cluster Footprint Area: 1992.94 m2
Shortest distance between towers: 25 m
Longest distance between towers: 105.21 m
Cluster Footprint Area: 2015.50 m2
Top View
Isometric View
Isometric View Top View
Pareto front Solution 1
Top View
Isometric View
Pareto front Solution 2
Isometric View
Top View
Average of fitness rankings 0
Shortest distance between towers: 42.71 m
Longest distance between towers: 93.37 m
Cluster Footprint Area: 1992.94 m2
Results
Having a generation count of 31 with 20 solutions per generation, this experiment generated 620 possible cluster configurations. To better understand the results of this first cluster experiment we extracted 5 different solutions, the one casting maximum shadow on the surface, the one with the minimum footprint, the average solution for all 3 fitness objectives, and two pareto front solutions. The results show us 2 main families of cluster typologies. The first one generates two centralized groupings of 8 houses, where the towers are enclosed in an open space surrounded by houses. The second one creates a configuration made out of two more linear arrangements, where the towers are at the extremes of the cluster.
Isometric View
- 1.2
CONCLUSIONS Even if this first experiment gives us an idea of how a cluster can be formed starting from the housing units, the scale of this configurations is still too small compared to the total scale of the settlement. Therefore, the setup should be revisited in order to have information flowing from the settlement scale that can inform the cluster generation process, such as networks, distance to administrative centers, etc.
FUTURE CLUSTER EXPERIMENTATION
06 - 1.3
In the March phase this process will be reconfigured to run additional cluster experiments, aiming to generate a set of solutions that can be distributed inside a block to test the interaction between clusters according to the block conditions: network distribution, water catchment area, agricultural area, distance to the administrative centre, and distance to neighbouring blocks.
The goal of further experiments would be to reach a better integration between the cluster scale and settlement scale through block scale experiments. This would allow for the generation and performance of the clusters to be directed by the water availability and the connection network present in a particular block.
AERIAL VIEW OF A CLUSTER
View shows the arrangement of the housing clusters in relation to the water harvesting towers
VIEW OF WATER COLLECTION POINT OF THE HOUSE
View shows the water collection point of the housing modules also indicates the temporary and permanent structures and their spatial organisation.
VIEW OF THE INTERNAL SPACES OF THE HOUSING UNIT
View shows the spatial qualities of the living areas of the housing unit as well as the openings, providing ventilation and natural lighting.
07. DESIGN ASSESSMENT
HOUSING WATER CATCHMENT ANALYSIS...............................................................................
07- 1 HOUSING WATER CATCHMENT ANALYSIS
RAINWATER COLLECTION
In order to assess the efficiency of rainwater catchment of the designed water collection units, we used flow projection analysis on the different configurations the water unit is connected to throughout the cluster. Four different types are analysed in which the water unit is attached to either synclastic connection modules or central living spaces of the houses, or in some cases both of them together.
Assessment
Software: Groundhog plug-in for grasshopper
In Type A, the collection efficiency is 2 % , this value represents a percentage of the lines flowing inside the central party of the water unit, to the overall number of flowlines. These types can collect a yearly average of 16 litre a day.
In Type B, the efficiency increases to 5% and they can collect an average of 40 litre per day yearly.
The assessment results necessitate the importance of a parametric design for the water unit and its surrounding forms in which their dimensions and inclination angles can change in order to optimize the collection efficiency when put together as much as possible. As these units alleviates the pressure on the water towers and provide water for dwellers right into their houses, their design should be more carefully revised.
Type A
Type B
08. CONCLUSION
CONCLUSION
According to our research, there is a growing population of displaced people having to abandon their homes due to climate change. With increasing global temperatures and changes in the precipitation patterns, water sources are getting smaller and more polluted, especially in Sub-Saharan Africa. The potential water collection estimations show us there is a potential for the design and construction of a resilient community capable of providing shelter for refugees, pastoral nomads and agro-pastoralists, combining a mixture of temporary and permanent structures using local materials and local labour. This could help tackle the negative effects climate change is bringing to rural communities in Eastern Africa
1-United Nations World Water Development Report 2019 Leaving No One Behind. (Place of publication not identified: UNITED NATIONS EDUCATIONA, 2019).
2-“JMP,” accessed July 22, 2020, https://washdata.org/data/household#!/eth.
3-“Rural Population (% of Total Population) - Ethiopia | Data,” accessed October 2, 2020, https://data.worldbank.org/indicator/SP.RUR.TOTL.ZS?locations=ET.
4-United Nations High Commissioner for Refugees, “Climate Change and Disaster Displacement: An Overview of UNHCR’s Role,” UNHCR, accessed October 2, 2020, https://www.unhcr.org/protection/environment/5975e6cf7/climate-change-disasterdisplacement-overview-unhcrs-role.html.
5- “ETHIOPIA COUNTRY REFUGEE RESPONSE PLAN 2019”
6-“Ethiopia HUMANITARIAN NEEDS OVERVIEW 2019”.
7-Yingqun Zhang et al., “Identifying Urban Structure Based on Transit-Oriented Development,” Sustainability 11, no. 24 (December 17, 2019): 7241, https://doi. org/10.3390/su11247241.
9-Watkins, Kevin at el., Beyond scarcity: power, poverty and the global water crisis, Human Development Report 2006, New York, United Nations Development Programme (UNDP), 2006, 36
10- Richard Wilson at el., One Wash National Programme: A Multi-Sectoral SWAp, Federal Democratic Republic of Ethiopia, November 2018, 37
11- Brian Reed and Bob Reed, “How much water is needed in emergencies”, World Health Organization, 2013, 1-2
12- D. Peden, Girma Tadesse and Mulugeta Mammo. Improving the Water productivity of livestock: An opportunity for poverty reduction, International Livestock Research Institute (ILRI), Addis Ababa, Ethiopia,3
13- Tesema Kebede, “CHARACTERIZING THE GROUNDWATER POTETIAL OF WABI SHEBELLE RIVER BASIN,” Civil and Environmental Engineering, n.d., 121.
14-Binyam, Alemu Yosef; and Kidane Asmamaw Desale. “Rainwater harvesting: An option for dry land agriculture in arid and semi-arid Ethiopia”. International Journal of Water Resources and Environmental Engineering 7, n.o 2 (February 28th 2015): 17-28.“Rainwater Harvesting in Arid and Semi-Arid Ethiopia.Pdf,” n.d.
15-Massimiliano Fazzini, Carlo Bisci, and Paolo Billi, “The Climate of Ethiopia,” in Landscapes and Landforms of Ethiopia, ed. Paolo Billi, World Geomorphological Landscapes (Dordrecht: Springer Netherlands, 2015), 65–87, https://doi. org/10.1007/978-94-017-8026-1_3.
16-Kassa Teka, “Household Level Rainwater Harvesting in the Drylands of Northern Ethiopia: Its Role for Food and Nutrition Security,” n.d., 15.
17-“Jmp-2019-Full-Report.Pdf,” accessed July 22, 2020, https://www.who.int/water_ sanitation_health/publications/jmp-2019-full-report.pdf.
18-Ali Akbar Salehi et al., “A Review on the Water-Energy Nexus for Drinking Water Production from Humid Air,” Renewable and Sustainable Energy Reviews 120 (March 2020): 109627, https://doi.org/10.1016/j.rser.2019.109627.
19 Juan de Dios Rivera, “Aerodynamic Collection Efficiency of Fog Water Collectors,” Atmospheric Research 102, no. 3 (November 2011): 335–42, https://doi.org/10.1016/j. atmosres.2011.08.005.
20- Carlos M. Regalado and Axel Ritter, “On the Estimation of Potential Fog Water Collection from Meteorological Variables,” Agricultural and Forest Meteorology 276–277 (October 2019): 107645, https://doi.org/10.1016/j.agrformet.2019.107645.
21-Girja Sharan, “Harvesting Dew with Radiation Cooled Condensers to Supplement Drinking Water Supply in Semi-Arid Coastal Northwest India” 6, no. 1 (2011): 21.
22-Eva Eriksson et al., “Characteristics of Grey Wastewater,” Urban Water 4, no. 1 (March 2002): 85–104, https://doi.org/10.1016/S1462-0758(01)00064-4.
23-Eric C. Leas, Anne Dare, and Wael K. Al-Delaimy, “Is Gray Water the Key to Unlocking Water for Resource-Poor Areas of the Middle East, North Africa, and Other Arid Regions of the World?,” AMBIO 43, no. 6 (October 2014): 707–17, https://doi. org/10.1007/s13280-013-0462-y.
24-V. Meera and M. Mansoor Ahammed, “Water Quality of Rooftop Rainwater Harvesting Systems: A Review,” Journal of Water Supply: Research and TechnologyAqua 55, no. 4 (June 2006): 257–68, https://doi.org/10.2166/aqua.2006.0010.
25-Designboom, 2019.
26-El Azzi and El Beyrouthy, 2015.
27- “WARKA TOWER – Warka Water”, 2016.
28-Sushree Mishra, 2016.
29-‘South Sudan Refugee Crisis: Aid, Statistics and News | USA for UNHCR’, accessed 30 September 2020, https://www.unrefugees.org/emergencies/south-sudan/.
30-‘Somalia Refugee Crisis Explained’, accessed 30 September 2020, https://www. unrefugees.org/news/somalia-refugee-crisis-explained/.
31-Gebremeskel Esayas Nigatu et al., “Pastoral Development in Ethiopia: Trends and the Way Forward, Washington DC”, World Bank Group, 2019, 1.
32-DFID’S Current and potential Engagement with Pastoralism: A scoping Study, natural Resources Institute, Morton, 2008, University of Greenwich.
33-THE WORLD BANK, “World Bank Boosts Support for Pastoralists in Horn of Africa”, March 18, 2014
34-International Organization of Migration, “Ethiopia National Displacement Report 5, Round 22,” July 2020.
35-Sara Ramdall, Where have all the nomads gone? Fifty years of statistical and demographic invisibilities of African mobile pastoralists, Pastoralism, 2015
36Andrea Rieger-Jandl, “Between Nomadism and Sedentarism,” n.d., 17.
39-“Aqal Somali,” Incoherent Thoughts... (blog), September 15, 2007, https://shafisaid. wordpress.com/2007/09/15/aqal-somali/.
40-Enrique Gutiérrez, Victoria Murtagh, and Eugénie Crété, Detailed Shelter Response Profile Ethiopia: Local Building Cultures for Sustainable and Resilient Habitats, 2018, 38.
41-Salihou Mamadou Alidou, Cross-border transhumance corridors in West Africa, CapEX Report, 2016, 2
42-“Vom Kreuzbogenzelt Zum Lehmbau Die Afar in Nordost-Äthiopien Zwischen Nomadentum Und Sesshaftigkeit - PDF Free Download,” accessed September 29, 2020, https://docplayer.org/4082428-Vom-kreuzbogenzelt-zum-lehmbau-die-afar-innordost-aethiopien-zwischen-nomadentum-und-sesshaftigkeit.html.
43-“Vom Kreuzbogenzelt Zum Lehmbau Die Afar in Nordost-Äthiopien Zwischen Nomadentum Und Sesshaftigkeit - PDF Free Download.”
44- International Organization for Migration, “Displacement Tracking Matrix (DTM) Somali, Ethiopia. Round 17,” August 2019.
45-International Organization of Migration, “Ethiopia National Displacement Report, Round 18,” October 2019.
46-“Ethiopia | Displacement,” accessed September 28, 2020, displacement.iom.int/ ethiopia#.
47-International Organization of Migration, “Ethiopia National Displacement Report 5, Round 22,” 19.
48- Chemin Moïse Duboule, “Profile of Internal Displacement : Ethiopia.,” Norwegian Refugee Council/Global IDP Project, November 27, 2001, 88.
49-“Situation Horn of Africa Somalia Situation,” accessed September 28, 2020, https:// data2.unhcr.org/en/situations/horn/location/172.
50-“Conflict and Drought Displace 300,000 in Somalia so Far This Year,” NRC, accessed September 28, 2020, https://www.nrc.no/news/2019/october/somaliadisplacement/.
51-Guido Ambroso, “Pastoral Society and Transnational Refugees: Population Movements in Somaliland and Eastern Ethiopia 1988- 2000,” UNHCR New issues in Refugee Research, no. 65 (August 2002): 35.
52-“Situation Horn of Africa Somalia Situation,” accessed July 20, 2020, https://data2. unhcr.org/en/situations/horn/location/174.
53-“New Camp Opened for Somali Refugees,” The New Humanitarian, July 26, 2007, https://www.thenewhumanitarian.org/news/2007/07/26/new-camp-opened-somalirefugees.
54-“Kebribeyah Camp Profile” (UNHCR, The Refugees Operational Portal, March 2018).
55- UNHCR, Shelter Design Catalogue, UNHCR Shelter and Settlement Section, January 2016, 51-53
56-“UNHCR - SITE MAP Kebribeyah,” accessed July 20, 2020, https://maps.unhcr.org/ en/apps/campmapping/index.html?site=ETHs000164.
57-UNOCHA, “Ethiopia 2020 Humanitarian Needs Overview,” January 2020.
58-International Organization of Migration, “Ethiopia National Displacement Report 5, Round 22,” July 2020.
59-“Kebribeyah Camp Profile” (UNHCR, The Refugees Operational Portal, March 2018).
60-“Vom Kreuzbogenzelt Zum Lehmbau Die Afar in Nordost-Äthiopien Zwischen Nomadentum Und Sesshaftigkeit - PDF Free Download,” accessed September 29, 2020, https://docplayer.org/4082428-Vom-kreuzbogenzelt-zum-lehmbau-die-afar-innordost-aethiopien-zwischen-nomadentum-und-sesshaftigkeit.html.
61-Enrique Gutiérrez, Victoria Murtagh, and Eugénie Crété, Detailed Shelter Response Profile Ethiopia: Local Building Cultures for Sustainable and Resilient Habitats, 2018, 38.
62-Belete Berhanu, Assefa M. Melesse, and Yilma Seleshi, “GIS-Based Hydrological Zones and Soil Geo-Database of Ethiopia,” CATENA 104 (May 2013): 21–31, https:// doi.org/10.1016/j.catena.2012.12.007.
63-Christian MASSUN et al., Soil Survey of the Wabi Shebelle Basin, vol. ETHIOPIAFRANCE COOPERATIVE.PROGRAM WABI SHEBELLE SURVEY, 1973.
64-Gutiérrez, Murtagh, and Crété, Detailed Shelter Response Profile Ethiopia: Local Building Cultures for Sustainable and Resilient Habitats, 23.
65-Andrea Rieger-Jandl, “Between Nomadism and Sedentarism,” n.d., 11.
66-Ib Friis, Sebsebe Demissew, and Paulo Breugel, “Atlas of the Potential Vegetation of Ethiopia,” The Royal Danish Academy of Sciences and Letters Biologiske Skrifter (Biol. Skr. Dan. Vid. Selsk.) (June 2010): 315.
67-Wondimagegn Mengist, “An Overview of the Major Vegetation Classification in Africa and the New Vegetation Classification in Ethiopia,” American Journal of Zoology 2, no. 4 (2019): 51–62, https://doi.org/10.11648/j.ajz.20190204.12.
69-H.N Le Houerou and M. Corra, “Some Browse Plants of Ethiopia,” in Browse in Africa (International Livestock center for Africa, 1980), 110.
70-Prussin, African Nomadic Architecture: Space, Place, and Gender, 30.
71-Maite Bravo, Stephanie CHALTIEL, and Wilfredo Carzas, “Matter-Robotic Calibration for Bioshotcrete,” Temes de disseny 34: 80-91., 2018.
72-Bravo, CHALTIEL, and Carzas, 3.
73-Stephanie CHALTIEL, Diederik VEENENDAAL, and Francesco VERZURA, “Terramia: Drone-Aided Construction for a Sustainable Biobased Housing Prototype,” in Form and Force, Proceedings of the IASS Annual Symposium 2019 – Structural Membranes 2019, 2019.
74-Bravo, CHALTIEL, and Carzas, “Matter-Robotic Calibration for Bioshotcrete,” 4.
75-CHALTIEL, VEENENDAAL, and VERZURA, “Terramia: Drone-Aided Construction for a Sustainable Biobased Housing Prototype.”
76-Stephanie Chaltiel and Maite Bravo, “Digital Fabrication Phasing for Monolithic Shells,” 2017, 10.
80-Hasila Jarimi, Richard Powell, and Saffa Riffat, “Review of Sustainable Methods for Atmospheric Water Harvesting,” International Journal of Low-Carbon Technologies 15, no. 2 (May 18, 2020): 253–76, https://doi.org/10.1093/ijlct/ctz072.
81-Rahman Davtalab, Alireza Salamat, and Ruhollah Oji, “WATER HARVESTING FROM FOG AND AIR HUMIDITY IN THE WARM AND COASTAL REGIONS IN THE SOUTH OF IRAN: WATER HARVESTING FROM FOG AND AIR HUMIDITY,” Irrigation and Drainage 62, no. 3 (July 2013): 281–88, https://doi.org/10.1002/ird.1720.
82-“Weather History Download K’ebrī Beyah,” meteoblue, accessed July 21, 2020, https://www.meteoblue.com/en/weather/archive/export/k%e2%80%99ebr%c4%abbeyah_ethiopia_333517.
83-“Climate K’ebrī Beyah.”
84-Jarimi, Powell, and Riffat, “Review of Sustainable Methods for Atmospheric Water Harvesting,” 12.
85-Ferreira, Filipa. «Water, Sanitation and Drainage». In Bioclimatic Architecture in Warm Climates, edited by Manuel Correia Guedes and Gustavo Cantuaria, 417-41. Cham: Springer International Publishing, 2019. https://doi.org/10.1007/978-3-03012036-8_16.
10. APPENDIX
In order to assess the efficiency of rainwater catchment of the designed water collection units, we used flow projection analysis on the different configurations the water unit is connected to throughout the cluster. Four different types are analysed in which the water unit is attached to either synclastic connection modules or central living spaces of the houses, or in some cases both of them together.