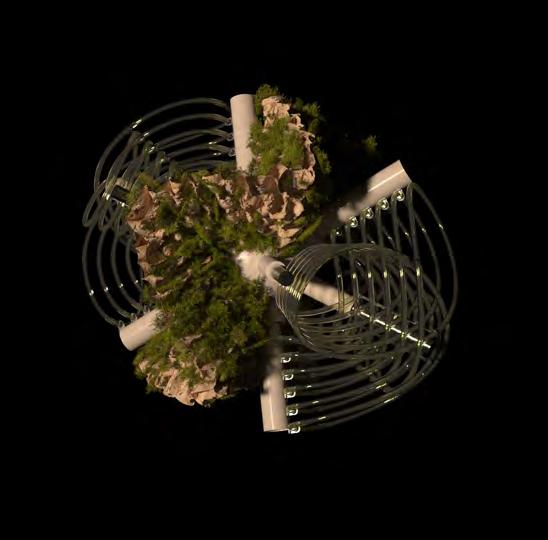
BIO_BOT

EMERGENT TECHNOLOGIES AND DESIGN
2021-2022
MSC. DISSERTATION
COURSE DIRECTOR
Dr. Elif Erdine
STUDIO MASTER
Dr. Milad Showkatbakhsh
STUDIO TUTORS
Felipe Oeyen, Eleana Polychronaki, Lorenzo Santelli
SUBMISSION DATE
September 23rd, 2022
SUBMISSION TITLE TEAM
BIO_BOT
Anastasiya Katliarskaya (MSc candidate) Ziyue Gao (MSc candidate) Anna Maria Oldakowski (MArch candidate) Manya Singhal (MArch candidate)
DECLARATION
“I certify that this piece work is entirely my own and that any quotation or paraphrase from the published or unpublished work of others is duly acknowledged”
SIGNATURES DATE
Anastasiya Katliarskaya Ziyue Gao
September 23rd, 2022
ABSTRACT
“An increasingly homogeneous biosphere, with silent forests, empty seas, a world with less diversity of sound, layers, textures, living colours, and perceptible differences, could be the landscape of the future.”1
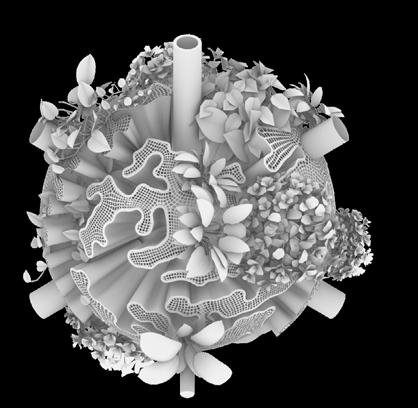
The fragmentation of the natural landscape and pollution caused by human activity accelerates the degradation of the ecosystems already hanging in precarious balance; under this domain, the research proposes a mitigating solution. The purpose of the project is to create a new green network that links existing green tissue and re-connects green spaces to London’s Green Belt. The network that has been established operates within the threshold of interstitial spaces, revitalising underutilised spaces into public spaces and enhancing the environmental conditions of existing ones. Composed of “bio-bot” modules, or ecological machine hybrids, it has a direct adaptability to be implemented in different spatial contexts, thresholds and environmental scenarios. Its migratory and transformable states of redeployment between different contexts create a participatory methodology within its functional distribution. The creation of four functional modules, for the purpose of filtration, production, collection and protection, is the emphasis of the research. Biological development of its material behaviour will be synergistic with the evolutionary design process employed to optimise morphological development of bio-bot modules while considering local environmental conditions. The system will define a new symbiotic and metabolic engagement through which the relationship between human participants and non-human species using living green tissue augments the existing environment. Implementation of constant monitoring will allow for variability of the formal organisations of the components to become new adaptive ecologies rather than infill strategies in situ.
INTRODUCTION
In the post Anthropocene era, as human awareness that their domination of the planet has led to destructive environmental distress, technology will play a fundamental reparative role in the coexistence with nature. In the architectural field, while many proposals operate under the guise of implementing landscape strategies for the purpose of rewilding, they fail to acknowledge or consider the urban context. In the proposed research, the project positions itself as environmentally adaptive to its context; identifying needs for filtration, collection, production, and protection within the specific context of interjection. These four key points emphasise what would be needed to reestablish its first cyclical loop in order to rebalance the relationship between the current built environment and the previously degraded natural green space. However, this multi-level problem cannot be addressed through a single instalment. Instead, the development of this new type of purifying and connective green tissue will establish constant feedback into the existing environment. A critical question that remains is whether it is possible to stitch back patches of disassociated land in order to provide continuity for species. If a requirement for the proof of system effectivity is its ability to harbour ecological habitat, then it must be designed as such.
This lack of awareness in ‘eco friendly’ carbon-absorbing materials used in the building industry has not been explored to sustain species within ecosystems- never having been conceived or manufactured to facilitate coexistence. “Pattern formation mechanisms play a critical role in organism development and survival, from embryonic development to the growth and maintenance of the organism.”2 Hence, it is important to prioritise that the growth of the system should be indicative of the biological growth of the materials implemented in order to inhibit the tendencies of containing nature; creating a suitable context for coexistence and interaction between human participants and non-human species. Therefore, “conversational partnering can manifest in the form of dynamic and intuitive relationships between the environment, active observers and performers within the system. This form of interaction constructs a framework to explore space as a model of interfacing that shifts the tendencies of passive occupancy of space towards an active and evolving ecology of interacting objects.”3 Thus, the engagement instils a new ecological responsibility for rewilding and social activity located within the third space. To this extent, ‘rewilding’ ceases as the process of nature taking over while humans withdraw, but becomes the new possibility of technology and nature coming together in mutualism.
• INTRODUCTION
• DOMAIN
• GREEN BELT
• ECOLOGICAL DEGRADATION
• FRAGMENTATION OF THE NATURAL LANDSCAPES
• HEAT-ISLAND EFFECT
• PUBLIC AND INTERSTITIAL SPACES
• GREEN NETWORK
• MATERIAL EXPLORATION
• SAW DUST
• LIVING TISSUE DEVELOPMENT
•
• GLOBAL SCALE - NETWORK
• MATERIAL SCALE
• LOCAL SCALE - ARCHITECTURAL SCALE
•
•
• DIFFUSION LIMITED AGGREGATION
• EVOLUTIONARY OPTIMISATION
• DIFFERENTIAL GROWTH
• ROBOTIC 3D PRINTING
• CNC MILLING
• CONCLUSION
• GLOBAL CONTEXT ANALYSIS
• AREA OF INVESTIGATION
• SOHO ANALYSIS
• MATERIAL MAPPING
• CFD
• MATERIAL INTRODUCTION
• PRELIMINARY PHYSICAL EXPERIMENT
• EXPERIMENTAL SCOPE
• THREE POINT BENDING
• STRUCTURE
• PRODUCTION_PROTECTION COMPONENT
• EVOLUTIONARY OPTIMISATION
• MORPHOLOGICAL ORGANISATION | DETAILS
• PLANTS TAXONOMY
• DIFFERENTIAL GROWTH SIMULATION
• FILTRATION_PRODUCTION COMPONENT
• EVOLUTIONARY OPTIMISATION
• MORPHOLOGICAL ORGANISATION | DETAILS
• COLLECTION_FILTRATION COMPONENT
• EVOLUTIONARY OPTIMISATION
• MORPHOLOGICAL ORGANISATION | DETAILS
• FILTRATION COMPONENT
• PARTICLES SIMULATION
• MORPHOLOGICAL ORGANISATION | DETAILS
• COMPONENT DEVELOPMENT CONCLUSION
• ROBOTIC EXTRUSION
• MOULDING
• DLA AGGREGATION
• NETWORK DEVELOPMENT
• STRUCTURAL ANALYSIS
• AGGREGATION RULES
• RATIONALISATION | POST ANALYSIS OF THE NETWORK
• 4 OPTIONS / CLUSTERING STRATEGY
• SOLAR ANALYSIS
• CFD
• GREEN TISSUE CONNECTIVITY
• SYSTEM KINETICS
• FEEDBACK LOOP

DOMAIN
DOMAIN
“Our way of life is still based in twentieth-century ideas, specifically a modernist philosophy that assumes we can use science and technology to conquer nature. So we try to isolate ourselves from nature; our cities are completely segregated from the environment. [...] That kind of modernist thinking has reached its limit.”4
The domain chapter concentrates on the interconnectivity of crucial subjects for comprehending how exactly ecological deterioration, which disrupts urban metabolism, can result in cumulative and far-reaching consequences. The ecological fragmentation and resulting isolated natural landscapes within the urban context curb its ability to thermoregulate the heat island effect, temperature rise and extinction of species. In order to understand the domain through which these problems can be mitigated, public and interstitial spaces will be researched to create a constant green network to reconnect back London’s Metropolitan Green Belt.

GREEN BELT
The Metropolitan Green Belt was devised as an urban planning strategy to manage the sprawl of urbanisation during the 19th century as a response to rampant health problems which were arising. These protected areas served as the “green lungs” for the city and additionally became protected areas from urban development.6 However, as of August, 2022 councils in Outer London have approved the development of 19,400 hectares of protected green land.7 Moreover, the number of proposed homes within London’s Green Belt has doubled in the last two years to more than 200,000.8 This infrastructural land take, urban sprawl and economic over development has led to the physical disintegration of continuous ecosystems, habitats and landscape-9 ultimately resulting in the compounding effect on the extinction of existing plants and living species. While today, “health issues are no longer the primary argument for preserving the Green Belt, rather, its benefits in promoting sustainable or environmentally friendly development are foregrounded (...)”10 there is still evidence to 9,400 premature deaths attributed to poor air quality annually in London11- statistics that could be remediated if there were stricter regulations surrounding diesel vehicles, exacerbated carbon emissions and pollution reduction, resulting in damaging effects on both ecological sustainability and biodiversity levels.
Greater London has lost 53 hectares of tree cover between 2001 and 202112 thus, magnifying fragmentation of landscape in the advent of urbanisation. This decline in spatial physical noise buffers, carbon emissions, reckless synthetic building material usage and overpopulation have increased the urban heat island phenomenon while mean annual city temperatures have increased 10 per cent. Measurable rising pollution levels of NO2, NOx and Particulate Matter foreground London’s Air Quality Index.13
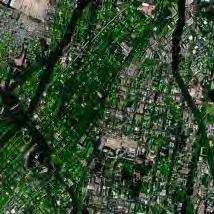
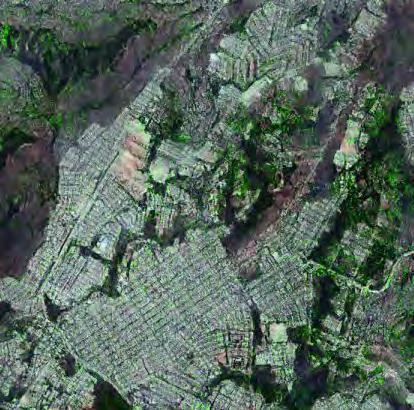
Therefore, to address the repercussions of forestry depletion in the urban built environment, the design research outlines the reestablishment of a resilient green network. Emerging from the identified most affected regions in order to rebalance the relationship between the current built environment and nature. The project relinks back to the existing Green Belt while the new network proposed operates within the threshold of interstitial spaces: enhancing environmental conditions while revitalising underutilised spaces into new green public space. This becomes the introduction to Soho, Central London as a research case study for the project; a medium density, highly polluted area with little green spaces and many areas of underutilised interstitial spaces.
Fig. 1. New houses on the site of an old orchard in Crediton, Devon. ‘Sometimes the green belt is picturesque, but often it is not … fields of nettles, or a wooded clearing full of discarded, stinking cans.’ 5
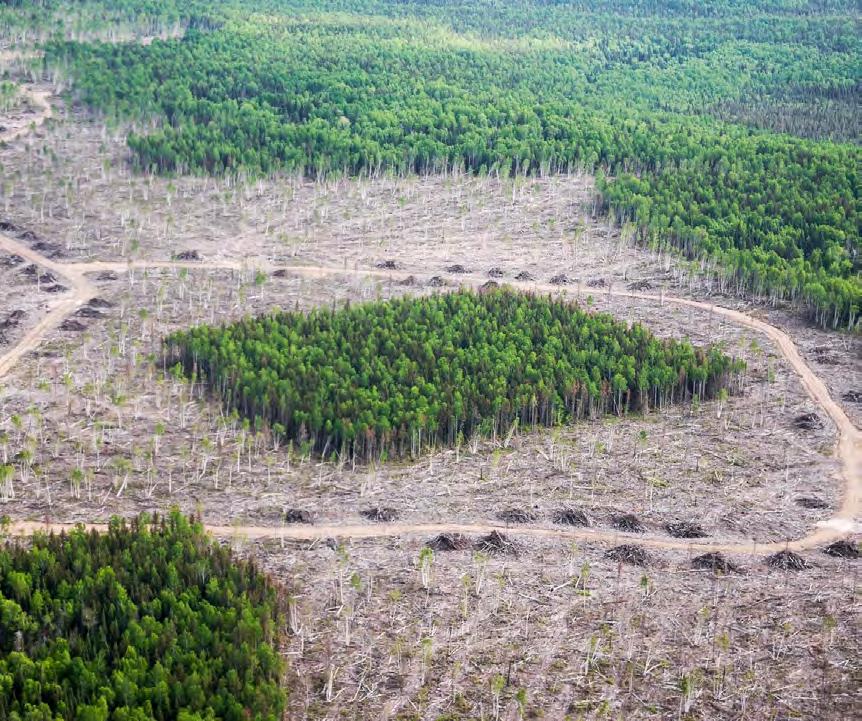
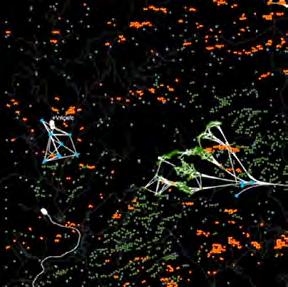
Fig.2. In parts of Ontario’s southern boreal forest, companies have experimented with logging in a variety of special configurations to avoid clearcuts. The forest, which hosts a wide variety of birds and their insect prey, is threatened by fragmentation. 14
ECOLOGICAL DEGRADATION
As Homo sapiens expand in population and our resource footprint proliferates around the globe, most other species are being obliterated, diminishing the biodiversity on the planet and paving the way for a series of quiet extinction events.15 This over consumption of resources has led to strains on the environment and the production cycles. The strategies induced for urban planning are driven by political and economic ambitions. While it has been observed that, “the natural world is not very homogeneous over space, as well, but consists of a mosaic of spatial elements with distinct biological, physical, and chemical characteristics that are linked by mechanisms of biological and physical transport,16 it has self-organised and evolved with its own internal system. It is here that these expansive infrastructural road networks are haphazardly imposed over existing green networks. The rapid growth of the synthetic built environment has led to reckless impurification and de-rooting of forests and ecosystems.
The ecological balance in the environment, which has preexisted human activity, has been created as a consequence of metabolic feedback loops generated between ecosystems within ecosystems. These ecosystems comprise a biological community of interacting organisms and their physical environment and the exchange of matter and energy between them creates a unique equilibrium. Largely unnoticed and therefore of little consequence to humans due to its micro scale, “this balance of nature depends on the activities of parasites and predators, the majority of which are species of insects.17 However, when examined through the lens that around 80% of UK plants are pollinated by insects, including a large number of food crops,18 it frames the importance of a symbiotic exchange of energy between microbial organisms, minuscule insects and organic matter in a much more comprehensive way.19
“Fragmentation has the potential to influence pollination dynamics by altering pollinator or plant densities and by altering pollinator behaviour. Decrease in the insect population also acts as an indicator of environmental change and pollution.”20 Taking this into consideration, the need to design a holistic bio-material morphology that can induce a healthy propagation of species back into the cyclical feedback loop would have a compounding effect as habitat, resources and purification work synergistically.
FRAGMENTATION OF NATURAL LANDSCAPES
The concept of “novel ecosystems” is defined by Richard Hobbs as “a system of abiotic, biotic, and social components, that, by virtue of human influence, differ from those that prevailed historically, having a tendency to self-organise and manifest novel qualities without intensive human management.”21
As the imbalance between unbuilt and built environments grows, this fragmentation of natural landscapes echo repercussions to different levels of urban and natural development. Exacerbated by human activity, this environmental degradation and loss of biodiversity has led to drastic decreases in thermoregulation of the urban context and carbon capture. However, it is crucial to revive this continuous exchange of matter and energy facilitated through the spatial relationship between the built and unbuilt- as Jorgensen and Tylecote identify as ‘urban interstices.’
“Forest loss greatly decreased the amount of carbon-dioxide that is absorbed and contributed 20% to the total carbon-dioxide increase. Though 20% is a relatively small percentage, compared with that caused by industrial emissions, this carbon emission illustrates the fact that plants are vital in controlling the green-house effect because they are one of the most important parts of the earth that transfers carbon-dioxide into organisms. Forest loss creates a greater gap between the production and the absorption of carbon-dioxide.”22 Perhaps none more visually obvious than the accelerated loss in global green cover each year, these changes to landscape configuration disrupt ecosystem services, fragment habitat connectivity, and further hinder carbon sequestration previously provided by the flora.
As fragmentation becomes a catalyst for more built land availability, cities replace natural land cover with dense concentrations of pavement, buildings and other surfaces that both absorb and retain heat at which the “urban heat islands” effect occurs. This effect increases energy consumption costs, air pollution levels and heat-related illness and mortality. The production cycles and instalment strategies of synthet-
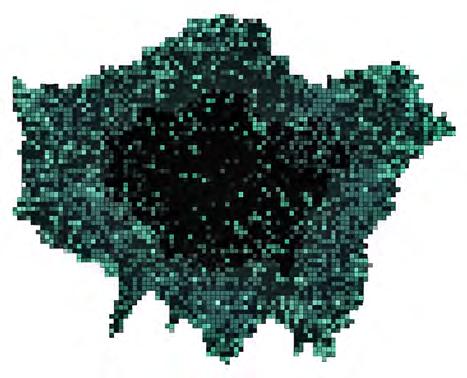
Fig.3. Fragmentation of the landscapes; Mapping green cover 1940 23
Fig.4. Fragmentation of the landscapes; Mapping green cover 2000 24
Fig.5. Fragmentation of the landscapes; Mapping green cover 2016 25
Fig.6. Fragmentation of the landscapes; Mapping green cover 2018
Particulate solution
Urban Heat emissions
Isolated green patch
Infrastructural Built Up
Land with public access
Metropolitan Green Belt 1
Metropolitan Green Belt 2
Fig.7. Fragmentation of the landscapes; 2018
Fig.8. London Air Pollution 2020 31
Fig.9. Urban Heat Island Mapping 2020 32
Fig.10. Fragmentation of the landscapes; 2020
HEAT ISLAND EFFECT
ic building materials become a large contributor to greenhouse gas emissions (GHG). “Global climate change is the impact which usually dominates analysis of the environmental impacts of urban metabolisms; it represents the total contribution of all GHG emissions weighted according to their Greenhouse Warming Potential (GWP) relative to carbon dioxide over some specified period following emission, conventionally 100 years.”26
Carbon production and storage has been directly linked to GHG emissions resulting in the rapid atmospheric heating of climate change. The conscious mitigation of carbon production has not yet been fully used as a design criteria for construction but rather as a monitoring process. The Royal Institute for British Architects (RIBA) has published a whole life carbon guidance assessment report detailing the appropriate sourcing and processing of material, fabrication and lifespan to detail ‘the carbon value of retaining existing built fabric.’27
However, there is a clear disparity between identifying amounts of carbon emissions of new construction and enabling a methodology which would directly reduce carbon production. This is the difference between designing ‘low carbon footprints’ and a reparative system that purifies the environment it is situated in. While climate change sceptics argue that the Milankovitch cycles,28 or orbital movements of the Earth, play a role in the long-term glacial periods and therefore the atmosphere is not warming as quickly as speculated, it is evident that urbanisation and selection of heat-trapping materials such as asphalt, the modern heat island effect and chemical pollutants in changes in land-use practices are rapidly deteriorating the environment.29 As of June 2022, the current atmospheric carbon dioxide measurement is 419 ppm (parts per million).30 For this reason, formulation and research of a material technology that can intervene through the interstices between the built and the unbuilt environment, has lower embodied energy, encourages qualities of filtration while inducing thermoregulation and adaptability to the existing ecosystems becomes extremely crucial.

PUBLIC AND INTERSTITIAL SPACE
‘Public space’ has traditionally been understood as ‘accessible’ space. However, the categorisation of spatial types falling within this domain have larger implications- frequently with varied levels of management and transparency. According to OMAI classification the “positive public spaces are Natural / semi-natural urban spaces, Civic spaces and Public open spaces.33 The traditional types of urban space, known as civic space, are accessible to anyone and can be used for a wide range of purposes.34 However, Civic spaces that are technically “open to all,” multipurpose and play an active part in society are no longer in existence. These spaces were replaced with commercial spaces, advertisements, anything that will encourage overconsumption. Is it possible to still refer to a place as “public” if the surrounding environment has been significantly disrupted and no longer provides a comfortable atmosphere for all human and non-human species groups? Or does it semantically in definition cease to be “public?” And what role do interstitial spaces play in facilitating the new exchange between public spaces separated by programmatic function?
At the smallest scale, Vidal (2002) uses the term ‘interstitial space’ to describe dynamic spaces delimited by physical elements such as buildings, walls and others.35
‘Urban interstices’ exist in cities as spaces for wildlife. So, woodlands, abandoned allotments, river corridors, brownfield sites and others emerge as proper sites for spontaneous growth of vegetation in contrast with those planned spaces with nature ‘under control’. They indicate that these spaces have significant contributions in facilitating direct contact of urban dwellers with wild nature at different scales, and open new possibilities for landscape planning and urban design.36
These ‘in between’ spaces from within the urban tissue need to play a fundamental role in the reciprocity of the natural landscape to continue its existence while the city, as an artefact, adapts within the preexisting landscape. Thus, designing for mutualism would mean recognising and foresting the links between environment, organisms, and land-use practices- both human and animal- and identifying the complex cycles that tie together different species and systems.38
Fig.11. Interstitial space or space “in between“.37

GREEN NETWORK
In order to ensure that the urban metabolic cycle can continue exchanging matter in the current, depleted environment, that the ecological degradation which has happened up until this point is halted and transitions to reparative, that the heat island effect accelerating the carbon production processes and atmospheric depletion is lowered, a new green network of purifying connectivity is proposed as solution.
In order to reduce the impact of human intervention on urban ecology, a new continuity between the fragments of the natural landscape must be reconstituted as an integrative system of ecological networks. By proposing a gradual ecological transition via interstitial spaces, whereby the term interstitial, henceforth, will refer to Lovera’s identification of gaps in the urban fabric in which informal, unregulated, or unplanned situations take place, or as a descriptor of residual spaces left as a result of less controlled processes in planning,40 such that the rigid boundaries between the built and unbuilt environments can be redeveloped. Defragmentation of natural landscapes within the urban context delivers multitudes of benefits to nature and society- providing various ecological services and supporting biodiversity. By harmonising growth between new biological species and the survival of existing, the metabolic balance between densely packed built tissue and unbuilt ecologies can begin to abate damage caused by human activity- reducing both heat island effects and carbon emissions while restoring biodiversity.
Ultimately, the design goal outlined under this implication is that space will be designed to serve a beneficial and symbiotic function outside of the human sphere. This, however, is a nonsensical statement to make unless there are quantifications to adjust the proposal against its ambitions; how much carbon is actively being absorbed via material research, how much purified oxygen is it possible to produce to mitigate air pollutants, how much atmospheric deposits can be absorbed, how can endangered species proliferate and how does a continuous green network reconnect to the Metropolitan Green Belt without obstructing urban development.
Fig.12. Deep Green project by EcologicStudio; Green network development concept.39
MATERIAL
EXPLORATION
“Soft living architecture does not stop at the limits of synthesis but reconnects the realms of life and death in decomposition processes through soils. The composts that enable these linkages are not simple products; they are highly heterogeneous and metabolically active – being neither fully alive or inert. Such transformational fabrics are selectively permeable to environmental processes.”42
“While the period of the first industrial revolution, in the 18th and 19th century has resulted in a conversion from regenerative (agrarian) to non-regenerative material sources (mines), our time might experience the reverse: a shift towards cultivating, breeding, raising, farming, or growing future resources going hand in hand with a reorientation of biological production methods and goals.”43 The material development of bio-bot is catalysed by this investigation into the production of bio-receptive material. By Crus and Beckett’s definition, in order for a material to be bio-receptive it has to be biocompatible with particular types of species that will colonise it in a specific environment.44 If this is true, it is to be developed at three simultaneous scales.
At the first stage the material’s molecular behaviour inherently informs its physical growth process which also sets up the framework for the computational simulation. This informs the second stage which sets up the limitations for habitation. The formulation and research on the material composition to harbour natural growth of living species for microorganisms and the role they play in socio-thermo regulation informs the third stage which takes into consideration the mitigation of environmental impacts. By developing the material having taken into consideration the natural evolutionary processes required to control programmed life cycles, the sequestration of CO2, thermal regulation to combat heat island fluctuations and a re-growable material database become the environmental impact of the bio-bot. For this reason, sustainable building material development is a crucial parameter of this research in order to induce the growth of green living tissue, capture carbon and particulate matter from the atmosphere to filtrate the environment.
Fig.13. Newly developed bamboo composite material at the SEC/FCL Advanced Fibre Composite Laboratory. 41
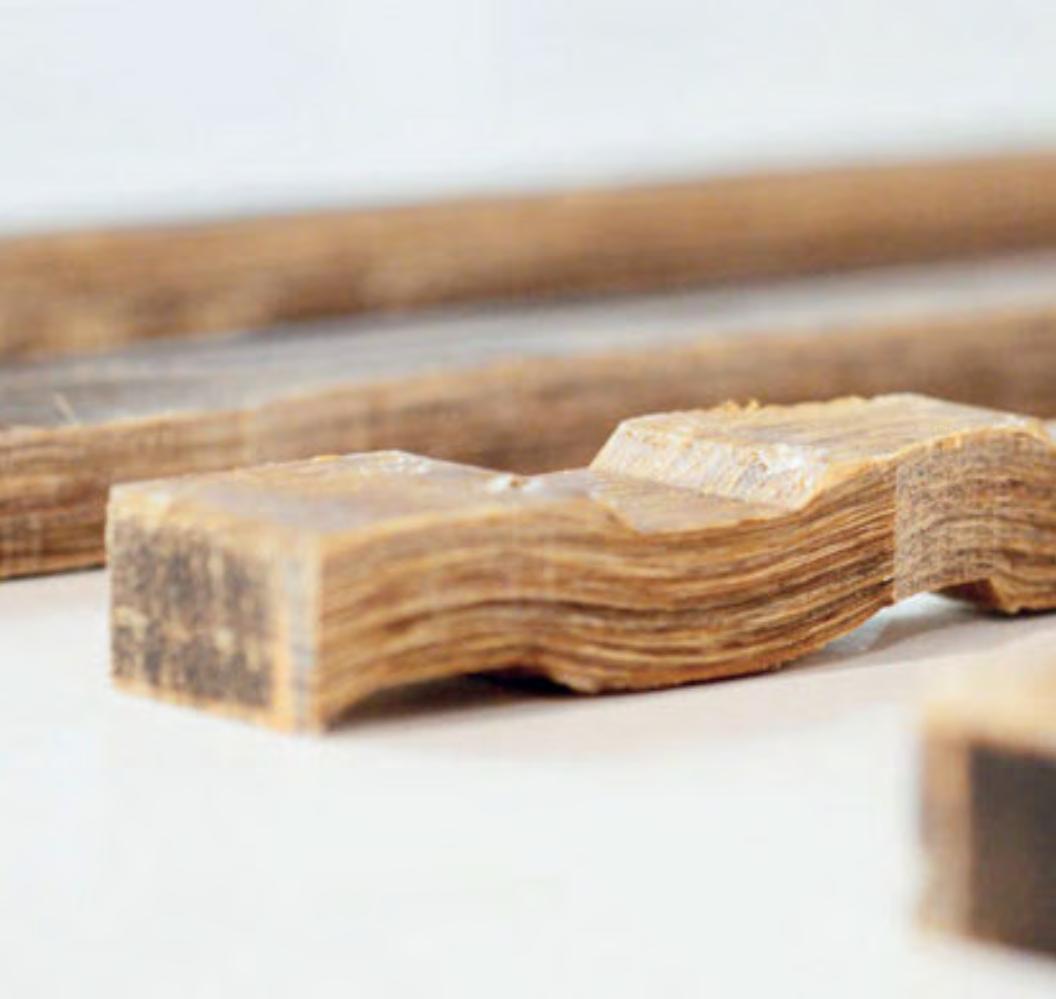
SAW DUST
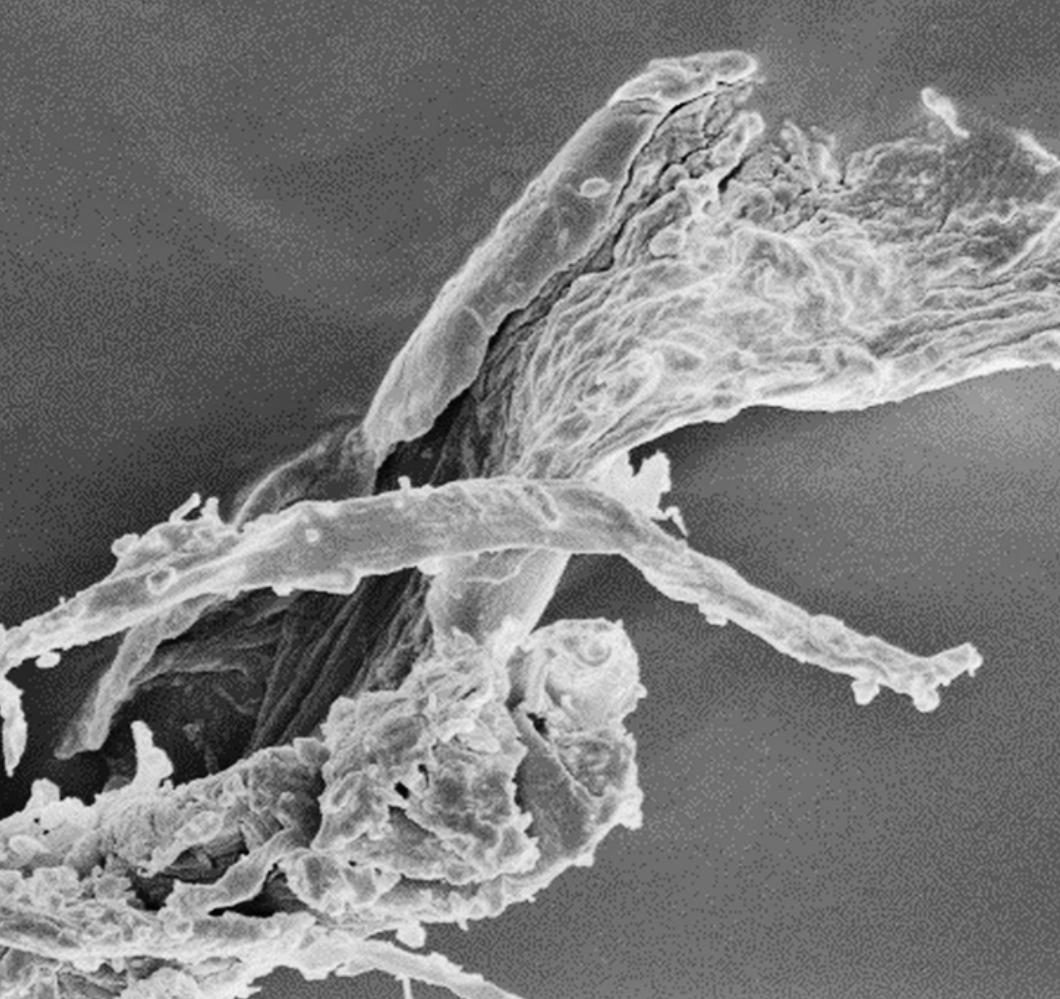
“The values of these life-giving materials exceed established conventions of design and invite a robust choreography between synthesis and dissipation, where the process of decay is recognized as an organisational system in which adaptation and even (re)embodiment becomes possible.”45 The timber industry has a highly established understanding of its own material’s life cycle as well as its by-products: saw dust being one such fibrous example that retains the material properties of its timber parent. Therefore, it becomes extremely crucial to utilise timber during its ultimate stage of use. Sawdust is produced as a “by-product or waste product of woodworking operations such as sawing, sanding, milling, planning and routing- composed of small chippings of wood. These operations both shatter lignified wood cells and break out whole cells and groups of cells. The more cell-shattering that occurs, the finer the dust particles that are produced.”46
The saw dust particles have dynamic hygroscopic behaviour due to their surface adsorption properties.47 When water film surrounds the saw dust particles, surface bonds are created between particles due to cohesive forces. However these bonds are not structural.48 Hence, it can be concluded that saw dust particles have a tendency to aggregate in clusters through the formation of surface bonds. (Fig.14.) Therefore, further research can be conducted to determine coupling materials that can induce stronger surface bonds amongst saw dust particles in order to develop a structural bio composite from timber sawdust. Furthermore, the phenomenon of surface activation of saw dust particles through pyrolysis was studied which resulted in increased surface area and porosity in sawdust composites, allowing the formation of surface bonds between saw dust particles and particulate matter in the air leading to decontamination of air. The methodology to generate adequate porosity can be explored based on varying the pyrolysis temperature. Pyrolysis is the process of decomposition of organic material under heat in the absence of oxygen into biochar.49
Fig.14. Scanning electron microscopic (SEM) picture of a single disintegrated beech fibre. 50
SAW DUST
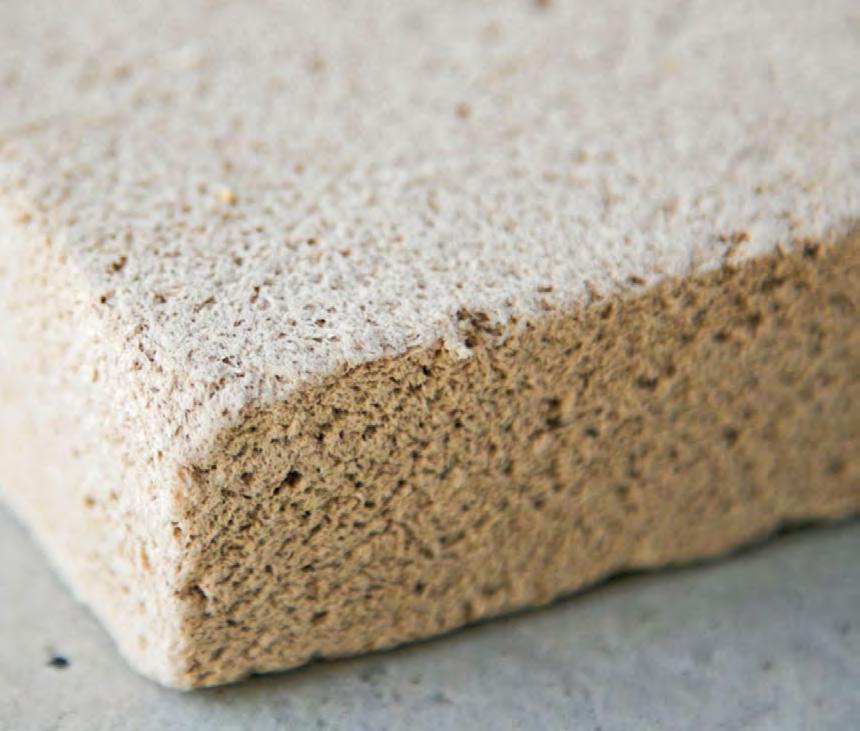
Research has been conducted stating pyrolysis temperature has an influence on physicochemical properties of biochar synthesised from spruce wood (Picea abies) sawdust resulting in varying porosity levels.52 Surface morphological features like porosity aid gas adsorption, growth of clusters of microorganisms, displaying excellent water retention capacity.53
Despite the relatively recent introduction of the term “biochar,” versatile applications of charred materials have been identified for further research due to their unique physicochemical properties such as high surface area, porosities, surface functional groups and absorption capacities.54 The carbon absorption due to slow pyrolysis and fast pyrolysis of sawdust particles with different gasing composites at different temperatures helps in achieving varied porosity as confirmed in experiments conducted by Zaira Z. Chowdhury.55 Porous composites from biochar have increased surface area that can capture particulate carbon- helping filtration of air. Fuertes identified that, ‘this type of carbonaceous material gives rise to an activated carbon that possesses textural properties that are appropriate for CO2 capture.’56
Therefore in order to take the research in this field further, the bonding behaviours in the hygroscopic and thermodynamic properties of sawdust particles at their molecular level can be extracted in order to create a new bio-material which has structural performativity, creates a scaffold for the growth of living tissue and can decompose at the end of its life cycle.
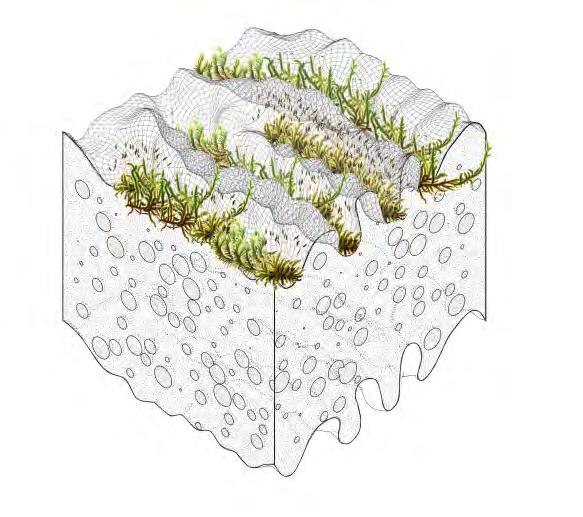
Fig.15. The production of wood foam involves several process steps to specifically activate the internal bonding capacity, using existing technologies from the wood product and paper industry. 51
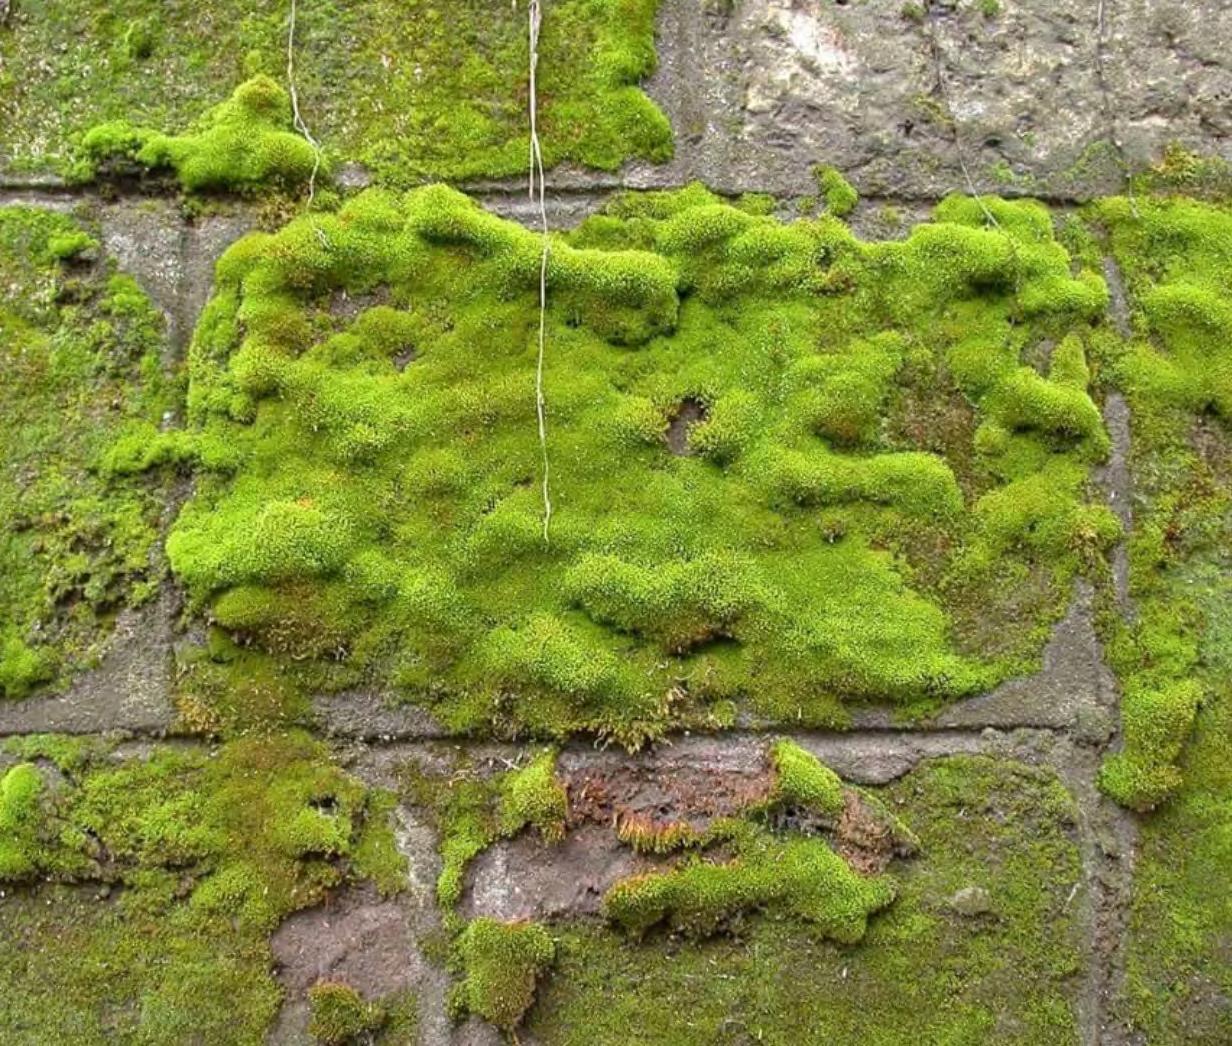
Fig.16.. Moss attaching to the urban environment. 57
LIVING
TISSUE DEVELOPMENT | MOSS | ALGAE
To understand the complex interactions between urban and natural processes it is crucial to identify behaviours at the microscale, the biological level of reproduction to anticipate their behaviours within larger natural scales in heavily polluted urban city centres. Holling identifies that designers face a larger problem- having to develop new systemic challenges of the petrochemical era - which are ubiquitous yet nearly invisible; nitrogen pollution, hypoxia, estrogenic compounds in our water system, carbon dioxide atmospheric pollution, and gradual sea level rise.”59 The presence of No2, No3, NoX, carbon and Particulate Matter (PM) create an opportunity to test if the implementation of living tissue, as Holling points out, can be utilised to create biofilters for PM which outperform those using non-bio, traditional filtering techniques at the urban scale- generating a Single pass removal efficiency (SPRE) in which PM was generated inside a Perspex chamber with active mechanical airflow to test polluted air dispersed across the green wall biofilter.60 This challenge of urbanisation with environmental awareness can actually be used to improve surrounding environmental qualities. One such example is Pleurocarpous moss; abundant and part of the flora vernacular of London.
Moss has been used as a bioindicator of pollution61 and air quality and has a high tolerance for growing on various substrates without maintenance and low water needs- making it suitable for development as a living tissue. Atmospheric element depositions such as water molecules (H₂O), carbon dioxide (CO₂), nitrogen gas (N₂) are absorbed by moss, as are metal elements such as lead (Pb), magnesium (Mg), uranium (U) and sources that come from anthropogenic factor.62 Additionally, the sustainability performance of implementing moss into green construction systems have shown effective stormwater management, decrease of surface temperatures and mitigations to the urban heat island effect as opposed to vascular plants.63 While its growth rate varies across the propagation medium, growth substrate, and environmental conditions, it has been successfully implemented as a low-cost botanical biofilter in greening systems such as MosSkin64 to improve environmental conditions.
Plant structure, varying from rhizomatous to rooted, becomes significant not only to re-green degraded land areas within urban settings, but its secondary performance as a biofilter- the root structure which spreads along its substrate to create density to block particulate matter from entering completely. Fur-
LIVING TISSUE DEVELOPMENT | MOSS | ALGAE
thermore, different species of plant roots can affect how much PM can pass through the substrate on which they are planted- rhizomatous species spread horizontally across a surface while rooted plants act as a filtration medium if given enough time to grow into a more ‘efficient system.’65
The identification of the root in behaving as bio-filtration allows for further categorisation of plant taxonomy of species which can serve the purpose of air purification in highly polluted areas as well as metal toxins and PM. Rhizomatous species can act as stabilising agents of a system by spreading laterally across mediums and substrates along the surface to immobilise the spread of sediment. While conducive to methods of atmospheric filtration, by incorporating rhizomatous species of plants which are unique to London and also conservationally endangered such as the Clinopodium Menthifolium, of which there is estimated to be only 10 km2 of in Great Britain,66 the proposal is sensitive to the larger role it plays in propagating imperilled flora and fauna (further identified in plant taxonomy Fig. XX).
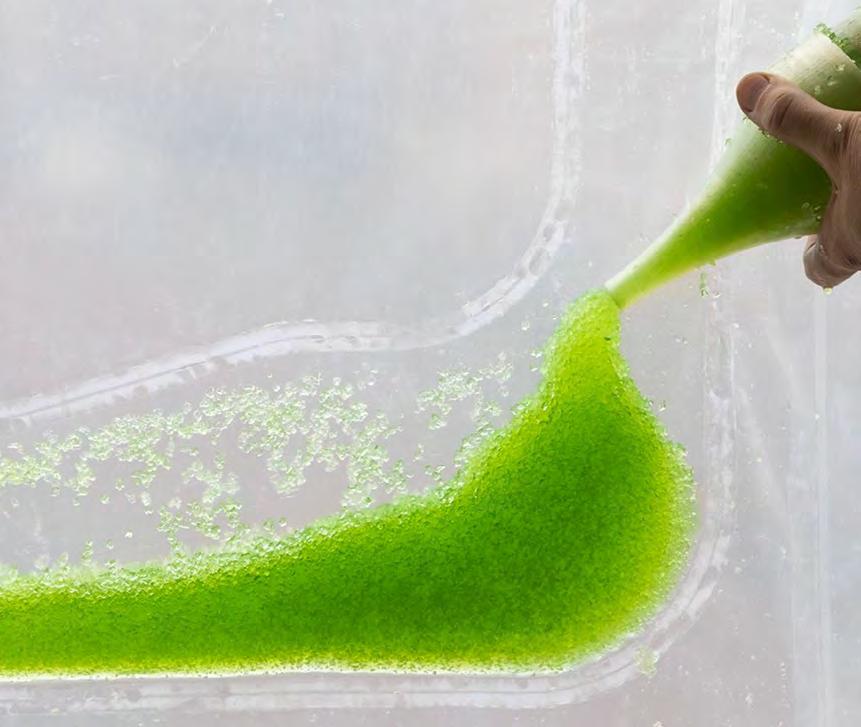
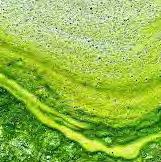
The Intergovernmental Panel on Climate Change (IPCC) published a climate assessment report roughly estimating that planting one trillion healthy, mature trees in efforts of reforestation “could remove “twothirds of all the emissions from human activities that remain in the atmosphere today.” However, Cooley’s critical question still remains: where does one find land equivalent in size to the United States of America and Canada combined to plant them?67 One recent line of research into alternative space that has gained momentum is investigating algae as a source of carbon absorption to then be used as a biofuel. Algae bodies are capable of “producing an equal amount of bioenergy to terrestrial plants using only 1/10th of the land area,”68 and a one acre (4000m2) area of algae can capture up to 2.7 tons of carbon per day.69 Presently in London, direct air capture is used for the net removal of CO2 released into the environment from the transportation sector70 in designated emission zones. It is therefore appropriate to consider how proximity within highly polluted zones could benefit from the CO2 removal that algal photosynthesis has been confirmed to absorb and transform into environmentally sustainable biofuels. Furthermore, if one scrutinises the spatial proportions of ‘one trillion trees’, then comparatively there is a parallel potential in researching how the increase of algal surface area in polluted areas can be used to maximise its exposure to sun; measuring volumetric containment rather than lateral area.
Fig.17. Microalgae in the pillows captures and stores CO2 molecules and air pollutants and grows into biomass. 58

CASE STUDIES
Connecting Green Network
Mitigating Climate Impact
Re -Metabolisation Of Air Pollution
Filtration
Water Conservation
Recycling
Trained Knowledge Base

Algorithmic Network Analysis
Network Output
DEEP GREEN| ECOLOGICSTUDIO
In order to analyse the thresholds between technology, architecture and building material sciences, case studies were conducted at three different scales of implementation: green network development, material research and cybernetic feedback within systems.
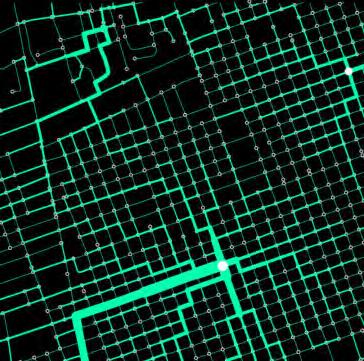
Reckless anthropogenic activities are causing an alarming threat to the environment disrupting the green resources leading to the dire need of regeneration of green network strategy. Hence, addressing the problem under this domain to cater to the depletion of urban resources, the Ecologic Studio based in London developed an algorithm through the project Deep Green.71 The formulation of this algorithm and its primary research parameters consisted of a series of workflows. (Fig.18.) Firstly, the urban regions subject to depletion of natural resources were listed and analysed, scans of their existing terrain, green networks, and road infrastructure were generated for investigation and repurposing. Once the topographical data was extracted, new green network layouts were generated on top of the investigated urban tissue. The newly generated green network layouts were derived from algorithms extracted from geometrical patterns existing in nature such as the Direct path system, Minimal path system, optimised further by contextual environmental simulations. The developed technology was intended to be used as a method of sensitive urban planning in order to solve the problems of rewilding and strengthen the resource network
Fig .18. Diagrammatic indication of the workflow and techniques used in Deep Green project developed by EcologicStudio
Vegetation Biotic Layer
Ground Topography
Water Flow
Urban Waste Morphology
Insolation Energy
Wind Flow
Rapid Urbanisation/ Volcanic Adversities
Urban Agricultural Plan
Direct Path System
Minimal Path System
Wind Flow
Lack Of Water Resources
Vegetative Network Around Water Collection
Rewilding the City Of Gautemala
Re-GreeningMogadashu
Vranje Renewable City Region
Dispersed Resources
Renewable energy production network
for development of new towns in stressed environments.
The project ambition was based heavily on theoretical framework and research and lacked the identification of parameters for urban scale implementation. The developed algorithmic model did not consider the function and usage of the existing buildings and their interstitial spaces. The model also lacked identification of socio-cultural aspects influencing urban planning strategies. The team generated new network strategies for the cities of Mogadashu, Guatemala and Vranje computationally, through a set of graphical representations of solutions regardless of the building scale and with no evidence of its practical implementations. However, this case study can be utilised as a basis to analyse urban scale environmental parameters such as wind flow, solar radiation, biotic layering and urban waste structure in order to devise research parameters for the study of green network development.
Manifolds/crevices
Trap air
Self Shading
Microclimate pockets
Support tissue growth
Trap moisture along the length of the column
3d printing the mixture
Bio Scaffold
Technique
Composition
Waste paper cups pulp
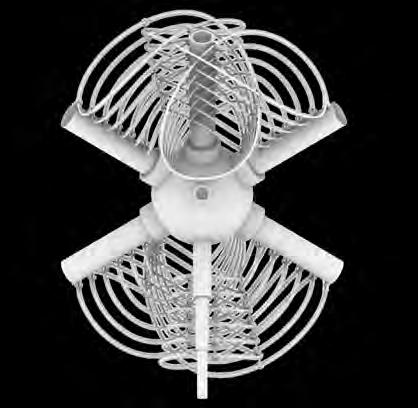
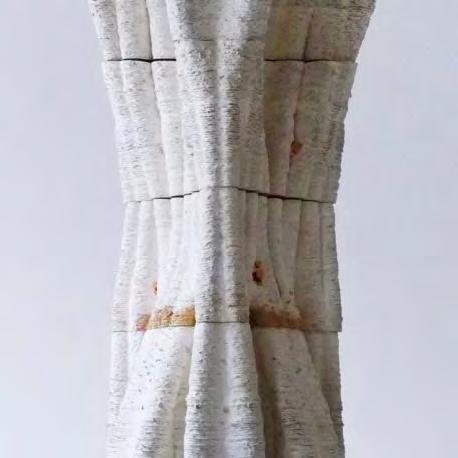
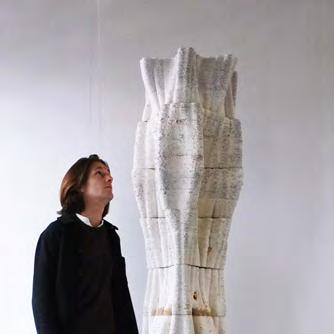
MYCELIUM COLUMN | BLAST STUDIO
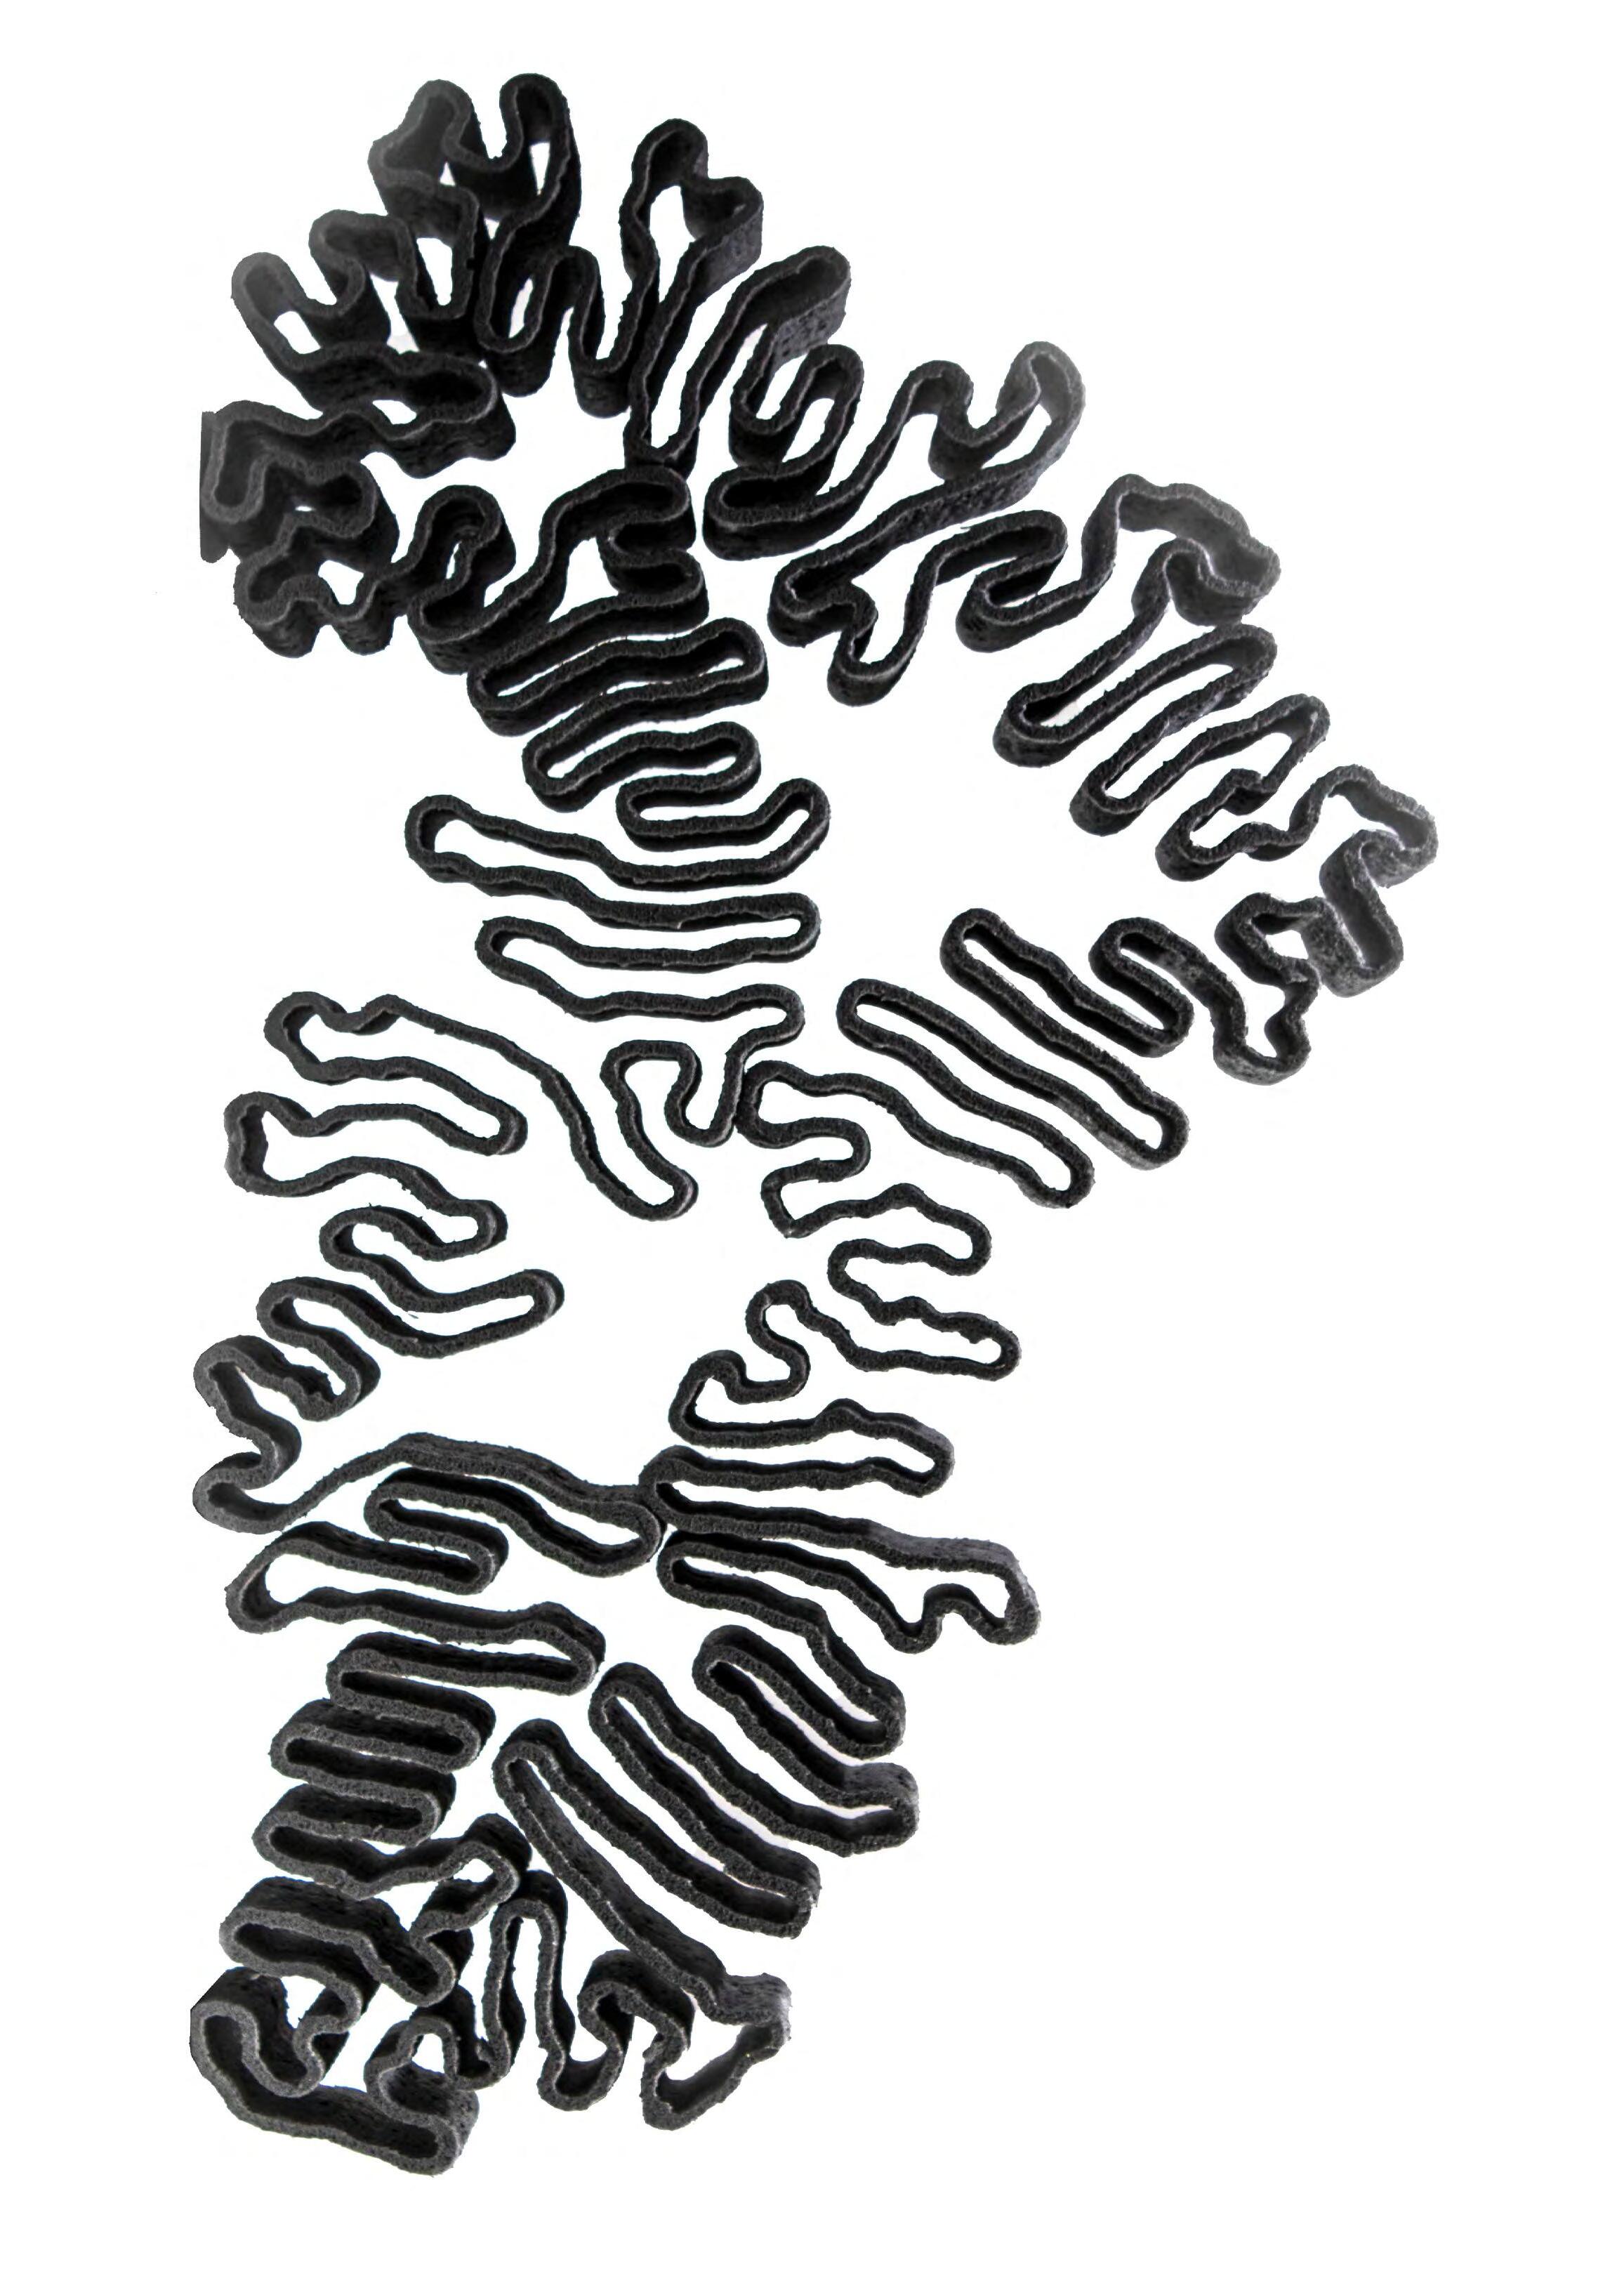
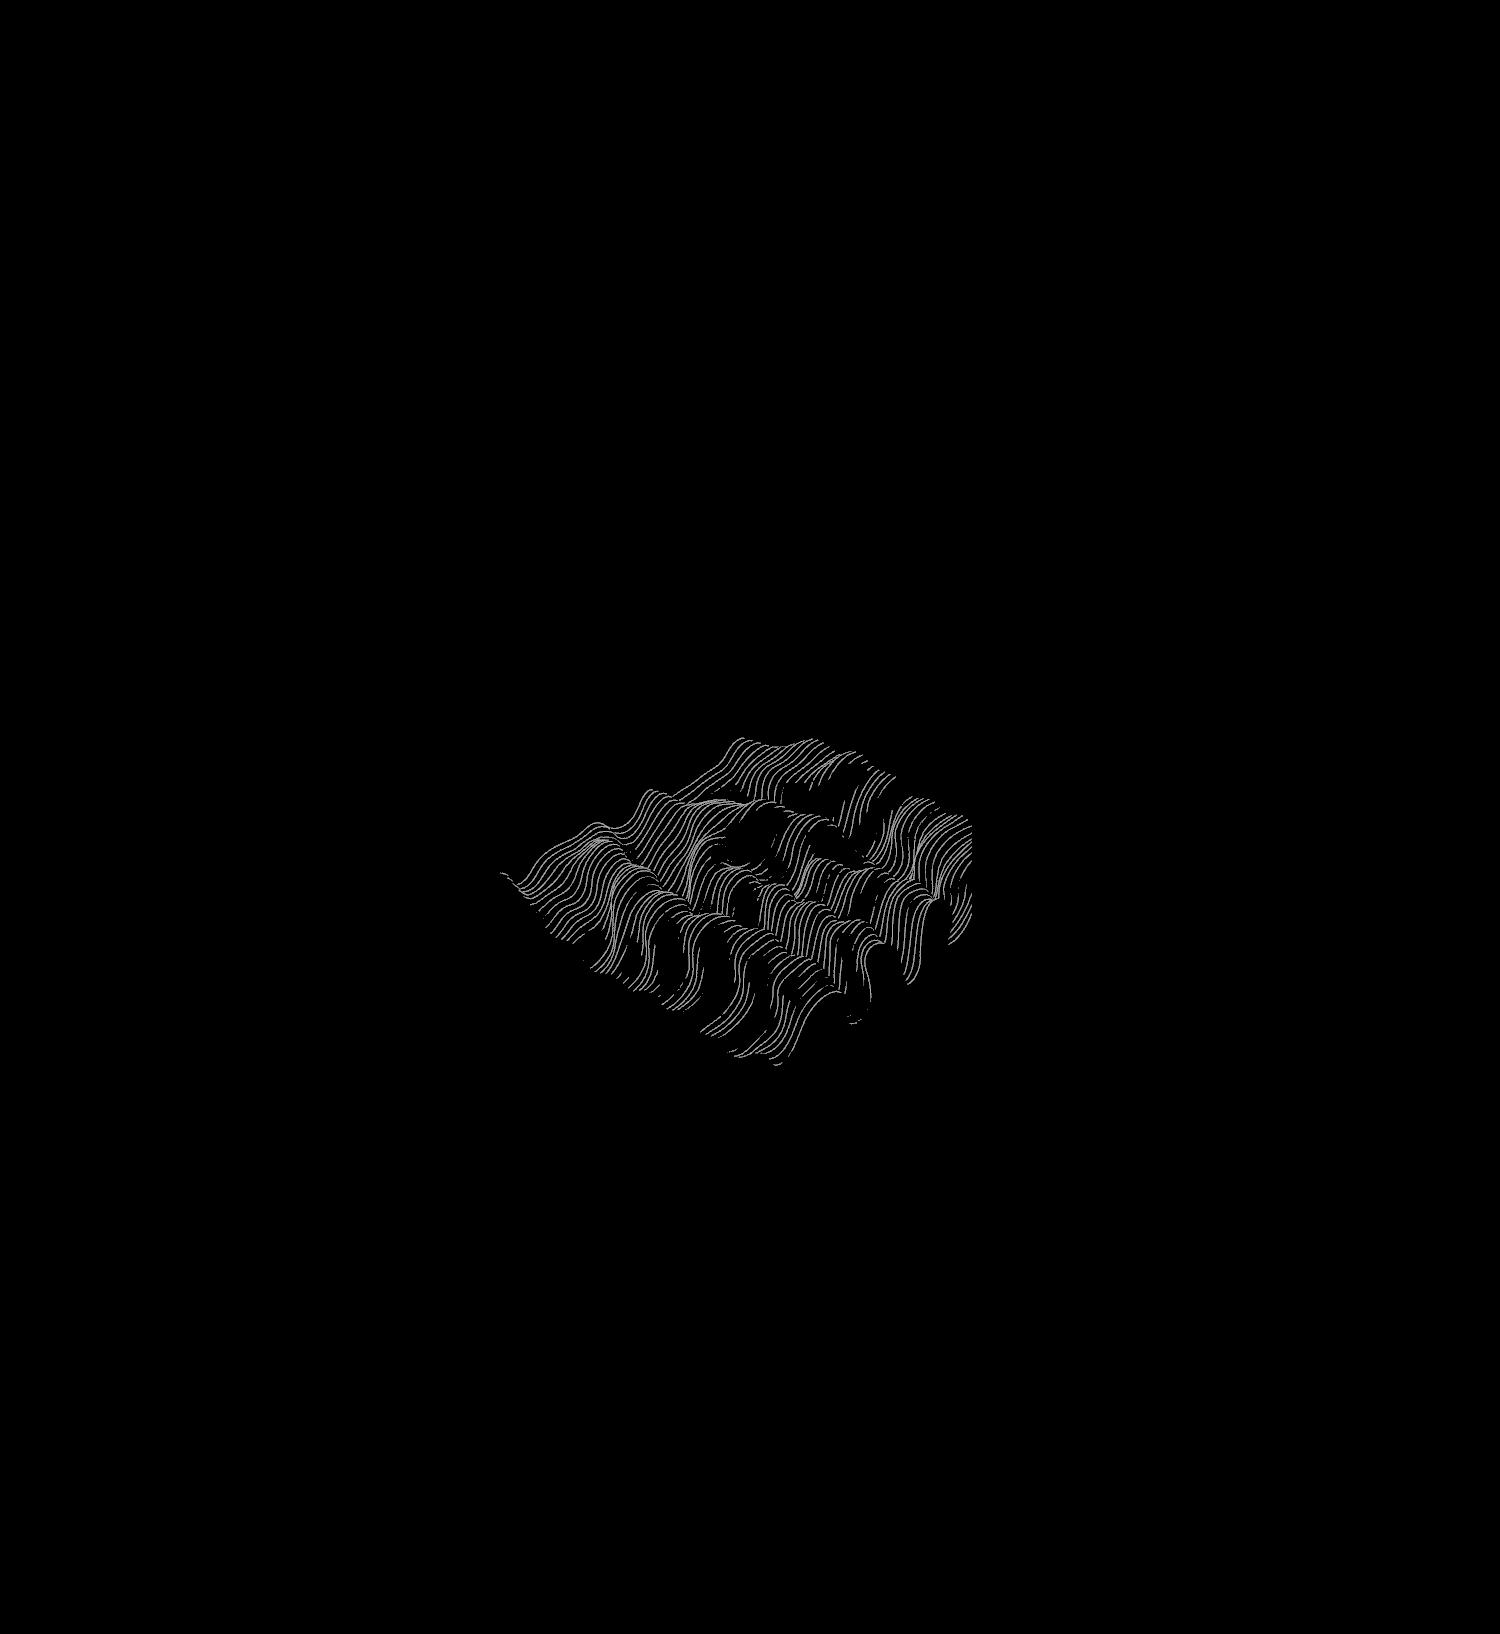
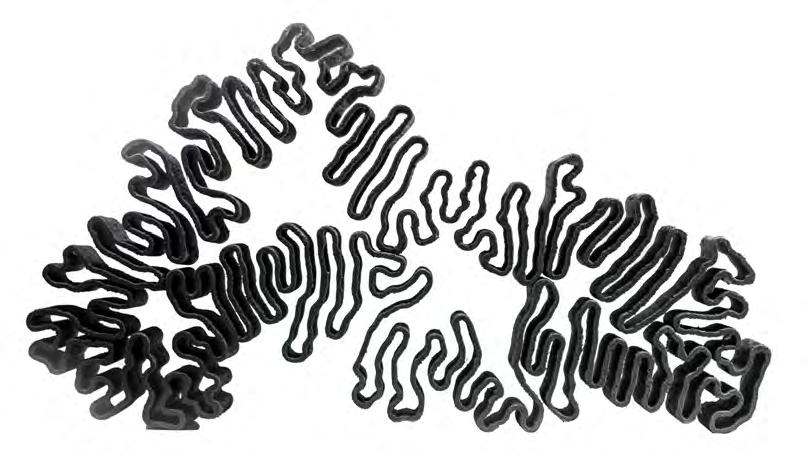
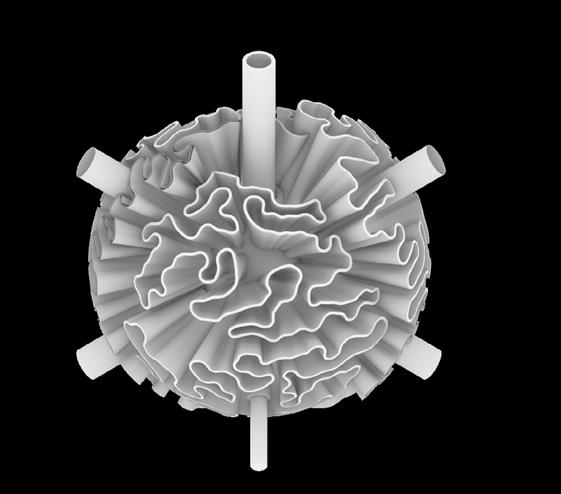
Synthetic building materials such as steel and concrete typically used in construction practices have high embodied energy and a comparatively higher carbon footprint. Extensive use of these materials contribute to the urban heat emissions and the non-biodegradability of these materials is hazardous to the environment. The project initiated by Blast Studio72 was studied in order to analyse the goal and workflow of development of biomaterial from a living tissue - mycelium in this case. (Fig.19.) Their experimentation also focused on developing a bio-material that could withstand structural loads simultaneously. The biomaterial was formulated into a resin-like mixture consisting of mycelium roots ground with paper pulp prepared for robotic arm extrusion leading to the creation of few successful prototypes. These morphologies were generated to have manifolds to create microclimate pockets to induce growth of new mushrooms which could be further used for human consumption. The mycelium morphology could be further baked to increase its structural strength as mentioned by Blast Studio.73
Diagrammatic indication of
Mycelium roots
Mycelium column
Fig .19.
the workflow and techniques used in the Mycelium Column project developed by Blast Studio
Structural morphology

Food/mushroom growth
Human Consumption
Load bearing
Structural strength test
Height = 2.1 m
Pavillions/small houses Natural insulator
Fire retardant
Controlled mycelium growth rate
However certain limitations could be identified in the production of this building material. Firstly, mycelium needs controlled environments to be cultivated in bulk quantities. Secondly, its decay rate is highly subjective to instantaneous weather conditions, leading to unfavourable results. The produced physical prototype had been intended to be used as a structural member, although it lacked the abilities to take compressive loads.74 Also, its implementation at the urban scale had not been tested yet. It is important to note that development of biomaterials comes with their own risks of implementations, preservation and maintenance rules that are highly inflicted by humidity levels in the air. However, the intriguing exchange in the computational and physical medium in order to generate a physical prototype from a living material can be utilised as a methodology for further research.
Baked at 80 C
Emission of CO2
Water Bodies Algae Types O2 production rate
Humans
Emission of Heat
Movement
Low Lux Levels
Low Oxygen Levels
Increase in room temperature
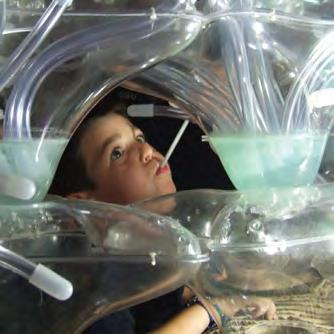
STEM CLOUD | ECOLOGICSTUDIO
“The new architectural machines are more like agents of local interaction, designed and developed as components of a larger self organising system.”75
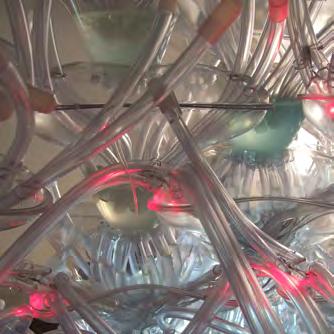
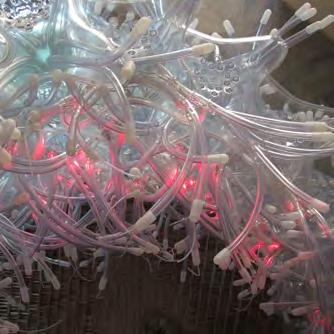
The STEMcloud v2.0 project suggests creating and evaluating an architectural prototype that serves as an oxygen-producing device. The proposal was planned and presented for the 2008 Seville Art and Architectural Biennale.76 This project was initiated to create a real time interaction between humans, architectural machines and the living environment that is algae alongside its different species. This real time interaction is called a cybernetic feedback loop. A knowledge base was created to identify harmful algal blooms from different water bodies across the city. Modules with sensors, filled with different species of algaes were created. The photosynthetic characteristics, carbon absorption rate, and multiplicity rate were listed through machine learning and fed back into the module knowledge base. The machine module consisted of pipes through which humans could exhale CO2 to the module. The feedback loop is triggered as CO2 enters the module, leading to multiplication of algae and the rate defined from the knowledge base producing O2 in the gallery space. The heat, movement and light quality in the room is captured by the sensors to create a kinetic response and bioluminescence in the room. The sensors also trigger when CO2 depleted- thereby generating a response for humans to the feedback loop. This case study is analysed as a basis of research to understand the limitations of cybernetic feedback
.20. Diagrammatic indication of the workflow and tech
Fig
niques used in the Stem Cloud project developed by Ecologic Studio
Pipes connected to chambers
Blowing CO2 in the module
Gallery space
Robotic Operating System
Sensors
Bio-Receptive Modules
Kinetic Response
Simulate production Of Algae
Chemical reaction
Produce LED signals to indicate low levels of O2
Aggregate/Disintegrate
Trigger Bioluminiscence
Regulate Oxygen Levels
loops and their architectural applications in real time. (Fig.20) The machine to human interaction is limited to blowing air into the modules, as opposed to a spatial interaction. Such interactions need supervision and maintenance. Furthermore, the confinement to an indoor assembly lacks structural characteristics and limits the possibility of application at an urban scale. The material used to create the prototype machines is polysynthetic plastic- poor in biodegradability and a potential threat to the environment for a proposal focusing on ecological conscientiousness.
RESEARCH QUESTIONS
Can interstitial spaces reinvigorate feedback between ecological degradation and urban context?
Can bio-bot modules become a living system that benefits the human and local environment?
Can composite material be woven for structural performance while adapting to living tissue to support its performance?
The domain chapter concludes that for the breadth of information being extracted simultaneously it is important to devise a way for all of the different aspects of the project to work in parallel and systematically develop into one another. The Green Belt as a container for situating the project delineates the necessity for a continuous connection of green spaces found lacking within highly urbanised developments in London. While historically it served to maintain a healthy space for the human condition, it has since lost this significance. As pollution due to exacerbated and irresponsible human activity spurs climate change, greenhouse emissions, heat fluxes and environmental shifts, pollution mitigation therefore becomes the primary method of intervention. This purpose can be best served through the utilisation of interstitial, or leftover, city spaces in Central London - specifically Soho as being the worst-case test scenario for the efficacy of the proposal; not to be superseded by the importance of implementing a living tissue in order to reintegrate hard landscape and soft ecologies. The analysis extracted from the Deep Green, Mycelium Column and Stem Cloud reveal that there are strict limitations in implementing information conducted at the material scale to translate to an urban intervention. For this reason, the methods by which a network can be devised for this dissertation must have a multilateral approach to develop how biomaterials can work within a morphological organisation that serves as a solution to combat ecological degradation while self-regulating to enhance the spatial experience of its human and non-human occupants.
ENDNOTES
1. Keller Easterling, “Landscapes, Highways, and Houses in America,” in Organisation Space (Cambridge, Mass..: MIT Press, 1999), 25–34.
2. Jeff Jones, “Characteristics of Pattern Formation and Evolution in Approximations of Physarum Transport Networks,” Artificial Life 16, no. 2 (April 2010): 127–53, https://doi.org/10.1162/ artl.2010.16.2.16202.
3. Theodore Spyropoulos, “Constructing Participatory Environments: A Behavioural Model for Design” (Thesis (Doctoral), UCL (University College London), 2017), https://discovery.ucl.ac.uk/id/ eprint/1574512.
4. “Toyo Ito Interviewed by Julian Rose,” accessed May 11, 2022, https://www.artforum.com/ print/201307/toyo-ito-interviewed-by-julian-rose-42634.
5. Jonn Elledge, “Loosen Britain’s Green Belt. It Is Stunting Our Young People,” The Guardian, September 22, 2017, https://www.theguardian.com/commentisfree/2017/sep/22/green-belt-housing-crisis-planning-policy.
6. Vanessa Miriam Carlow and Yeon Wha Hong, “London Green Belt: From a Landscape for Health to Metropolitan Infrastructure,” in Proceedings of 8th Conference of the International Forum on Urbanism (IFoU) (8th Conference of the International Forum on Urbanism (IFoU), Incheon, Korea: MDPI, 2015), 755–64, https://doi.org/10.3390/ifou-E003.
7. “London Set To Lose 48,000 Acres Of Its Local Countryside | London Green Belt Council,” accessed September 16, 2022, https://londongreenbeltcouncil.org.uk/london-set-to-lose-48000acres-of-its-local-countryside/.
8. “Green Belt under Threat from 200,000 New Houses” (The Times, January 28, 2019), https:// www.thetimes.co.uk/article/green-belt-under-threat-from-200-000-new-houses-lxp7zkkdr.
9. “Landscape Fragmentation Pressure in Europe,” accessed September 16, 2022, https://www. eea.europa.eu/ims/landscape-fragmentation-pressure-in-europe.
10. Carlow and Hong, “London Green Belt.”
11. “Air Pollution and the Effect on Our Health | London Councils,” accessed September 16, 2022, https://www.londoncouncils.gov.uk/node/33227.
12. Vizzuality, “Greater London, England, United Kingdom Deforestation Rates & Statistics | GFW,” accessed September 16, 2022, https://www.globalforestwatch.org/dashboards/country/ GBR/1/36.
13. “London Air Quality Network » Annual Pollution Maps,” accessed September 16, 2022, https:// www.londonair.org.uk/london/asp/annualmaps.asp.
14. Emma Br yce, “Global Study Reveals the Extent of Habitat Fragmentation,” Audubon, March 20, 2015, https://www.audubon.org/news/global-study-reveals-extent-habitat-fragmentation.
15. Kate Orff, “Cohabit,” in Towards an Urban Ecology; Scape; (The Monacelli Press, 2016), 81–138.
16. Crawford Stanley Holling, “Resilience and Stability of Ecological Systems,” Annual Review of Ecology and Systematics, 1973, 1–23.
17. James Asworth, “Bees, Butterflies and Moths ‘confused’ by Air Pollution,” January 24, 2022, https://www.nhm.ac.uk/discover/news/2022/january/bees-butterflies-and-moths-confusedby-air-pollution.html#:~:text=Air%20pollution%20obscures%20the%20sweet,by%20as%20 much%20as%2031%25.
18. McNaughtan Dugald, ‘Why Are Insects Important?’ (Wiltshire Wildlife Trust’s (WWT), 2022), https://www.wessexwater.co.uk/community/blog/why-are-insects-important#:~:text=breaking%20down%20and%20decomposing%20 organic,mammals%20 consist%20of%20mainly%20 insects
19. McNaughtan Dugald.
20. Luis Zambrano, “The Consequences of Landscape Fragmentation on Socio-Ecological Patterns in a Rapidly Developing Urban Area: A Case Study of the National Autonomous University of Mexico,” Frontiers in Environmental Science 7 (2019): 13.
21. Maurice Merleau-Ponty, “Performative Acts and Gender Constitutions: An Essay in Phenomenology and Feminist Theory,” no. 4 (December 1988): 31–519.
22. Cai Haoyang, “Algae-Based Carbon Sequestration,” IOP Conference Series: Earth and Environmental Science 120 (March 1, 2018): 012011, https://doi.org/10.1088/1755-1315/120/1/012011.
ENDNOTES
23. “Green Belt under Threat from 200,000 New Houses.”
24. Peter Bishop, “Repurposing the Green Belt in the 2st Century,” n.d., 185.
25. Polly Turton, “Urban Heat Risk Mapping and Visualisation in London,” n.d., 23.
26. Sergio Ulgiati and Amalia Zucaro, “Challenges in Urban Metabolism: Sustainability and Well-Being in Cities,” Frontiers in Sustainable Cities 1 (May 16, 2019): 1, https://doi.org/10.3389/ frsc.2019.00001.
27. “Embodied and Whole Life Carbon Assessment for Architects Sustainable Design,” accessed September 16, 2022, https://www.architecture.com/knowledge-and-resources/resources-landing-page/whole-life-carbon-assessment-for-architects.
28. By Alan Buis Laboratory NASA’s Jet Propulsion, ‘Milankovitch (Orbital) Cycles and Their Role in Earth’s Climate’, Climate Change: Vital Signs of the Planet, accessed 20 July 2022, https://climate.nasa.gov/news/2948/milankovitch-orbital-cycles-and-their-role-in-earths-climate.
29. Marshall Shepherd, “Carbon, Climate Change, and Controversy,” Animal Frontiers 1 (July 1, 2011): 5–13, https://doi.org/10.2527/af.2011-0001.
30. NASA Global Climate Change, “Carbon Dioxide Concentration | NASA Global Climate Change,” Climate Change: Vital Signs of the Planet, accessed July 20, 2022, https://climate.nasa.gov/vital-signs/carbon-dioxide.
31. Turton, “Urban Heat Risk Mapping and Visualisation in London.”
32. “London Air Pollution,” n.d., https://globalcleanair.org/data-to-action/london-uk/.
33. OMAI, “A FIELD GUIDE TO PUBLIC SPACES Are We Making Inclusive Choices in the Design and Management of Public Spaces That Help Promote a Democratic Society?,” n.d.
34. OMAI.
35. Cristian Alejandro Silva Lovera, “THE INTERSTITIAL SPACES OF URBAN SPRAWL: THE PLANNING PROBLEMS AND PROSPECTS – THE CASE OF SANTIAGO DE CHILE,” University College London, The Bartlett School of Planning, September 2016, 332.
36. Anna Jorgensen and Marian Tylecote, “Ambivalent Landscapes—Wilderness in the Urban Interstices,” Landscape Research 32, no. 4 (August 2007): 443–62, https://doi. org/10.1080/01426390701449802.
37. Jorgensen and Tylecote.
38. Orff, “Cohabit.”
39. “Deep Green,” n.d., https://www.ecologicstudio.com/projects/deep-green-urbansphere-venice.
40. Lovera, “THE INTERSTITIAL SPACES OF URBAN SPRAWL: THE PLANNING PROBLEMS AND PROSPECTS – THE CASE OF SANTIAGO DE CHILE.”
41. Dirk Hebel and Felix Heisel, eds., Cultivated Building Materials: Industrialized Natural Resources for Architecture and Construction (Basel: Birkhäuser, 2017).
42. Rachel Armstrong, Soft Living Architecture; An Alternative View of Bio-Informed Practice (London: Bloomsbury Publishing Plc, 2018).
43. [Hebel and Heisel, Cultivated Building Materials.
44. Marcos Cruz and Richard Beckett, “A Novel Approach towards Bio-Digital Materiality,” Bartlett School of Architecture; University College London, n.d., 20.
45. Armstrong, Soft Living Architecture; An Alternative View of Bio-Informed Practice.
46. IARC, “Wood Dust and Formaldehyde IARC Monographs on the Evaluation of Carcinogenic Risks to Humans Volume 62,” IARC Publications, 1995, https://publications.iarc.fr/80.
47. Zaira Zaman Chowdhury et al., “Influence of Carbonization Temperature on Physicochemical Properties of Biochar Derived from Slow Pyrolysis of Durian Wood (Durio Zibethinus) Sawdust,” BioResources 11, no. 2 (February 17, 2016): 3356–72, https://doi.org/10.15376/biores.11.2.3356-3372.
48. Chowdhur y et al.
49. Hassan Al-Haj Ibrahim, “Introductory Chapter: Pyrolysis,” in Recent Advances in Pyrolysis, ed. Hassan Al- Haj Ibrahim (IntechOpen, 2020), https://doi.org/10.5772/intechopen.90366.
50. Hebel and Heisel, Cultivated Building Materials.
51. Hebel and Heisel.
ENDNOTES
52. Chowdhur y et al., “Influence of Carbonization Temperature on Physicochemical Properties of Biochar Derived from Slow Pyrolysis of Durian Wood (Durio Zibethinus) Sawdust.”
53. Chowdhur y et al., ‘Influence of Carbonization Temperature on Physicochemical Properties of Biochar Derived from Slow Pyrolysis of Durian Wood (Durio Zibethinus) Sawdust’.
54. Chowdhur y et al., “Influence of Carbonization Temperature on Physicochemical Properties of Biochar Derived from Slow Pyrolysis of Durian Wood (Durio Zibethinus) Sawdust.”
55. Chowdhur y et al.
56. Hordern, Jane, “Carbon Capture Using Sawdust,” 2011, https://blogs.rsc.org/ee/2011/03/24/ carbon-capture-using-sawdust/?doing_wp_cron=1658157492.9371159076690673828125.
57. “Can a Moss Culture Really Clean Urban Air?,” November 22, 2017, https://www.greenhomegnome.com/moss-clean-urban-air/.
58. Stephen Cousins, “Carbon-Eating Bio Curtains – the Answer to City Pollution?,” RIBA, August 19, 2019, https://www.ribaj.com/products/carbon-capture-pollution-eating-algae-filled-curtains-bio-plastics-photosynthetica-ecologicstudio.
59. Holling, “Resilience and Stability of Ecological Systems.”
60. T. Pettit et al., “Do the Plants in Functional Green Walls Contribute to Their Ability to Filter Particulate Matter?,” Building and Environment 125 (November 15, 2017): 299–307, https://doi. org/10.1016/j.buildenv.2017.09.004.
61. Nurulshyha Md Yatim and Nur Izzatul Afifah Azman, “Moss as Bio-Indicator for Air Quality Monitoring at Different Air Quality Environment,” International Journal of Engineering and Advanced Technology 10, no. 5 (June 30, 2021): 43–47, https://doi.org/10.35940/ijeat.E2579.0610521.
62. Yatim and Azman.
63. “Experiencing Innovative Biomaterials for Buildings: Potentialities of Mosses | Elsevier Enhanced Reader,” accessed July 18, 2022, https://doi.org/10.1016/j.buildenv.2020.106708.
64. “MosSkin: A Moss-Based Lightweight Building System | Elsevier Enhanced Reader,” accessed July 18, 2022, https://doi.org/10.1016/j.buildenv.2022.109283.
65. “Tiny Algae and the Political Theater of Planting One Trillion Trees,” accessed July 20, 2022, https://parametric.press/issue-02/algae/.
66. “Online Atlas of the British and Irish Flora,” accessed September 16, 2022, https://plantatlas.brc. ac.uk/.
67. “Tiny Algae and the Political Theater of Planting One Trillion Trees.”
68. “Tiny Algae and the Political Theater of Planting One Trillion Trees.”
69. Vetrivel Anguselvi et al., CO2 Capture for Industries by Algae, Algae (IntechOpen, 2019), https:// doi.org/10.5772/intechopen.81800.
70. “Minimizing Carbon Footprint via Microalgae as a Biological Capture | Elsevier Enhanced Reader,” accessed July 20, 2022, https://doi.org/10.1016/j.ccst.2021.100007.
71. “Deep Green.”
72. Jennifer Hahn, “Blast Studio 3D Prints Column from Mycelium to Make ‘Architecture That Could Feed People,’” Dezeen, January 18, 2022, https://www.dezeen.com/2022/01/18/blast-studio-tree-column-mycelium-design/#.
73. Hahn.
74. Hahn.
75. Claudia Pasquero and Marco Poletto, ‘Steam Cloud V2.0 by EcoLogicStudio’, 2008, https://www.ecologicstudio.com/projects/stemcloud-seville-art-and-architecture-biennale-2008.
76. Pasquero and Poletto, “Steam Cloud V2.0 by EcoLogicStudio.”
METHODOLOGY
METHODOLOGY OVERVIEW
One of the aims of the project is to develop a methodology which emphasises the necessary steps to be undertaken to attain equilibrium between the biological scale of material experimentation and its execution, without detracting from the morphological development of nature-based systems. For this reason, the methodology surrounding the design of the proposed network modules should work synergistically with proposed biological growth; it would be inappropriate to implement methods that are contrary to one another. Given that a green network is being proposed, it needs to take cues from real patterns existing in nature. For this reason, Diffusion Limited Aggregation (DLA) is an appropriate starting point in developing network relationships as this proves efficient at the scale of urban distritributions as well as naturally occurring bifurcations existing in ecological landscape. If this is established as the hypothesis outset, then the morphological development of the module should continue in the same way. Differential growth, outlined further, is a space-filling method echoed in cellular distributions, organised in nodal or linear connections. This, in conjunction with inherent behaviours to be embedded within the organisational logic of the modules, creates strict rules for the combinatory connections that must fit within urban spatial implication. The development of a biological material to be used in these scenarios must not conflict or create a limitation to the natural, ecological growth cycle. The need to standardise a modular component for fabrication is crucial given the quantity needed to produce an urban network. Automation of a kit of parts to develop regularised elements plays a role in the selection of Computer Numerical Control (CNC) fabrication and robotic extrusion; allowing for precise economic mass assembly of structural scaffolds to be interjected with robotically extruded custom geometries for each module to serve its functional purpose.
These methods developed at the MSC phase are the basis by which the network generation, component development and morphological specificity can be tested. The use of these methods are highly influenced by the number of iterations, levels of optimisation and their executability aspects, which will define the specificity of detailing to be explored in the MArch phase based on the observations and documented outcomes. This exploration redefines the brief by which spatial design and its consequences will provide a larger consideration for assembly systems and programmatic specificity in the second phase- attesting that the project can situate within contemporary urban detailing and planning.
DIFFUSION LIMITED AGGREGATION
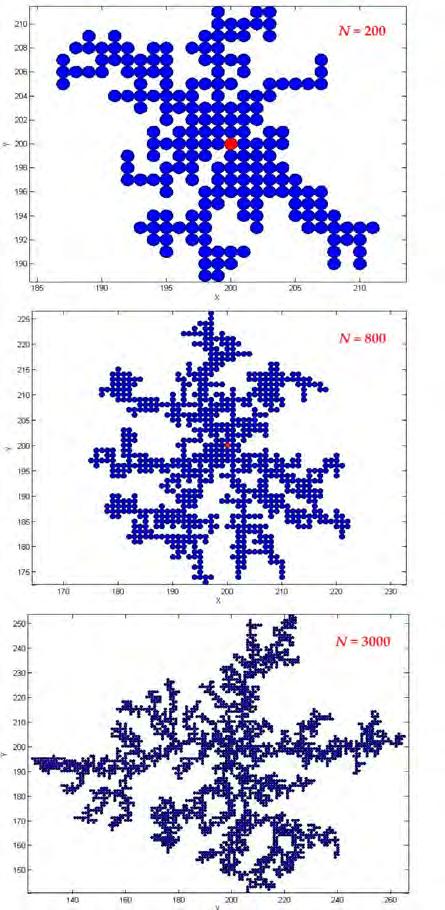
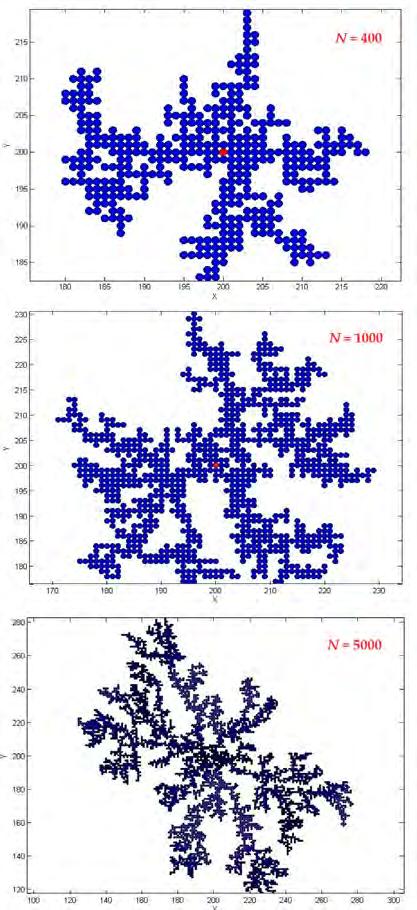
“The presence of pattern formation in nature, the seemingly impossible feat of creating order from random and disordered processes, is an inherently captivating and intriguing phenomenon. One model in particular that has received a great deal of attention over the past couple decades is the Diffusion-Limited Aggregation (DLA) Model, a deceptively simple stochastic growth model that accurately simulates the growth patterns of objects ranging from snowflakes to entire galaxies.“78 This type of aggregation occurs in a variety of systems such as the formation of river networks, frost on glass, or veins of minerals in geologic formations.79
Witten and Sander first introduced the idea in 198180 and created a straightforward method to simulate the formation of clusters in aerosols utilising diffusion and Brownian motion as the primary particle behaviour governing transport processes. Since then, many variations of this simple DLA algorithm have been developed to mimic a wide range of physical development processes.81 The basic theory for the DLA model involves considering colloidal particles undergoing Brownian motion in some fluid and their subsequent irreversibly contact with one another.82 The clusters produced by this method are fractal and highly branched. The cluster’s fractal structure develops as a result of the faster-growing regions shielding the slower-growing regions, which make the cluster less accessible to incoming particles.83
Attracted Diffusion-Limited Aggregation is employed as a system for development of the green network, where each particle is considered an attractor point for the next particle attachment. The attracted DLA model helps to decrease the randomness of the generated network. In this way, DLA is an appropriate system which behaves similar to the metabolic balance and exchanges outlined in the simulation of biological growth systems.
21. 2D
aggregates with versatile particle numbers 77
Fig.
DLA
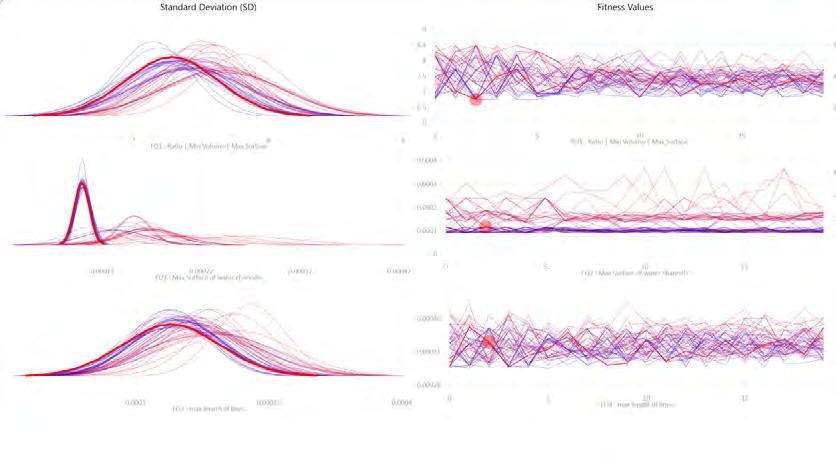
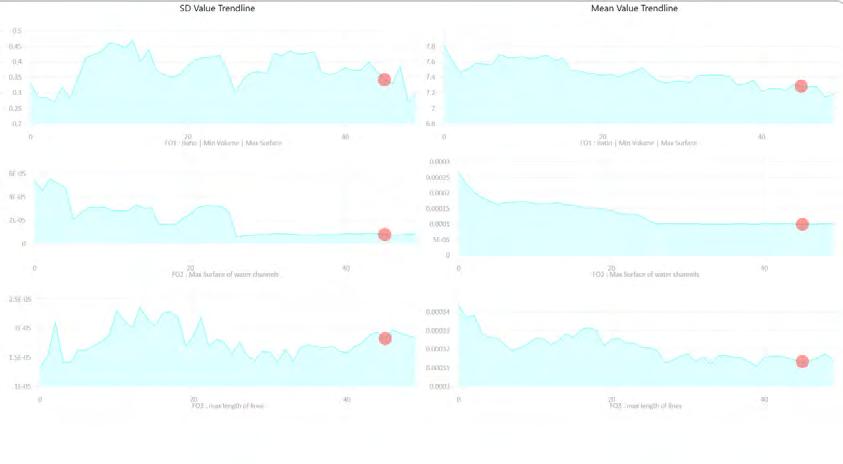
Fig. 22. Standard Deviation graphs. The graphs plot all three fitness objectives. The red dots and curves show the selected solution in the entire simulation. It shows how successfully or unsuccessfully simulation optimised this solution for the three fitness objectives.
EVOLUTIONARY OPTIMISATION
An evolutionary architecture aims to achieve in the built environment the symbiotic behaviour and metabolic balance that are characteristic of the natural environment.84 The evolutionary design method tends to establish a balance within the opposing aims by considering local environmental variables, their effect on the performance of the buildings, and at the same time consideration for fast-changing societal demands and needs. Naturally occurring evolutionary optimisation is therefore in keeping with the ethos of the methodology outline; anticipating that the system will self-regulate into its optimally performing purpose. This method will be used to cross-reference its efficacy at multiple scales; the morphological development of the modules as they respond to specific environmental issues ie. positioning in space, regulation to change, repositioning after criteria has been met, the development at the material scale ie. which geometries best fit specific needs of the varying bio-tissues and the adaptability of the network to different contextual cues ie. geographical location changes.
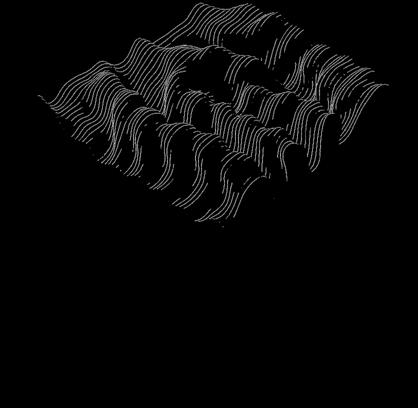
DIFFERENTIAL GROWTH
Biological systems have developed versatile design strategies through evolution over billions of years. Uncovering these design principles not only elucidates the mechanisms underlying the evolution of living systems, but also establishes the scientific basis for biomimetics whereby advanced materials and systems could be developed based on lessons learned from nature.85 “Differential growth is a feature of cells, the organs which they construct, and the whole plant itself. The term “differential growth” is used generally in the sense of growth that results in curvature or similar distortion in the outline of a tissue or organ.”86 Morphogenesis is achieved by differential growth of tissues in response to the controlled distribution of the level of growth factors, and/or different growth rates among different constituent parts.87 “The importance of differential growth in plant morphogenesis is inescapable and may be said to lie at the heart of evolutionary implications.”88
Different fields mimic differential growth methods using a range of computer simulation approaches. The majority of these models rely on particle collisions, using engines for physics simulation. Differential Growth has approximately three derivatives: point-based approach, line based model and edge-based simulation.89 A flat or curved surface may be filled up utilising the point-based method of polyline growth and division, which uses circular packing to prevent self-intersection. Line-based simulation is where the active growth area initially starts from a point, but rather than dividing into two distinct points, those points remain united to form an expanding line. The third approach is an edge-based model, where the active growth area is the edge of the surface.
The point-based and edge-based model will be implemented as the appropriate choice for module development given that relationships between surface and volume will be identified.
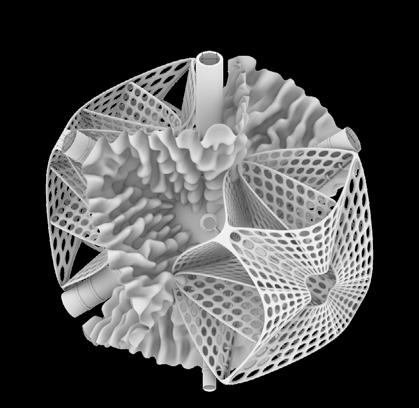
Fig. 23. Differential growth. Point based method of polyline growth. CNC model
Fig. 24. Differential growth. Point based method of polyline growth. CNC model

ROBOTIC 3D PRINTING
The need to investigate new solutions and novel 3-D building strategies not only requires the development of new algorithms but also reconsiderations of existing technological aspects for developing building fabrication techniques- frequently driven by economic and sustainable measures. In this context, additive manufacturing plays a huge role. Additive manufacturing is the process of creating an object by building it one layer at a time. It is the opposite of subtractive manufacturing, in which an object is created by cutting away at a solid block of material until the final product is complete.90
One of the main advantages of additive manufacturing is the feasibility of building up complex morphologies which can be limited by subtractive manufacturing. For this reason, additive manufacturing via robotic arm can change the threshold of possible fabrication techniques by utilising dimensional axial control factors in order to generate dynamic tool paths. This can effectively be extruded by identifying a custom end effector nozzle attached to the robotic arm in order to integrate 3-D printing for fabrication. The robotic arm fabricated by KUKA Robotics has six axes of control and proven extremely successful in the building industry. The printing process involves the superimposition of thermoplastic ABS or PLA material along the direction of gravity. The print head mimics the structure of spider silk thread In so doing, the system is able to print self-supporting forms and grow the form from bottom-up. This technique has proven to be highly sustainable in the past few years as it has aided additive manufacturing using novel biomaterials. Its successful experiments open new avenues of research to explore how to 3-D print newly devised bio materials such as mycelium, cellulose, algae and, in the case of this research proposal, timber saw dust.
Fig. 25. Graphical representation of Robotic extrusion process of the plants’ structure created using the differential growth algorithm
CNC MILLING
Modular prototyping of building materials is not only a cost effective methodology used in the building industry, but also the future of sustainable and eco-friendly building manufacturing methods. Modular prototyping has been practised in the age-old technique of using moulds to fabricate building blocks. Moulding is a manufacturing process that involves shaping a liquid or malleable raw material by using a fixed frame, known as either a mould or a matrix. The advantages of fabrication of building material parts through modular moulds are efficient high production, low cost per part, repeatability, large material choice, low waste generation, high detail and little or no post-processing.
Computer Numerical Control (CNC) machining or milling is an effective technique to produce highly detailed and intricate moulds. CNC machines provide computerised controls to produce a custom-designed part or product of high quality and precise finish. Using subtractive machining technology, CNC milling can produce high and low volumes of highly complex and intricate parts. Furthermore, it allows for high production output and is a less labour intensive process.91 Advancement in the mould production process in order to create building materials made from novel biomaterial with variable baking temperature is a highly sustainable breakthrough in the world where production of synthetic building materials thrive. Double moulding techniques using CNC milling and silicone moulding provide a platform to make use of custom techniques for a greater cause of sustainability.
Fig. 26. Graphical representation of CNC milling process of living tissue structure created using the differential growth algorithm
CHAPTER CONCLUSION
Diffusion Limited Aggregation (DLA), differential growth and evolutionary optimisations set up the framework to explore nature-based systems and their implications in designing network strategies to be developed modularly. This allows for parallel areas of research which can, at this stage, be separated to allow for more site-specific solutions. Furthermore, by considering the possibility of the module to share similar structural assemblies via economic mass production, robotic extrusion methods can be implemented in order to achieve the complex geometries drawn from biomimetic growth models. By implementing digital (robotic) and analogue (moulding) methods in the physical prototyping, a sustainable workflow to devise ergonomic building fabrication techniques can be developed.
ENDNOTES
77. Dong jing Liu et al., “Fractal Simulation of Flocculation Processes Using a Diffusion-Limited Aggregation Model,” Fractal and Fractional 1, no. 1 (November 18, 2017): 12, https://doi.org/10.3390/ fractalfract1010012.
78. Vinay Sharanappa Rajur, ‘Modelling Diffusion Limited Aggregation’, 2015, https://doi. org/10.13140/RG.2.1.4269.3283.
79. Thomas C. Halsey, “Diffusion-Limited Aggregation: A Model for Pattern Formation,” Physics Today 53, no. 11 (November 2000): 36–41, https://doi.org/10.1063/1.1333284.
80. Rajur, ‘Modelling Diffusion Limited Aggregation’.
81. Rajur, ‘Modelling Diffusion Limited Aggregation’.
82. Halsey, “Diffusion-Limited Aggregation.”
83. Halsey.
84. John Frazer, An Evolutionary Architecture (London: E.G. Bond Ltd, 1995).
85. Chang jin Huang et al., “Differential Growth and Shape Formation in Plant Organs,” Proceedings of the National Academy of Sciences 115, no. 49 (December 4, 2018): 12359–64, https://doi. org/10.1073/pnas.1811296115.
86. Peter W. Barlow, Differential Growth in Plants (Oxford, New York: Pergamon Press, 1989).
87. Huang et al., “Differential Growth and Shape Formation in Plant Organs.”
88. Barlow, Differential Growth in Plants.
89. Yufan Xie, “Differential Growth Research,” U-V-N (blog), August 23, 2017, http://uvnlab.com/differential-growth-research-en/.
90. Rebecca Linke, “Additive Manufacturing, Explained,” MIT Management Sloan School, December 7, 2017, https://mitsloan.mit.edu/ideas-made-to-matter/additive-manufacturing-explained#:~:text=What%20is%20additive%20manufacturing%3F,the%20final%20product%20is%20complete.
91. Junying Metal Manufacturing Co., Limited, “CNC Milling Guide – CNC Milling Advantages & Disadvantages, Application, Materials and Definition,” n.d., https://www.cnclathing.com/guide/ cnc-milling-guide-cnc-milling-advantages-disadvantages-application-materials-and-definition.
RESEARCH DEVELOPMENT
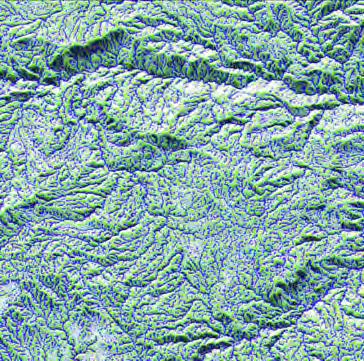
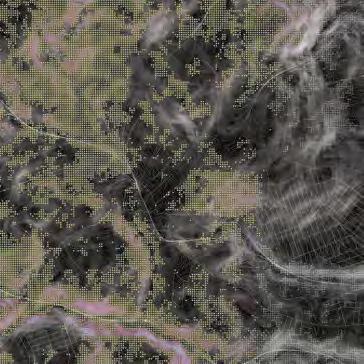
CONTEXT ANALYSIS
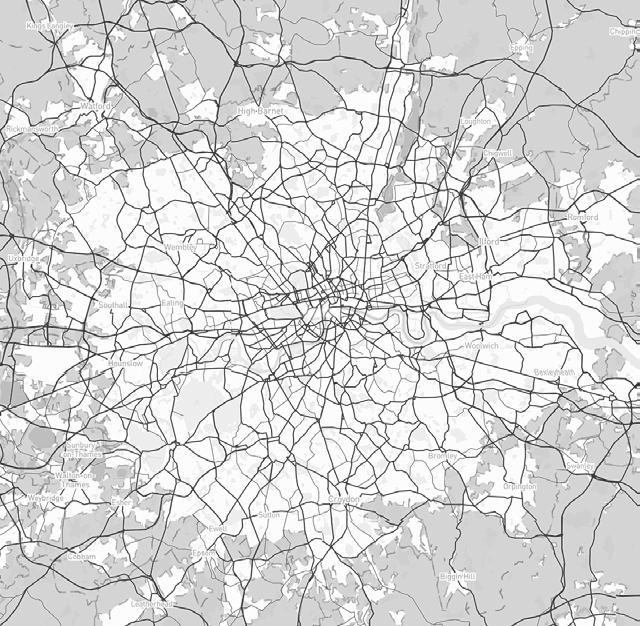
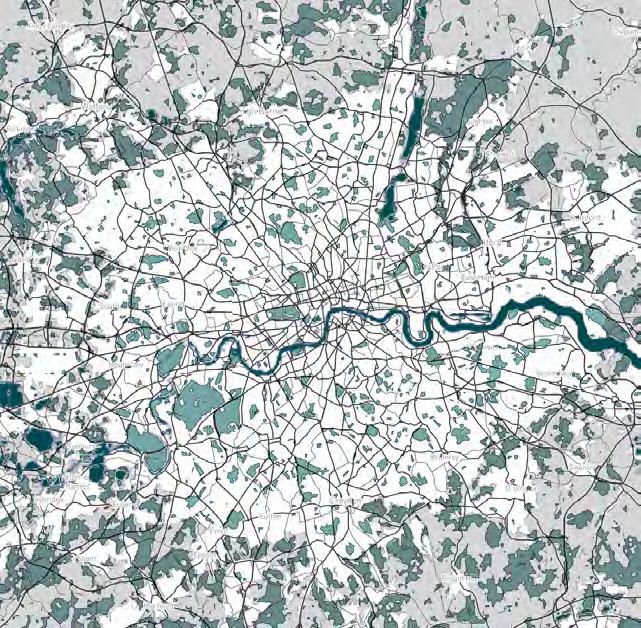

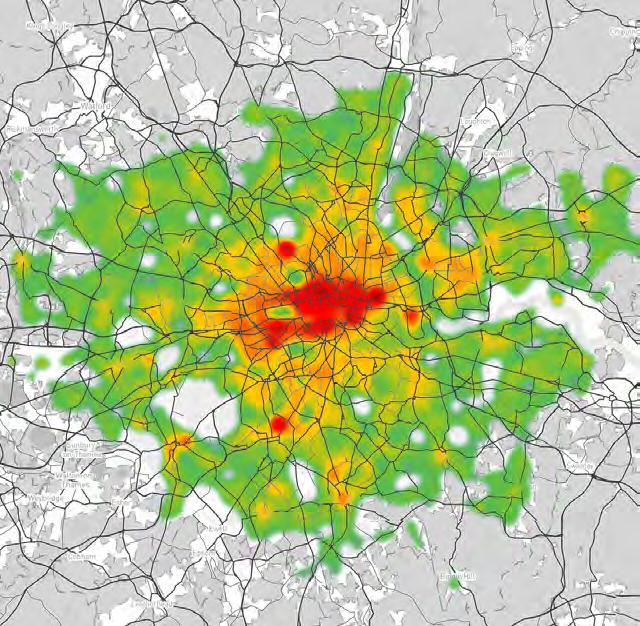
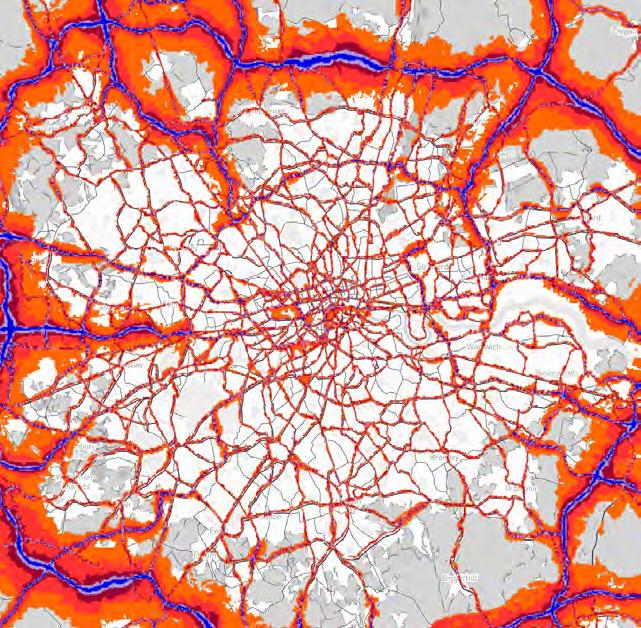
Fig. 27. Metropolitan Green belt
Fig. 29. Annual heat demand (MWh)
Fig. 28. Green tissue of London
Fig. 30. Avg noise level (dB)
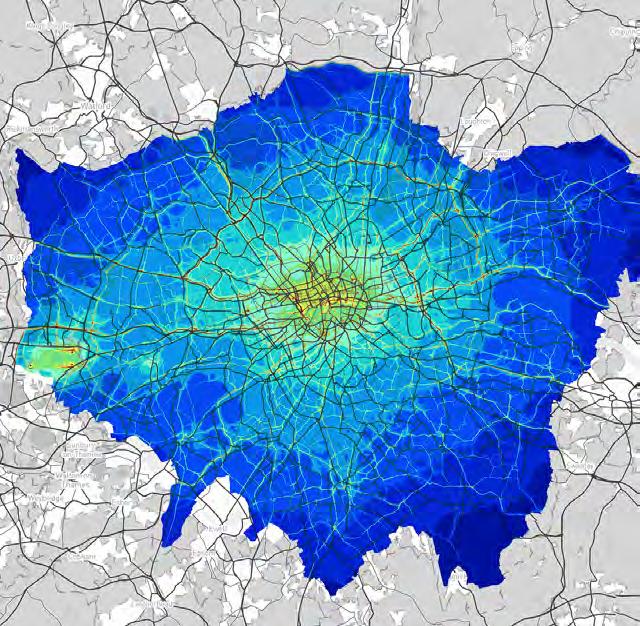
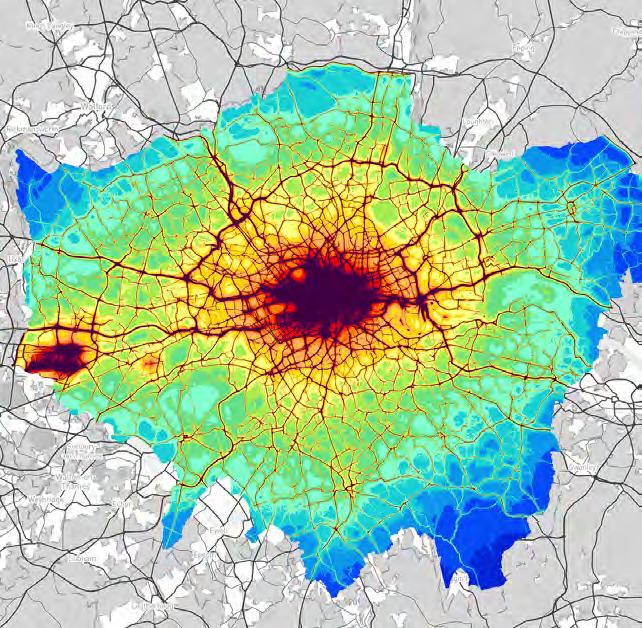
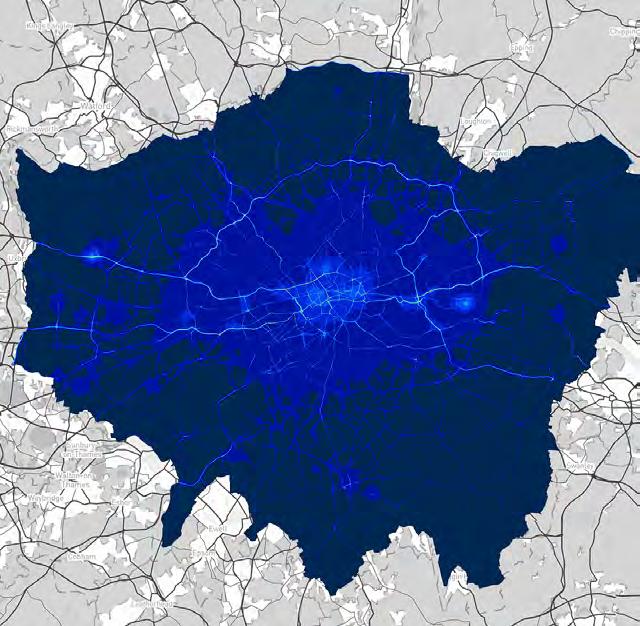
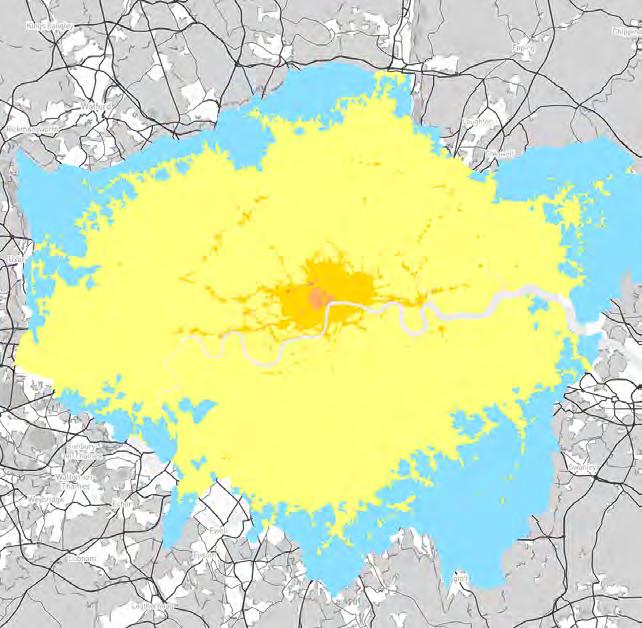
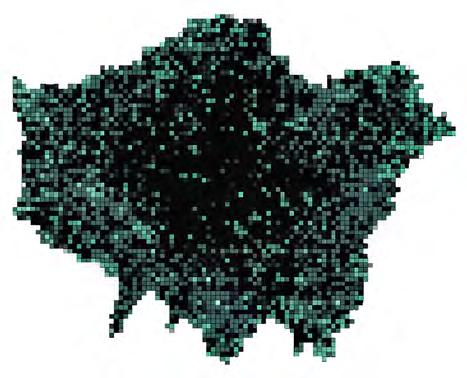
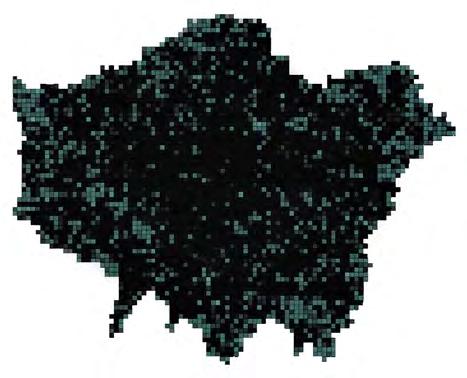
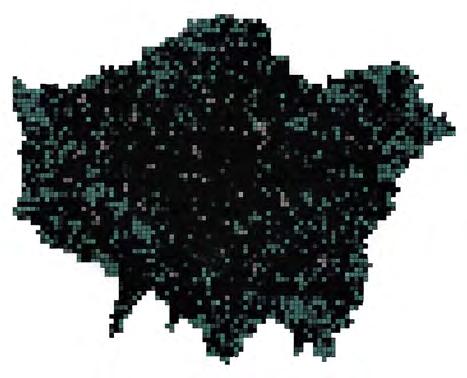
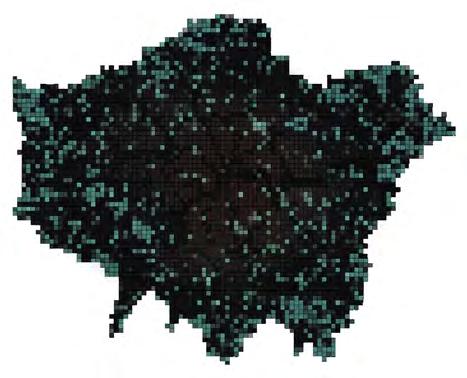
Fig. 31. Annual mean NO2 (µg/m3)
Fig. 33. Annual mean PM10 (µg/m3)
Fig. 32. Annual mean NOX(µg/m3)
Fig. 34. Annual mean PM2.5 (µg/m3)
CONTEXT ANALYSIS
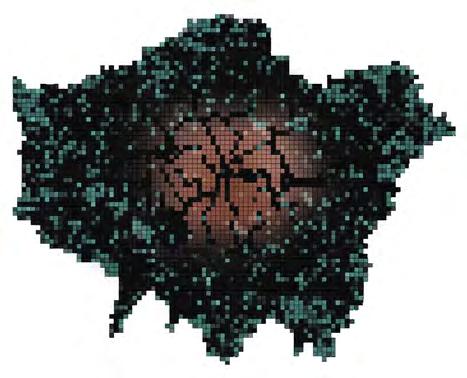
In selecting London’s Green Belt as the scope for intervention, research was compiled and overlaid in order to specify a location of intervention within the metropolitan area. Its protected area identified in between the urban condition and the perimeter of the Green Belt delineates the larger boundary between the unbuilt to the built environment. The green tissue confirms that while there are green spaces within the urban environment there is no continuity between the Green Belt tissue (Fig.28) into any area outside the larger ring- thus establishing the justification for implementing bio-bot as a connective living membrane for creating and preserving contiguous green space. In order to understand the disruption of possible metabolic balances within fragmented ecosystems analysis needs to include interference from human activity to extract the root connections. As mentioned by Haoyang, forest loss not only creates more area for urban construction but disrupts the relationship that green tissue has between the production and absorption of CO2; impractical for green-house emission - a crucial identification in why revitalising green living tissue needs to be implemented. Moreover, identifying that the annual heat demand (Fig.29) is localised within Central London where the densest accumulation of built spaces exists signified that this accumulation of masses disrupts the urban metabolic balance of self-thermoregulation which results in the ‘urban heat island effect.’ This directly impacts any surrounding ecosystems and habitats which have been pushed out further from the city boundary toward the Green Belt, otherwise identified as species encroachment. Noise and light pollution further disrupt any balance of nocturnal species post-Edison. The overdeveloped central areas create negative feedback effects directly back to its human occupants. Urbanisation which has facilitated the development of expansive road networks is a large proponent of the annual mean nitrogen dioxide (NO2) and nitrogen oxide (NOx). (Fig.31-32) Road transport is estimated to be responsible for about 50% of total emissions of nitrogen oxides92 which occur during fossil fuel combustion and is directly associated with respiratory inflammation. As nitrogen is deposited into the environment as dry or wet deposition, it can change soil chemistry and affect biodiversity in sensitive habitats.93 In order to lower nitrogen oxide emissions, London has implemented the Low Emission Zone (LEZ) and Ultra Low Emission Zone (ULEZ) controlling vehicle emissions tracked across monitoring sites. Furthermore, when nitrogen oxides react with other chemicals in the air they form both particulate matter (PM) and ozone.94 PM10 (10 microns in diameter and inhalable) and PM2.5 (2.5 microns) index and annual concentrations for air quality regulations should be considered to understand the effects that overbuilt environments expound on their surroundings (Fig.33-34). “Around half of UK concentrations of PM comes from anthropogenic sources such as domestic wood burning and tyre and brake wear from vehicles,”95 and are being heavily monitored by the Air Quality Standards Regulations 2010 due to their toxicity upon entering the bloodstream. The identification of these layers of pollution localises possible interventions for the site by pinpointing worst-case scenarios in Central London as a starting strategy.
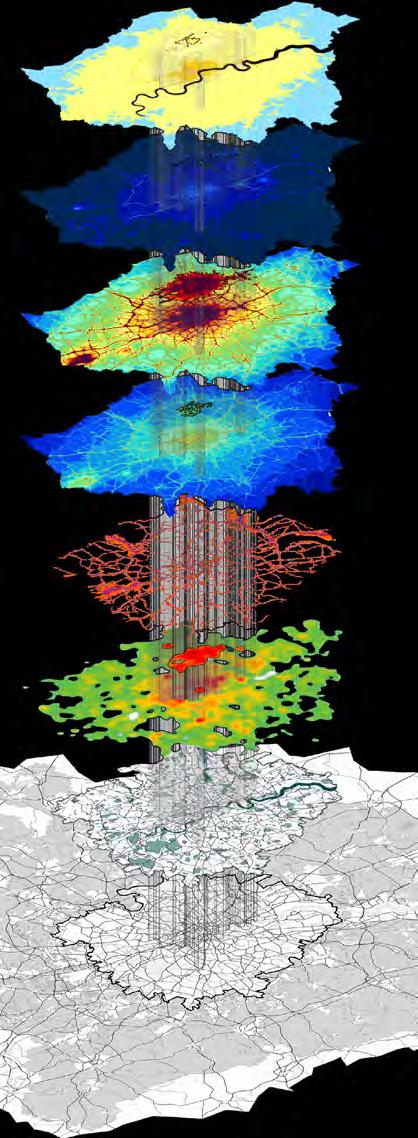
35. Exploded diagram of pollution levels in London with overlaid the most polluted areas
Fig.
POLLUTION LAYERS
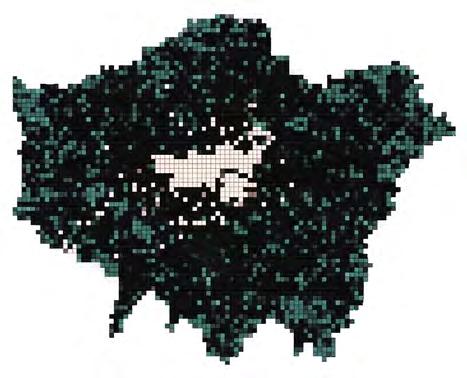
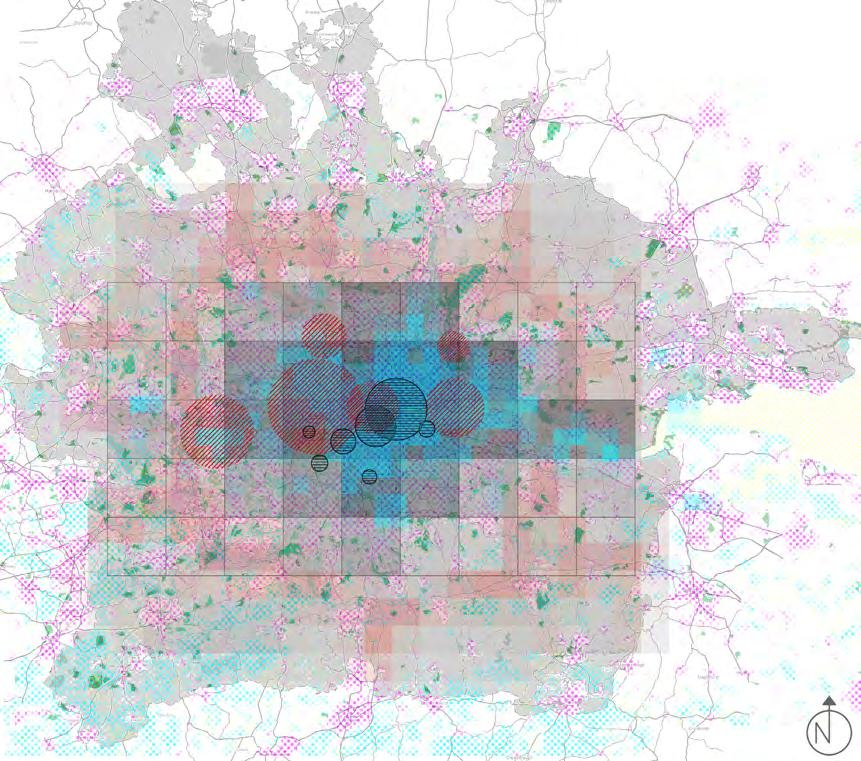
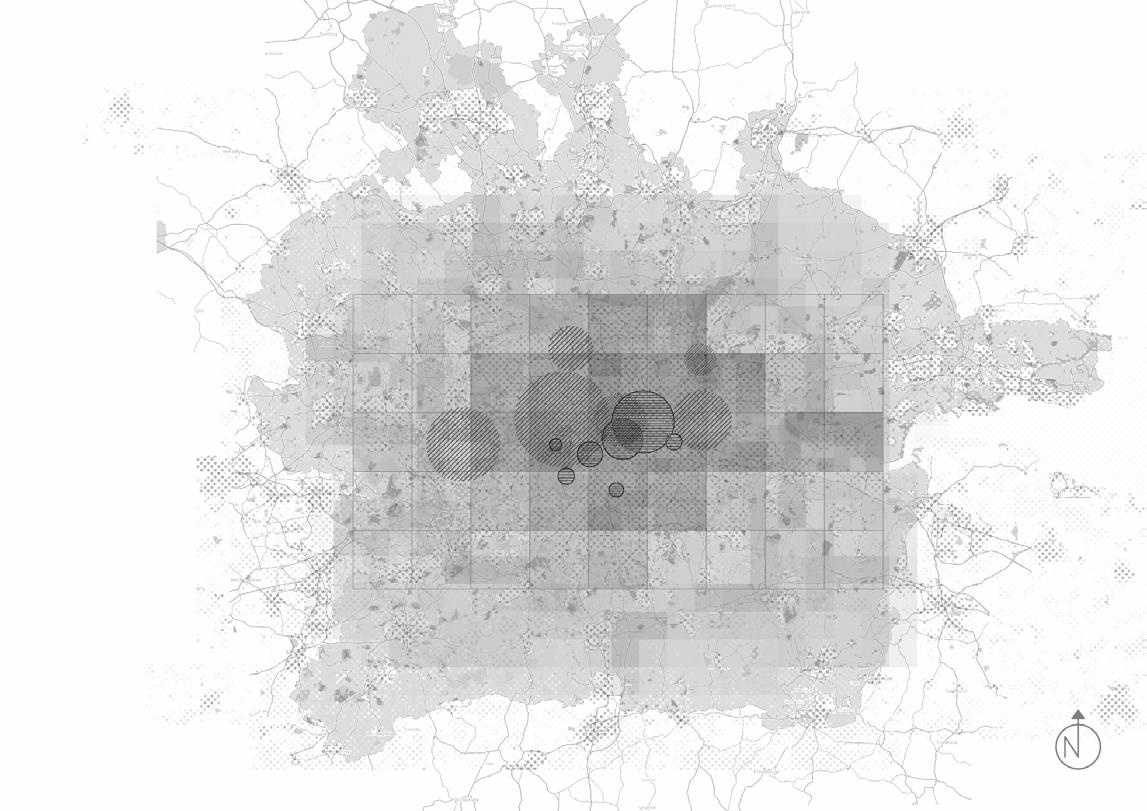
Fig. 36. The diagram shows the overlapped pollution layers
The overlay of this information defines the intersections and thus possible areas of intervention within London (Fig.36). Furthermore, by isolating light pollution, waste, water and noise pollution created as a result of human activity, the areas of intervention can be considered areas of highest pollution; arbitration for the worst-case scenario. This is important in assessing the time frame that is necessary between the purification of the area, rebalancing its natural state and transitioning to a homeostatic state in which it can be preserved and protected. Measurable quantification of the pollution levels removed should be documented in order to gauge them against other locations to determine the life-span of the bio-bot.
In consideration for the implementation of biobot to be utilised such that it mitigates fragmented landscapes, its connectivity of green tissue and metabolic engagement in situ positions the project’s adaptability. By selecting a location for
AREA OF INVESTIGATION
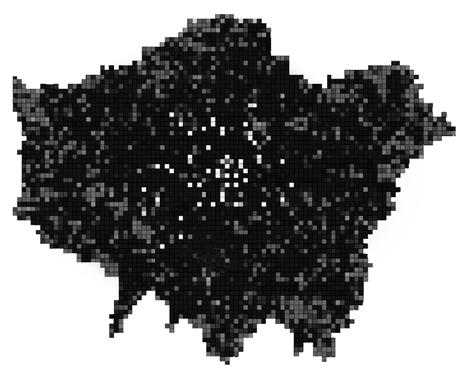
Fig. 37. The diagram shows the extracted area of investigation located in highly dense and polluted region
a global-scale solution, there are three proposed locations to prove the adaptability of the research within the network of living tissue (Fig.37). These vary according to their physical scale (spatial distributions), density of human occupants, proximity or separation from the existing green landscape, and intensities of intervention (pollution). While different conditions of degradation, pollution and preservation must be met from environmental and sustainability criteria, it is crucial to acknowledge that varying network growth must be considered on a site-by-site basis. Moreover, the temporality of modules will change according to the timeframe needed in order to fully establish a cyclical and reparative relationship between the existing environment and the purification rebalancing via the bio-bot modular network. Thus, the degraded green space will become both revitalised and prioritised through conscious maintenance of the system. The extracted, layered information arrives at Soho, Central London to be the first area of intervention at a small scale, medium density, far proximity from non-human designated green spaces.
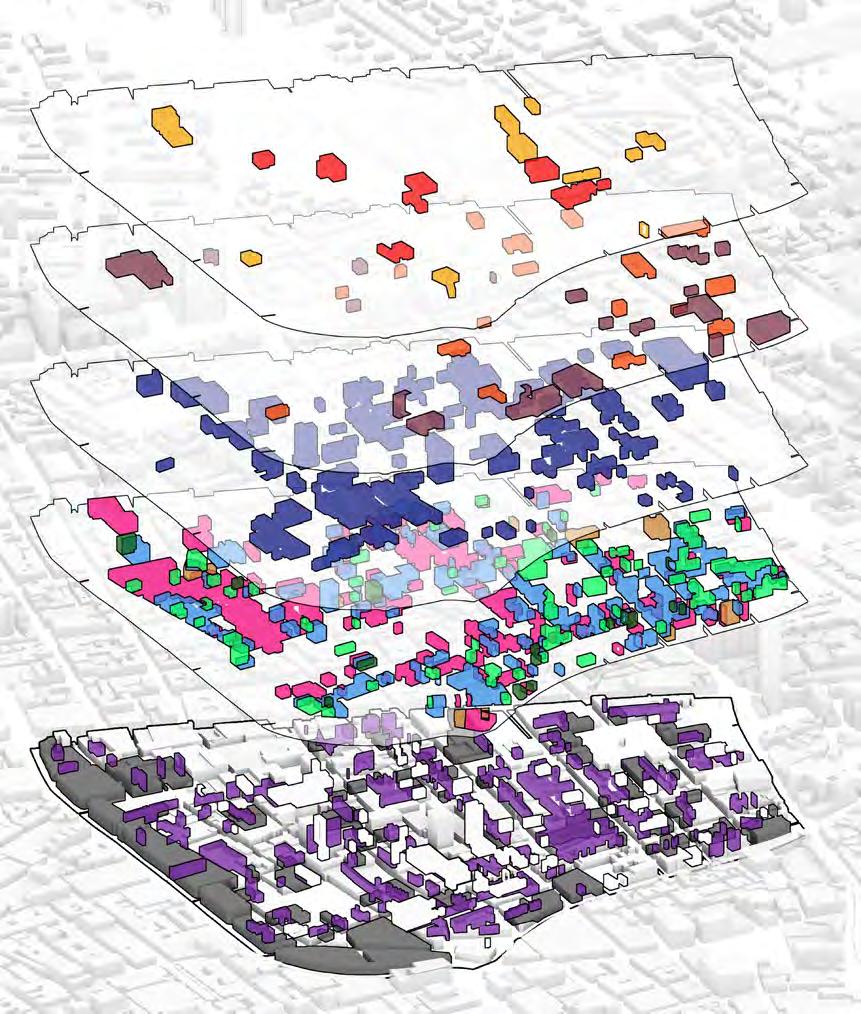
The strategy of layering information confirms Soho, Central London as a highly polluted and mid-density scenario for intervention. A closer analysis of the programmatic distribution of functionality revealed that Soho has not only has a wide spread of hospitality, entertainment, leisure, a smaller range of business, retail and three grades of historically conserved buildings.96 This sets up limitations for intervention within the scope of bio-bot. While the conservation grade buildings cannot be intervened in that fundamentally changes the historical appearance and integrity of the structure, interventions that provide amenable environmental situations are encouraged. So, to work within this framework limitations need to be set up in order to avoid interference such as setbacks, proximity to ground or roof and accessibility to the transportation network simultaneously for vehicles and pedestrians. Moreover, the identification of the interstitial spaces such as dead ends allows for a thoughtful place to begin reframing how underutilised spaces within the urban fabric can be revitalised as well. This creates a spatial moment that can be designed to reconsider how humans can interact in this area differently. The domain chapter sets up the argument that a new level of human to human, human to machine (or in this case bio-bot), human to nature, or nature to machine (Bio-bot) can occur within the ‘third space’. Furthermore, depending on the programmatic distribution of what is within this interstitial space, the functionality can be detailed to include the surrounding functions without disrupting the planned usage. A new type of ‘third space’ can take into consideration the proximity of nearby hospitality industries or create a space in which tem-
Fig. 38. Soho programmatic distribution of functions
Hotel
Residential
Non-residential | Institution
Lesure
Business
Retail
Drinking establishment
Restaurant | cafe
Interstitial spaces
Vacant building
Historical protected building
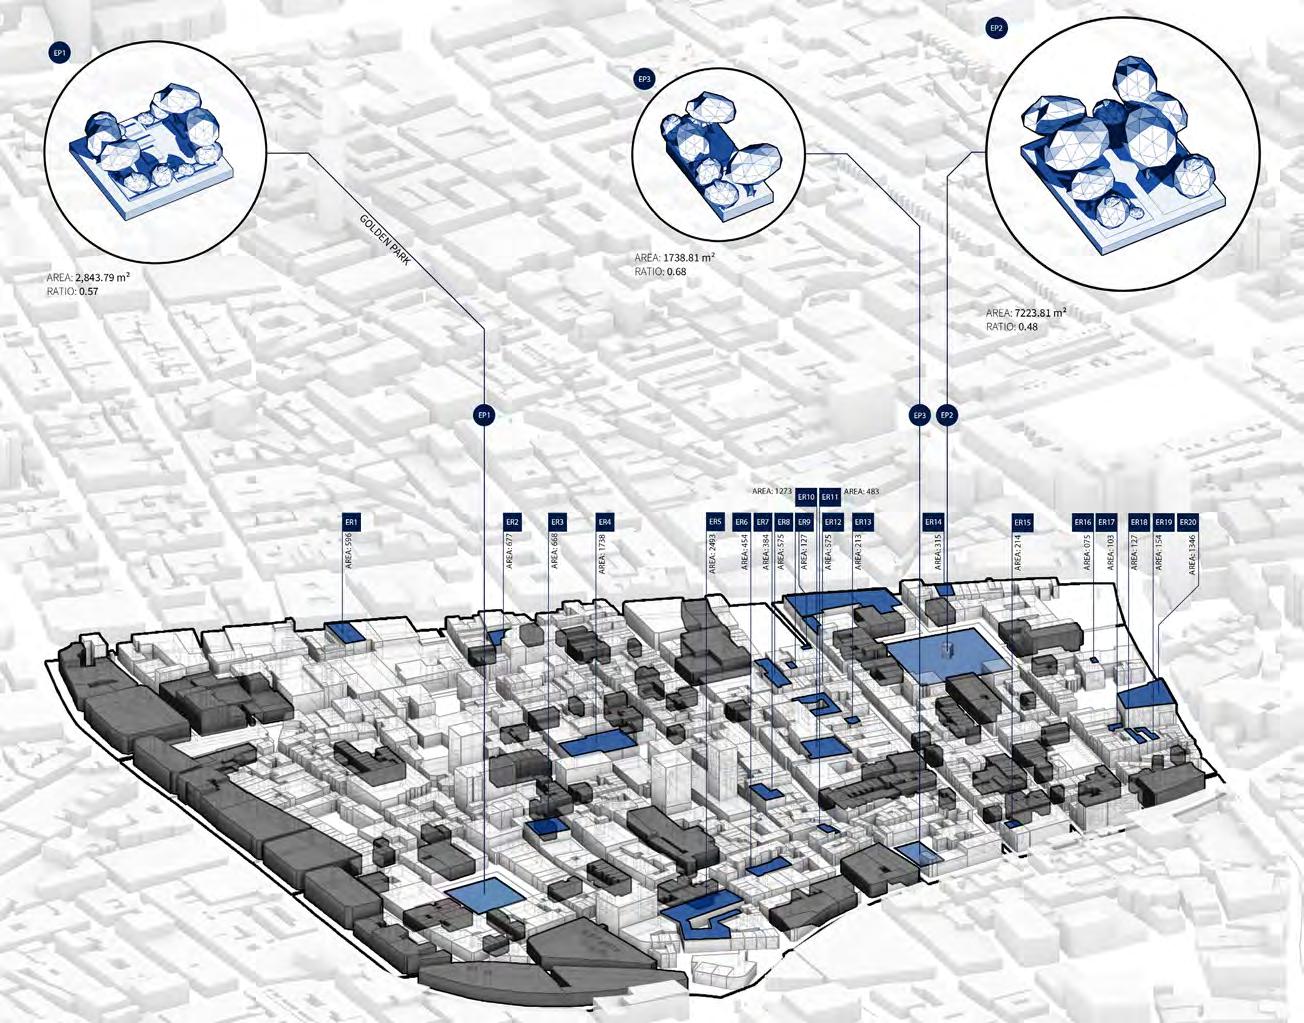
porary leisure can occur for the occupants; spatial configurations for marketplaces, moments of reprieve between commuting; an atmosphere that engages while stimulating a purified environmental sphere in a highly polluted area.
Fig. 38 takes into reflects the programmatic distributions of Fig. 39 while making considerations for the green tissue within the urban context of Soho, London. The mapping identifies human-designated parks, green roofs (or roofs with green tissue atop) and existing green landscape against the historically protected buildings. This is the first step in delineating the connections between these three nodes. While there can be many permutations of different networks, they need to be considered against their limitations. Their areas are measured in order to understand the hierarchical organisation in regard to location. The inclination to prioritise human-designated parks over existing green tissue due to their size comparatively goes against the problem of fragmentation. In order to rehabilitate existing green tissue, it needs to be tied back to larger green spaces- rather than working in reverse. Furthermore, what is extracted from this diagrammatic analysis are the usable 3-D surfaces which provide a jumping off point; the plane of usable ground, the same plane above the ground at roof level, particular elevational planes and planes which cannot be allowed any intervention.
Fig. 39. Context analysis; Identification of green spaces such as parks, and green roofs. Extraction of possible areas of implementation such as underused interstitial spaces, empty areas on facades and roofs
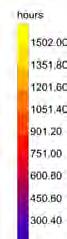
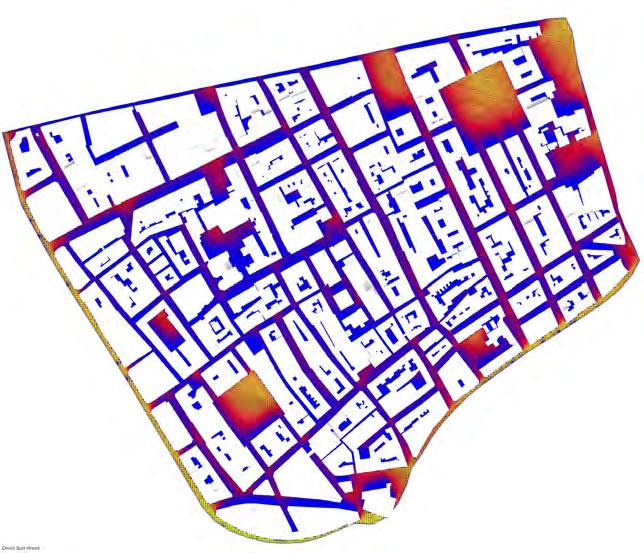
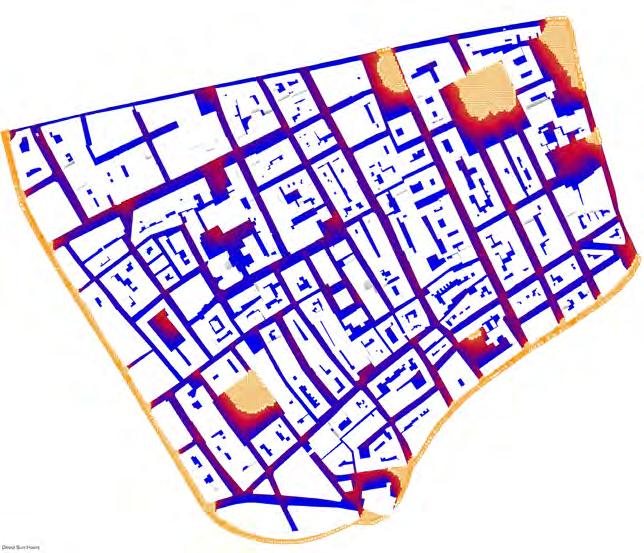

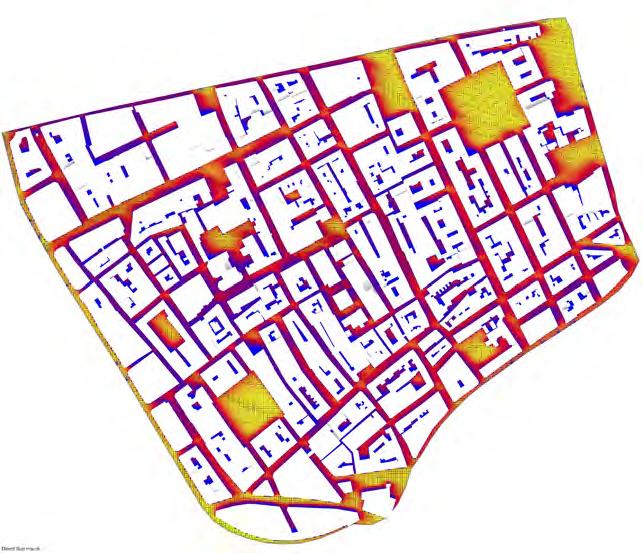
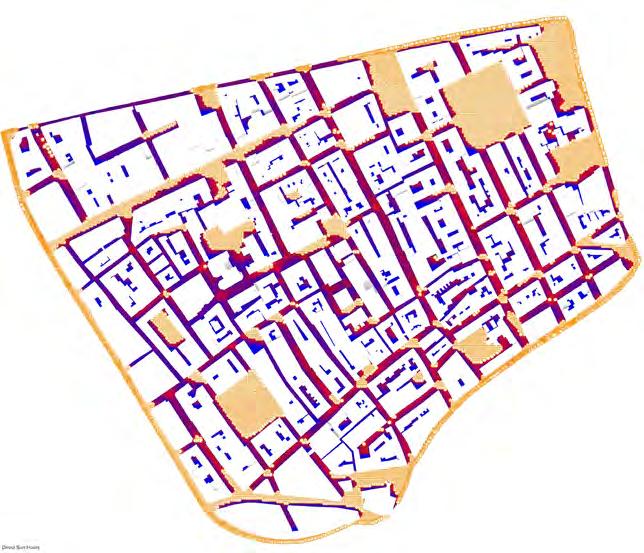
Extensive depletion of the atmospheric ozone layer affects the absorption of solar ultraviolet radiation which radiates back terrestrially as heat.97 The annual solar radiation analysis of Soho reveals an increase of 300 hours between the winter solar radiation between November through March versus the summer months of April through October. (Fig.40-43) The highest collections of radiation can be seen accumulating within the interstitial spaces; the winter ranges between 600 to 1057 direct solar hours and 910 to 1820 direct solar hours in the summer. This is indicative of the fact that while interstitial spaces may be prioritised lower in the typical functionality of space planning, the exposure to sunlight and, as a by-product of heat emissivity, radiates off the ground and exposes it thermally back into the environment. Respectively for winter and summer, solar analysis identifies areas that receive more than 8 hours daily throughout the year. (Fig.41,43) It can be concluded that this 8+ hour daily exposure will have a compounding effect on the thermal conductivity when the surface albedo is taken into consideration. However, the direct solar radiation hours on the envelopes of the site context indicate that both in winter and summer months there is consistently high enough exposure such that at this scale of intervention, it can be deduced that all buildings consistently overheat during both seasons; the data cannot be used on its own as a viable environmental parameter. If, however, it is to be implemented as a parameter against which the
Fig. 40. Solar gain during the winter season from October until March
Fig. 41. Sample points on the surfaces on the ground level that receive more than 8 direct sun hours a day during the winter season
Fig. 42. Solar gain during the Summer season from April until September
Fig. 43. Sample points on the surfaces on the ground level that receive more than 8 direct sun hours a day during the Summer season
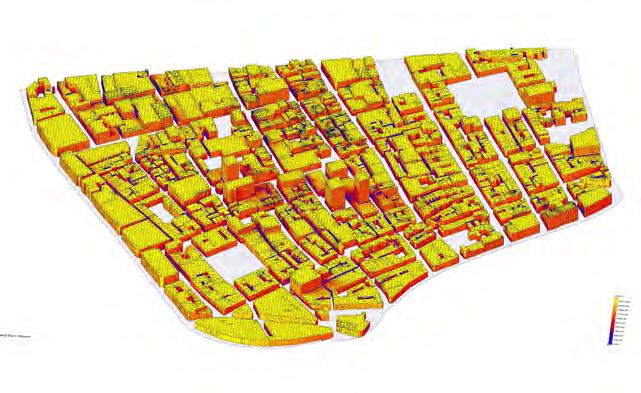
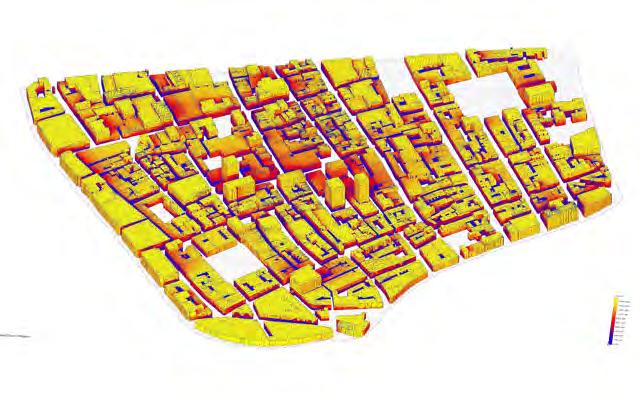
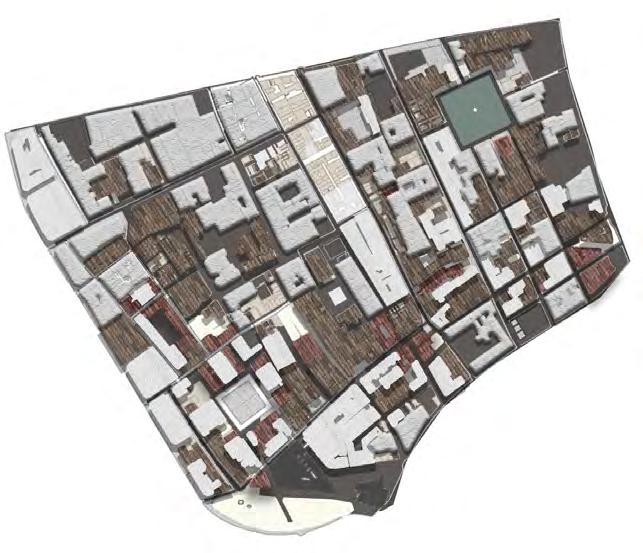
Fig.
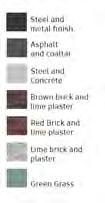
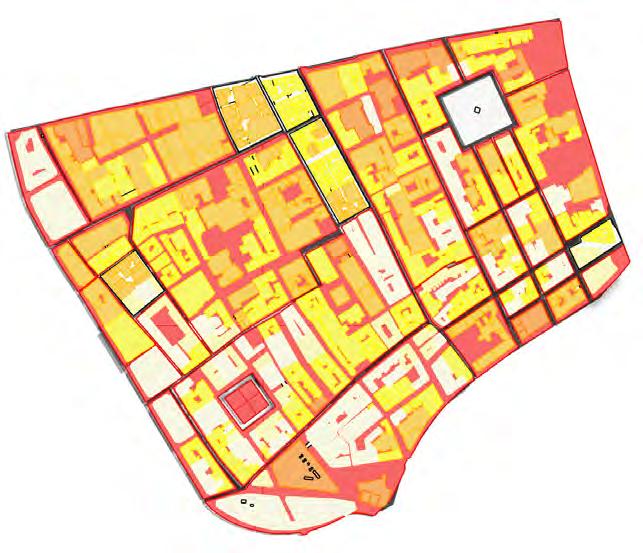
performance of the bio-bot is being critically evaluated for performance (whether it is measurably aiding to thermoregulate space, whether it is efficiently created self-shadowing or whether it can quantifiably reduce the albedo effect) then it is crucial to understand the environmental conditions which are pre-existing and post-intervention.
The solar radiation analysis concludes that thermal conductivity should be identified in order to justify locations for reducing heat emissions from building materials (Fig.46) that contribute to the heat island effect alongside albedo transitions from unbuilt to built environments. Albedo, or the measure of reflection of material surface from solar radiation, has two-fold importance: it firstly identifies areas which are overheating for human occupants and thereby a space for bio-bot intervention and secondly plays a non-reparative role in fragmentation: altering the microclimate conditions of the boundary edge. 98 The material mapping exercise thus establishes the estimations of thermal conductive shifts that prolonged exposure to direct solar radiation can overstress via human-made albedo development (Fig.47). While there are two built ‘parks’ in Soho- Golden Square is actually a series of trees planted into a substrate surrounded by asphalt. In actuality, asphalt has an albedo value of 0.05 and absorbs 95% of light- partially negating any thermoregulation that vegetation could have performed in the
Fig. 44. Solar gain on the building morphologies during the Summer season from April until September
Fig. 45. Solar gain on the building morphologies during the winter season from October until March
Fig. 46. Material mapping
47. Material heat emission map
W/mK
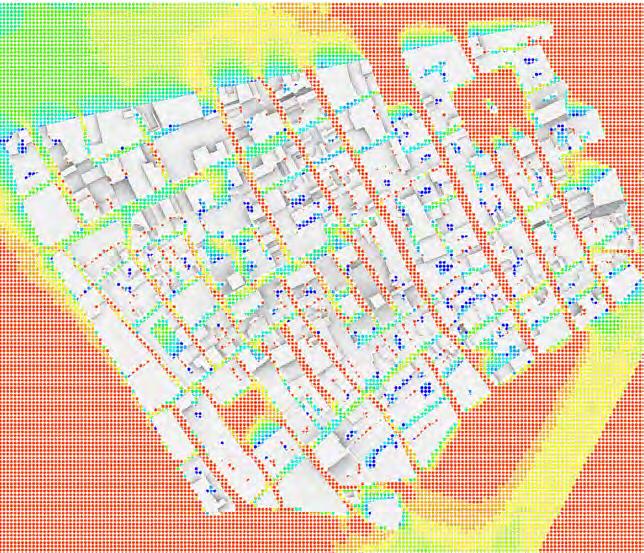
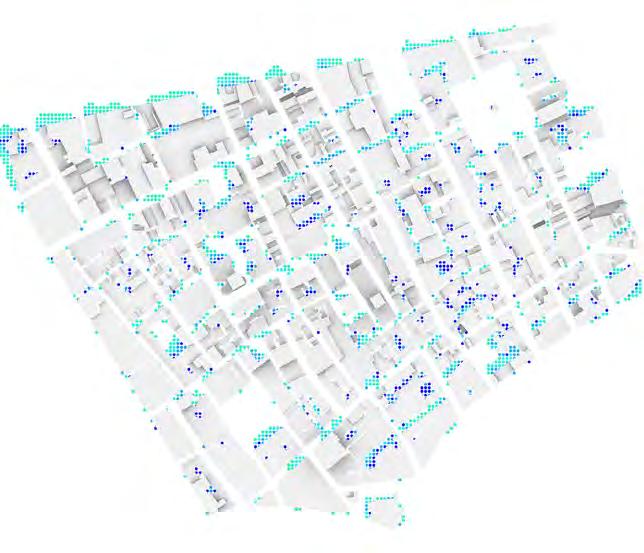
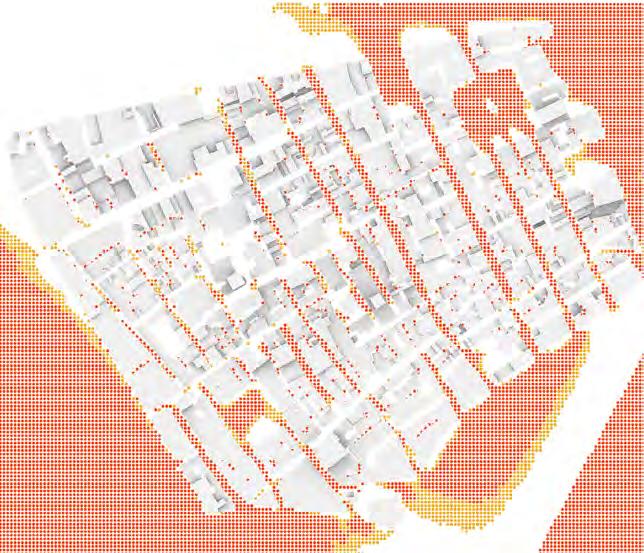
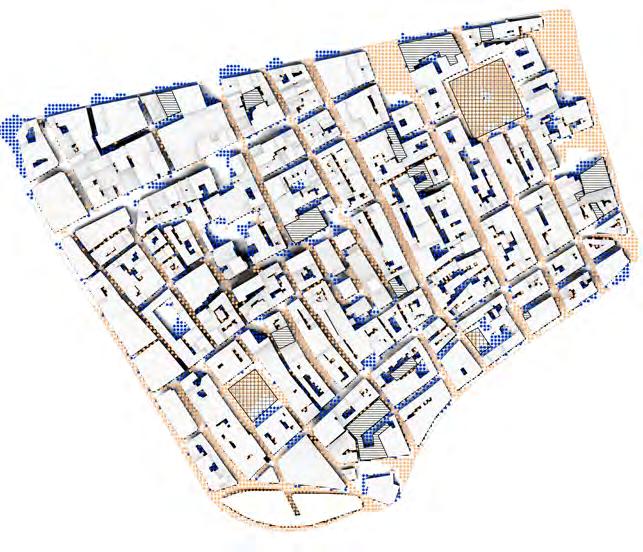
area. A survey of Soho’s material mapping identifies that material with high thermal conductivity such as steel, concrete and asphalt mainly used in infrastructural construction such as roads, bridges, and flyovers have high heat emissions during the day time where as materials such as brick lime plaster and grass have considerably low amounts of thermal conductivity contributing lower degree of thermal emissions during the daytime. Furthermore, it is clear from the direct solar radiation analysis that consistent roof exposure negatively impacts the albedo values and exacerbates the heat island effect. Albedo coefficient 99 Grass- 0.25 - 0.30; Trees - 0.15 - 0.18; Lime Brick - 0.20 - 0.40; Red Brick - 0.20 - 0.40; Brown Brick - 0.20 - 0.40; Steel - 0.35; Concrete - 0.10 - 0.35; Tar and Gravel - 0.08 - 0.20; Asphalt - 0.05 - 0.20; One of the environmental conditions to be assessed is the wind in Soho.
By identifying the wind directionality, highest and lowest speeds, as well as vector hits on the entirety of the site, it allowed for conclusions to be made about the spread of particulate matter, air diffusion and ultimately thermal comfort. The site was tested under Computational Fluid Dynamics(CFD) parameters in order to identify where the fastest air currents were coming through and the speed at which they disperse at the pedestrian level. This established the basis to understand how wind speeds and trajectories could
Fig. 48. Computational fluids Dynamics Simulation (CFD)
Fig. 49. Extracted area with the highest wind speed
Fig. 50. Extracted area with the lowest wind speed
Fig. 51. Possible areas of implementation where wind flow should be lowered, redirected or accelerated
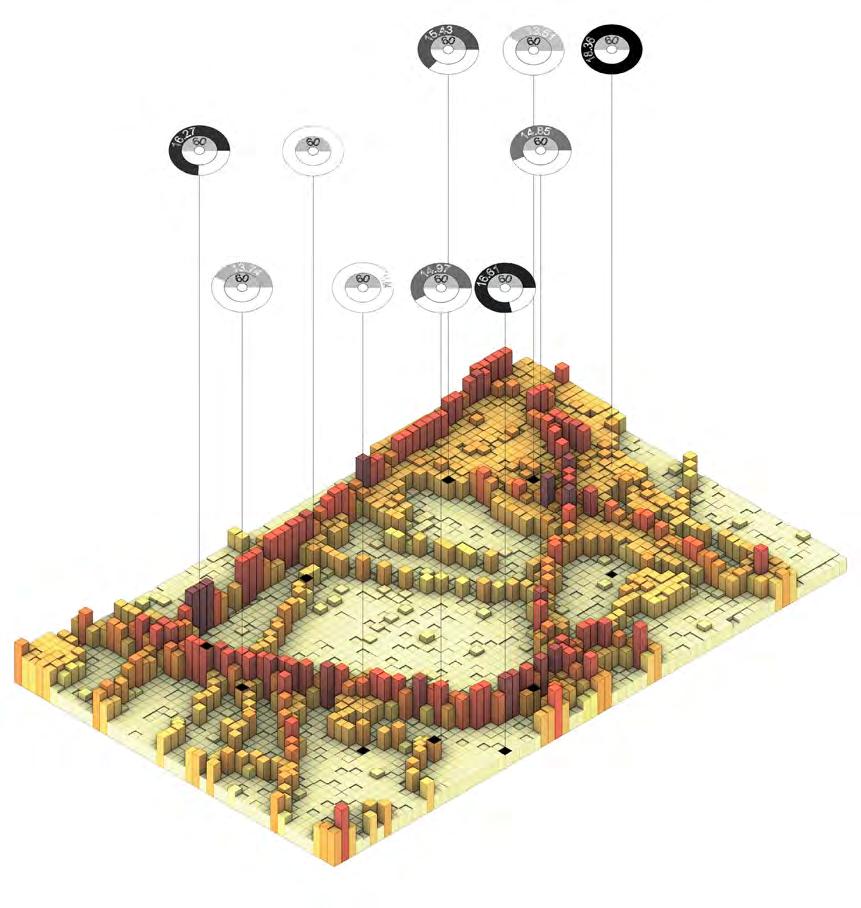
be manipulated in order to place modules which could speed up velocities in areas which are overheating in need of thermoregulation or slow down velocities in areas which are, for example, closer to vehicular traffic. Furthermore, it was important to identify above, how the simulation channels the wind through larger open areas comparatively through interstitial spaces and courtyards.
The values of highest concentrations of NO2, NOx, PM10 and PM2.5 were taken and remapped to be overlaid with a map of Soho (Fig.52). It revealed that locations near London’s low emission zones were problematic due to the diesel vehicles. Furthermore, the remapping of these values in order to recategorise areas into tiers for intervention facilitated considerations for how contextually and spatially different areas within Soho with the same values would need to be intervened in differently- thus setting up constraints quantified by allowable architectural intervention and space solutions.
Fig. 52. The maximum NO2, NOx, PM10, and PM2.5 concentration measurements were obtained and remapped to be overlaid with a map of Soho.
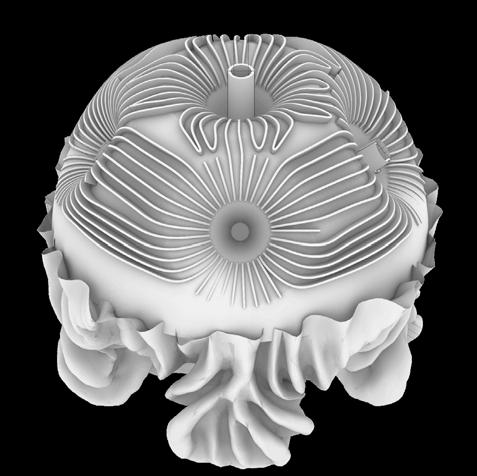
ENDNOTES
92. “London Air Quality Network Guide,” accessed August 10, 2022, https://www.londonair.org.uk/ londonair/guide/WhatIsNO2.aspx.
93. “Concentrations of Nitrogen Dioxide,” GOV.UK, accessed August 10, 2022, https://www.gov.uk/ government/statistics/air-quality-statistics/ntrogen-dioxide.
94. OAR US EPA, “Basic Information about NO2,” Overviews and Factsheets, July 6, 2016, https:// www.epa.gov/no2-pollution/basic-information-about-no2.
95. “Concentrations of Particulate Matter (PM10 and PM2.5),” GOV.UK, accessed August 10, 2022, https://www.gov.uk/government/statistics/air-quality-statistics/concentrations-of-particulate-matter-pm10-and-pm25.
96. “Retrofitting-Soho-05-Main-Report-Chapter-2-P21-26-241208s.Pdf,” accessed August 12, 2022, https://www.westminster.ac.uk/sites/default/public-files/general-documents/Retrofitting-Soho-05-Main-Report-Chapter-2-p21-26-241208s.pdf.
97. “The Sun’s Impact on the Earth,” December 4, 2019, https://public.wmo.int/en/sun%E2%80%99simpact-earth.
98. Robert M. Ewers and Cristina Banks-Leite, “Fragmentation Impairs the Microclimate Buffering Effect of Tropical Forests,” PLoS ONE 8, no. 3 (March 4, 2013): e58093, https://doi.org/10.1371/ journal.pone.0058093.
99. “Albedo - an Overview | ScienceDirect Topics,” accessed August 11, 2022, https://www.sciencedirect.com/topics/engineering/albedo.
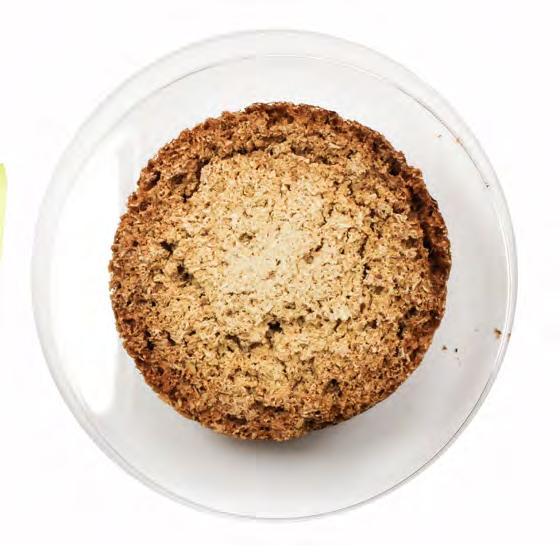
MATERIAL DEVELOPMENT
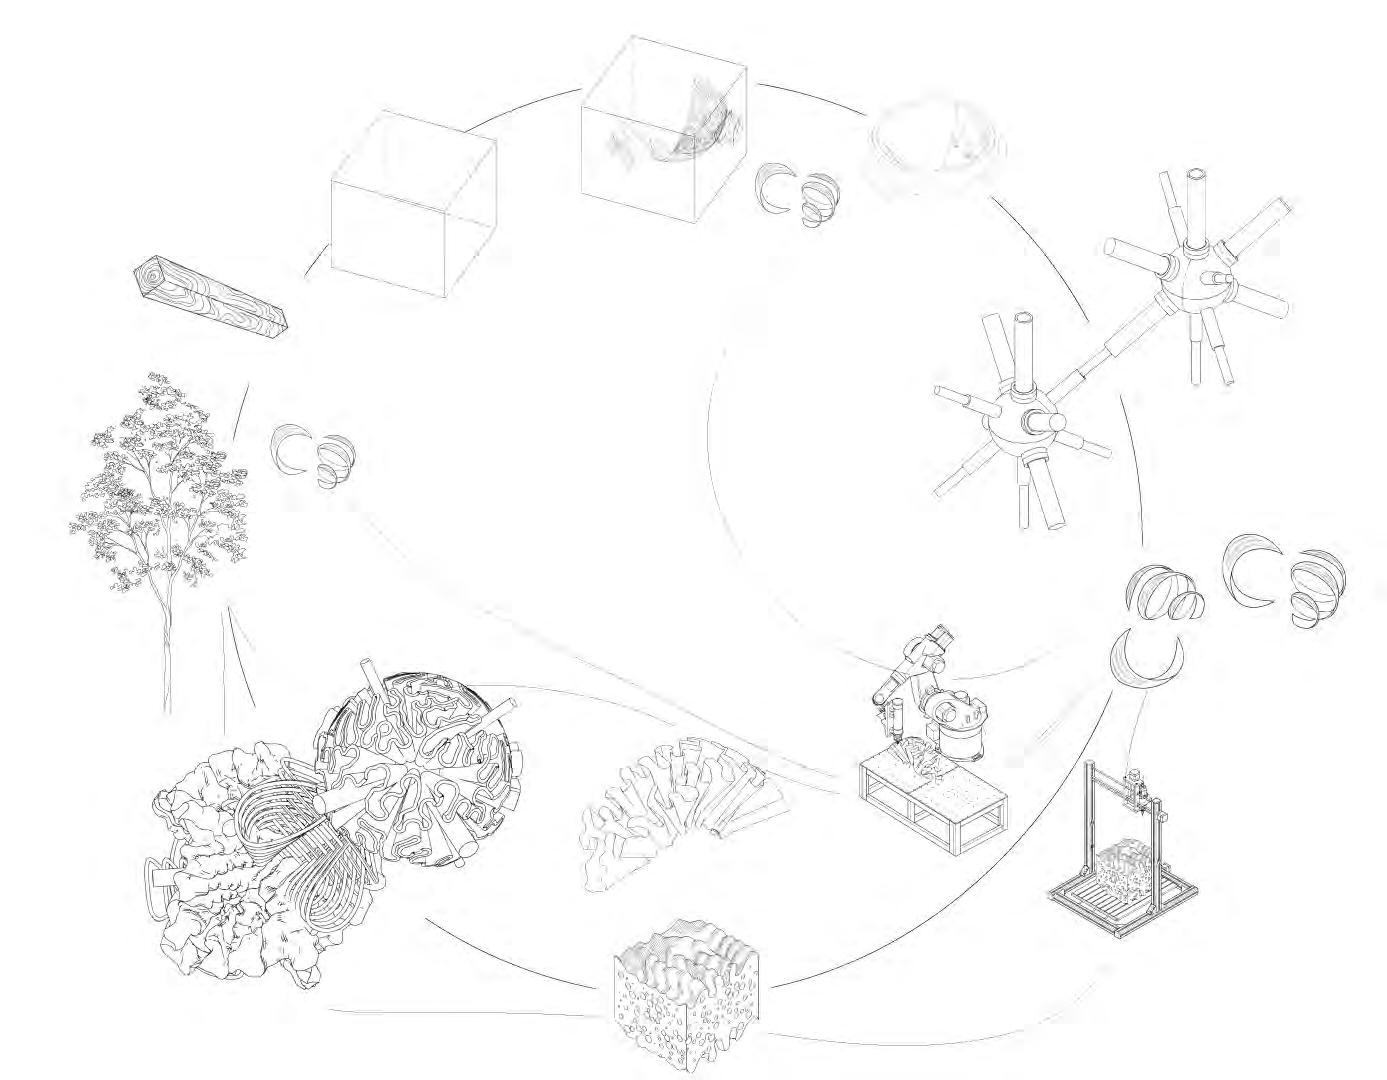
Timber manufacturing processes present an opportunity to consider the material processing cycle in the fabrication of bio-bot. As outlined in the domain chapter, sawdust is the primary material of investigation. If bio-bot is to postulate that it revitalises and mitigates the environmental damages of the locations it is interjected into, then the entirety of the fabrication process must be conducive to this idea of sustainability. The wood manufacturing process which begins at either harvesting of timber or local reclaimed elements of timber can be considered as the starting point; the sawdust byproduct at the stage of harvesting or milling timber can be cycled immediately back into the production of the module (Fig.53). The routed structural elements are milled from pieces of reclaimed wood and its sawdust, at various stages is transformed into a new experimental mixture which is either extruded robotically or moulded. This creates an opportunity to reconsider waste material as crucial in the cyclical loop of fabrication.
Subsequently, this leads to an examination of material sourcing: if the environmental purification benefits all who are localised to the bio-bot, it is possible that sawdust becomes a proponent of a circular economy. Local timber production factories, milling productions and even cabinetry fabricators (at the smallest scale) should consider recycling the sawdust byproduct for its fabrication. It simultaneously accounts for more sustainable waste recycling at no hindrance to anyone participating.
53. Production cycle diagram. The scheme shows all steps undertaken to produce modules
Fig.
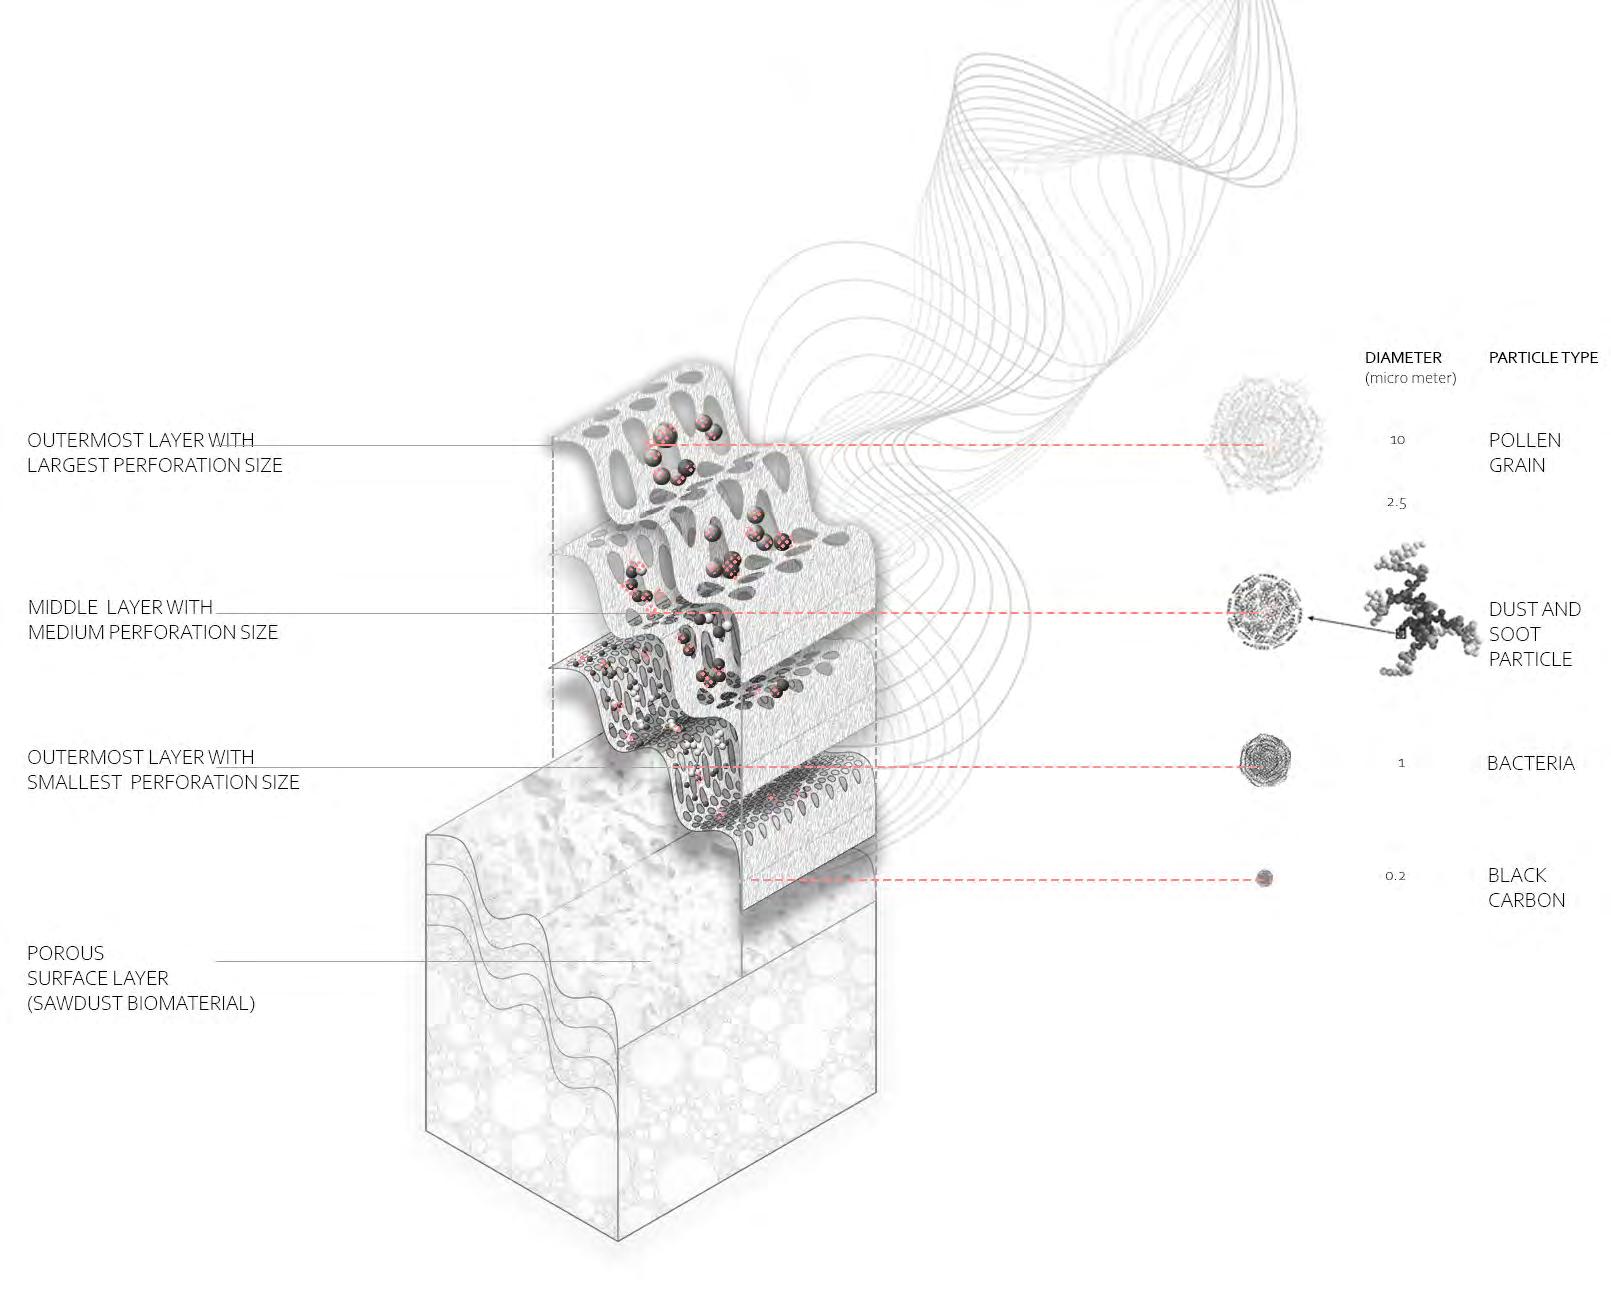
Saw dust, corn starch and yeast have been identified as composite materials for the biomaterial formulation. Although the crucial objective of experimentation lies in activation of the surface of raw saw dust to generate porosity, that would induce the growth of microorganisms being beneficial for the growth of green tissue. 100 Also, a highly porous surface leads to adsorption of black carbon as the carbon molecules create surface bonds 101 with the porous sawdust surface aiding the filtration of air.102 Hence, achieving porosity, considerable water retention, permeability, and structural stability were key attributes of physical experimentation to obtain the desired bio material composite. As a result, the physical experiments were conducted in the aforementioned order.
Fig. 54. Material structure. Exploded diagram shows layes needed for filtration of different types of particles
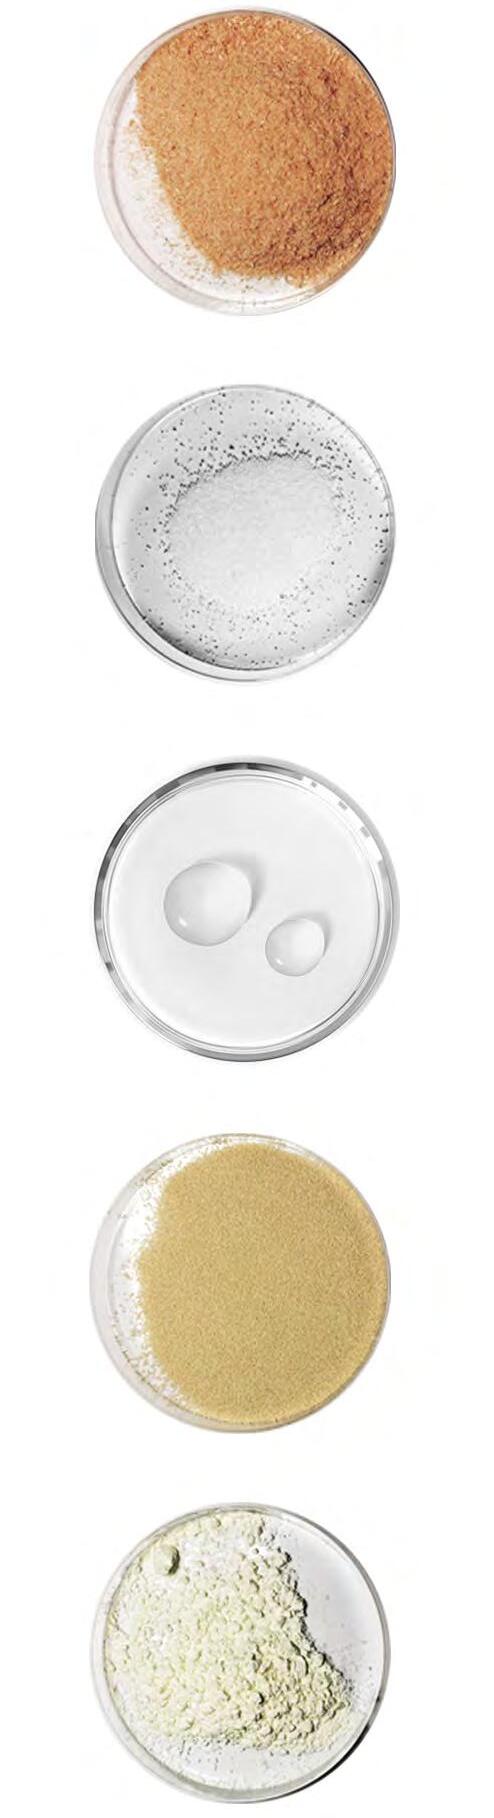
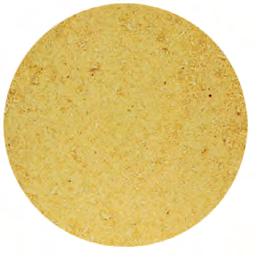
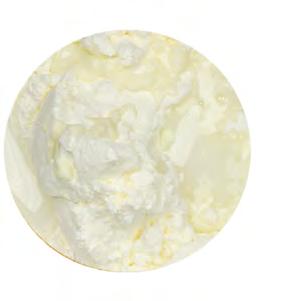
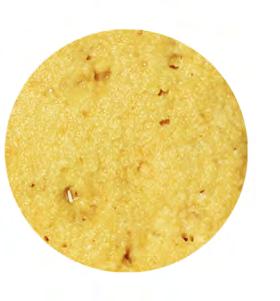
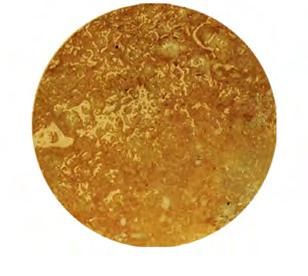

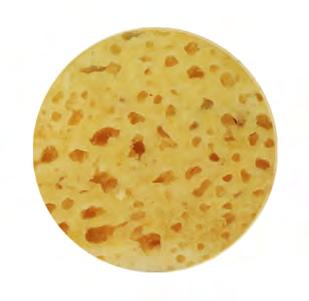
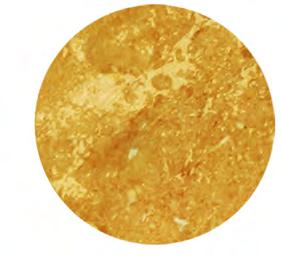
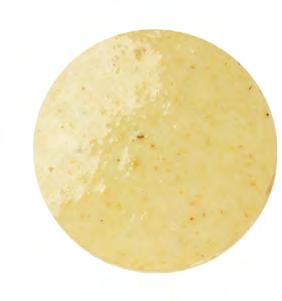
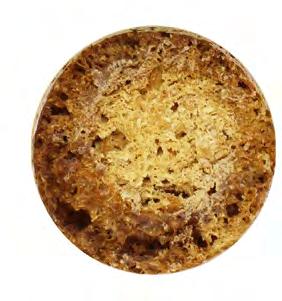
PRODUCTION PROCESS
The raw composite mixture for the formation of the new biomaterial was prepared from three major components : raw saw dust, corn starch and yeast. When water was added to dry saw dust mix in the ratio of 1 parts saw dust to 2 parts water, a non-viscous semi-solid mixture was created as weak surface bonds are created between water molecules and sawdust particles leading to this non viscous formation. 103 However in order to create a viscous mixture with adhesive capacity to generate stronger surface bonds, 1 part corn starch was added to this semi-solid mixture of saw dust and water. However, generating porosity was the significant aim of the experiment, therefore 0.1 parts of yeast was further added to this viscous mixture. The mixture was let to sit for thirty minutes in the absence of oxygen, in order to activate yeast. Then, the mixture was transferred in a desirable mould and baked in an air-drying furnace at a temperature of 200C for about 4 hours untill the moisture was evaporated. A considerable amount of porosity was observed in the baked sample. However, the adequate composition of the mixture in order to achieve maximum porosity had still not been determined.
To further determine the ratio of mixing of raw composites in order to receive maximum porosity, 12 samples were prepared with varying quantities of corn starch, water and yeast, keeping the quantity of sawdust constant throughout the experiment.
Fig. 55. Material production matrix shows each step of material development from raw mixture until the baked porous wood sponge
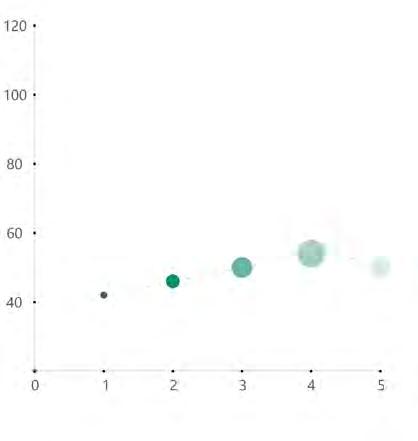
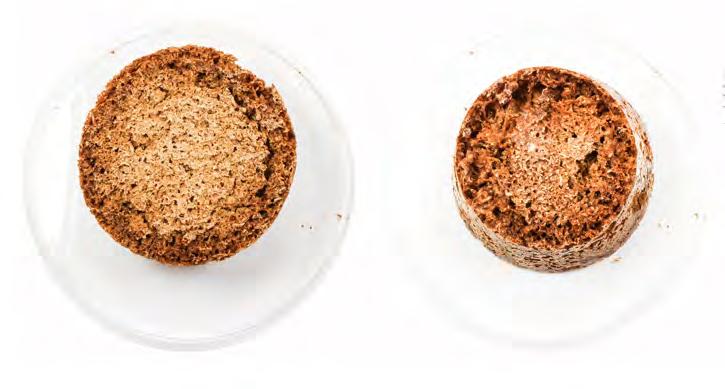
SAMPLE 1
Sawdust - 20g
starch - 10g
- 40ml
- 4g
- 1g
230C
- 42.85
EXPERIMENT 1
CORNSTARCH
Aim: To formulate the adequate ratio of corn starch required against fixed quantities of water sawdust, and yeast to achieve a high degree of porosity.
Objective: Activating surface of raw saw dust by heating the obtained composite mixture in the absence of oxygen in order to receive highly porous composite bio material.
Methodology: Four samples were prepared, with 20g sawdust, 40ml water, 5g yeast and 1g sugar and varied quantities of corn starch each as 10g, 20g, 30g, 40g correspondingly. Weights of these four samples were recorded before being heated further for surface activation. Post this, the prepared samples were heated at a temperature of 230C for 6 hours in an air drying furnace. The new weights of the baked samples were recorded. In order to test the degree of increase in porosity, the percentage decrease in the weight of each sample after heating was calculated.
Observation: It was observed that the sample 4 (Fig.56.) with 40g of corn starch in a mixture of 20g sawdust, 40ml water, 5g yeast and 1g sugar gained maximum porosity as approximately 50 percent decrease in the weight of the sample was observed after heating. Hence, it can be observed that 2 parts of corn starch against 1 part of sawdust gives the desirable porosity.
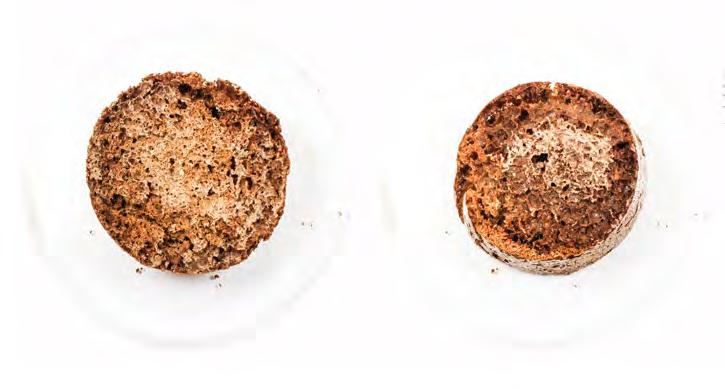
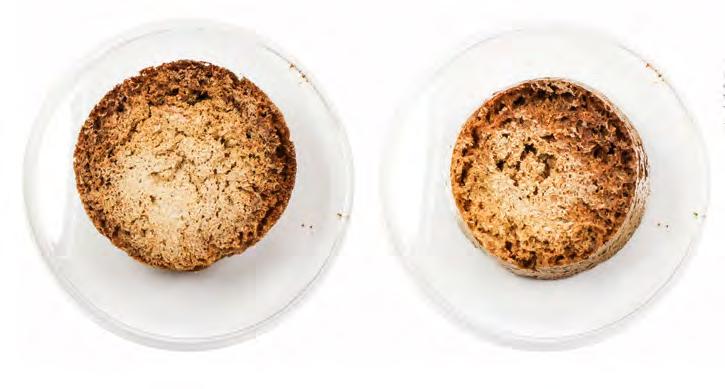
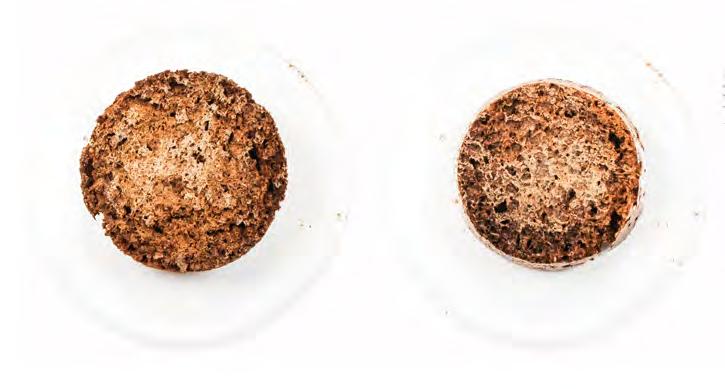
SAMPLE 2
Sawdust - 20g Corn starch - 20g
- 40ml
- 4g
- 1g
- 230C
SAMPLE 3
Sawdust - 20g Corn starch - 30g
- 40ml
- 4g
- 1g
- 230C Decrease in weight percentage - 49.09
SAMPLE 4
Sawdust - 20g
Corn starch - 40g Water - 40ml
Yeast - 4g
Sugar - 1g
Temperature - 230C
Decrease in weight percentage - 50.76
Fig. 56. Plotting relationship between increase in porosity by varying cornstarch proportion in the sawdust biomaterial composite
Corn starch to sawdust ratio
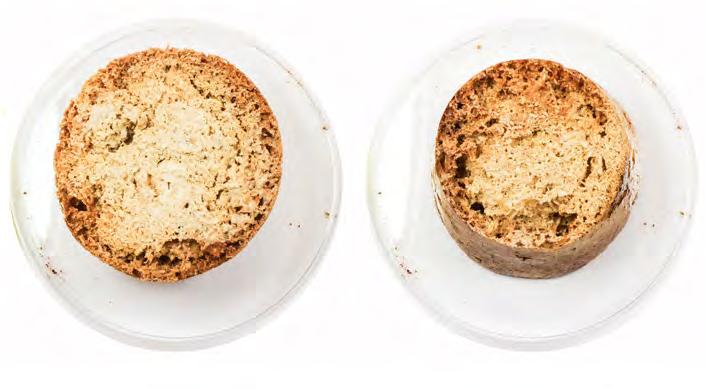
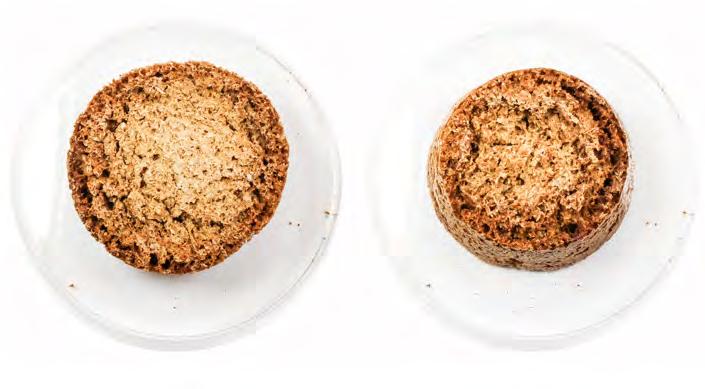
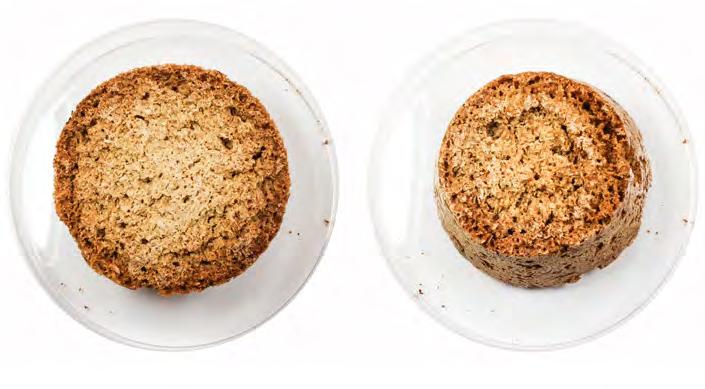
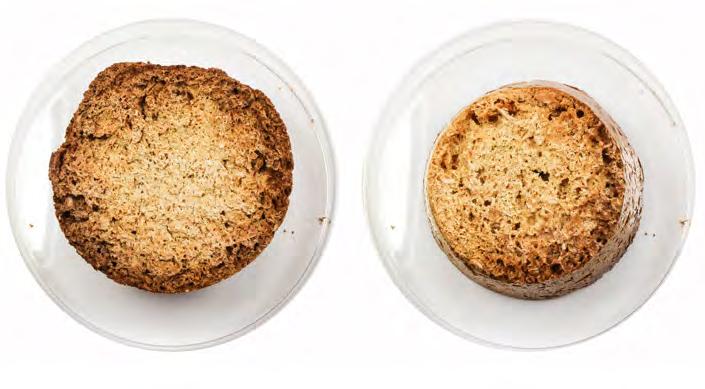
SAMPLE 1
Sawdust - 20g
Corn starch - 40g
Water - 40ml
Yeast - 4g
Sugar - 1g
Temperature - 230C
Decrease in weight
percentage - 50.76
Decrease in weight percentage
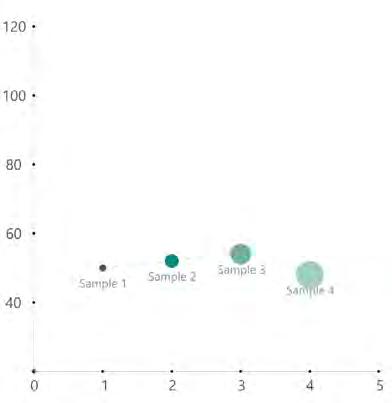
SAMPLE 2
Sawdust - 20g
Corn starch - 40g
Water - 60ml
Yeast - 4g
Sugar - 1g
Temperature - 230C
Decrease in weight percentage - 53.00
Fig. 57. Plotting relationship between increase in porosity vs varying proportions of water in the sawdust biomaterial composite.
SAMPLE 3
Sawdust - 20g
Corn starch - 40g
Water - 80ml
Yeast - 4g
Sugar - 1g
Temperature - 230C
Decrease in weight
percentage - 52.00
EXPERIMENT
2
WATER
Aim: To formulate the adequate ratio of water required against fixed quantities of corn starch, sawdust, and yeast to achieve a high degree of porosity.
Objective: Activating surface of saw dust by heating the obtained composite mixture in the absence of oxygen in order to receive highly porous composite biomaterial.
SAMPLE 4
Sawdust - 20g
Corn starch - 40g
Water - 100ml
Yeast - 4g
Sugar - 1g
Temperature - 230C
Decrease in weight
percentage - 44.00
Methodology: After determining the favourable ratio of quantity of corn starch required. Further, four samples were prepared, with 20g sawdust, 40g corn starch, 5g yeast and 1g sugar and the quantities of water were varied in each sample as 40ml, 60ml, 80ml, 100ml. Weights of these four samples were recorded before being heated further for surface activation. The prepared samples were heated at a temperature of 230C for 6 hours in an air-drying furnace. In order to test the degree of increase in porosity, the percentage decrease in the weight of each sample after heating was calculated. Observation: It was observed that the sample 2 (Fig.57.) with 60ml of water in a mixture of 20g sawdust, 40g corn starch, 5g yeast and 1g sugar gained maximum porosity as approximately 55 percent decrease in the weight of the sample was observed after heating. Hence, it can be observed that 3 parts of water against 1 part of sawdust and 2 parts of corn starch gives the desirable porosity.
Water to sawdust ratio
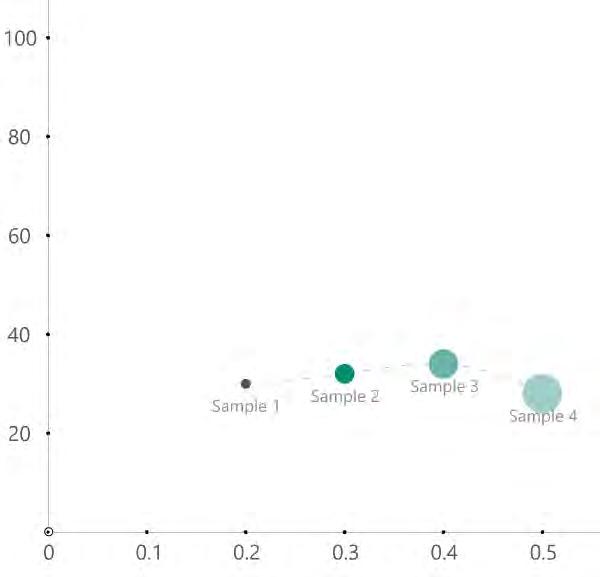
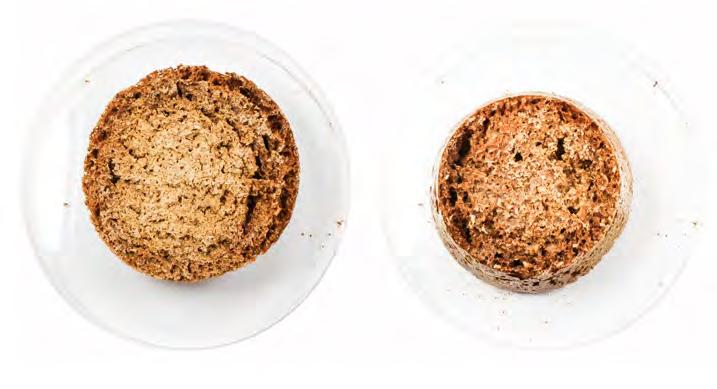
SAMPLE 1
Sawdust - 20g
- 40g
- 80ml
- 4g
- 1g
- 230C Decrease in weight
- 24.7
EXPERIMENT 3 YEAST
Aim: To formulate the adequate ratio of yeast required against fixed quantities of corn starch, sawdust, and water to achieve a high degree of porosity.
Objective: Activating surface of saw dust by heating the obtained composite mixture in the absence of oxygen in order to receive highly porous composite bio material.
Methodology: After determining the favourable ratio of quantity of corn starch and water required. Four samples were prepared, with 20g sawdust, 40g corn starch,60 ml water and yeast each. The quantity of yeast was varied in each sample as 5g, 7g, 9g, 11g. In order to test the degree of increase in porosity, the percentage decrease in the weight of each sample after heating was calculated.
Observation: It was observed (Fig. 58) that the sample 4 containing 11g yeast, 4g sugar in a mixture of 20g sawdust, 40g corn starch, and 60 ml water had undergone a decrease of 62% in its weight. However, the sample turned highly charred and brittle. Sample 2 with 7g yeast and 2g sugar gained optimum porosity as approximately 53% decrease in the weight of the sample was observed after heating, this sample was observed to maintain its structural qualities tested in further experiments. Hence, it can be observed that 3 parts of water, against 1 part of sawdust and 2 parts of corn starch and 0.35 parts of yeast gives the most desirable porosity out of all the samples.
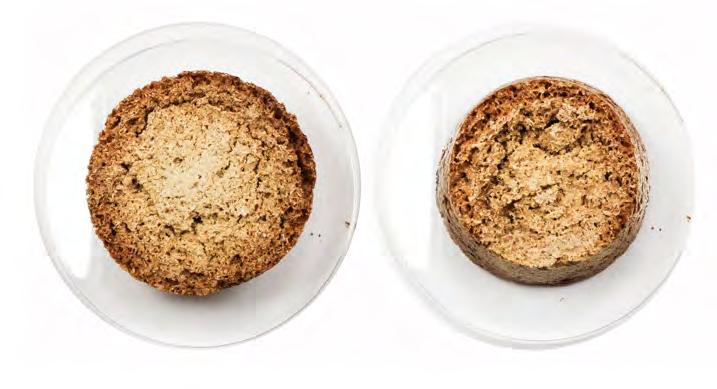
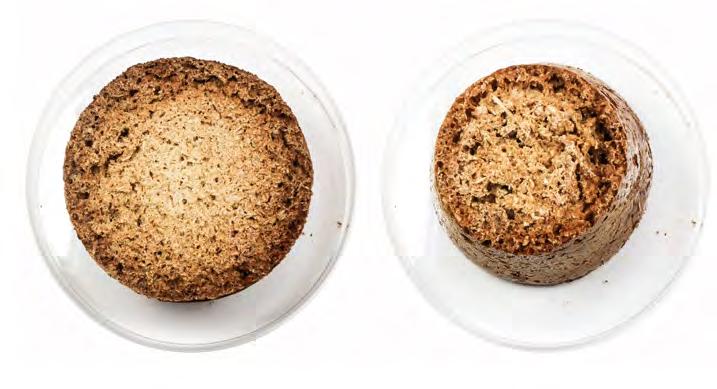
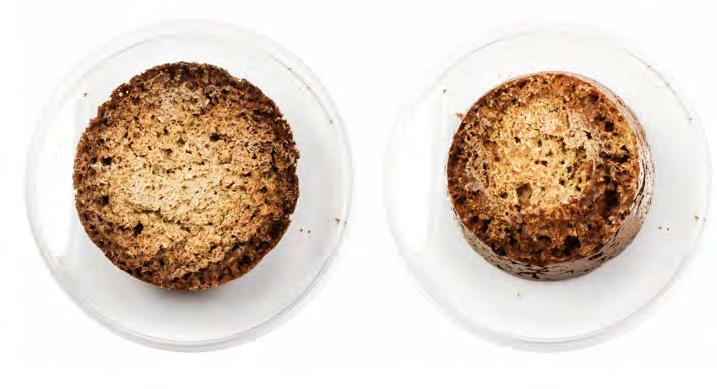
SAMPLE 2 Sawdust - 20g
starch - 40g
- 80ml
- 6g
- 1g
- 230C Decrease in
SAMPLE 3
Sawdust - 20g Corn starch - 40g
- 80ml
- 4g
- 8g
- 230C Decrease in weight percentage - 43.52
SAMPLE 4
Sawdust - 20g
starch - 40g Water - 80ml
Yeast - 4g Sugar - 10g
Temperature - 230C
Decrease in weight percentage - 62.35
Fig. 58. Plotting relationship between increase in porosity vs varying proportions of yeast in the sawdust biomaterial composite.
Yeast to sawdust ratio
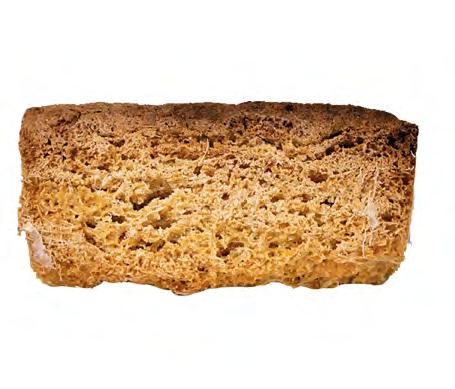
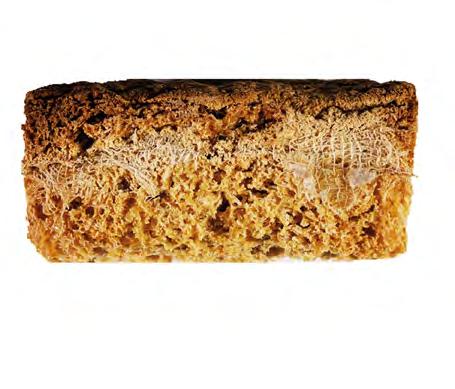
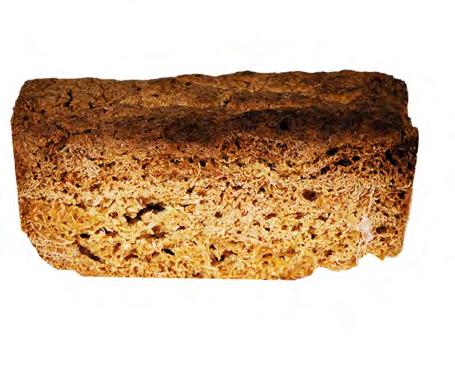
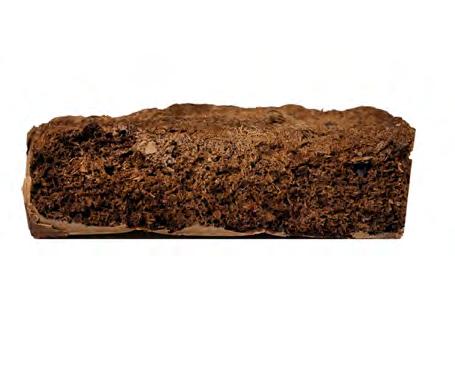
SAMPLE 1
Cmposition ratio - 1S, 2C, 4W, 0.2Y
Temperature - 205C
Final Volume(ml) - 75
Change in Volume % - 7.14
2
Cmposition ratio - 1S, 2C, 4W, 0.2Y
Temperature -220C
Final Volume(ml) - 80
Change in Volume % - 14.28
SAMPLE 3
Cmposition ratio - 1S, 2C, 4W, 0.2Y
Temperature - 235C
Final Volume(ml) - 85
Change in Volume % - 21.42
SAMPLE 4
Cmposition ratio - 1S, 2C, 4W, 0.2Y
Temperature - 250C
Final Volume(ml) - 60
Change in Volume %- -14.28
Percentage change in volume(ml)
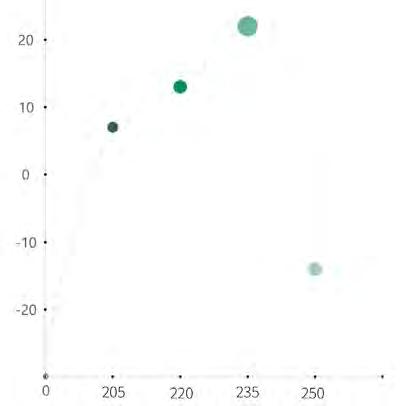
Temperature(C)
EXPERIMENT 4 TEMPERATURE
Aim : To determine the optimum heating temperature for the formulated biomaterial composite (1S : 2C : 3W : 0.35Y) in the absence of oxygen to activate the surface of saw dust in order to receive favourable porosity.
Objective: To determine the approximate crystallisation point of the formulated sample by heating at various temperatures.
Methodology: Four samples with a mixing ratio of 1S : 2C : 3W : 0.4Y were prepared. Volumes of these samples were recorded before and after they were heated in the air drying furnace.
Observation: It was observed (Fig.56.) that the volume of sample 1 had undergone an increase of approximately 7 percent in its volume after being heated to 205C, while sample 2 being heated to a temperature of 220C and sample 3 heated upto a temperature of 235C had undergone an increase of 14% and 21% in their volumes respectively. However sample 4, had undergone a drastic decrease in its volume by 14%, being heated up to 250C for a period of 6 hours. Hence, it can be determined that heating the formulated biomaterial sample to 250C, induces crystallisation in the composite. Crystallisation is the physical process of hardening during the formation and growth of crystals. Sawdust, mainly composed of cellulose and sugar added for the activation process of yeast, contributes to rapid crystallisation of the biomaterial composite.
SAMPLE
Fig. 56. Material production matrix shows each step of material development from raw mixture until the baked porous wood sponge
Percentage change in volume(ml)
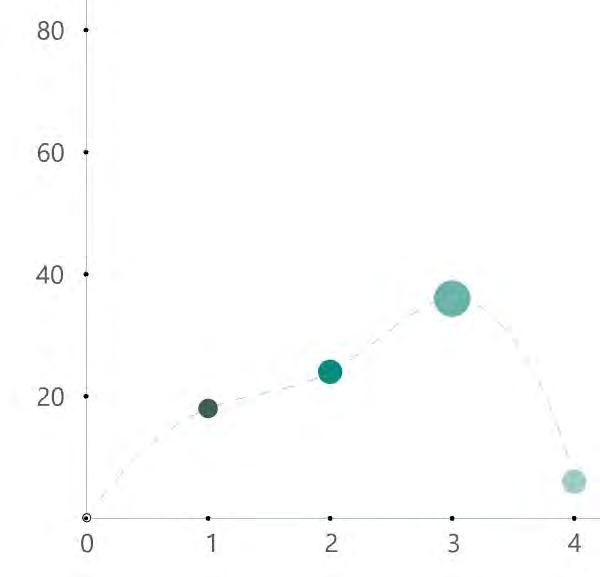
Time for water retention(hrs)
Fig. 59. Plotting relationship between percentage change in volume of sample vs gradual increase in the baking temperatures.
EXPERIMENT 5 WATER RETENTION
Aim : To establish a relationship between water retention capacity and time by testing the change in the volume of the samples, considering the sample will expand as it will absorb water over time.
Objective :To test the water retention capacity of the prepared biomaterial composite.
Methodology : Volumes of 4 samples were recorded after they were heated in the air-drying furnace. Each sample was submerged in 100ml water for 30 seconds. Sample 1 was let to sit for 1 hour, Sample 2 for 2 hours, Sample 3 for 3 hours, Sample 4 for 4 hours. Volumes of these samples were recorded at these times. Percentage increase in the volumes of each sample was recorded in order to formulate a relationship between time and water retention capacity.
Observation: A 37.5% increase in the volume of sample number 3 was observed, being rested for 3 hours of time (Fig.59). However, sample number 4, which rested for more than 3 hours, showed a significant decrease in the percentage volume from 37% to 6%.
Conclusion: It could be concluded from the above experiment that the sample of the formulated biomaterial composite (1S : 2C : 3W : 0.4Y) has water retention capacity of 37% for a time of 3 hours. However, the accuracy of this experiment is subject to the humidity in the air, which can be highly variable if not tested in controlled environments.
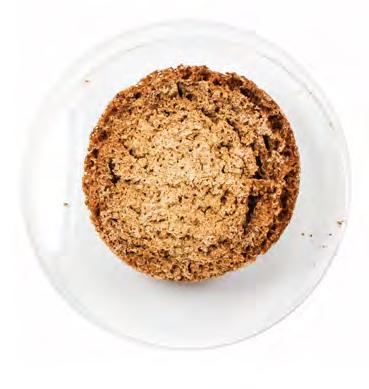
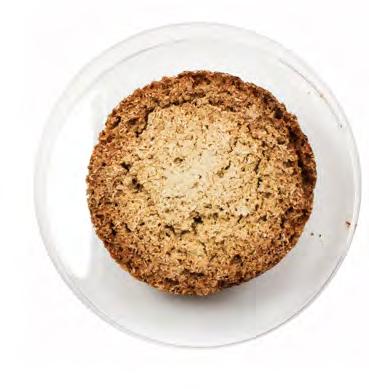
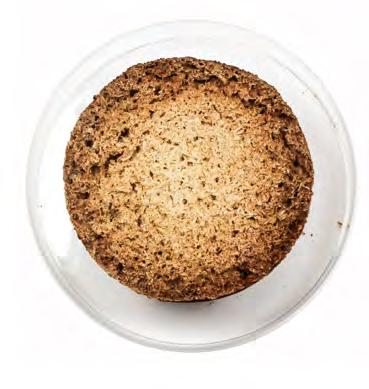
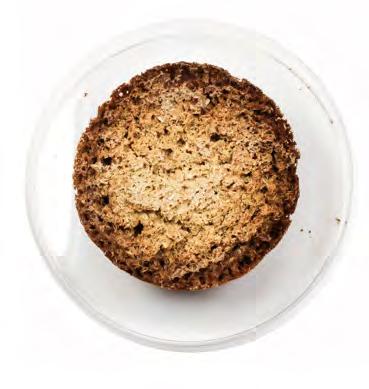
SAMPLE 1
Composition ratio - 1S : 2C : 3W : 0.4Y
Time duration (hrs) - 1
Initial Volume (ml) - 80
Final Volume (ml) - 95
Change in Volume % - 18.75
SAMPLE 2
Composition ratio - 1S : 2C : 3W : 0.4Y
Time duration (hrs) - 2
Initial Volume (ml) - 80
Final Volume (ml) - 100 Change in Volume % - 25
SAMPLE 3
Composition ratio - 1S : 2C : 3W : 0.4Y
Time duration (hrs) - 3
Initial Volume (ml) - 80
Final Volume (ml) - 110 Change in Volume % - 37.5
SAMPLE 4
Composition ratio - 1S : 2C : 3W : 0.4Y
Time duration (hrs) - 4
Initial Volume (ml) - 80
Final Volume (ml) - 85
Change in Volume % - 6.25
In the above experiments, quantities of corn starch, water and yeast were varied, keeping the quantity of saw dust constant in the raw mixture in order to create the most lightweight, porous composite. It could be observed that the most adequate ratio of mixing can be considered as (1S : 2C : 3W : 0.35Y) 1 part saw dust to 2 parts corn starch to 3 parts water to 0.35 parts yeast with a decrease percentage of 53% in the weight after being heated. Further, more samples were prepared keeping the mixing ratio constant in order to test the water retention capacity, permeability, structural strength and change in volume under varying time period and temperature conditions. According to the results of the water retention experiment, the sample of the biomaterial composite (1S: 2C: 3W: 0.4Y) has a 3 hour water retention capacity of 37%. The accuracy of this experiment is dependent on the air’s humidity, which might vary greatly if tested outside of a controlled atmosphere.
STRUCTURAL STRENGTH
3 POINTS LOADING TEST
Mechanical properties and structural strength of materials are fundamentally characterised through the maximum tension, compression and shear stress they can withstand under various loading conditions.
A three point bending test can be conducted in order to test the same. The three point bending aids to determine the Modulus of Elasticity in bending, the stress and strain of the composite material. The test is conducted on a material sample of a predefined length (L) and, made to rest on end supports. The sample is subjected to point loading at its centre.104
The test produces tensile stresses along the convex side while compressive stresses are produced along the concave side of the sample, both calculated along the outermost fibre. The Young’s Modulus, also known as the Elastic Modulus, defines the relationship between the stress and strain of the material. The modulus of elasticity is a number that measures an object or substance’s resistance to being deformed elastically, which is calculated through physical experiments from the slope or angular coefficient of the stress- deflection curve.105
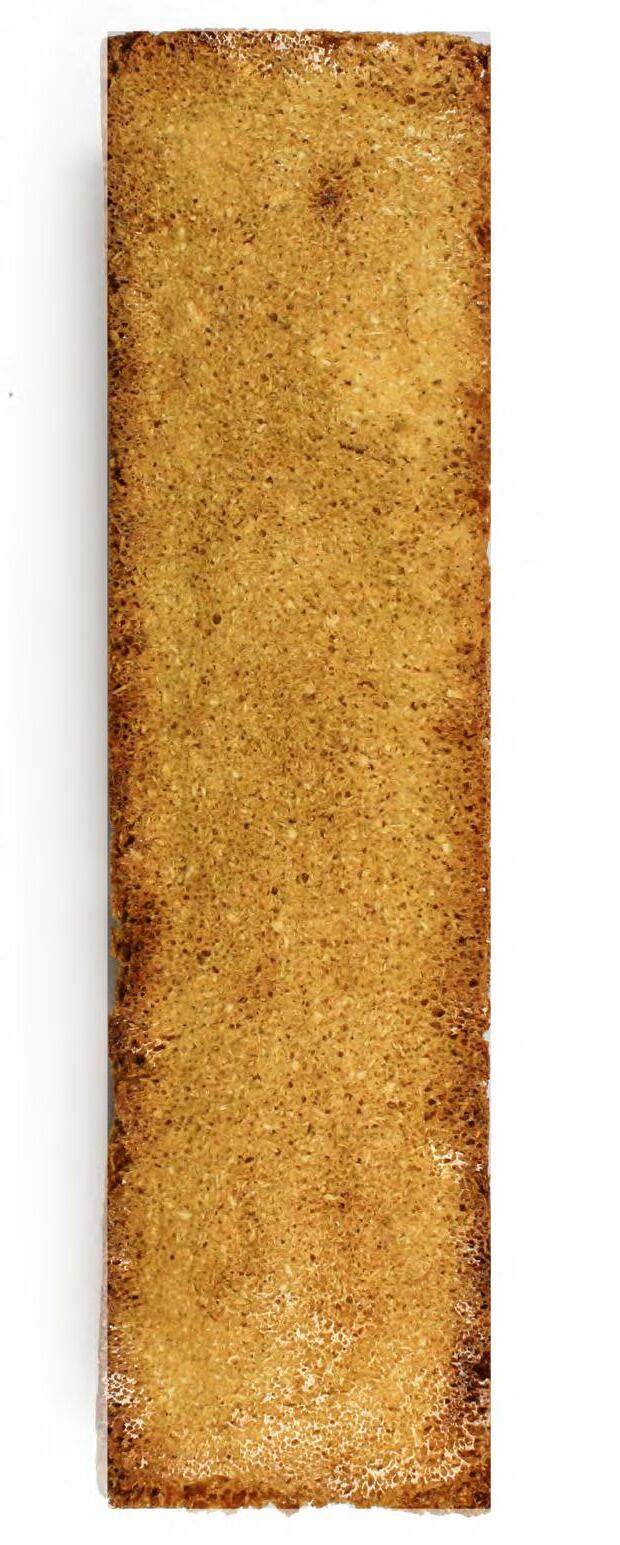
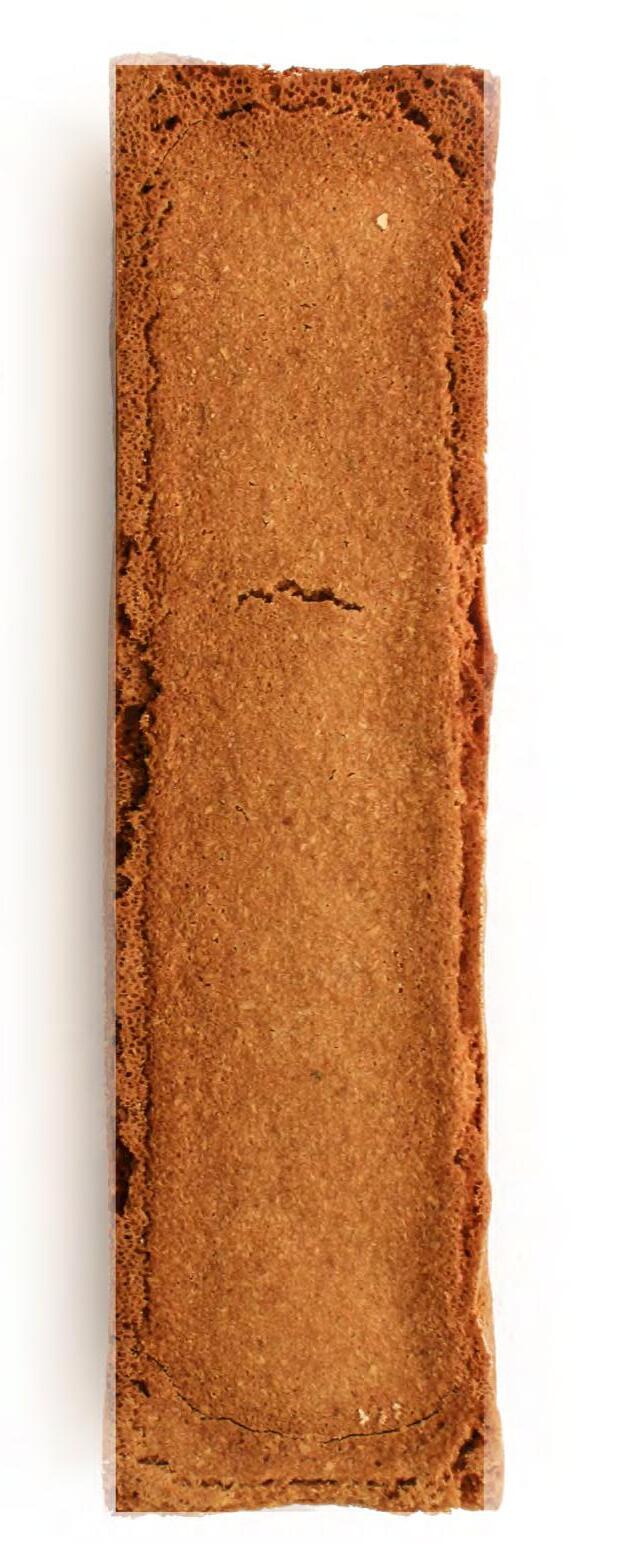

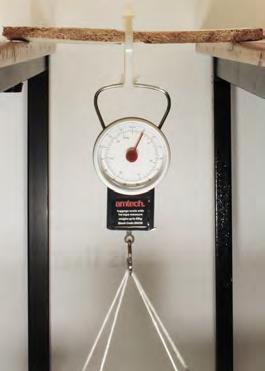
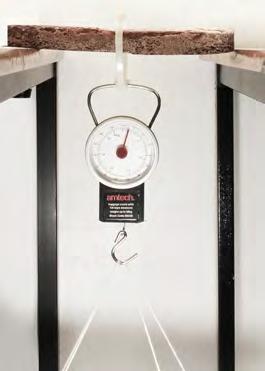
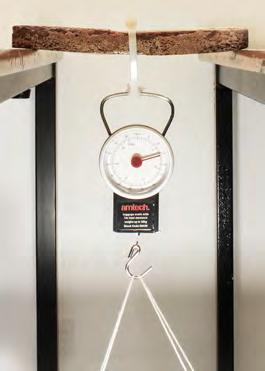
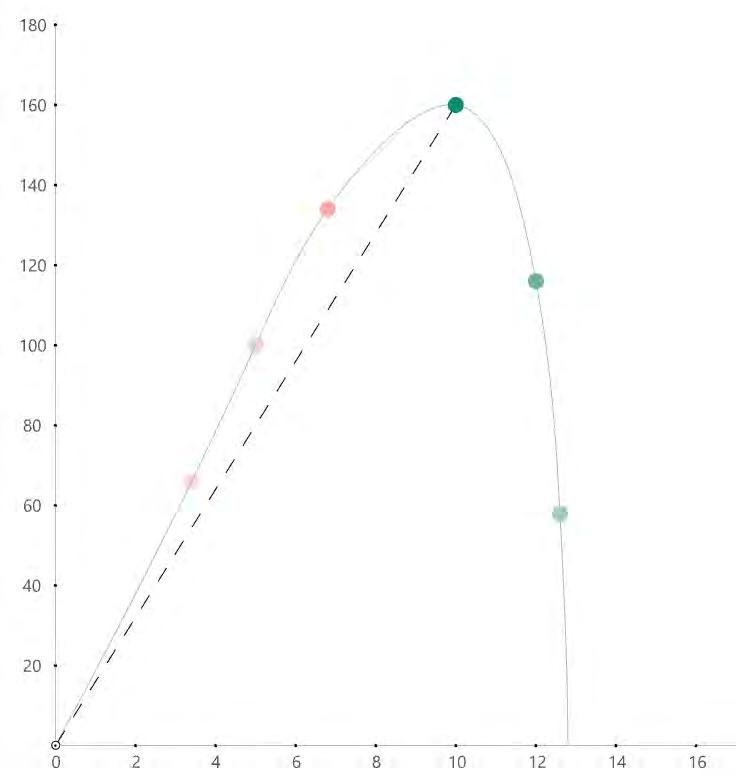
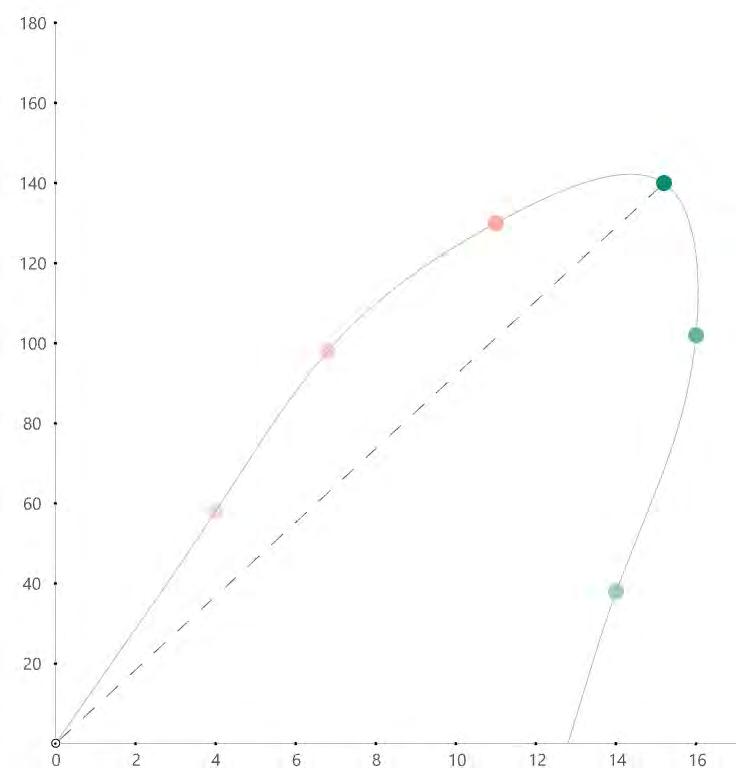
SAMPLE 1
Fig. 60. Plotting graph displaying vertical displacements the sample 1 undergoes when subjected to gradual increase in load unless breaking point is reached
Sample NL (cm)B(cm)T(cm)
1 10 5 1
Weight of Sample(g) Breaking point weight(kg)
Force (N)Vertical Displacement (mm)
60 2.3322.8345
It was observed (Fig.60.) that Sample 1 with thickness 1 cm, weight 60 g, had undergone a vertical displacement of 5mm under the maximum point load of 2.3 kg.
SAMPLE 2
Fig. 61. Plotting graph displaying vertical displacements the sample 2 undergoes when subjected to gradual increase in load unless breaking point is reached
Sample NL (cm)B(cm)T(cm)
2 10 5 2
Weight of Sample(g) Breaking point weight(kg)
Force (N)Vertical Displacement (mm)
85 7.1369.87415
Sample 2 (Fig.61.) with thickness 2 cm, weight 85g had undergone a vertical displacement of 15 mm under the maximum point load of 7.13 kg.
STRUCTURAL STRENGTH
3 POINTS LOADING TEST
Aim: The aim of this experiment was to test the structural strength of the developed composite biomaterial. A three point bending test was conducted for the same.
Objective: To determine the tensile stress and strain at the Yield point and the breaking point and the Elastic modulus (Young’s Modulus).106
Methodology: Four samples with length (L) = 10 cm, breadth (B) = 5cm,composition (1S:2C:3W:0.4Y), with varying thicknesses i.e. 1cm , 2cm, 2.5cm, 3.5 cm were prepared. The weights of each sample were recorded as 60g, 85g, 140g, and 250g correspondingly. Each sample was rested on end supports. Point load (F) was gradually added at the centre point of each sample, the vertical displacement(d) caused in the sample by the same, was recorded simultaneously. Load was added until the sample reached the breaking point. The load reading at yield point and breaking point was also recorded. A mathematical graph to determine the relationship between ‘F’ vs ‘d’ was plotted for each sample. The F/d parameter is equal to the angular coefficient of the line tangent to the curve during its elastic deformation. 107
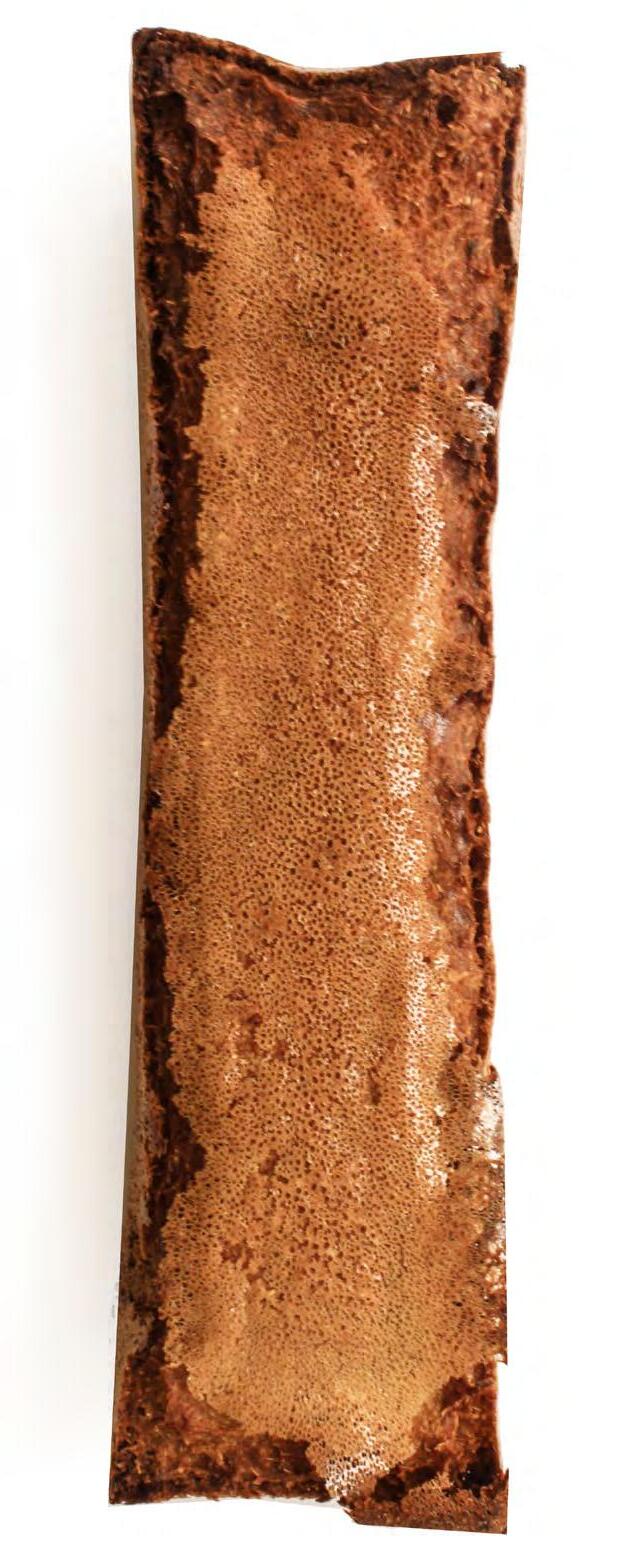
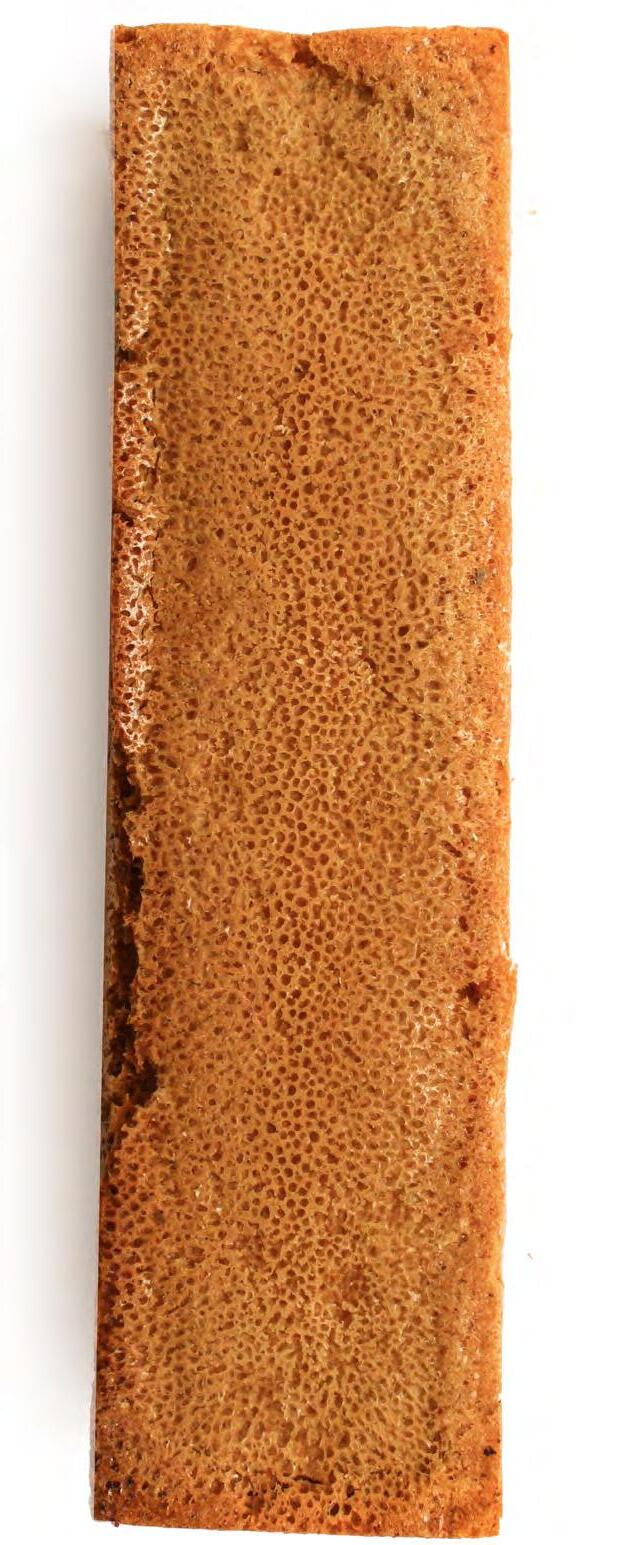

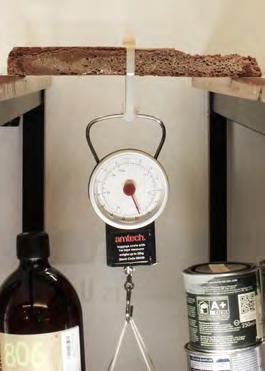
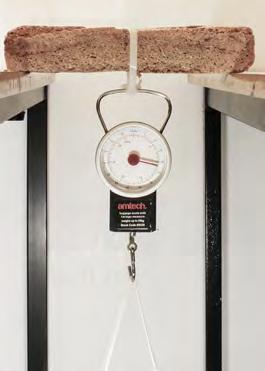
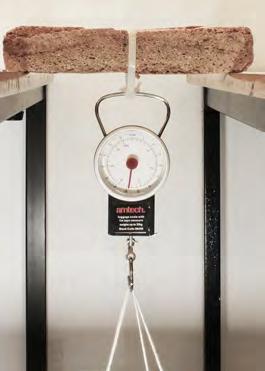
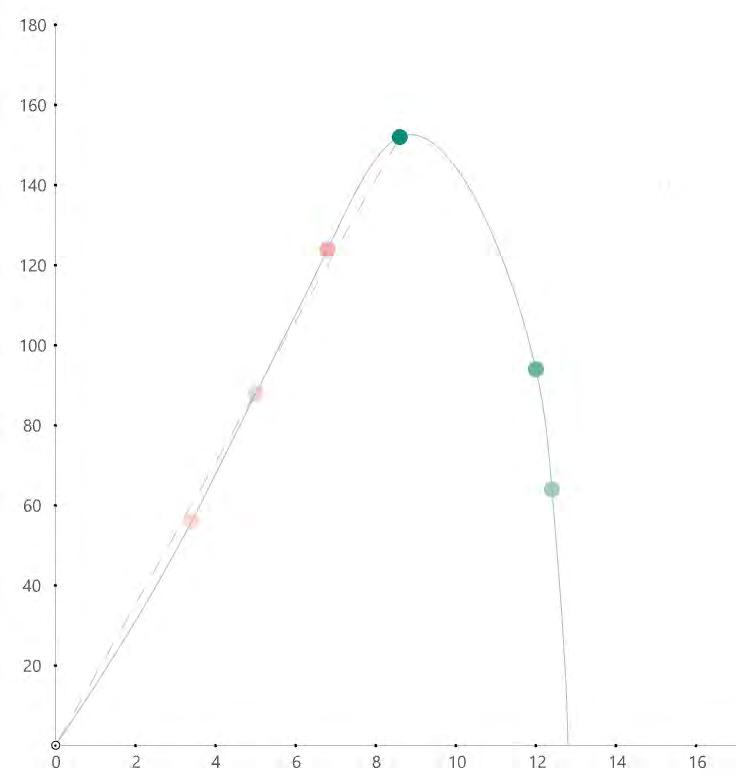
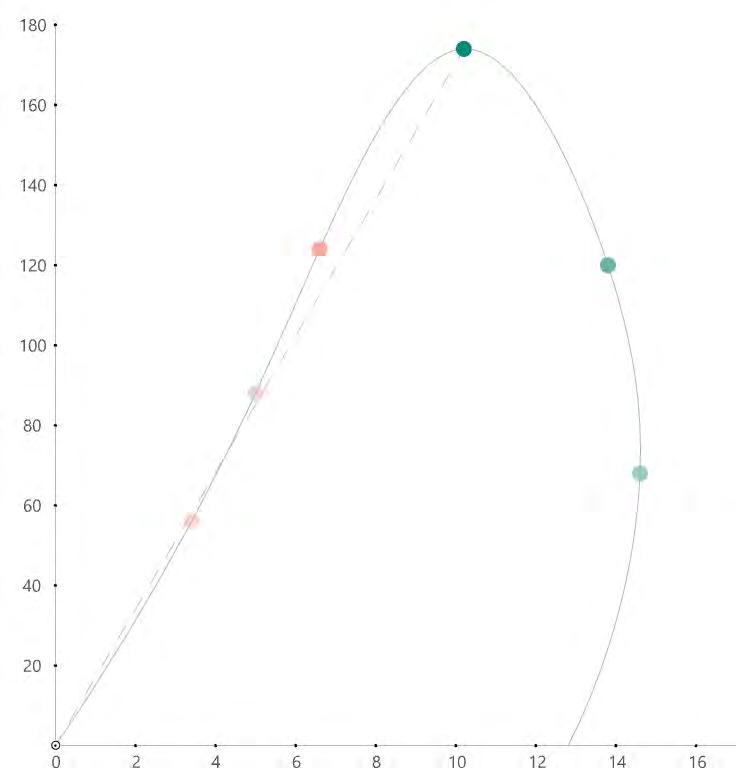
Fig. 62. Plotting graph displaying vertical displacements the sample 3 undergoes when subjected to gradual increase in load unless breaking point is reached
Sample NL (cm)B(cm)T(cm)
3 10 5 2.5
Weight of Sample(g) Breaking point weight(kg)
Force (N)Vertical Displacement (mm)
14015.13148.2748
Sample 3 (Fig.62.) with thickness 2.5 cm, weight 140g had undergone a vertical displacement of 8 mm under the maximum point load of 7.13 kg.
Fig. 63. Plotting graph displaying vertical displacements the sample 4 undergoes when subjected to gradual increase in load unless breaking point is reached
Sample NL (cm)B(cm)T(cm)
4 10 5 3.5
Weight of Sample(g) Breaking point weight(kg)
Force (N)Vertical Displacement (mm)
25018.13177.6749
Sample 4 with thickness 3.5 cm (Fig.63.), weight 250g had undergone a vertical displacement of 9 mm under the maximum point load of 18.13 kg.
Fig. 64. Overlaid graphs displaying vertical displacements of the all 4 samples
Fig. 65. Graph displaying relationship between thicknesses of samples vs maximum vertical displacements achieved under their breaking point loads.
STRUCTURAL STRENGTH
3 POINTS LOADING TEST
Conclusion: It can be concluded from the above experiment that the formulated biomaterial composite has considerable structural strength with its feasible physical application to be utilised as a cladding material panels. However, as the biomaterial composite has 1.2 times more the amount of tensile strength as compared to the plywood of the same length, breadth and thickness subjected to a three point bending test, in the similar setup, it can be considered for further more structural applications.
Future experiments
For further structural applications and generation of computational workflow, Young’s modulus of the formulated biomaterial can be determined, stress and strain relationship that is proportional to F/d values can also be determined further. Flexural strength (σ = 3FL / 2wd2)108 can also be determined as it is the ability of the material to withstand bending forces applied perpendicular to its longitudinal axis. In order to amplify the use of the formulated biomaterial as structural members compression tests under varying loads can be conducted. The baking experiments were conducted to generate porosity and aid high surface adsorption, however this property was not tested. Therefore, black carbon adsorption on the formulated biomaterial samples can be tested, through weight, colour difference mapping, and colour gas diffusion methods. To further test the porous characteristic, the permeability rate of the formulated biomaterial sample can be determined.
Limitations: The above mentioned experiments were not performed in a mechanical lab, nor in environments with controlled humidity levels. Hence, there is a possibility of variation in results and observation otherwise.
Vertic Load (N) al displacement (mm) Load at breaking point (kg)
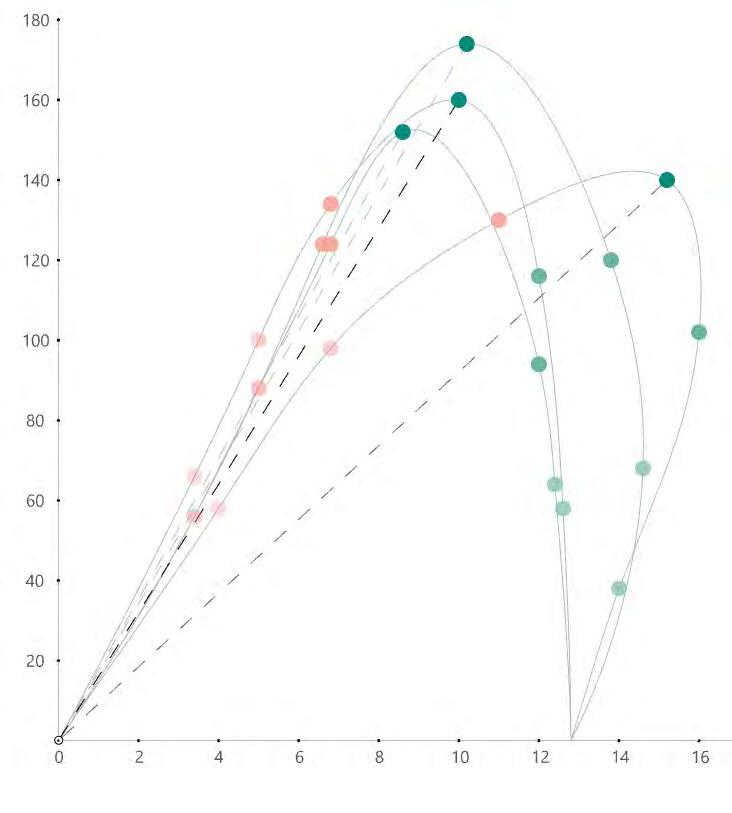
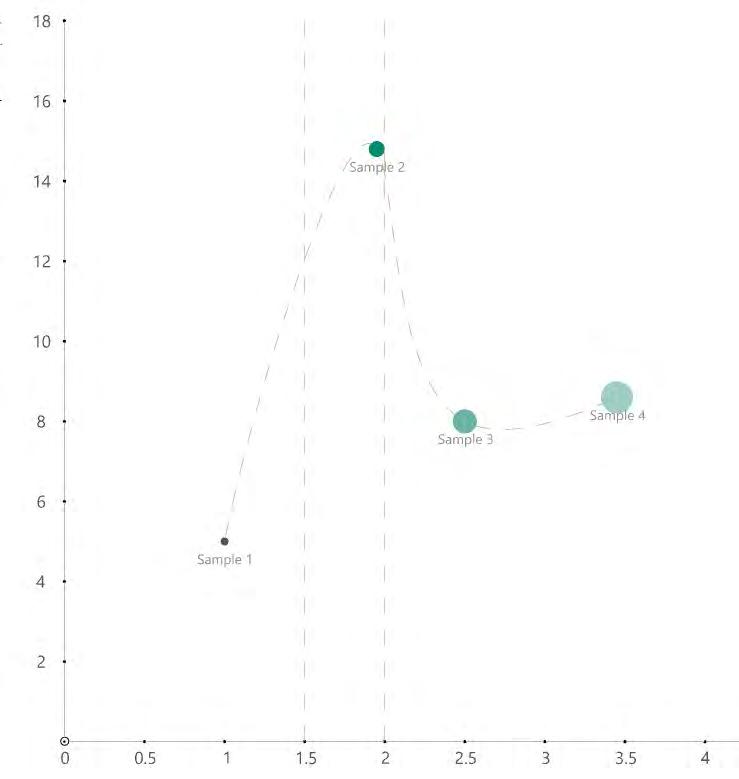
Vertical displacement (mm)
The thickness of the sample
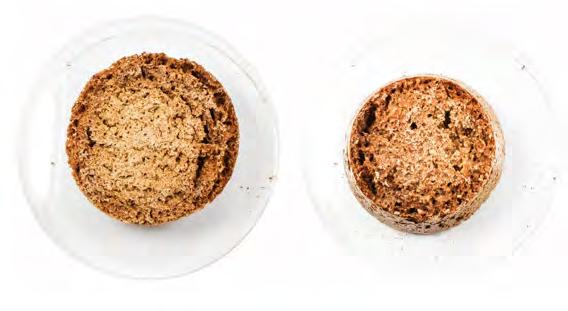
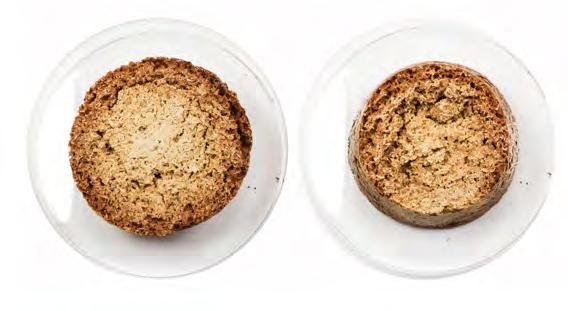
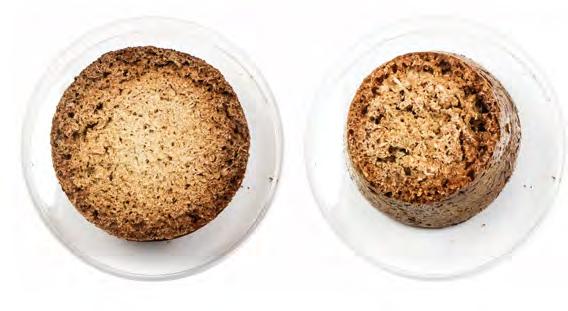
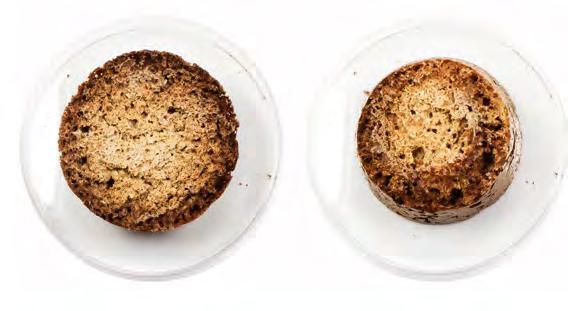
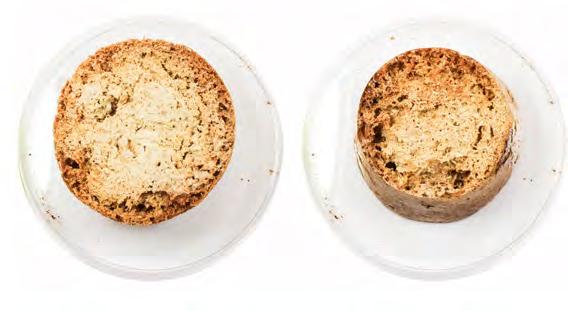
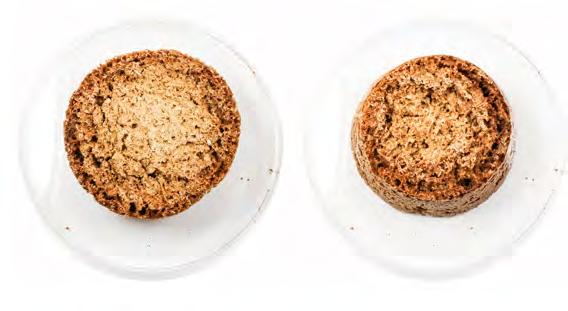
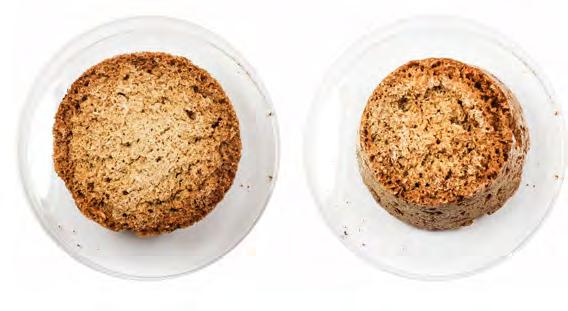
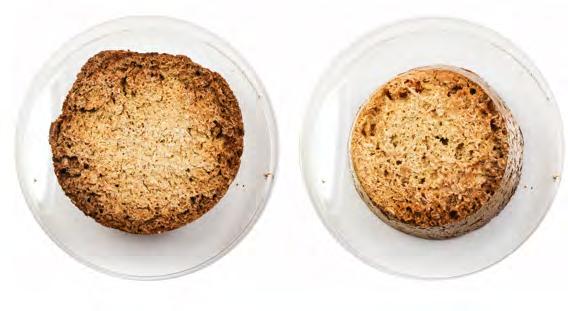
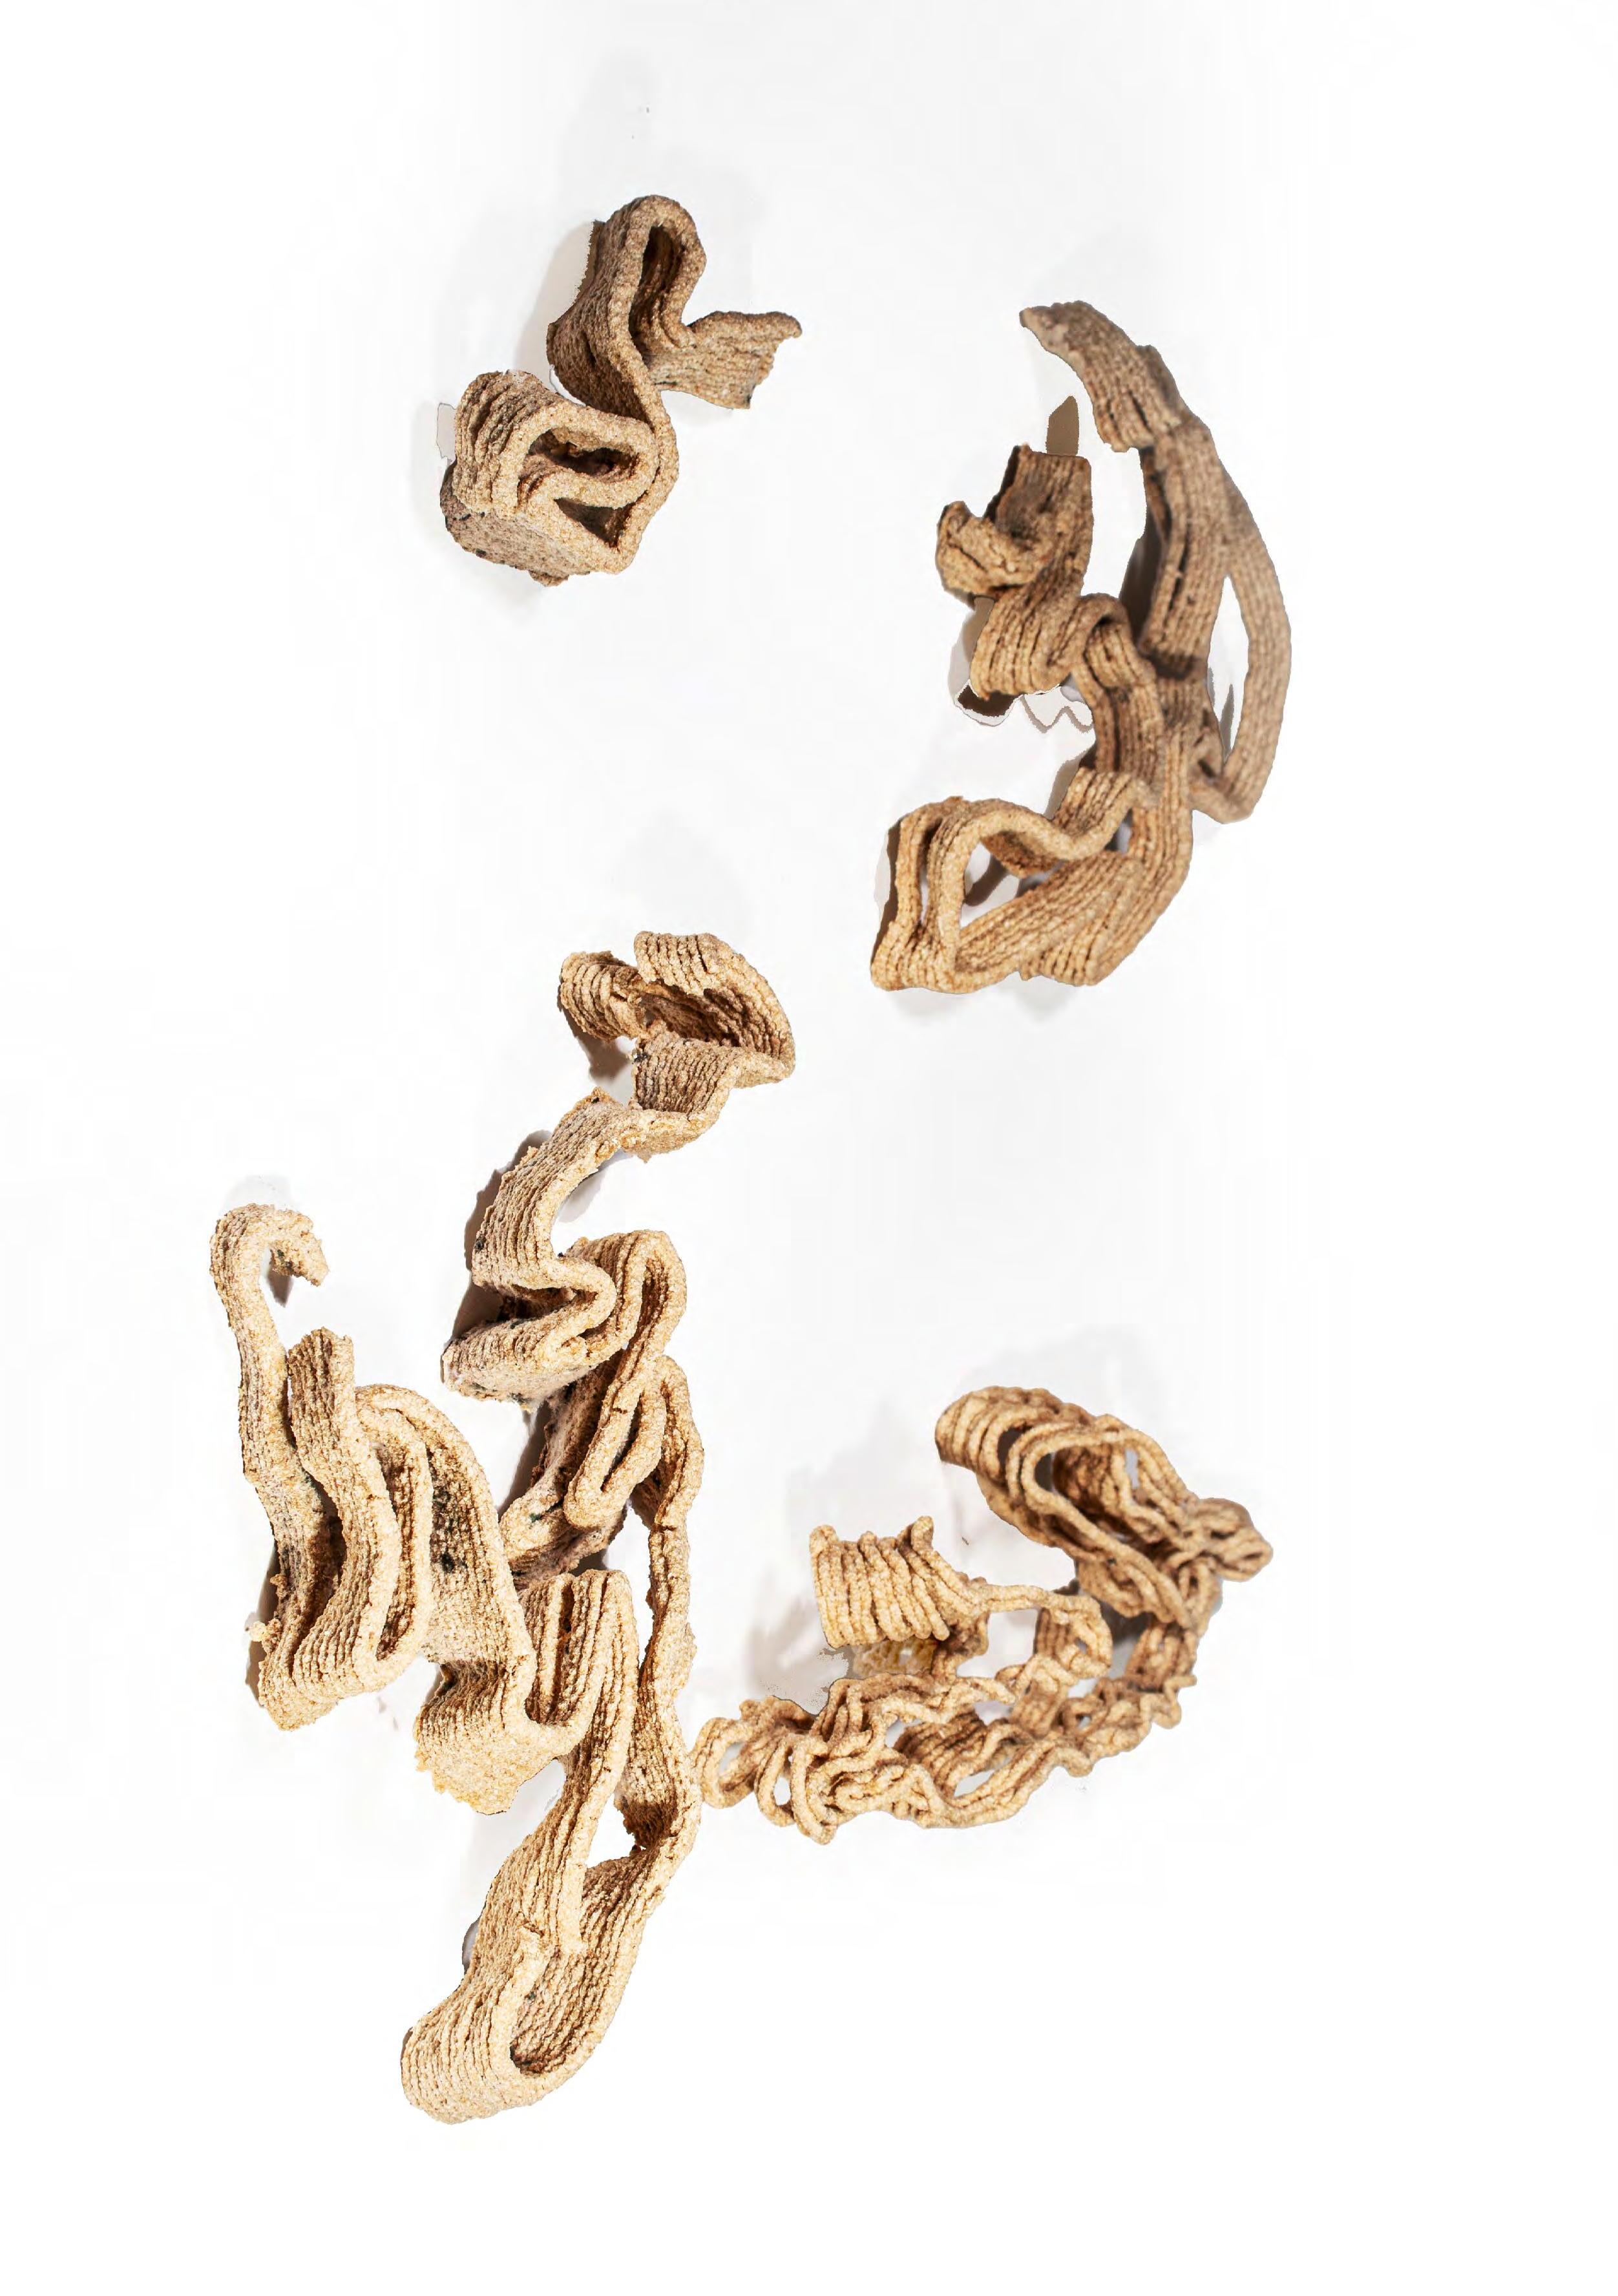
ROBOTIC EXTRUSION
INTRODUCTION
As previously outlined, the raw materials for the formulation of the biocomposite in order to achieve porosity were raw saw dust, corn starch, yeast, sugar and water, mixed in a slurry and baked further in the absence of oxygen to achieve a porous composite. However, it was discovered further that the raw materials have a dynamic behaviour when the mixture is prepared under different temperature conditions. The raw mixture of cornstarch and water when heated at medium heat (100-150C), stirred constantly for a few minutes turns into a viscous mixture with the consistency of a resin; it was hypothesised that a bioresin mixture ideal for extrusion can be prepared from sawdust and cornstarch resin. Extrusion of the saw dust resin mixture using the robotic end effector would aid the fabrication of non-porous, continuous and complex morphology. Hence, saw dust resin samples were prepared in order to conduct physical tests. Additional agents, vinegar and glycerine, were added to increase the longevity of the prepared mixture of bioresin. Large cellulose molecules, such as starch, are long chain polymers. In this experiment, two ingredients change the properties of the polymer bioresin. The glycerin acts as a plasticizer which “lubricates” the plastic mixture. For the mixture to be more pliable, more glycerin is added, less glycerin is added to have less viscous mixture. Longevity of composite resins restoration can be affected by surface hardness restoration using glycerin. 109
EXPERIMENT 1
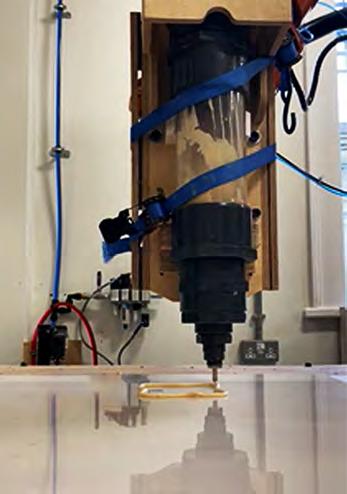
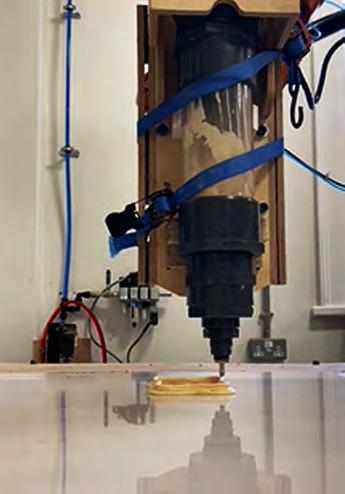
Aim: To physically fabricate continuous complex morphology through the robotic arm extrusion technique
Objective: To determine adequate mixture consistency, air pressure and nozzle size for extrusion of mixture using robotic end effector.
Methodology: Raw resin samples for extrusion were prepared from saw dust, cornstarch, water and vinegar (S:C:W:G:V). Sample numbers 1 to 6 were prepared in the ratio of 1S : 2C : 3W : 0.2G: 0.1V , sample numbers 7 to 12 were prepared in the ratio of 2S : 1C : 3W : 0.2 G: 0.1 V. This mixture was further used for extrusion using a nozzle of diameter of 3, 4 and 5mm each. Different morphologies were tested for extrusions. The pressure for extrusion was determined during the execution of the extrusion tests. The extruded morphologies were let to be air dried for 3 days.
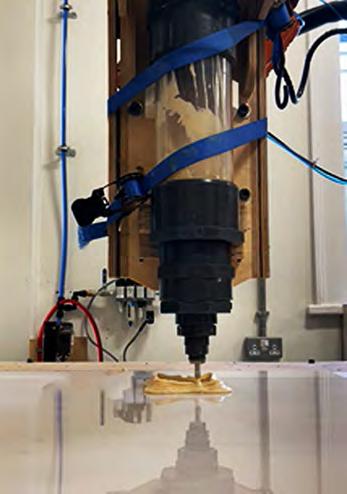
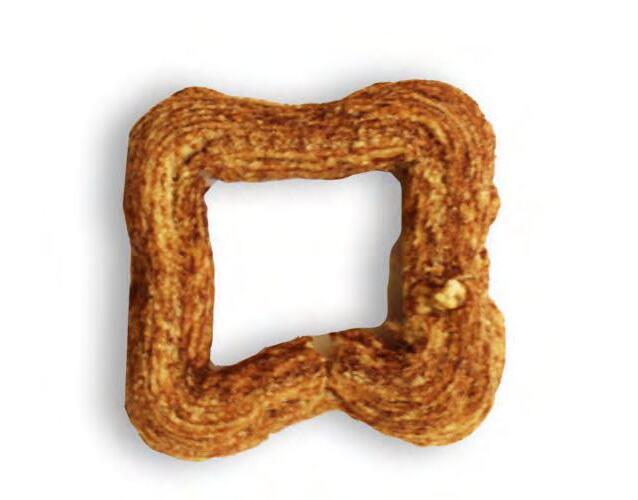
Layer : 1 Height : 4mm
Methodology : End Effector Extrusion
Nozzle size : 3mm diameter
Air Pressure : 0.35 Mpa
Mixture Composition
Sawdust - 1 Part; Cornstarch - 2 Parts; Water - 3 Parts; Glycerine - 0.2 Parts; Vinegar - 0.1 Parts
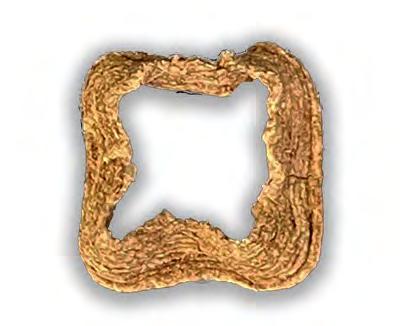
Layer : 4 Height : 15mm
Methodology : End Effector Extrusion
Nozzle size : 3mm diameter
Air Pressure : 0.35 Mpa
Mixture Composition
Sawdust - 1 Part; Cornstarch - 2 Parts; Water - 3 Parts; Glycerine - 0.2 Parts; Vinegar - 0.1 Parts

Layer : 8 Height : 14mm
Methodology : End Effector Extrusion
Nozzle size : 3mm diameter
Air Pressure : 0.35 Mpa
Mixture Composition
Sawdust - 1 Part; Cornstarch - 2 Parts; Water - 3 Parts; Glycerine - 0.2 Parts; Vinegar - 0.1 Parts
Fig. 66. Robotic extrusion.
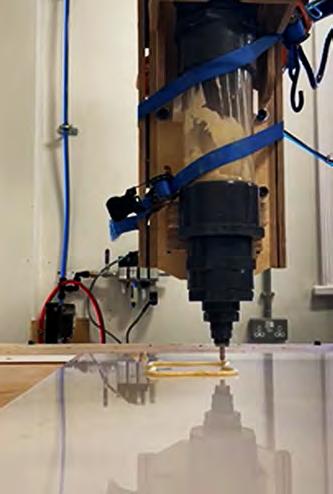
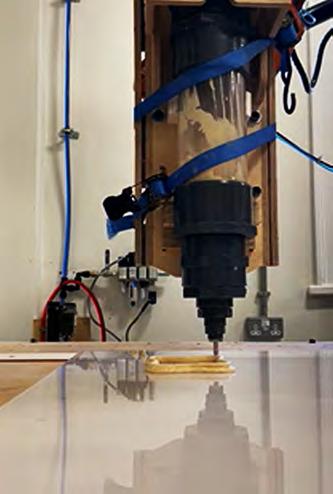
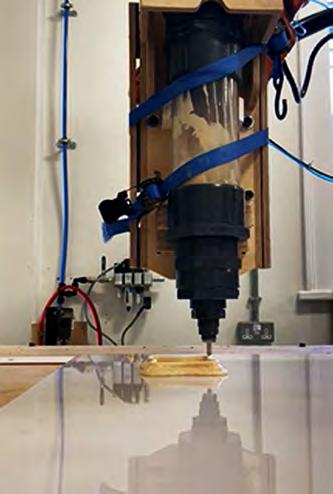
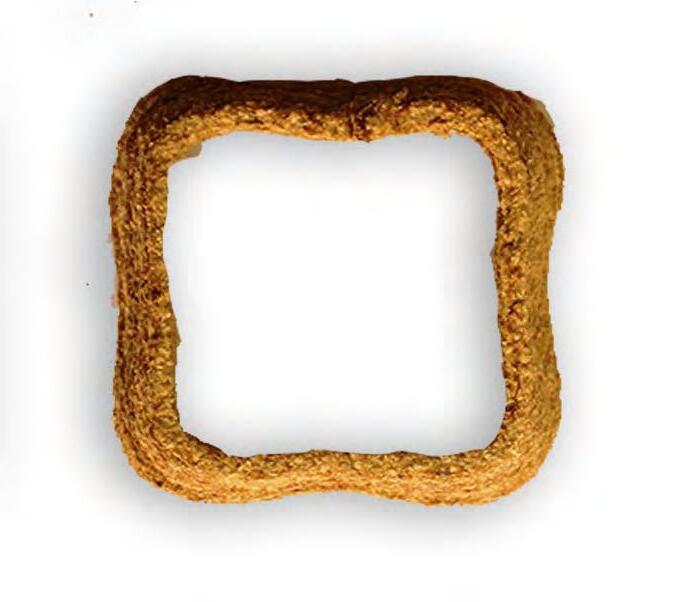
Layer : 1 Height : 4mm
Methodology : End Effector Extrusion
Nozzle size : 3mm diameter
Air Pressure : 0.35 Mpa
Mixture Composition
Sawdust - 2 Parts; Cornstarch - 1 Part; Water - 3 Parts
Glycerine - 0.2 Parts; Vinegar - 0.1 Parts
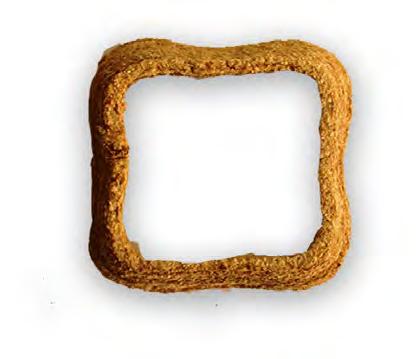
Layer : 4 Height : 16mm
Methodology : End Effector Extrusion
Nozzle size : 3mm diameter
Air Pressure : 0.35 Mpa
Mixture Composition
Sawdust - 2 Parts; Cornstarch - 1 Part; Water - 3 Parts
Glycerine - 0.2 Parts; Vinegar - 0.1 Parts
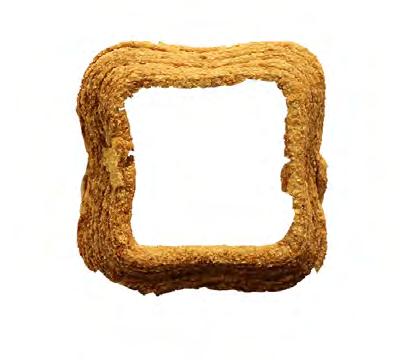
Layer : 8 Height : 30mm
Methodology : End Effector Extrusion
Nozzle size : 3mm diameter
Air Pressure : 0.35 Mpa
Mixture Composition
Sawdust - 2 Parts; Cornstarch - 1 Part; Water - 3 Parts
Glycerine - 0.2 Parts; Vinegar - 0.1 Parts
EXPERIMENT 1
Observation: The air pressure utilised for the extrusion was 0.35 Mpa. The suitable nozzle diameter was 3mm, as nozzles bigger than this diameter allowed more material to accumulate under regular pressure while extrusion leading to lesser viscosity. Certain observations could be made after the samples were air dried. Samples 1 to 3 were observed to be less voluminous, as the layers collapsed during extrusion, displaying considerably less viscosity. Samples 4 to 6 better retained their volumes as compared to samples 1 to 3, the layers retained the height displaying considerably higher viscosity. However, shear cracks were observed in these samples.
Conclusion: The raw mixture of samples 4 to 6 with composition ratio of 2S : 1C : 3W : 0.2 G: 0.1 V had higher viscosity. Hence, it can be concluded that the air dried samples retained their forms.
EXPERIMENT 2
The aim of extruding morphologies from the raw sawdust resin mixture using robotic end effector was to achieve long continuous complex morphologies while determining the geometric constraints concerning shear crack points. Therefore, determining the longest length that can be allowed to be extruded with minimal shear cracks was extremely crucial. In order to avoid shear cracks it was hypothesised that the higher the length to absolute length ratio, lesser will be the formation of shear cracks along the length of the extruded morphology.
Aim: To physically fabricate continuous complex morphology through the robotic arm extrusion technique
Objective: To determine geometric constraints for extrusion of raw saw dust resin mixture using robotic end effector.
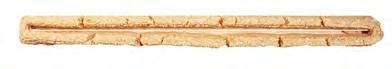
SAMPLE 1
Length : 15 cm
Breadth : 1 cm
Height : 2 cm
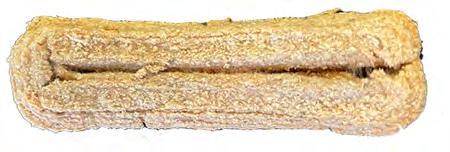
SAMPLE 2
Length : 18 cm
Breadth : 2 cm
Height : 3 cm
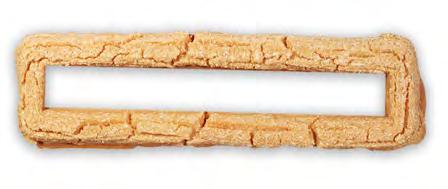
SAMPLE 3
Length : 18 cm
Breadth : 3 cm
Height : 4 cm

SAMPLE 4
Length : 20 cm
Breadth : 3 cm
Height : 6 cm
Fig. 67. Robotic extrusion. Experiment 2
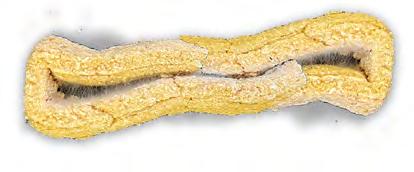
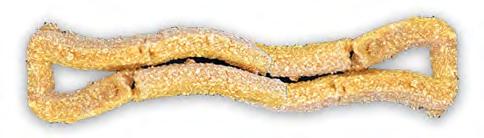
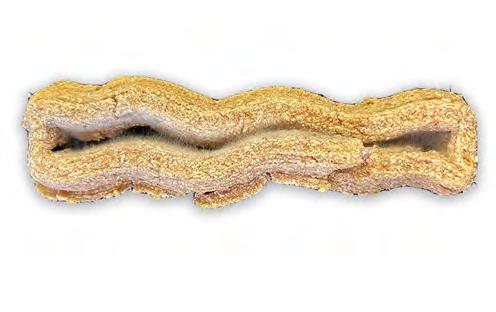
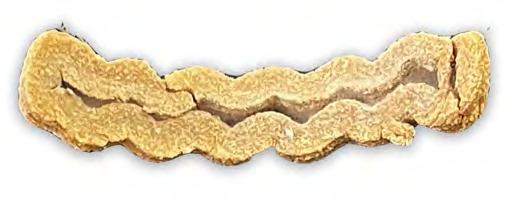
SAMPLE 5
Absolute Length (lo) : 15 cm
Length (l) : 17cm
l/lo = 1.14
Breadth : 2 cm
Height : 3 cm
SAMPLE 6
Absolute length (lo) : 18 cm
Length (l) : 21 cm
l/lo = 1.17
Breadth : 2 cm
Height : 3 cm
SAMPLE 7
Absolute length (lo): 18 cm
Length (l) : 24 cm
l/lo = 1.4
Breadth : 3 cm
Height : 4 cm
SAMPLE 8
Absolute length (lo) : 20 cm
Length (l) : 28 cm
l/lo = 1.4
Breadth : 3 cm
Height : 4 cm
EXPERIMENT 2
Methodology: Raw saw dust resin mixture with raw material composition ratio being 2S : 2C : 3W : 0.2 G: 0.1 V was prepared for extrusion. Rectilinear geometric morphologies with varying length to breadth to ratios were created as represented in sample numbers 1 to 4 and where as in sample numbers 5 to 8 total perimeter of the length was increased by adding manifolds in the geometry to compare the phenomenon of shear cracking between the two sets of samples. All the samples were let to air dry for 3 days and observed for further insights.
Observation: It was observed that sample numbers 1 to 4 had shear cracks at l/2, l/4. l/8. However sample numbers 5 to 8 with l/lo ratio being greater than 1 had considerably less number of shear cracks.
Conclusion: It can be concluded that morphologies with manifolds that are with higher length to absolute length ratio, had lesser or almost no shear cracks as compared to rectilinear morphologies. Hence, the extrusions for final morphological fabrication could be tested for further implementation.
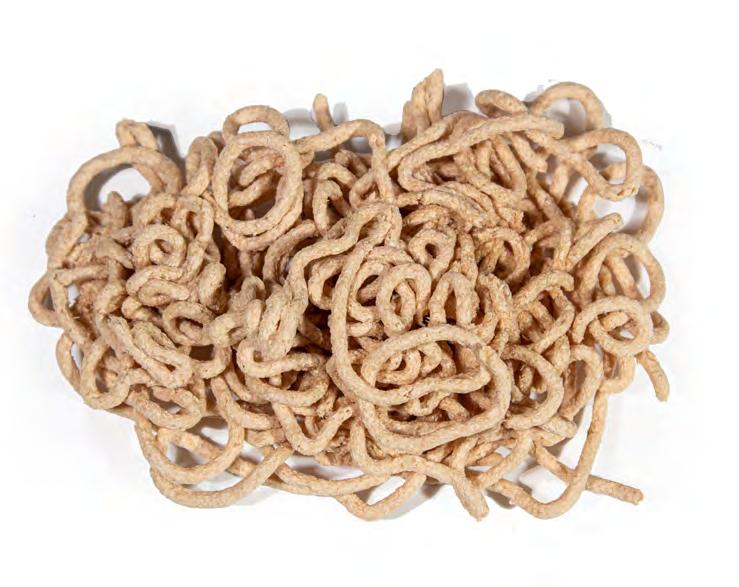
ENDNOTES
100. Jonathon. Madore, “How To Compost Sawdust,” Green Upside, n.d., https://greenupside.com/ how-to-compost-sawdust/.
101. Susanna Laurén and Biolin Scientific, “Surface and Interfacial Tension,” n.d., 8.
102. Hazimah Madzaki et al., “Carbon Dioxide Adsorption on Sawdust Biochar,” Procedia Engineering 148 (2016): 718–25, https://doi.org/10.1016/j.proeng.2016.06.591.
103. Hebel and Heisel, Cultivated Building Materials.
104. Wark Barry, “Bioplastic Tectonic,” 2021, https://www.barrywark.com/bioplastic.
105. Wark Barry, “Bioplastic Tectonic,” 2021, https://www.barrywark.com/bioplastic
106. Wark Barry, “Bioplastic Tectonic,” 2021, https://www.barrywark.com/bioplastic
107. Wark Barry, “Bioplastic Tectonic,” 2021, https://www.barrywark.com/bioplastic
108. Robert L. Horton, PhD, Ohio et al., “Bioplastic,” n.d., https://4-h.org/wp-content/uploads/2016/02/Agriculture-at-Work-Bioplastic.pdf.
109. Ferriza Tri Mardianti, Sukaton Sukaton, and Galih Sampoerno, “Benefit of Glycerine on Surface Hardness of Hybrid & Nanofill Resin Composite,” Conservative Dentistry Journal 11, no. 1 (June 30, 2021): 28, https://doi.org/10.20473/cdj.v11i1.2021.28-31.
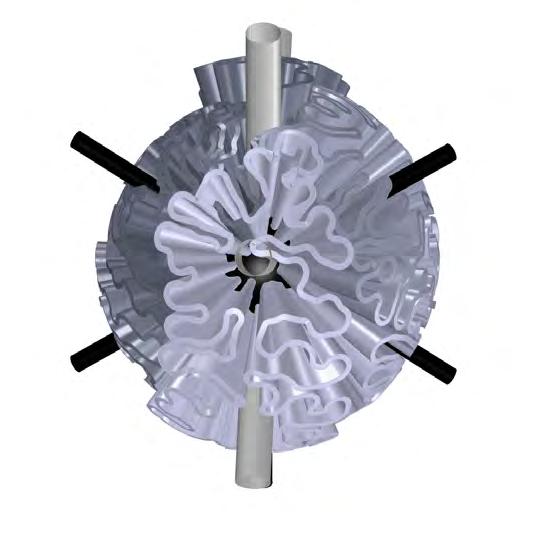
MORPHOLOGICAL DEVELOPMENT
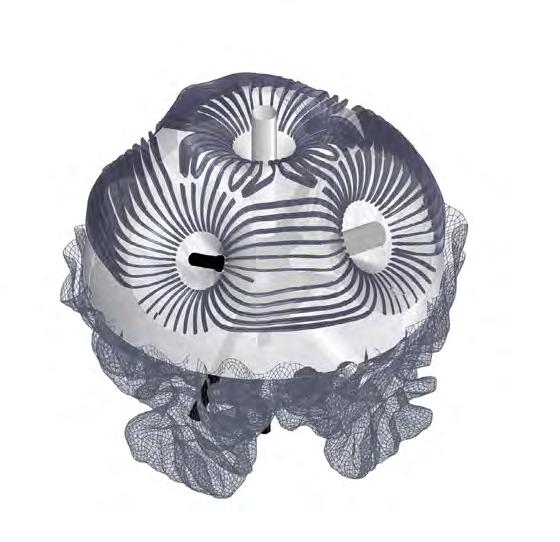
OVERVIEW
According to the research accomplished in the research development chapter, the chosen area has a number of problems directly connected to the fragmentation of the natural landscapes. Fragmentation causes increased temperature and pollution levels which subsequently impact the level of the heat island effect. Therefore, in order to decrease the fragmentation of the natural landscapes within the urban environment, the proposed network should address these subsequent problems defined in the research chapter.
The developed system addresses filtration of the polluted air, as well as identifying a strategy for its thermoregulation. Moreover, the proposed solution supports the natural ecosystems by providing enough greenery to create a continuous network that will defragment already fragmented areas. More than that, in order to sustain the network, it should support itself with resources and be adaptive to the fast-changing environments. The suitability of the proposal to regulate these environmental fluxes, continuity of green tissue, purification of existing urban space and regeneration of continuous habitat will allow for the first cycle of repair to occur in order to mitigate the problems of fragmentation before the second cycle of regeneration occurs.
The defined problems directly inform the functions that should be implemented within the proposed network. The system can therefore address the next areas of investigation: production of oxygen; filtration of pollen, dust and soot particles; filtration of light and noise pollution, protection of endangered plants and species by providing habitation spaces; a collection of grey water and its subsequent filtration; production of strategies for air cooling. Therefore, the defined functional areas inform the development of four distinct modules, functions of which are overlapped in order to create a gradual transition or thresholds of change from one function into another. They are Production_ Protection, Filtration_Production, Collection_Filtration and Filtration.

STRUCTURE
Each module shares the same structure - the permutohedron of order 4, or truncated octahedron. The space-packing truncated octahedron has been chosen due to the fact that it is comprised of 6 squares and 8 ditrigons. This allows certain restrictions in the way that the octahedron can come together. (Fig.68.) The hierarchical organisation of quadrilaterals to ditrigons suggests that there are primary and secondary connections via the number of edges for each shape. In this way, the bio-bot structure is circumscribed into a truncated octahedron which incorporates those predefined module connection rules. Furthermore, the voids left by creating face to face connections for the octahedron allows the space necessary for the rotational matrices of an object and vector in both Euclidean space and its larger non-collisional aggregation. The chosen structure is informed by the ability of the component to attach to another within a regular grid, thus providing more structural strength. At the same time, the size of the modules is defined by the ability of humans to influence the structure; providing new modules without the usage of heavy equipment- fitting within a 1 metre by 1 metre bounding geometry. Therefore, it gives the opportunity to simplistically grow the population of components in order to adapt to fast-changing environ-
Fig.68. Structure is fitted into the permutohedron of order 4 or truncated octahedron with 90 X 85 cm global dimensions
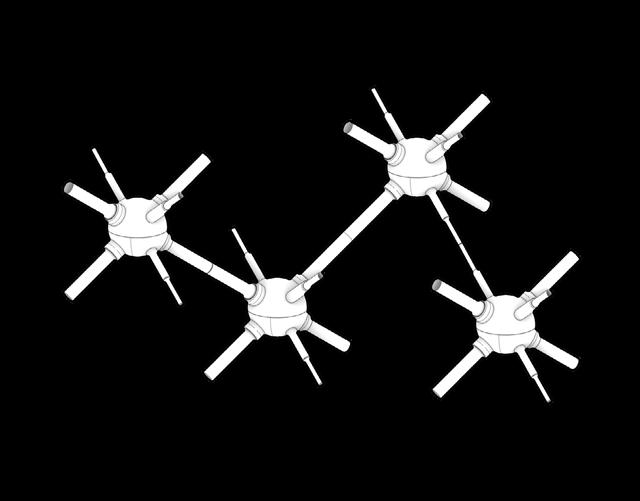
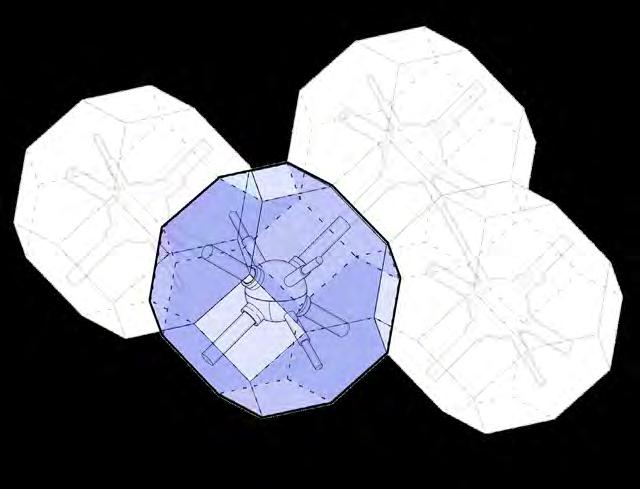
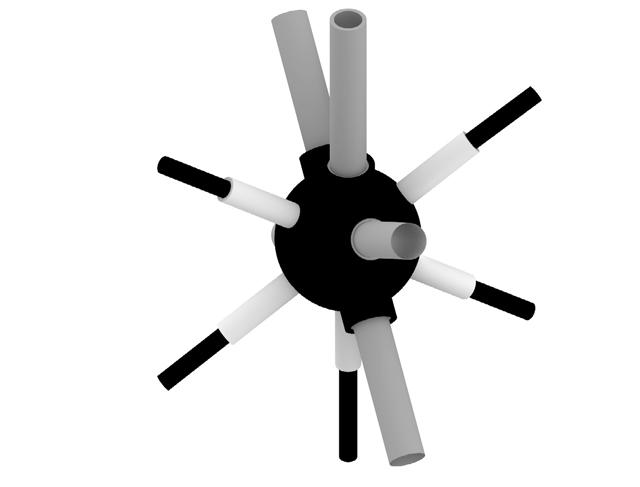
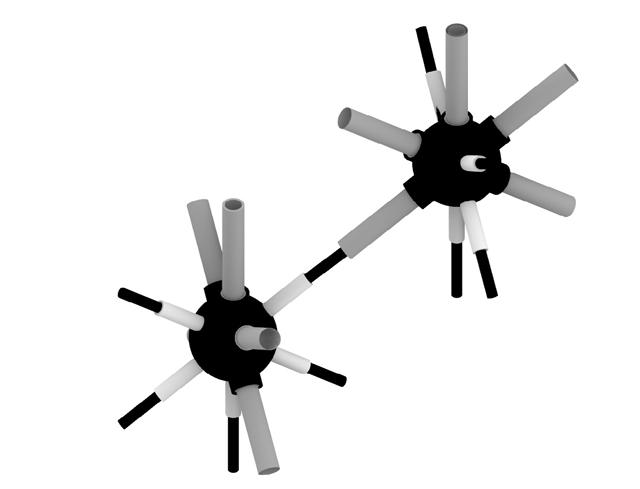
STRUCTURE
mental conditions. The structure is created by connecting the central point of the truncated octahedron to the central points of hexagonal surfaces, which define the angle for connection as 109°. The structure’s central area is a sphere that contains the electronic part of the system, which is responsible for the performance of the component. The connection arms have a cylindrical shape to allow the kinetic rotation of the system (Fig.69.).
Each module contains a living tissue structure, particularly moss growing on top of the saw dust foam material. The structure for the living tissue is defined by the differential growth algorithm. The chosen algorithm is informed by the ability of the structure to create a continuous surface which contains self-shaded pockets for specified microclimate.
Fig.69 .Diagrams show the relationships between permutohedron of order 4 and inner structure as well as module to module connection
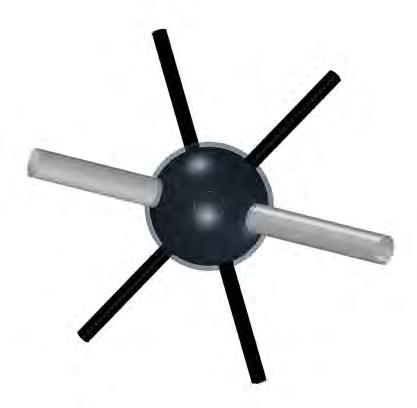
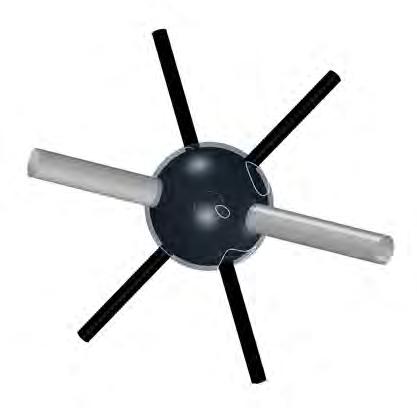
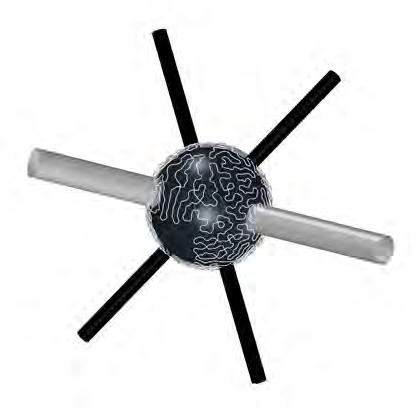
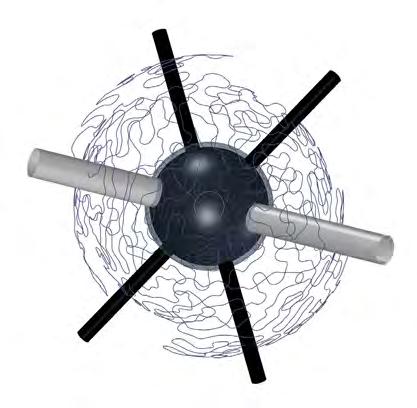
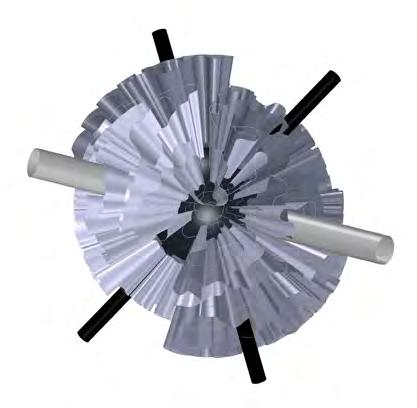
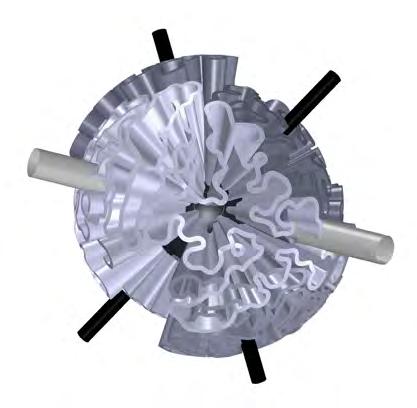
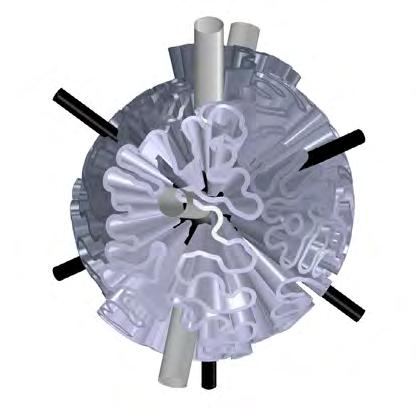
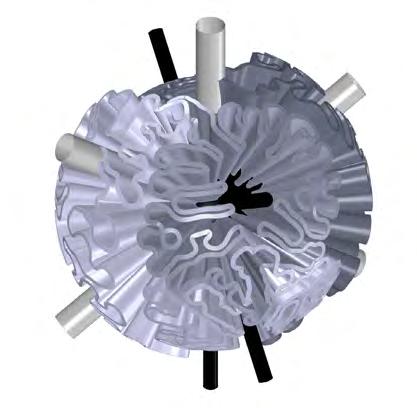
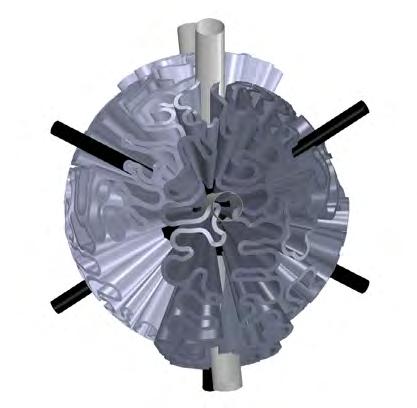
1. Offset of the core surface
3. Differential Growth of the polyline using point collision algorithm Final morphological organisation
5. Rulled surface
6. Surface offset
2. Generation of the points on the surface. Creation of polylines from previously generated points
4. Offset of the generated polylines on different distances
GOAL GENERATE A MORPHOLOGICAL VARIATION OF THE COMPONENT IN CONSIDERATION FOR THE LOCAL ENVIRONMENTAL CONDITIONS
OBJECTIVESOPTIMISE THE MORPHOLOGY OF THE PRODUCTION_PROTECTION FUNCTION
FITNESS CRITERIA
FITNESS CRITERIA 1; EQUILISE SUN EXPOSURE
FITNESS CRITERIA 2; MAXIMISE THE NUMBER OF POCKETS
FITNESS CRITERIA 3; MAXIMISE SURFACE OF THE PLANTER
PHENOTYPEGENERATED USING DIFFERENTIAL GROWTH ALGORITHM
GENEPOOL POSITION,OF POINT TO GENERATE POLYLINES FOR GROWTH, NUMBER OF POLYLINES, EXTRUSION DEPTH
The Production_Protection component directly addresses the problem of fragmentation of the natural landscaped, providing areas for both vernacular plants as well as those which are protected. The logic for the component’s morphological organisation is informed by the need to minimise the number of surfaces’ “plant pockets” in order to decrease the amount of water pipes connections and, at the same time, to create pockets that will hold plants on its locations creating one ecosystem for their root system. The line based model differential growth algorithm was chosen to address these criteria.
COMPUTATIONAL LOGIC
The experiment’s goal is to create a population of morphologies that optimise toward the following goals: optimise the morphologies for plant pots, providing the minimal number of planters, while creating the maximum amount of “pockets” considering local environmental conditions. For this goal, the following fitness criteria were established: fitness criteria 1 (FC1)– maximises the length of generated polylines; fitness criteria 2 (FC2)– sets a ratio between areas on which the sun exposure should be maximised towards the areas where solar radiation should be limited. These fitness criteria are informed by the types of plants which were chosen to inhabit this function; fitness criteria 3 (FC3)– maximises the surface of the planter bed. Each of these objectives is related to the morphological changes used to construct the form of the Production_Protection module morphology; these transformations are known as the “genetic code” (or genome).
The following morphological alterations are addressed by the number of genes or genome: the base surface for points generation is subdivided, wherein the number of subdivisions can vary. (Fig.70.) This variation directly impacts how many closed geometries “pots’’ can be generated. Each subdivision is divided into four sections, with each subdivision serving as a field for generating a starting point. These spots are then joined to form polylines as a base for a line-based model of differential growth algorithm (DGA). The next step was the simulation of DGA by varying radii for the collision of points. The final step is the extrusion length, which helps to achieve different levels of sun exposure.
Fig.70 . Computational logic of the Production_Protection module
EVOLUTIONARY OPTIMISATION
Fitness criteria 1 (FC1) was measured as a ratio between point exposure to sun and shade. The intention was to minimise the difference between the number of points in each group in order to place different families of plants that needed adjustments in the environmental conditions. FC2 was measured as the depth of each segment pocket, while increasing the general length of each planter together with the number of isolated parts of the polyline, extracted by analysing the closest points on this polyline. Finally, FC3 was measured as an area of each surface intending to increase the number of sum areas in order to increase not only their surface but also the number of distinct geometries. The high number of morphologies have a height difference which was considered as a crucial gene for plant maturation.
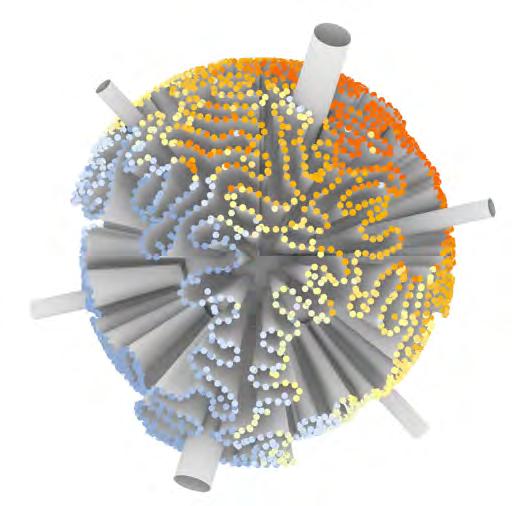
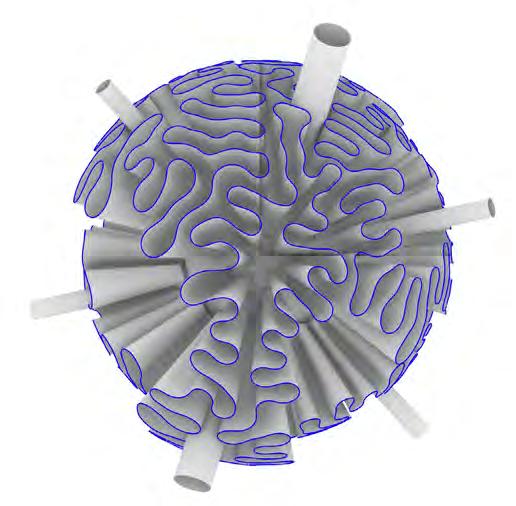
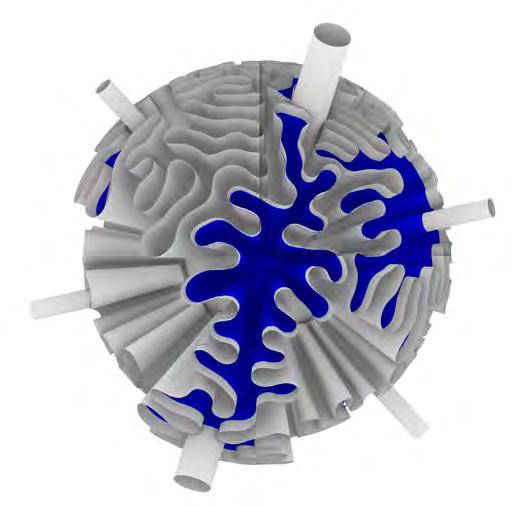
Fitness criteria 1; Equilise sun exposure
Fitness criteria 2; Maximise the number of pockets
Fitness criteria 3; Maximise surface of the planter
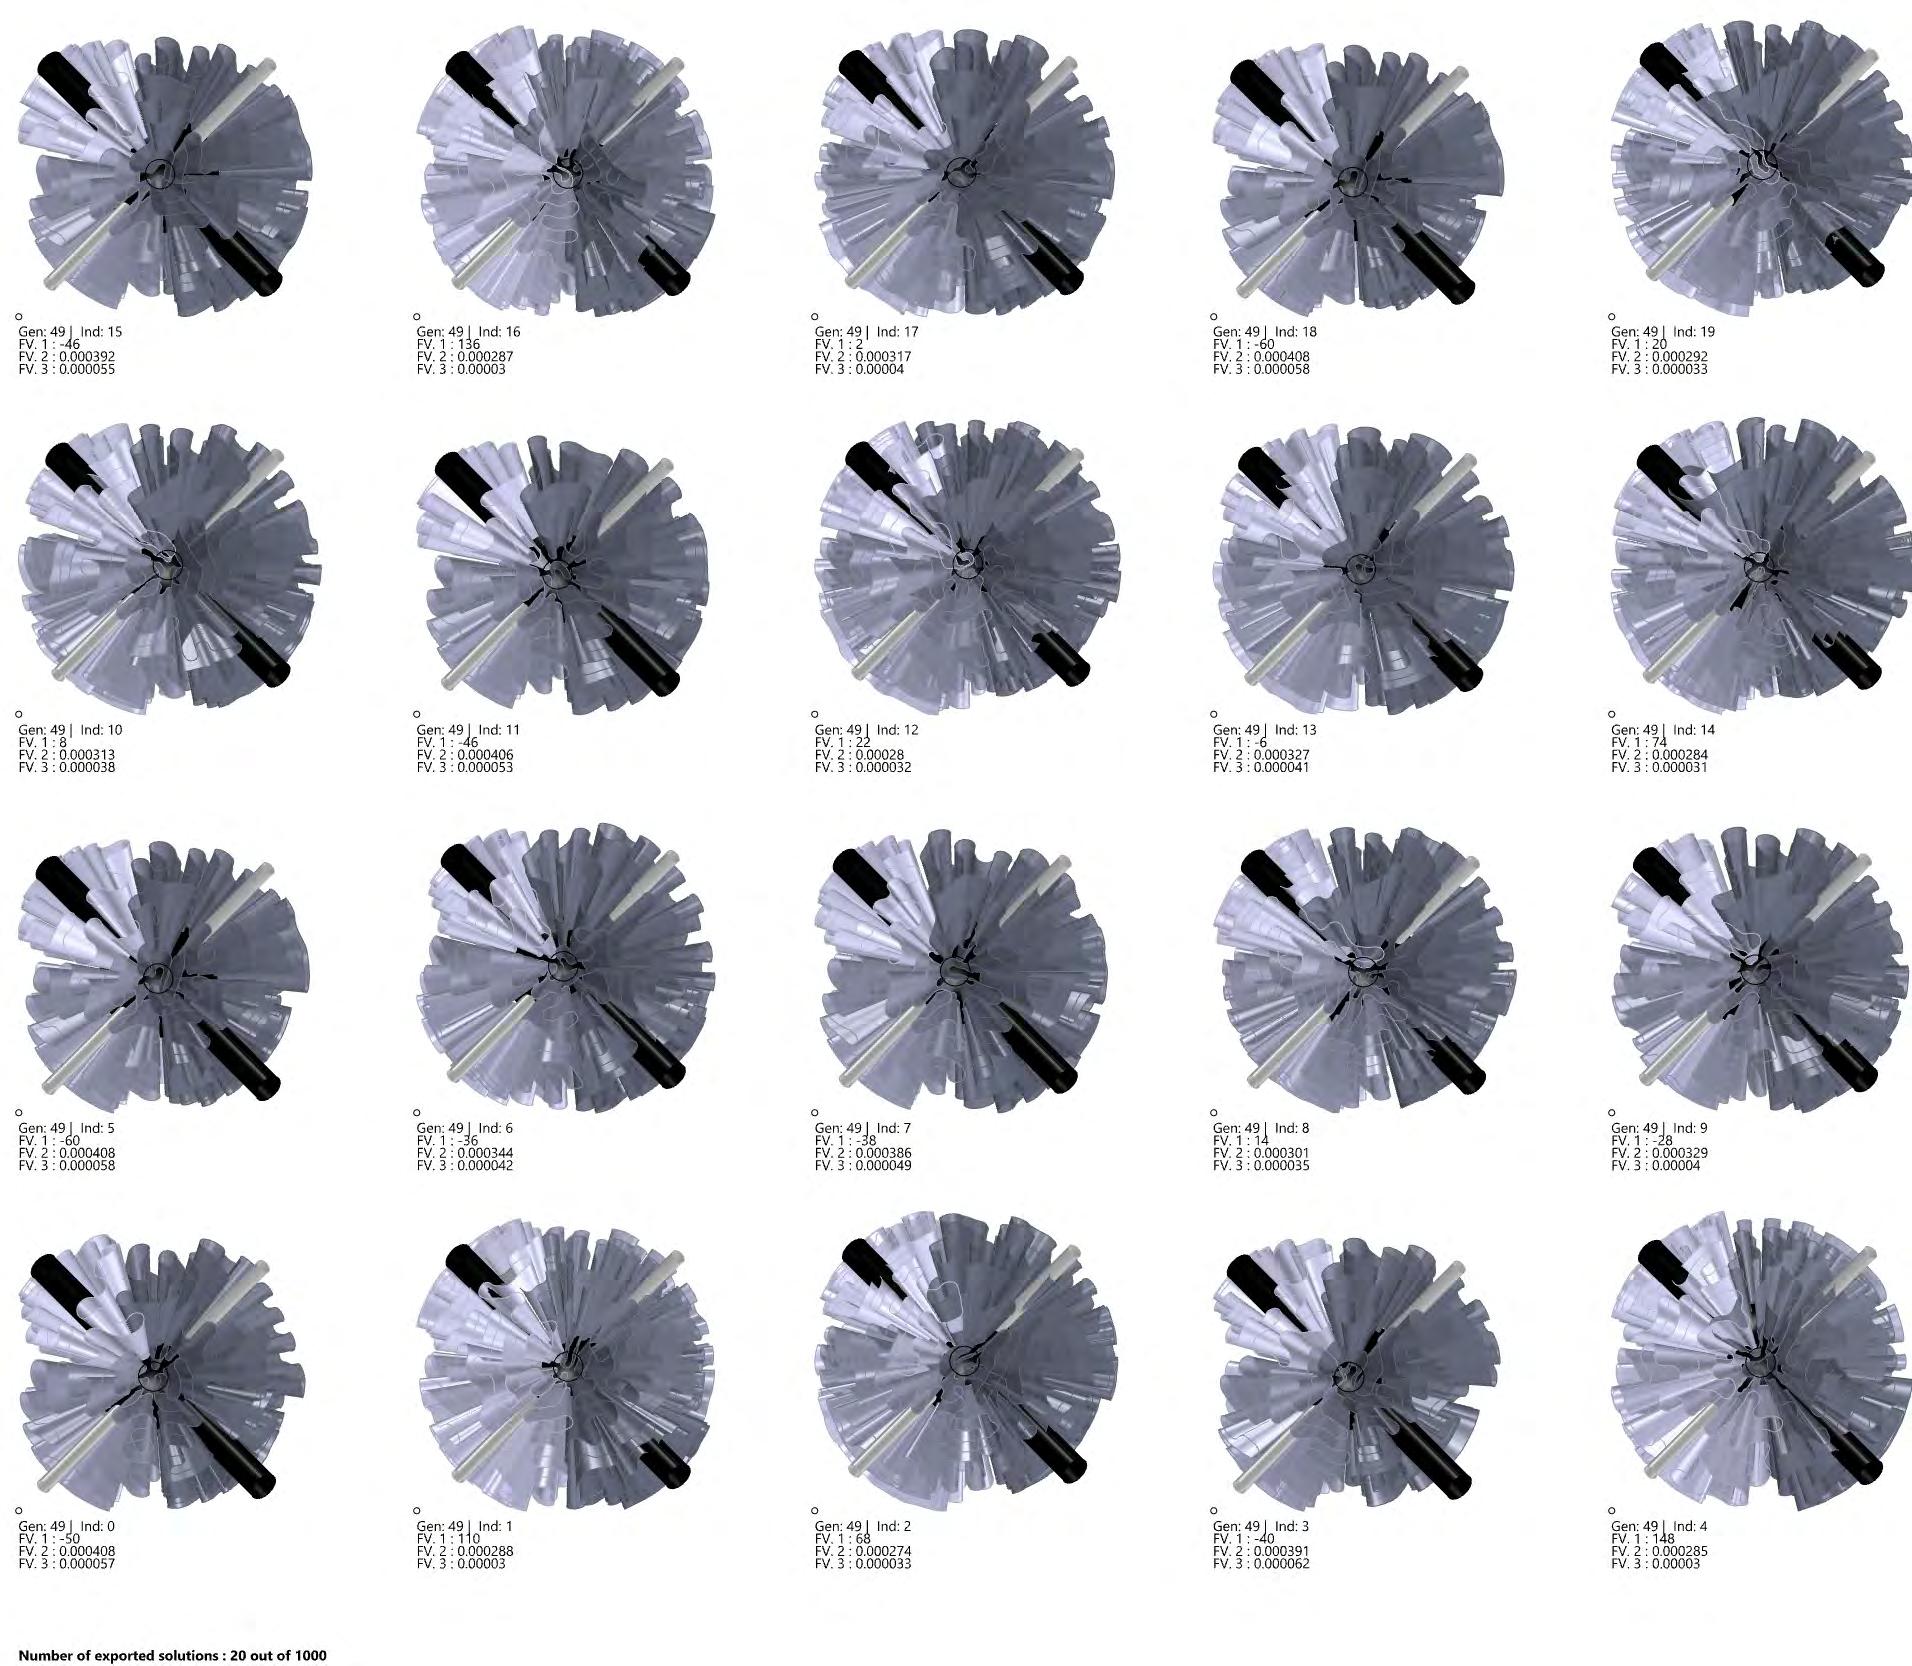
EVOLUTIONARY OPTIMISATION
The result of the algorithm produced 1000 phenotypes solutions with three fitness values per solution, totalling 3000 values. Although the simulation performed well towards optimisation of the solutions, it produced a significant number of variations struggling to optimise towards Fitness criteria 1. From the Pareto Front solutions (Fig..71), it can be observed that the simulation produced a high number of individuals with repeated values which decreased the variation within produced phenotypes. The high level of visual geometrical variation was observed only in the simulation’s early stages, which rapidly converged into optimised values due to the low number of genes informing the morphological alterations. The visual analysis of the Pareto Front solutions shows that there are a limited number of phenotypes with intersecting geometries, which can be considered as a sign of a successful simulation.
Fig.71. This figure illustrates the selected pool of individuals, particularly Pareto Front solutions.
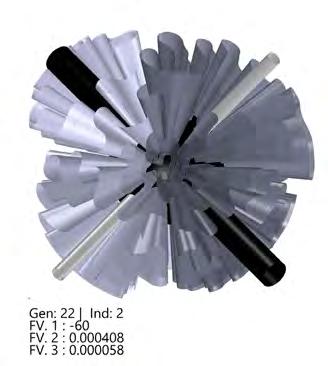
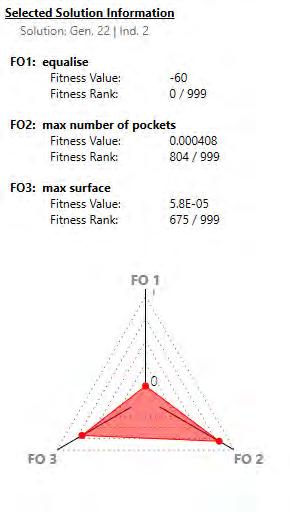
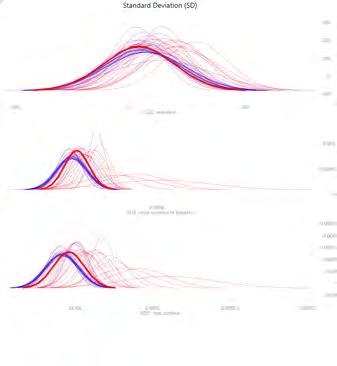
FITNESS CRITERIA 1
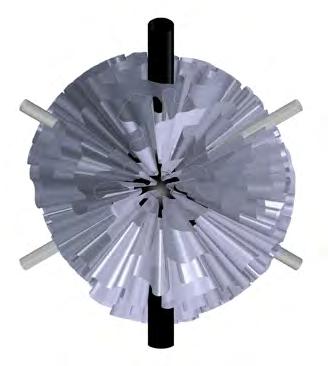

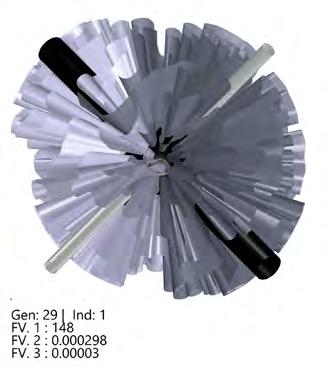
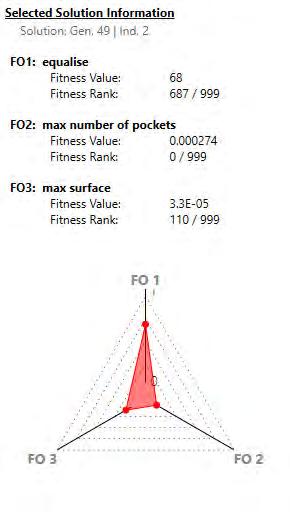
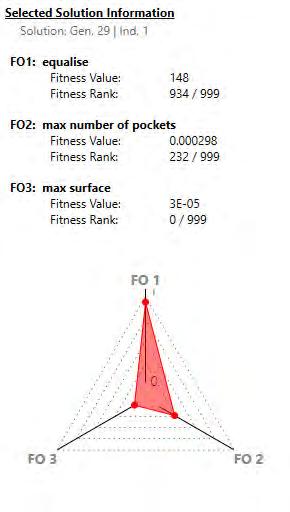
EVOLUTIONARY OPTIMISATION
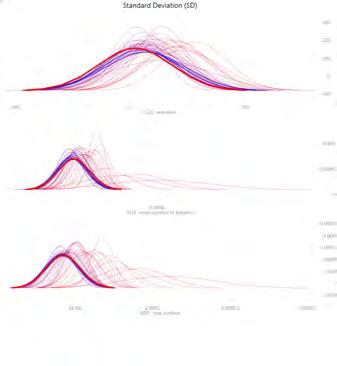
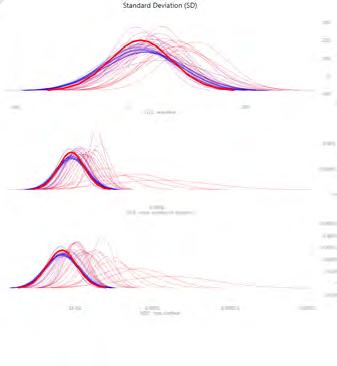
Fitness criteria 1 (FC1)- the most optimised phenotype evolved from generation 22 individual 2 (G22I2).
The criteria was formulated to equalise the sun exposure on the morphology surfaces. The simulation produced 53 phenotypes with rank 0 for FC1.
Fitness criteria 2 (FC2)- the most optimised phenotype evolved from generation 49 individual 2 (G49I2).
The criteria was set to maximise the number of pockets which should hold plants in position. The simulation produced 61 phenotypes with rank 0 for FC2. The post analysis shows that individuals with high performance of FC2 have geometrical issue, particularly the intersection of some of the geometries
Fitness criteria 3 (FC3)- the most optimised phenotype evolved from generation 29 individual 1 (G29I1)
The criteria was set as a parameter that should evolve towards the maximisation of the surface of planters. The simulation produced 57 phenotypes with rank 0 for FC3.
FITNESS CRITERIA 2
FITNESS CRITERIA 3
Fig. 72. Best individuals for 3 Fitness Criteria. The graphs plot all three fitness objectives. The red dots and curves show the selected solution in the entire simulation. It shows how successfully or unsuccessfully simulation optimised this solution for the three fitness objectives.
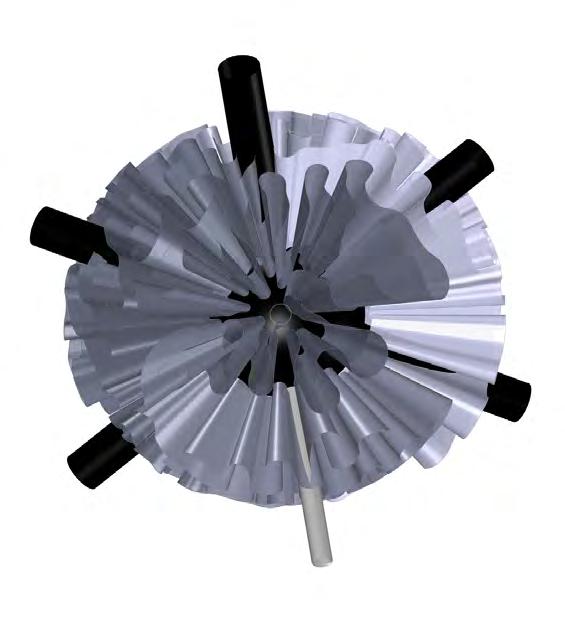
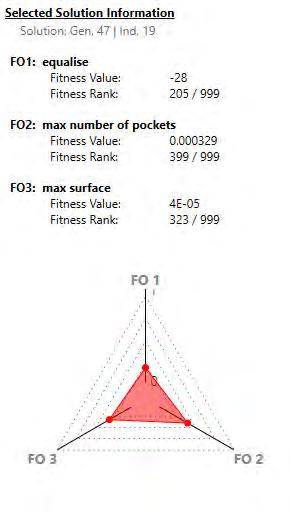
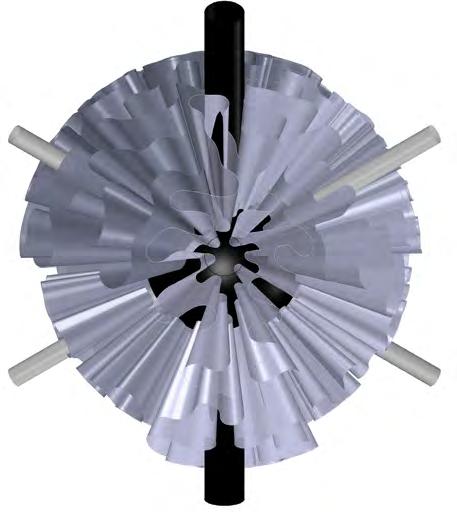
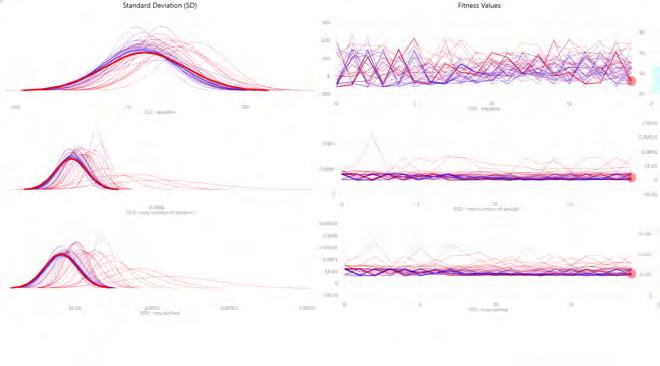
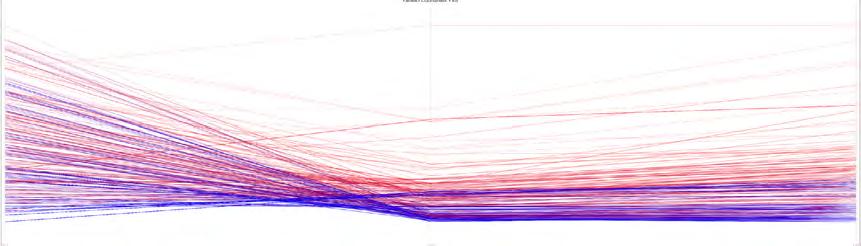
EVOLUTIONARY OPTIMISATION
Fig. 73. The average solution for all fitness criteria with a rank of zero . The red dots and curves show the selected solution in the entire simulation. It shows how successfully or unsuccessfully simulation optimised this solution for the three fitness objectives.
The average solution for all fitness criteria with a rank of zero was chosen as a generation 47 individual 19 (G29I1) (Fig..73). This individual has a high difference between planter morphologies height depicted in the Fig XX for FC1, which creates more shadows on one of them, producing more exposure to sun for others. This morphological variation informs a more equal distribution of plants which need different environmental parameters, be it full exposure or hidden from direct radiation. This individual has a lower optimisation rate towards FC2, which helps to avoid geometric intersections, isolating the root systems of the chosen plant species. `Moreover, the phenotype has a high optimization rate in the FC3 values, producing higher surface areas. The morphology was subdivided into 5 distinct planter geometries with a high variation of their height, where the differential growth pattern does not have visual intersections. The individual 19 from generation 47 was chosen for further development of the Production_Protection module.
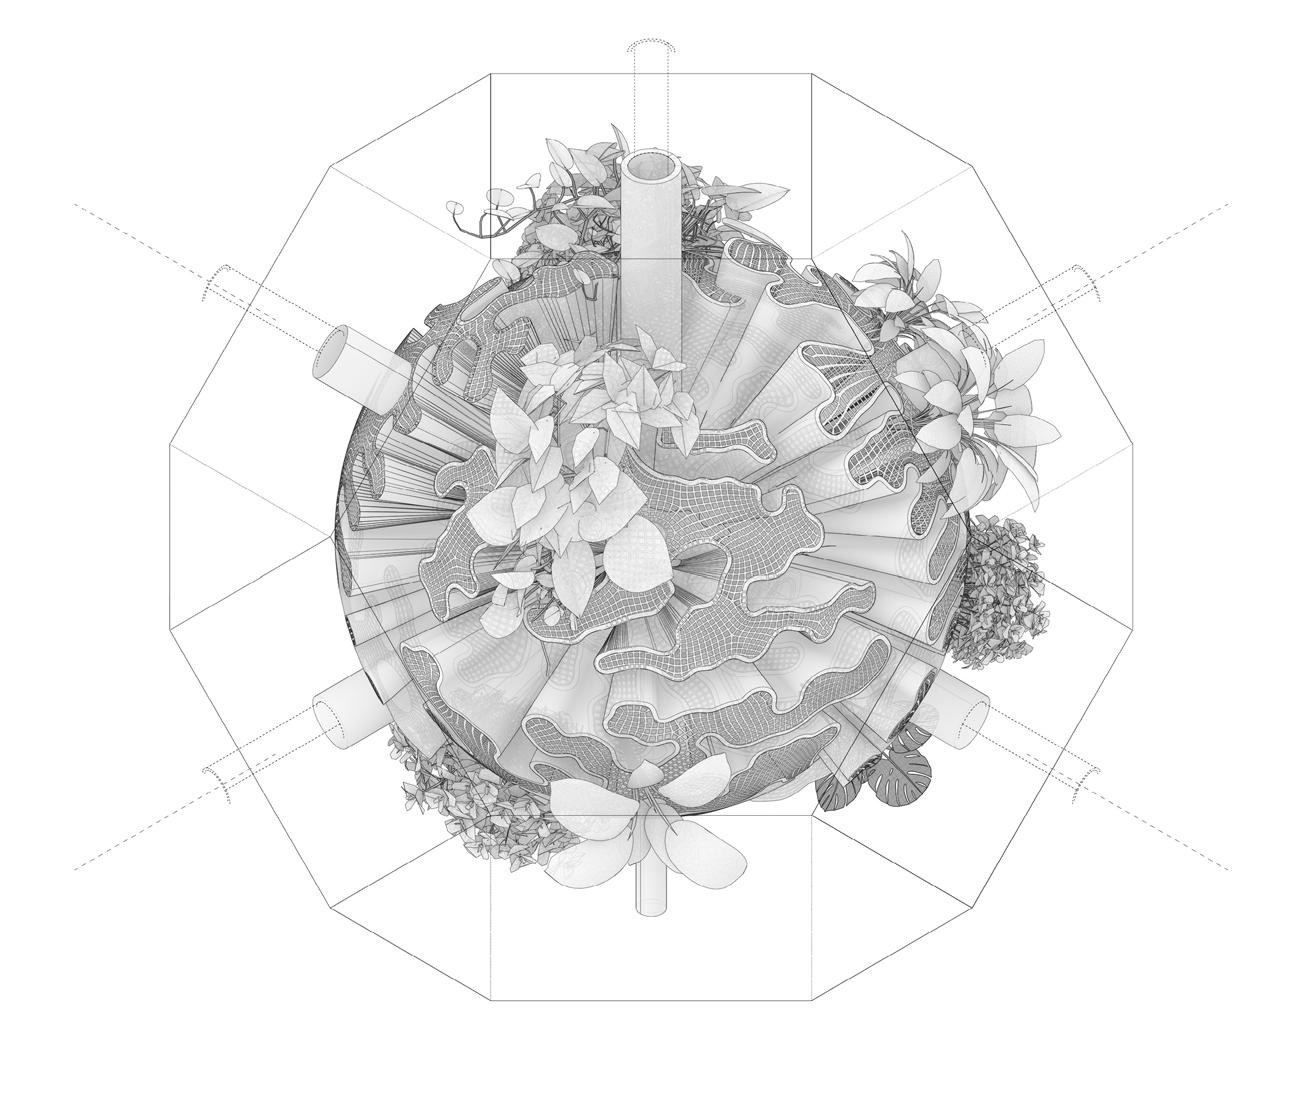
COLLECTION_FILTRATION
The detailing of the module surrounding the milled timber structure needs to prioritise a lightweight assembly given the amount of living tissue, in this case plants to purify and oxygenate, suspended within. Beginning from the central nodal sphere which houses sensors in order to identify solar exposure, milled timber pipe, or arms, extend outward towards the quadrilateral faces of the octahedron. The arms are connected directly to a motor server which provides allowable rotation of the module to respond to solar conditions. Connected additionally to the sensors is a pod for collected rain water and dispensers which pass through the central sphere and out through to distribute the water and humidity directly into the module. Atop the central sphere is a waterproofing layer to protect the inner mechanics of the production protection machinery.
The extruded sawdust layer utilises the layered folds of the differential growth algorithm in order to create the voided pockets for the suspended plants. The plants, which are identified at a localised condition
Fig. 74. Production_Protection module development expected in a 6 - 12 month period
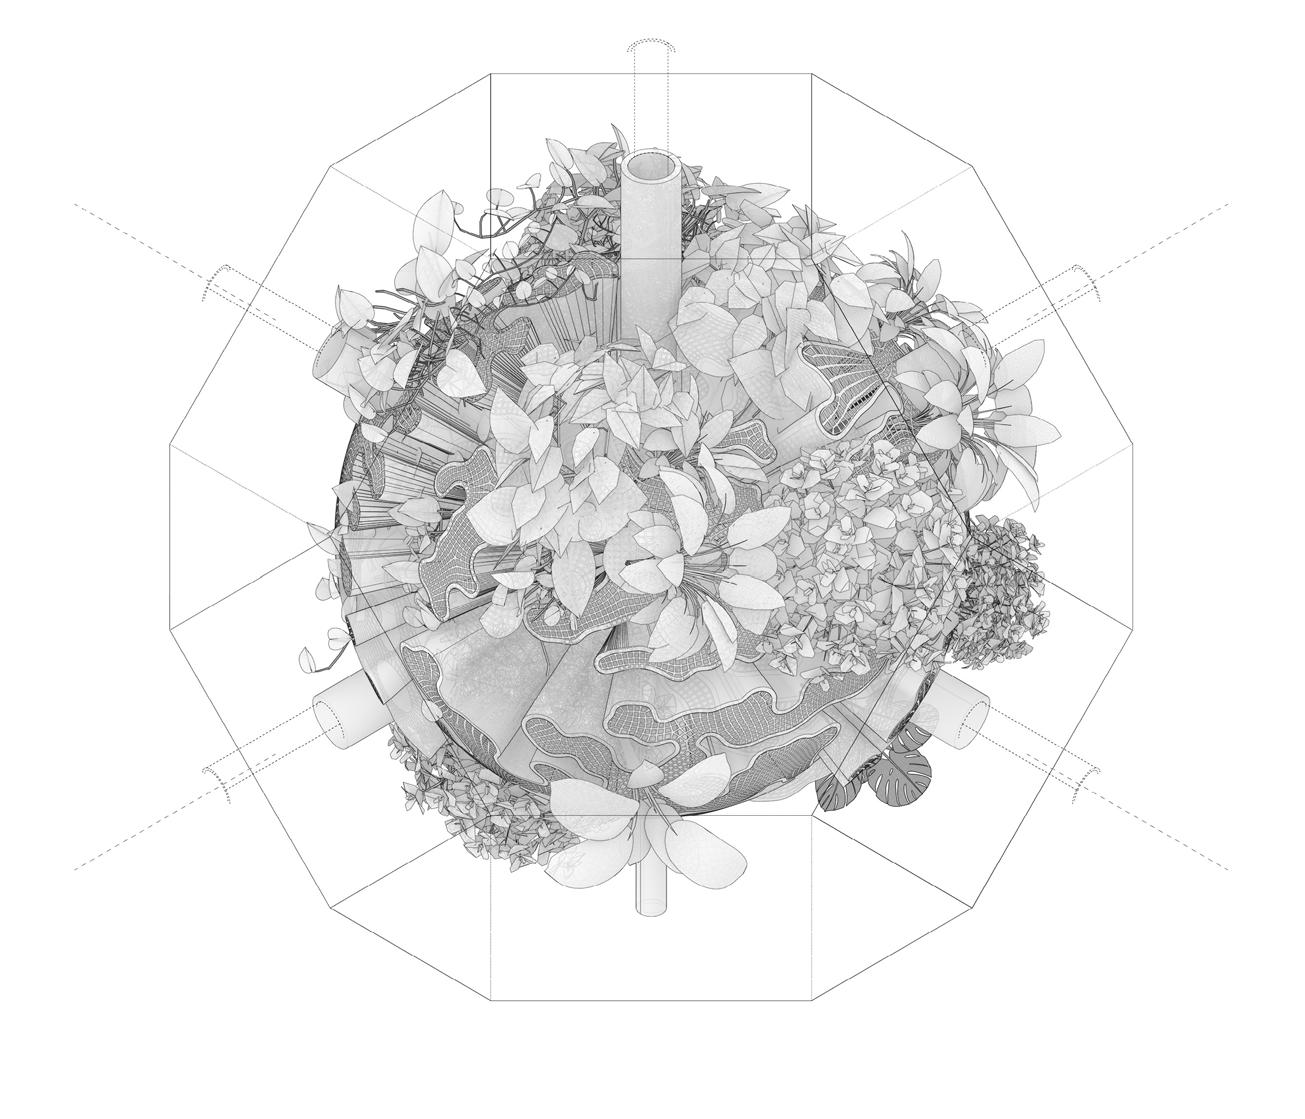
COLLECTION_FILTRATION
(whether the area has a higher requirement for oxygenation, CO2 absorption, or extraction of chemical pollutants) based on the taxonomised plants outlined before. The pockets are lined with a thin fabric substrate to prevent any decay of material to transfer between layers. The cavities of the pockets themselves are filled with lightweight porous clay pebbles which provide a suitable condition for plants to root. Furthermore, to prevent any living tissue from being dislodged from the module due to any rotations which may incur, a woven organic netting is attached and spans the openings of the extruded sawdust. The size of holes of the netting may be varied in order to ensure that the plants selected for the module will not have a stem larger than can fit through the opening. Water can be easily dispersed between the clay pebbles to reach the roots of each plant.
Humidity levels are controlled via sensor to ensure that the module can thrive in the absence of human interaction. The structural capacity of the module will not be exceeded by the weight of plants to
Fig. 75.Production_Protection module development expected in a 12 - 24 month period
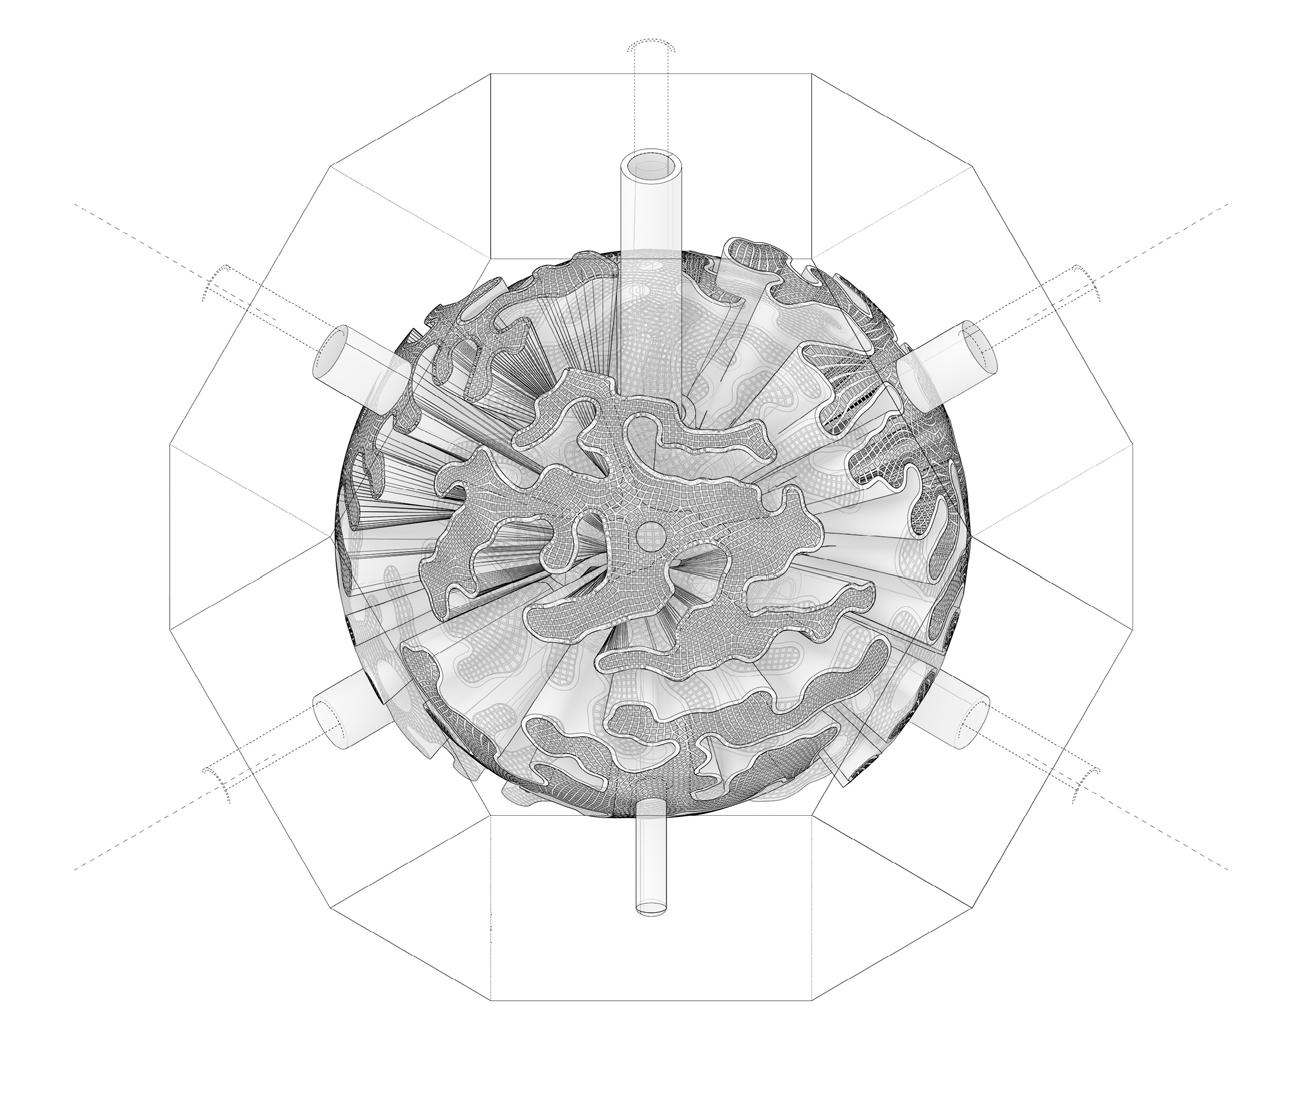
COLLECTION_FILTRATION
complete their annual, perennial, or evergreen life cycles. As a precaution, the mister which attaches via bottom face of the module ensures that the microclimate of the module is consistently monitored and can be utilised to regulate the larger thermo climate of a larger combination of protection production modules in the urban environment during temperature fluxes.
Fig. 76. Production_Protection module structure without plants
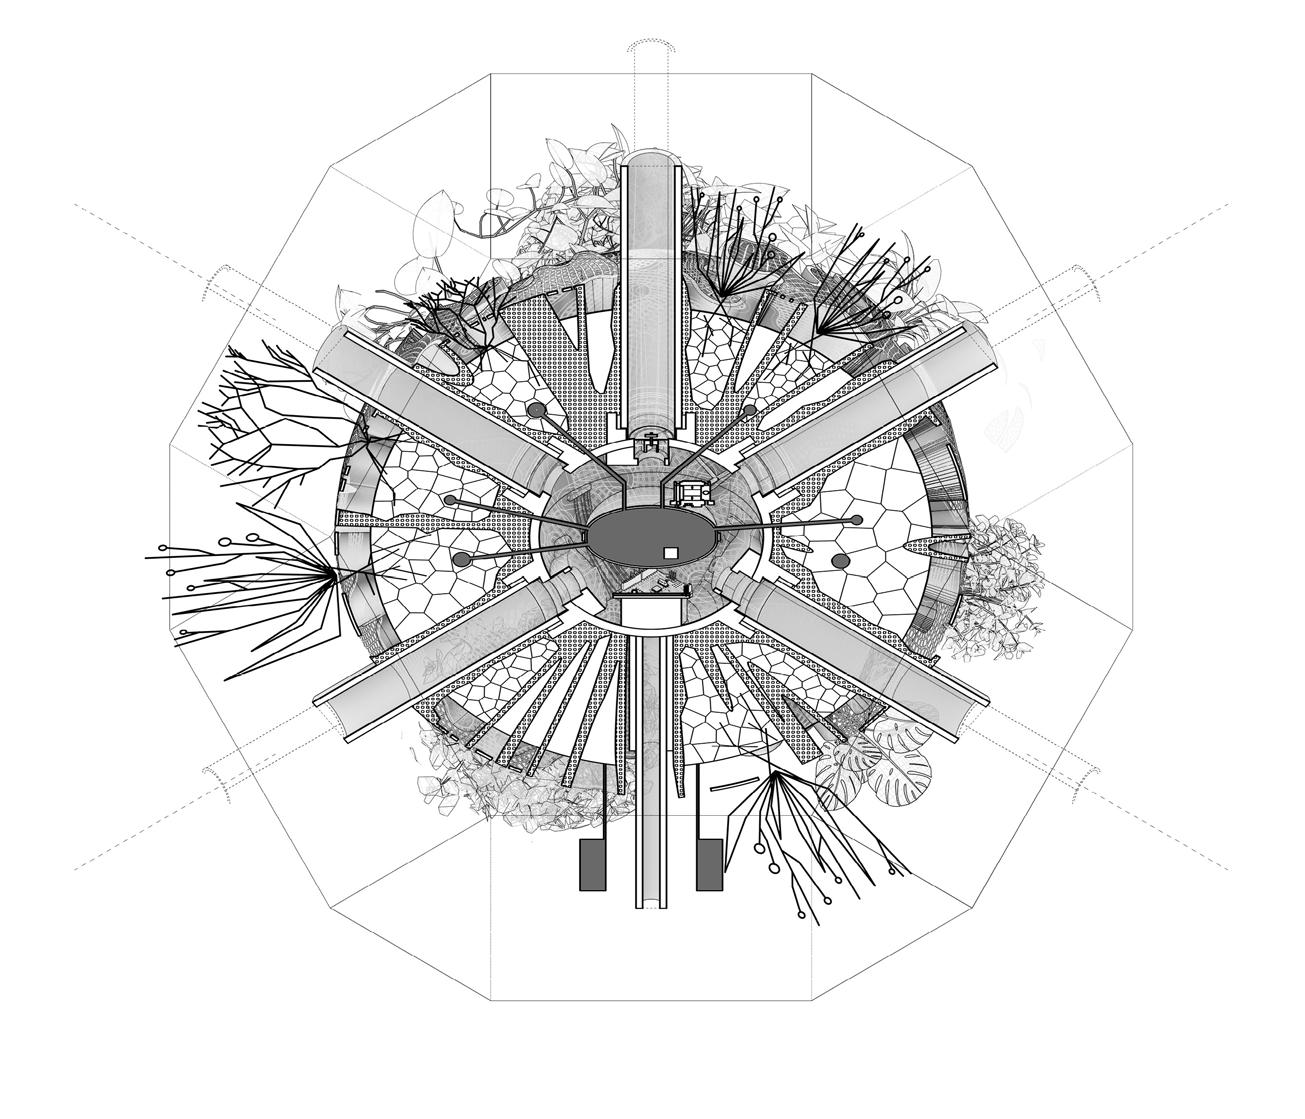
PLANTS TAXONOMY
The quantification of the plant selection can be carefully selected via plant taxonomy Fig. 78. The identification of non-native, neophyte and vernacular plants alongside information on their conservation status can identify the need for implementation. They are assessed according to life cycle: annual, perennial, biennial and evergreen status in order to ensure that the Bio-bot can be landscaped to provide continual oxygenation, shading, and seasonality to constitute the green connective tissue. Furthermore, by identifying a mature scale of growth and spread it is possible to begin grouping flora species that will not compete with each other in the predetermined pocket sizes. Varying species require different exposure to direct versus indirect solar exposure as well as watering cycles. This creates a vertical hierarchy within the component itself, as well as the vertical distribution (solar exposure) in an assembly of production protection modules. Identification of locations where the species can be grown will further determine which species are more beneficial in worst-case versus best-case scenarios for pollution extraction. Additionally, three major groups of species have recategorised according to the logic of the modules:
Fig. 77. Production_Protection module section shows the essential details of the morphology


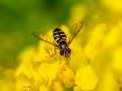


SPECIES PROTECTION | POLLEN COLLECTION

SPECIES PROTECTION | POLLEN COLLECTION
CHEMICAL POLLUTANTS
CHEMICAL POLLUTANTS
3. oxygen production RESPIRATION
3. oxygen production RESPIRATION


HEDERA HELIX
HEDERA HELIX
english ivy
english ivy
SONCHUS
NEPHROLEPIS EXALTATA
CYMBALARIA MURALIS
ECHINACEA PARADOXA
FRAGARIA VESCA wild strawberry echinacea
ECHINACEA PARADOXA toad flax
FRAGARIA VESCA wild strawberry echinacea
CYMBALARIA MURALIS
toad flax
CLINOPODIUM MENTHIFOLIUM
CLINOPODIUM MENTHIFOLIUM
PLEUROCARPOUS
URTICA DIOICA
PLEUROCARPOUS URTICA DIOICA
CLOROPHYTUM COMOSUM spider plant sword fern west sword fern sow thistle stinging nettle
SONCHUS
NEPHROLEPIS EXALTATA
NEPHROLEPIS OBLITERATA
NEPHROLEPIS OBLITERATA
CLOROPHYTUM COMOSUM spider plant sword fern west sword fern sow thistle stinging
EPINEPRUMNUM PINNATUM
EPINEPRUMNUM PINNATUM
pothos
PHILODENDRON S.
PHILODENDRON S.
philodendron


protection, production, filtration. The varying respiratory and oxygenation rates of plants allow for a categorisation into groups of O2 production. The quantities of pollution extraction- particularly chemical toxins suspended in air such as xylene, benzene, formaldehydes and carbon monoxide become a second prioritised group. To address protection of species, various species had been selected which provide
honeybee bumblebee
honeybee bumblebee
CENTAUREA NIGRA
knapweed

sweet coneflower RUDBECKIA SUBTOMENTOSA

ALLIUM SCHOENOPRASUM chives

VERBASCIUM NIGRUM
black mullein
TEURCRIUM CHAMAEDRYS wall germander


SENECIO PALUDOSUS fen ragwort
SILENE FLOS-CUCULI
ragged robin
harebell


BERGENIA CRASSIFOLIA badan

GERMANIUM SANGUINEUM
bloody geranium

HELLEBORUS FOETIDUS
hellebore
LIMONIUM LATIFOLIUM
sea lavender


LEUCANTHEMUM VULGARE daisy
DIGITALIS PURPUREA foxglove


Fig. 78. Taxonomy of non-native, neophyte and vernacular plant categorised by root structure, biological requirements, rate and scale of mature growth, life cycle, suitability for developed land locations
suitable habitat and nutrition for solitary, honey and bumblebees, wasps, hoverflies, butterflied, beetles, moths and other insects in order to increase pollination and, as a result, increase the possibility that after several seasons it will be possible to regenerate the flora by providing suitable habitat.
CAMPANULA ROTUNDIFOLIA
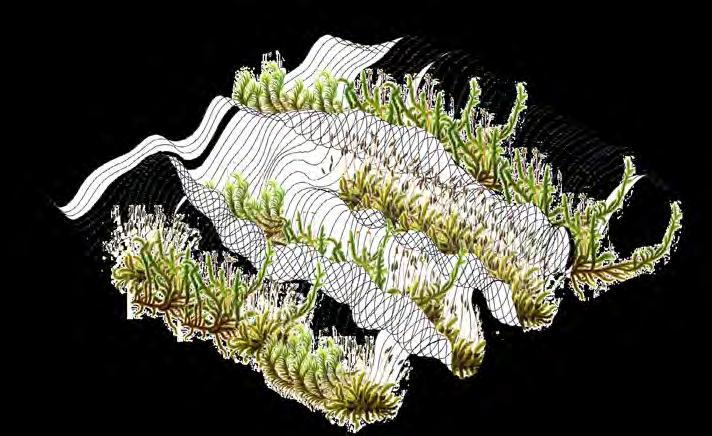
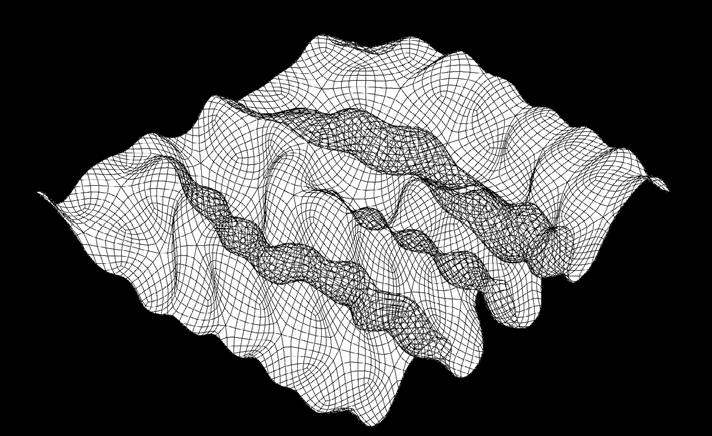
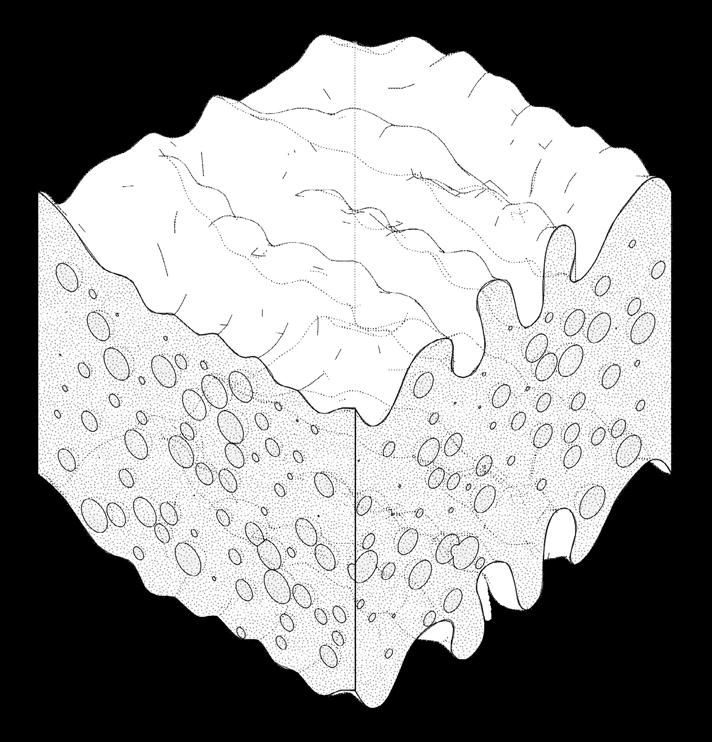
LIVING TISSUE DIFFERENTIAL GROTH
The differential growth most closely resembles the biological growth of the living tissue. This becomes the design impetus for incorporating bio-bot modules. (Fig..79) Therefore, the position, depth, and distribution of growth patterns within the system can be optimised with the use of computer modelling of the differential growth models. For this reason, Kangaroo physics plugin and Anemone plugin for Grasshopper were employed as an engine for Differential growth simulation. The rationalisation of the simulation was conducted separately from the optimisation process in order to decrease time for computation. The computational logic is based on the point collisions, therefore, the size of the grid or mesh, collision radius and number of iteration all have a direct impact on the growth algorithm and its results which produced 21 individuals that were measured towards sun exposure, volume and surface growth. Furthermore, Each bio-bot module face has not only a specific function, but a specific methodology of connecting to other modules in order to function as a unified system.
Fig. 79. The exploded diagram of layers of the differential growth living tissue structure
Volume
Surface
Sun exposure
Shadow area
[fo] - from original surface

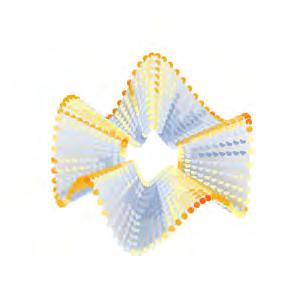
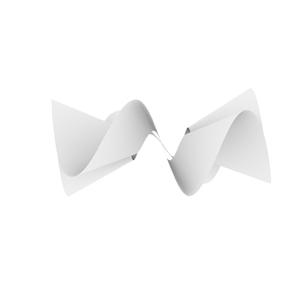
Collision radius
Number of iterations
Size of the grid
Volume growth [fo]
Surface growth [fo]
Sun exposure
Shadow area
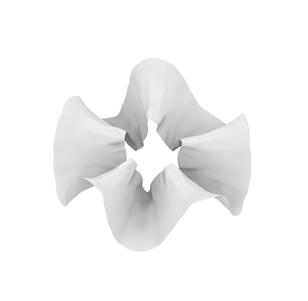
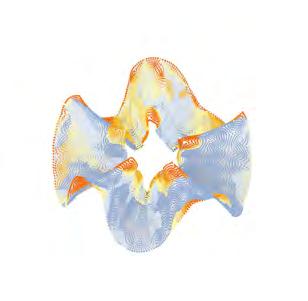
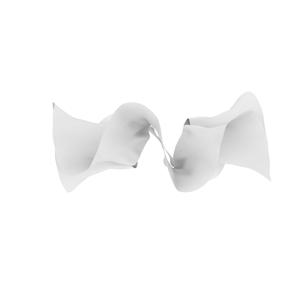
Collision radius
Number of iterations
Size of the grid
Volume growth [fo]
Surface growth [fo]
Sun exposure
Shadow area
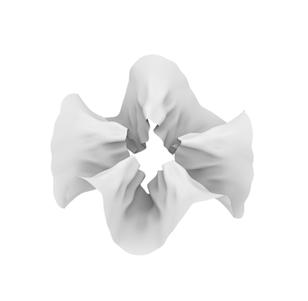
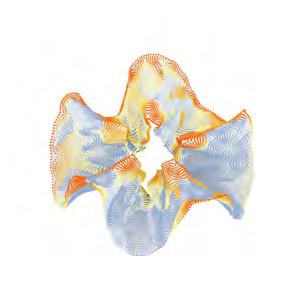
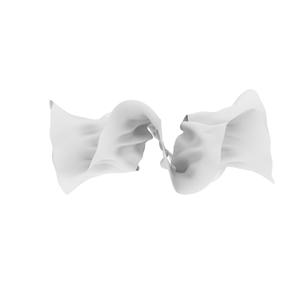
Collision radius
Number of iterations
Size of the grid
Volume growth [fo]
Surface growth [fo]
Sun exposure
Shadow area
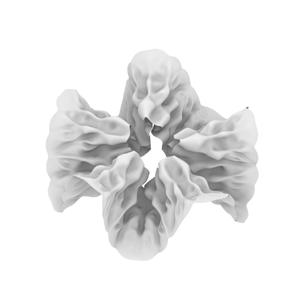
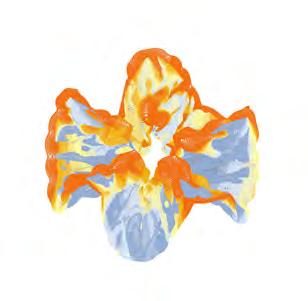
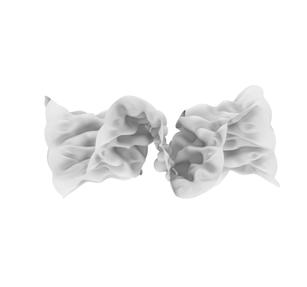
Collision radius
Number of iterations
Size of the grid
Volume growth [fo]
Surface growth [fo]
Sun exposure
Shadow area
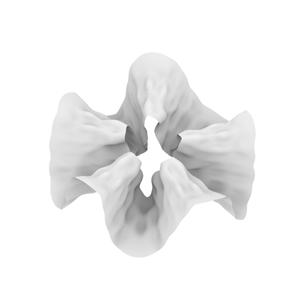
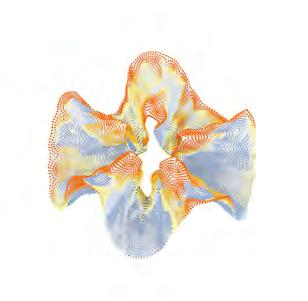
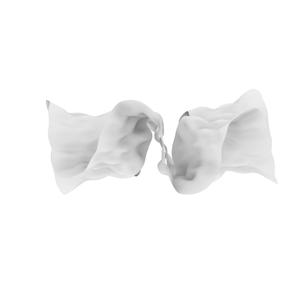
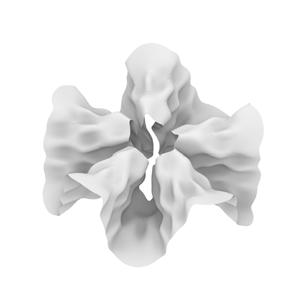
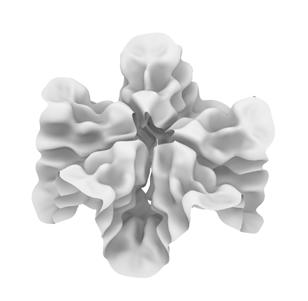
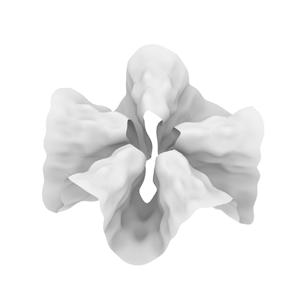
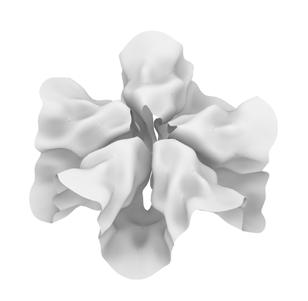
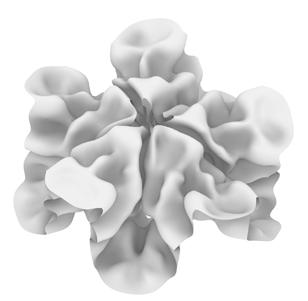

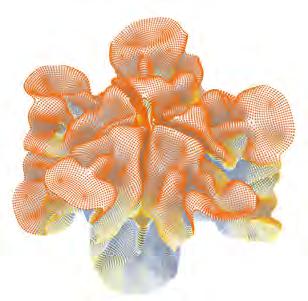
Collision radius
Number of iterations
Size of the grid
Volume growth [fo]
Surface growth [fo]
Sun exposure
Shadow area
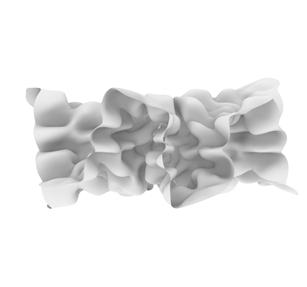
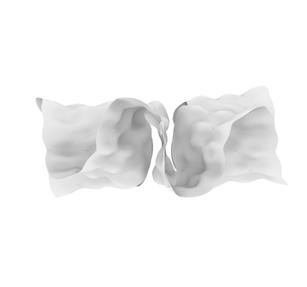
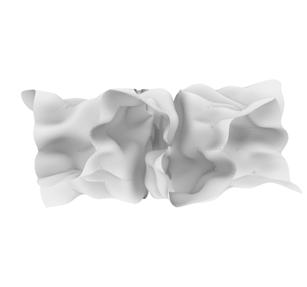
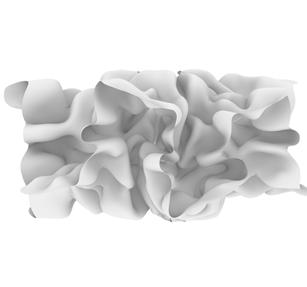
Collision radius
Number of iterations
Size of the grid
Volume growth [fo]
Surface growth [fo]
Sun exposure
Shadow area
7
Collision radius
Number of iterations
Size of the grid
Volume growth [fo]
Surface growth [fo]
Sun exposure
Shadow area
Collision radius
Number of iterations
Size of the grid
Volume growth [fo]
Surface growth [fo]
Sun exposure
Shadow area
Collision radius
Number of iterations
Size of the grid
Volume growth [fo]
Surface growth [fo]
area
Volume
Surface
Sun exposure
Shadow area
[fo] - from original surface
Collision radius
Number of iterations
Size of the grid
Volume growth [fo]
Surface growth [fo]
Sun exposure
Shadow area
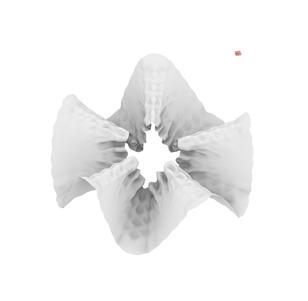
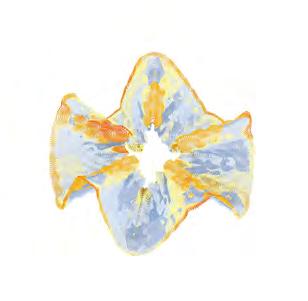
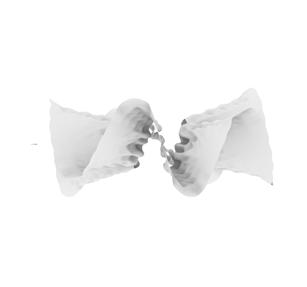
Collision radius
Number of iterations
Size of the grid
Volume growth [fo]
Surface growth [fo]
Sun exposure
Shadow area
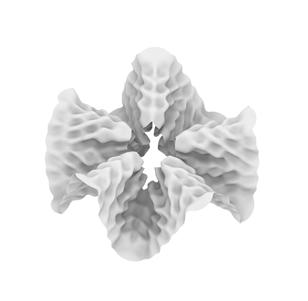
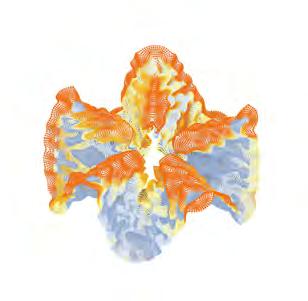
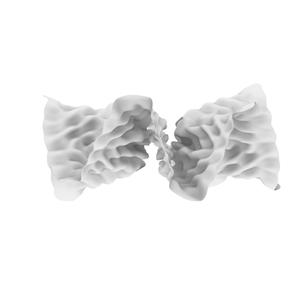
Collision radius
Number of iterations
Size of the grid
Volume growth [fo]
Surface growth [fo]
Sun exposure
Shadow area
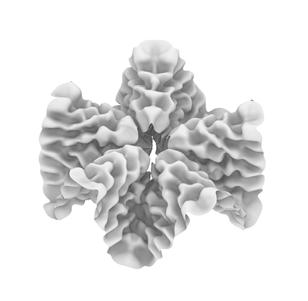
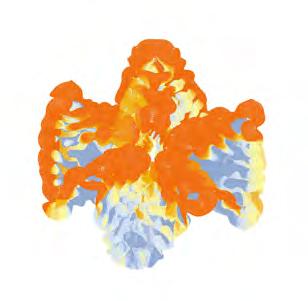
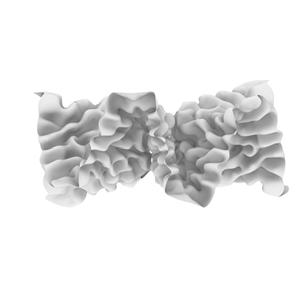
Collision radius
Number of iterations
Size of the grid
Volume growth [fo]
Surface growth [fo]
Sun exposure
Shadow area
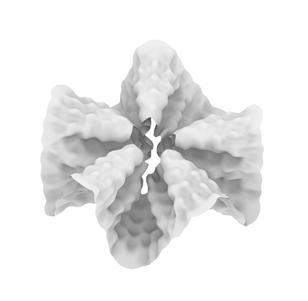
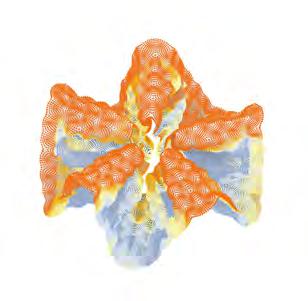
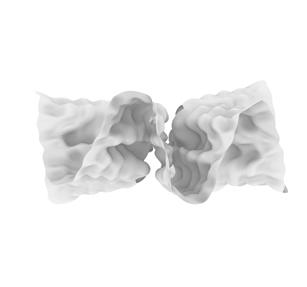
TYPE 10
TYPE 11
TYPE 12
TYPE 13
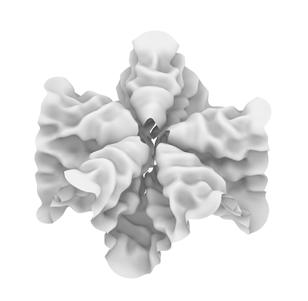
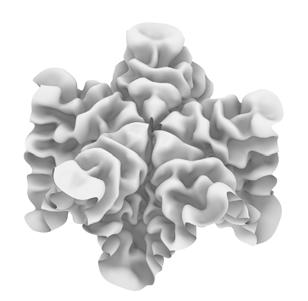
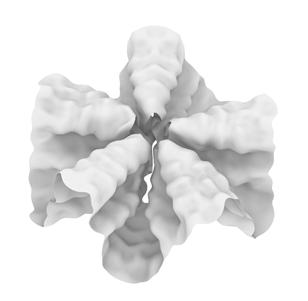
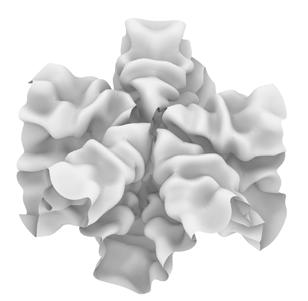
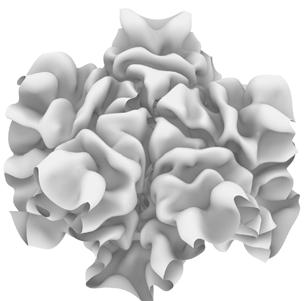
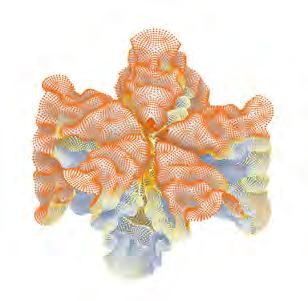
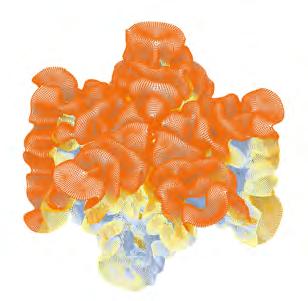
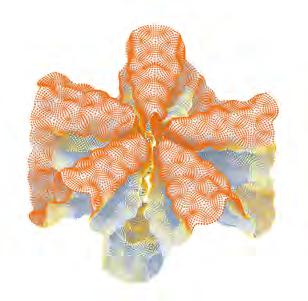
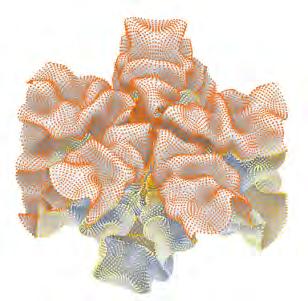
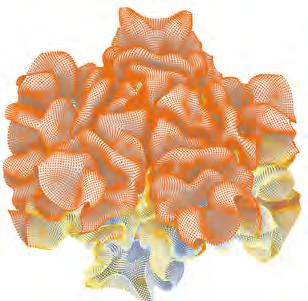
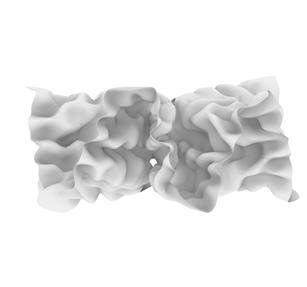
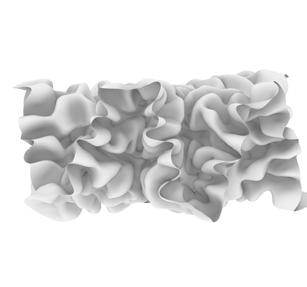
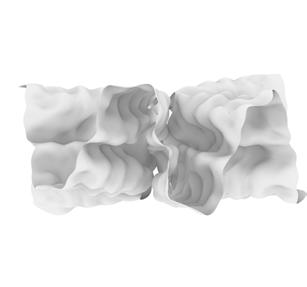
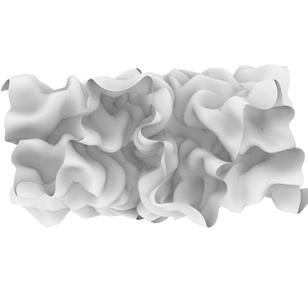
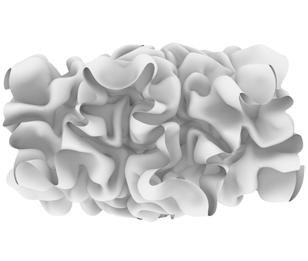
Collision radius
Number of iterations
Size of the grid
Volume growth [fo]
Surface growth [fo]
Sun exposure
Shadow area
15
Collision radius
Number of iterations
Size of the grid
Volume growth [fo]
Surface growth [fo]
Sun exposure
Shadow area
Collision radius
Number of iterations
Size of the grid
Volume growth [fo]
Surface growth [fo]
Sun exposure
Shadow area
Collision radius
Number of iterations
Size of the grid
Volume growth [fo]
Surface growth [fo]
Sun exposure
Shadow area
Collision radius
Number of iterations
Size of the grid
Volume growth [fo]
Surface growth [fo]
area
Volume
Surface
Sun exposure
Shadow area
[fo] - from original sur-
face
Collision radius
Number of iterations
Size of the grid
Volume growth [fo]
Surface growth [fo]
Sun exposure
Shadow area
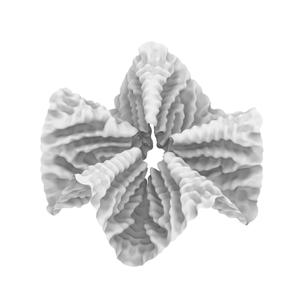
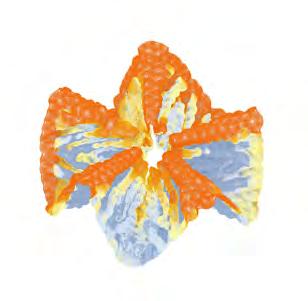
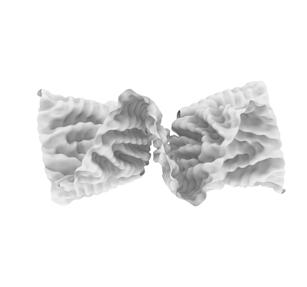
Collision radius
Number of iterations
Size of the grid
Volume growth [fo]
Surface growth [fo]
Sun exposure
Shadow area
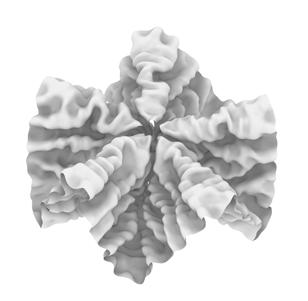
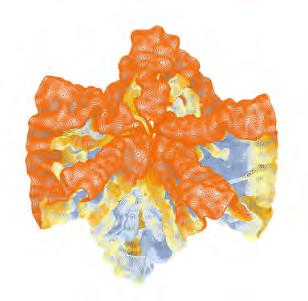
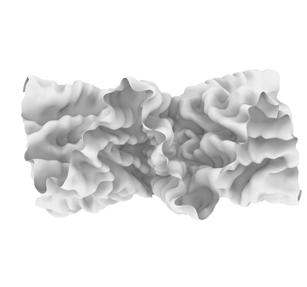
Collision radius
Number of iterations
Size of the grid
Volume growth [fo]
Surface growth [fo]
Sun exposure
Shadow area
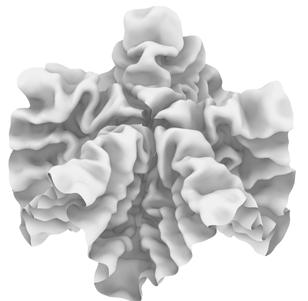
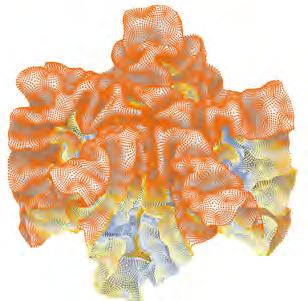
The differential growth living tissue structure was optimised by calculating the difference in volume and surface growth to the original structure. Moreover the ratio between shaded and exposed to sun surfaces. The simulation helped reveal the best-performing values implemented into the development of the morphologies. The parameters of sample 19 were considered best performing, as the sample has the highest shadow area, considering relatively low parameters of surface and volume growth. Therefore these values were implemented in the further development stages.
TYPE 19
TYPE 20
TYPE 21
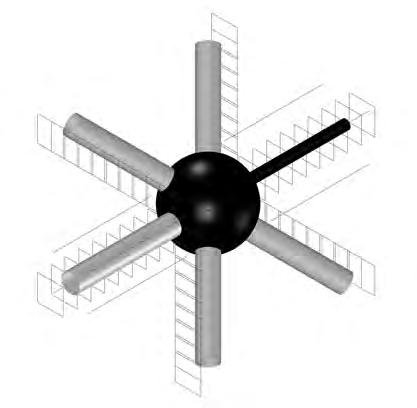
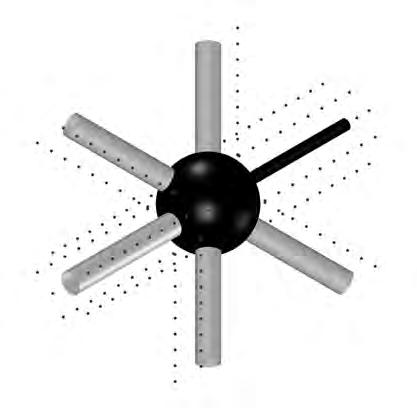
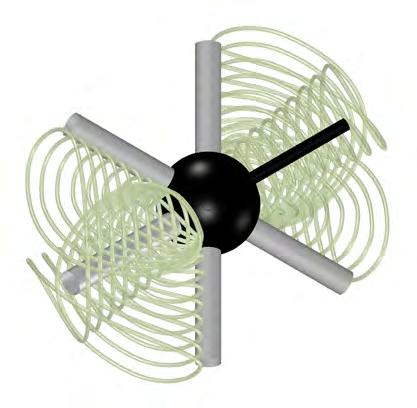
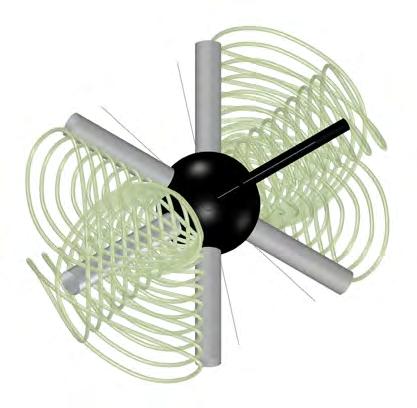
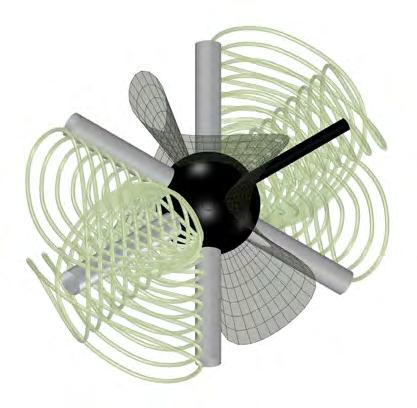
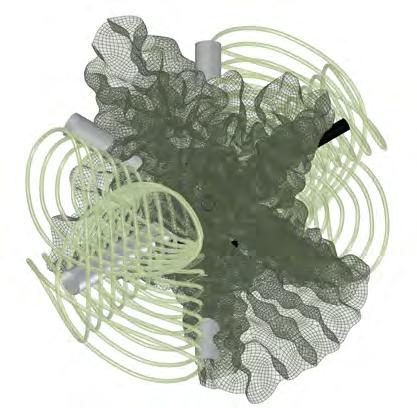
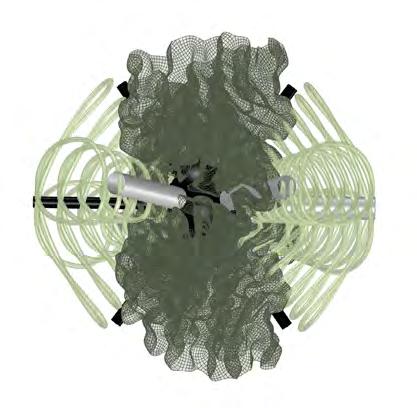
The final morphological organisation of the Filtration_Production module
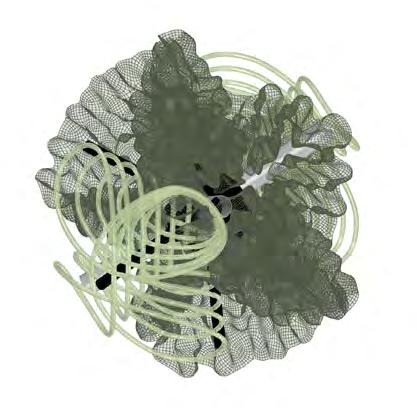
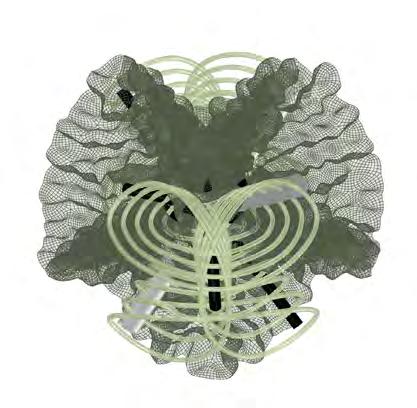
1. Creation of rectangles along structure pipes
3. Generation of Polyline through these points. Multipipe
5. Creation of a surface through generated lines
6. Differential growth of the surface structure
2. Extraction of needed points and their re-eragement in data list
4. Generation of base lines for Living tissue structure surface
GOAL GENERATE A MORPHOLOGICAL VARIATION OF THE COMPONENT IN CONSIDERATION FOR THE LOCAL ENVIRONMENTAL CONDITIONS
OBJECTIVESOPTIMISE THE MORPHOLOGY OF THE PRODUCTION_PROTECTION FUNCTION
FITNESS CRITERIA
FITNESS CRITERIA 1; RATIO | MAXIMISE VOLUME | MINIMISE SURFACE
FITNESS CRITERIA 2; MAXIMISE SHADOW ON THE LIVING TISSUE STRUCTURE
FITNESS CRITERIA 3; MAXIMISE SUN EXPOSURE FOR ALGAE STRUCTURE
PHENOTYPEGENERATED USING DIFFERENTIAL GROWTH ALGORITHM
GENEPOOL POSITION,OF POINT TO GENERATE POLYLINES FOR GROWTH, NUMBER OF POLYLINES, EXTRUSION DEPTH
The Filtration_Production module addresses the problem of air pollution and temperature providing infrastructure for algae and moss as a living tissue.
COMPUTATIONAL LOGIC
The experiment’s goal is to create a population of morphologies that optimise toward the following goals: optimise the morphologies to support algae and living tissue - in this case moss performance. For this goal, the following fitness criteria were established: fitness criteria 1 (FC1)– maximises the volume of pipes for algae, minimises their length; fitness criteria 2 (FC2)– maximises sun exposure for algae; fitness criteria 3 (FC3)– maximises the shadow occlusion on the moss surface. The optimisation of surface differential growth that provides valleys for moss distribution was conducted separately, due to the limitation of the computational capacity. Each of these objectives relates to the morphological changes used to construct the form of the filtration_production module morphology; these transformations are known as the “genetic code” (or genome).
The following morphological alterations are addressed by the number of genes or genome: the baselines for pipe attachment are divided into points, where the number of points and distance between them can vary (Fig..80). Generated points are considered as a base for rectangle aggregation, where the size of these geometries are selected from a gene pool individually. The offset size for the base surface for differential growth simulation is implemented as a gene influencing the self-shading capacity of the structure. The final step is the generation of pipe for created polylines - guides, where the diameter of the extrusion is a gene.
Fig.80 . Computational logic of the Filtration_Production module
EVOLUTIONARY OPTIMISATION
Fitness criteria 1 (FC1) was measured as a ratio between the volume of algal tubes and their length. The intention was to increase the volume while decreasing the length of the pipes for material economy. The FC2 was measured as the number of points that are not exposed to direct sunlight, trying to increase the number of points located in shadow. In this simulation, as only the primitive geometry was part of the optimisation, the differential growth of the second order was optimised separately. Therefore, by knowing the exact values for growth changes of the surface and volume of the living tissue structure, the optimisation occurred only in primitive geometry. Finally, the FC3 intention was to increase the number of points exposed to direct sunlight located on the algal pipes’ surface. This step was necessary for algae’s high-performance rate.
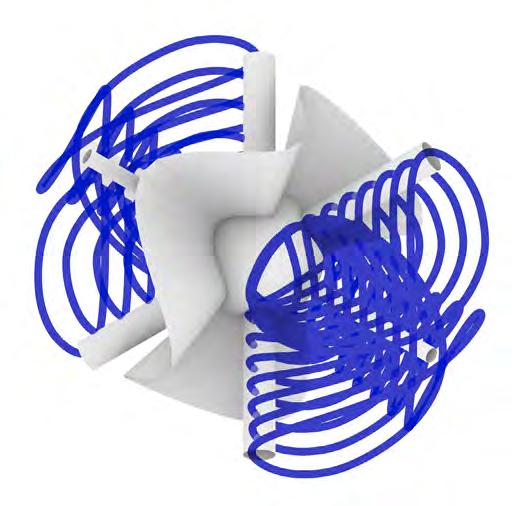
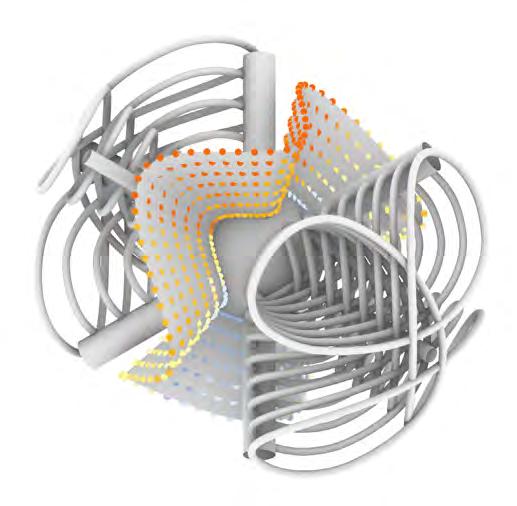
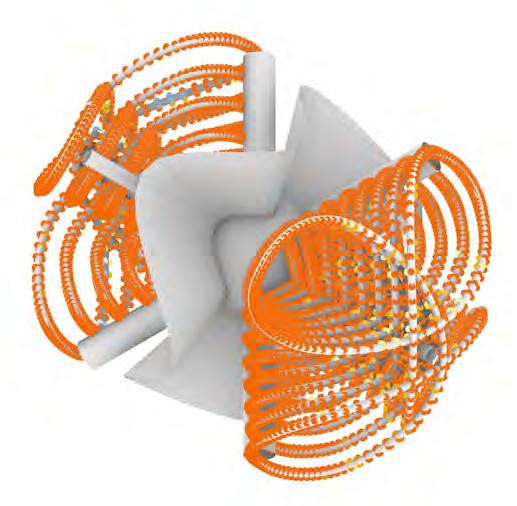
Fitness
Fitness criteria 2; Maximise shadow on the living tissue structure
Fitness criteria 3; Maximise sun exposure for algae structure
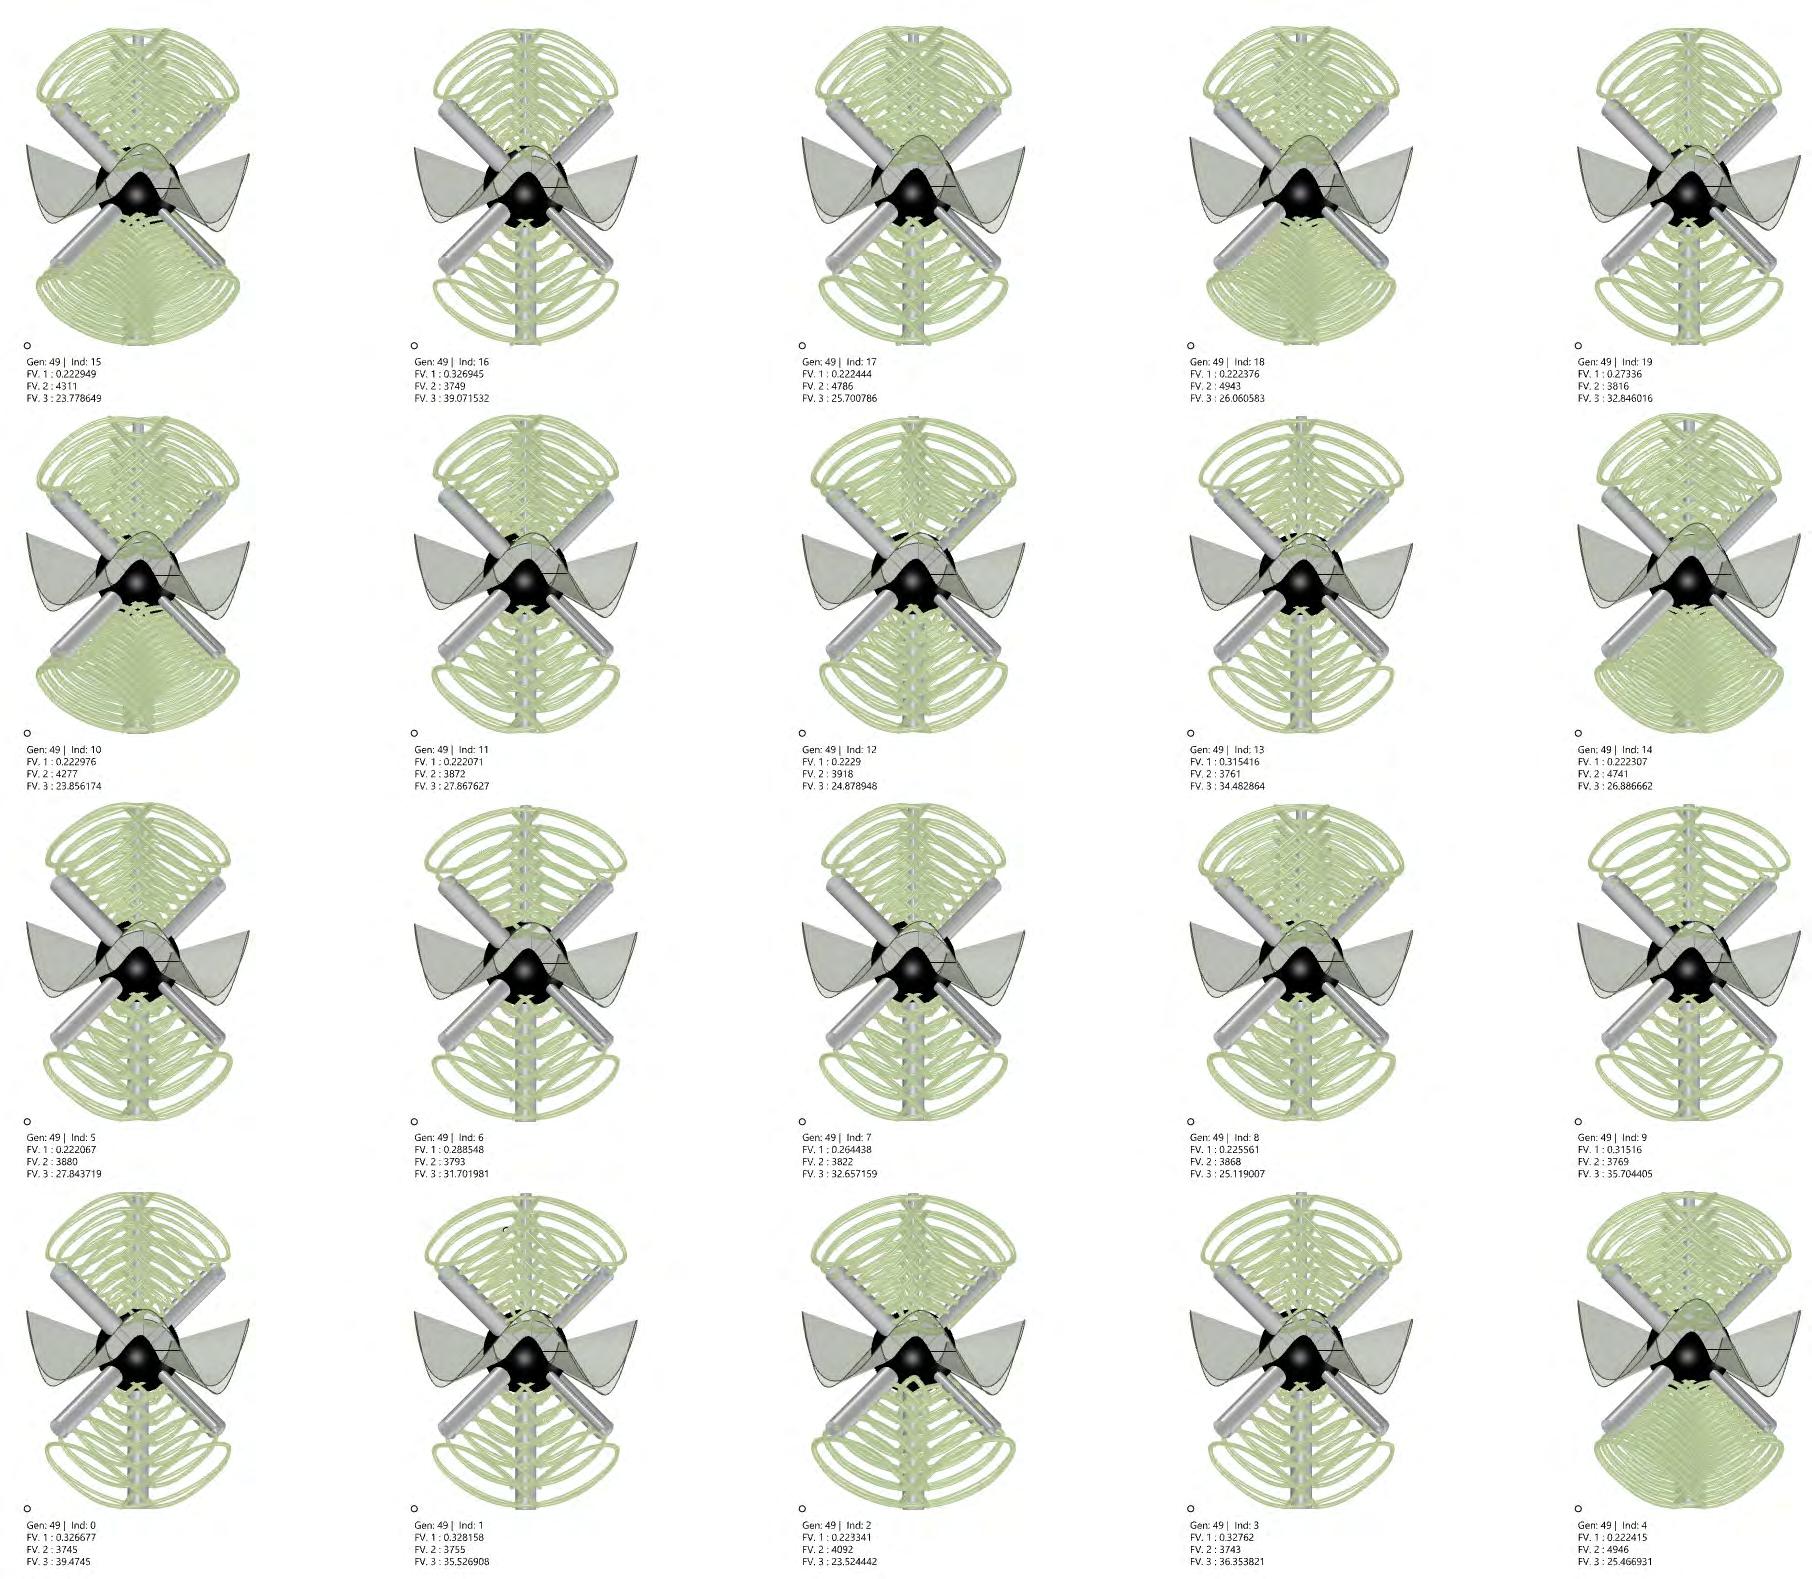
EVOLUTIONARY OPTIMISATION
The result of the algorithm produced 1000 phenotype solutions with three fitness values per solution, totalling 3000 values. Although the simulation performed effectively towards the optimisation of the solutions, it produced a significant number of variations in all three fitness criteria in conflicting relationships. From the Pareto Front solutions (Fig..81), it can be observed that the simulation produced a limited variety of phenotypes due to its small-scale optimisation. The high level of visual geometrical variation was not observed due to the low number of genes informing the morphological alterations. However, the simulation established important relationships between gene values which were developed in later stages of morphological organisation.
Fig. 81. This figure illustrates the selected pool of individuals, particularly Pareto Front solutions.
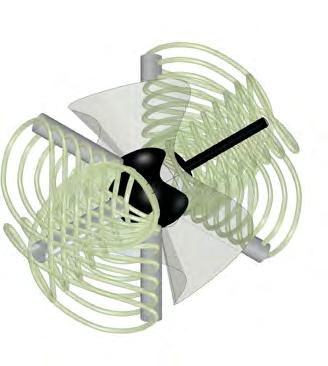
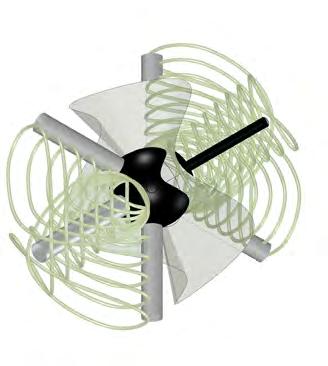
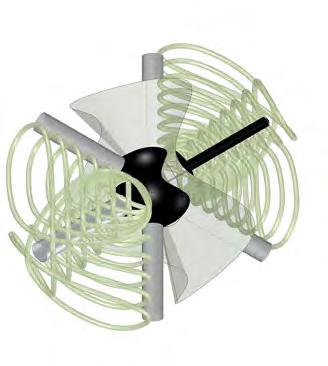
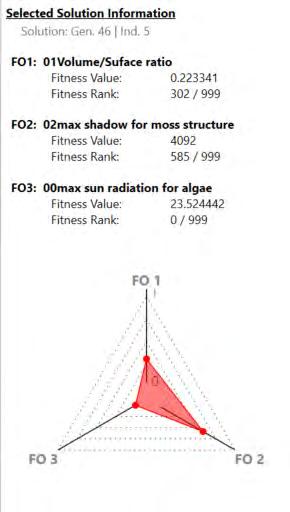
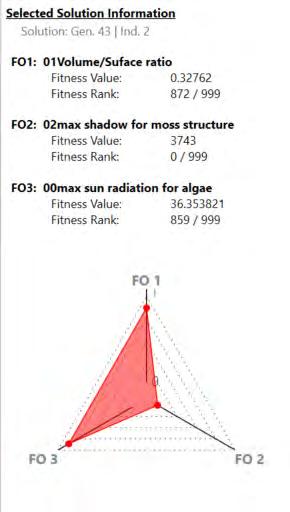
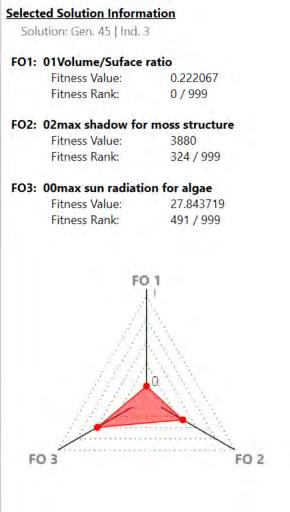
EVOLUTIONARY OPTIMISATION
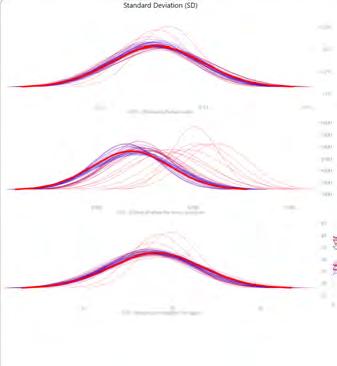
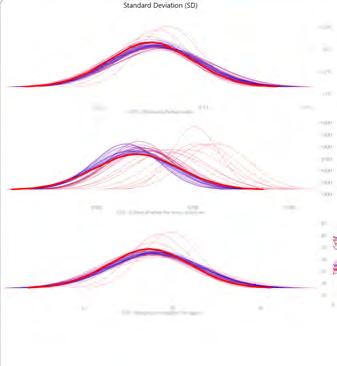
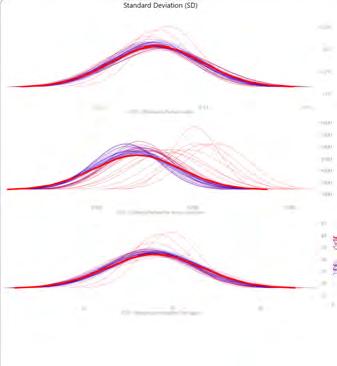
FITNESS CRITERIA 1
Fitness criteria 1 (FC1)- the most optimised phenotype evolved from generation 46 individual 5 (G46I5).
The criteria was formulated as a ratio between volume and the length of the algae pipes. The simulation produced 24 phenotypes with rank 0 for FC1.
Fitness criteria 2 (FC2)- the most optimised phenotype evolved from generation 43 individual 2 (G43I2).
The criteria was set to maximise the number of points located in shadowed area without direct sunlight. The simulation produced 29 phenotypes with the rank of 0 for FC2.
Fitness criteria 3 (FC3)- the most optimised phenotype evolved from generation 45 individual 3 (G45I3 )
The criteria was set as a parameter that should evolve towards the maximisation of sun exposure on the surface of algae pipes. The simulation produced 23 phenotypes with rank 0 for FC3. The post analysis shows that individuals with a higher performance of in FC3 have a high density of pipes on one of the sides, which should be considered during the module placement in the environment to direct higher density to direct sun.
FITNESS CRITERIA 2
FITNESS CRITERIA 3
Fig. 82. Best individuals for 3 Fitness Criteria. The graphs plot all three fitness objectives. The red dots and curves show the selected solution in the entire simulation. It shows how successfully or unsuccessfully simulation optimised this solution for the three fitness objectives.
Fig.83. The average solution for all fitness criteria with a rank of zero . The red dots and curves show the selected solution in the entire simulation. It shows how successfully or unsuccessfully simulation optimised this solution for the three fitness objectives.
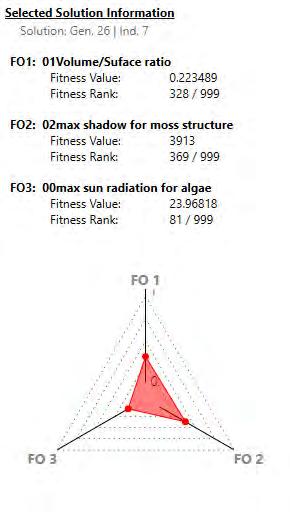
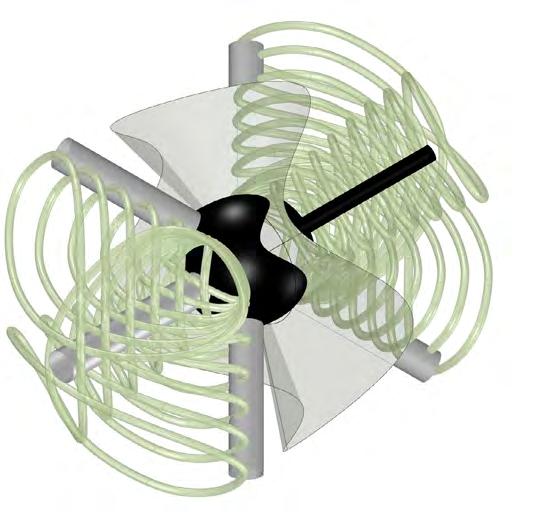
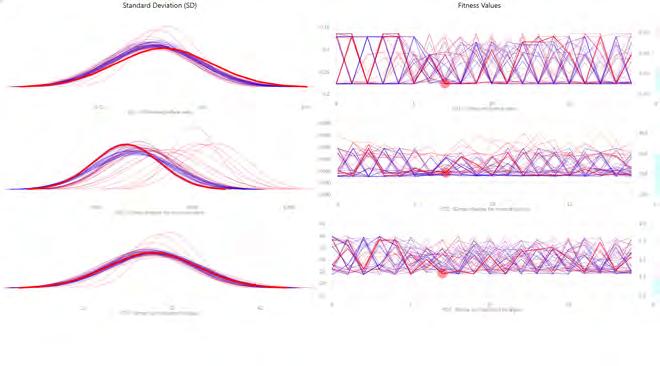
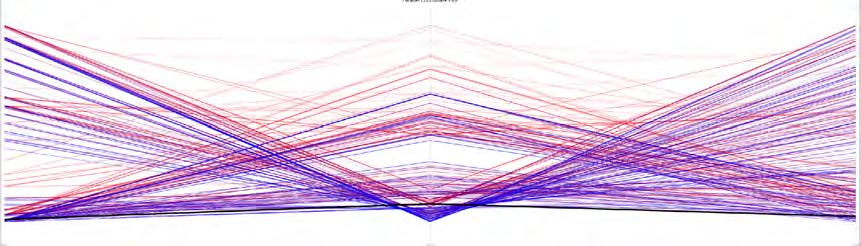
EVOLUTIONARY OPTIMISATION
The average solution for all fitness criterias with a rank of zero was chosen as generation 26 individual 7 (G26I7) (Fig..83). The phenotype occurred in an early stage of the simulation. This individual has a high difference in densities of algae pipes on both sides depicted in the Fig XX for FC3, due to the directionality of the sun, which should be considered in the later stages of implementation. This individual has a lower optimisation rate in FC2, however, the shadow requirement will be achieved in later stages after the implementation of the differential growth optimisation values. Moreover, the phenotype has a high optimisation rate in FC1 values, producing higher surface areas of algae pipes. The visual comparison of the morphology shows that the pipes have different radii values on both sides, which can potentially be a problem in the production stage, as joints, fasteners and maintenance should consider these differences. Individual 7 from generation 26 was chosen for further development of the Filtration_Production module.
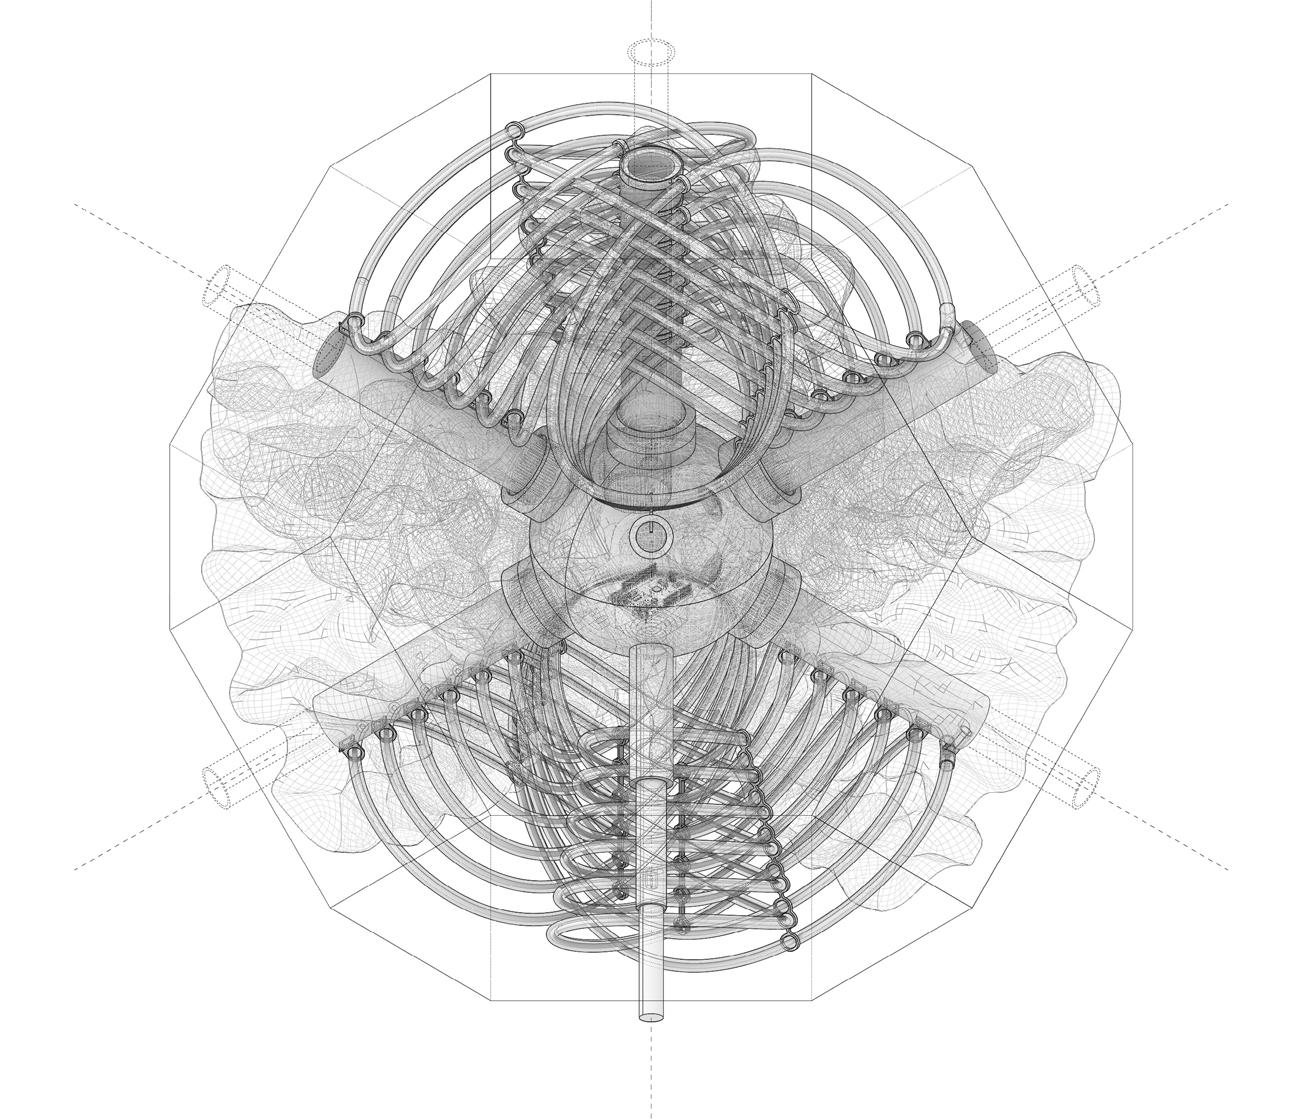
COLLECTION_FILTRATION
The filtration production module is similarly organised around the central sphere which houses the sensors, motors and hardware in order to avoid exposing it to the outside elements. The module is structured to maximise the surface area of both the algal pipes which need exposure to sunlight for photosynthesis as well as the moss which is grown in the valleys of the corrugated sawdust morphology. This module has both a pod for the collection of the algae biomass as well as a pump to constantly circulate the algal fluid within the pipes. The pipes are fixed to one another using clips to ensure their position when rotation occurs to self-regulate consistent shadowing for the living tissue which in this case is moss grown on sawdust morphology. The moss has access to the water pump via the collection module attachment to ensure even and consistent distribution. The CO2 sensor ensures that algae is harvested at optimal condition. The connection between one filtration production module to another allows for a
Fig. 84. Filtration_Production module structure
85. Filtration_Production module section shows the essential details of the morphology
STRUCTURE
COLLECTION PUMP
LIVING MOSS
CO2 SENSOR
O2 CIRCULATION
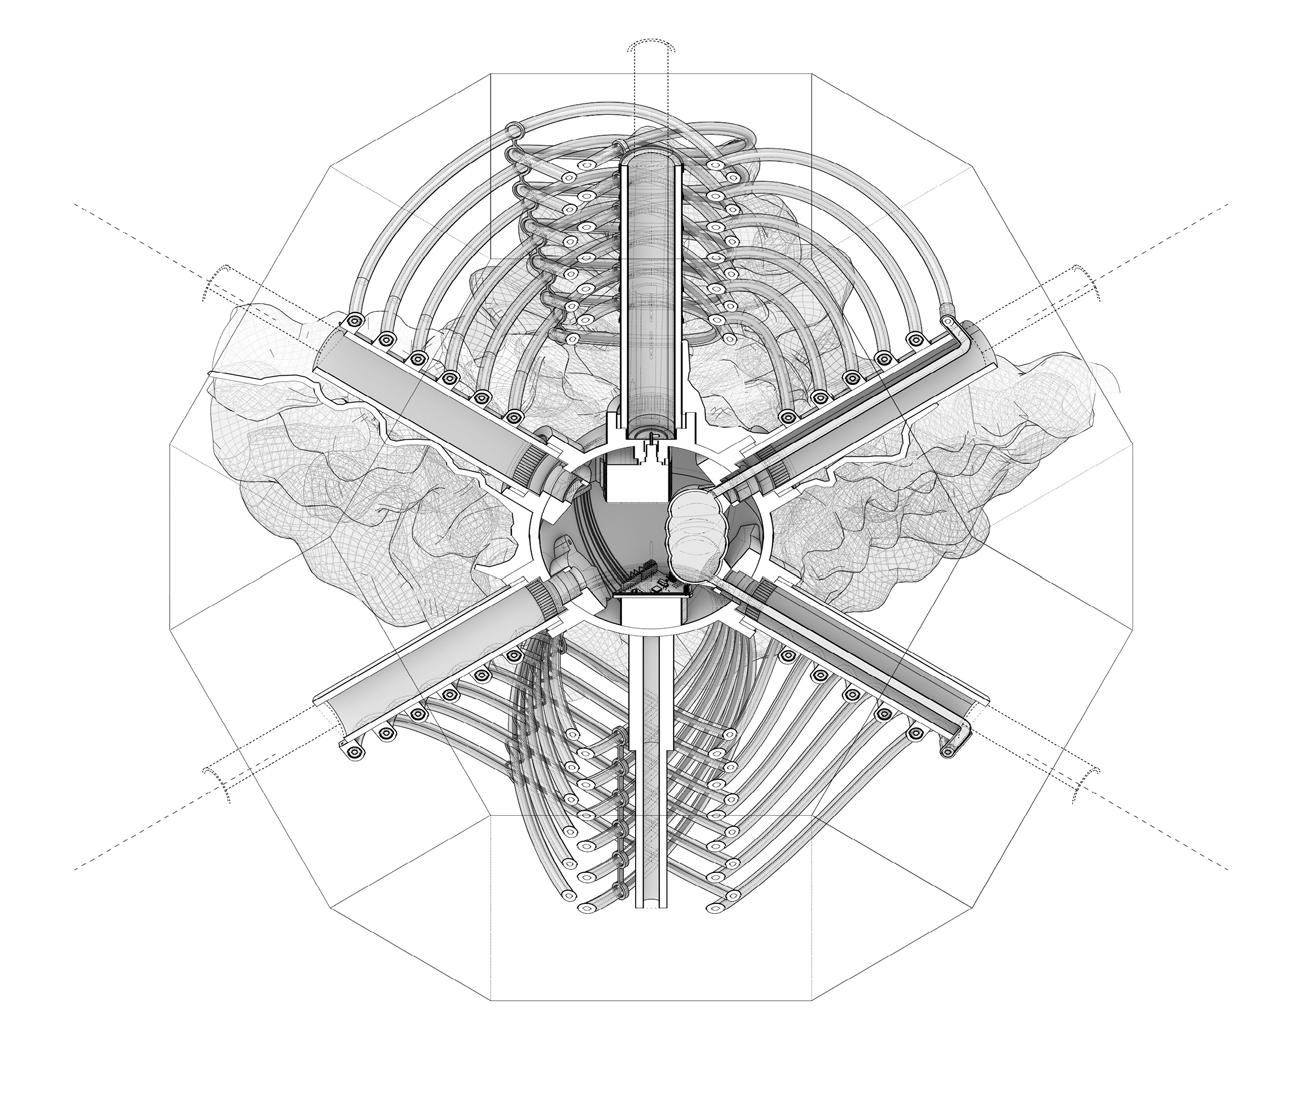
COLLECTION_FILTRATION
network connection between the collection pods between modules which allow them to be re-drained or filled simultaneously. In this way, maximum volume of algae gel can be stored and circulated between the same filtration production components or en masse to facilitate human intervention or care-taking of the bio-bot.
Fig.
ALGAE PIPES
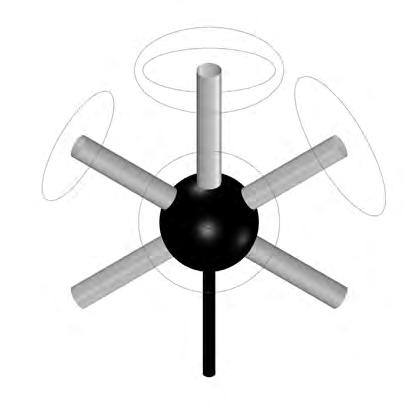
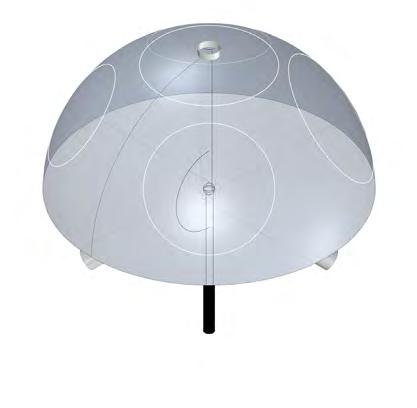
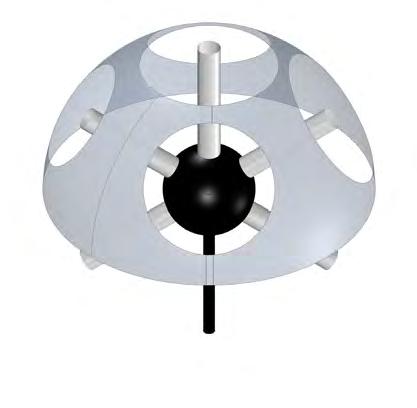
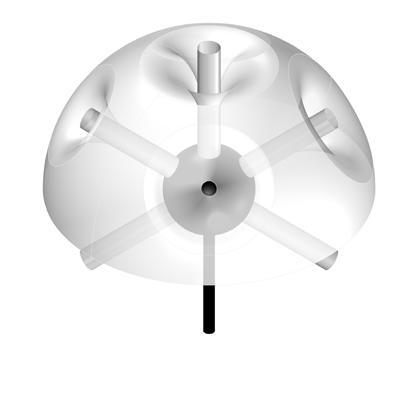
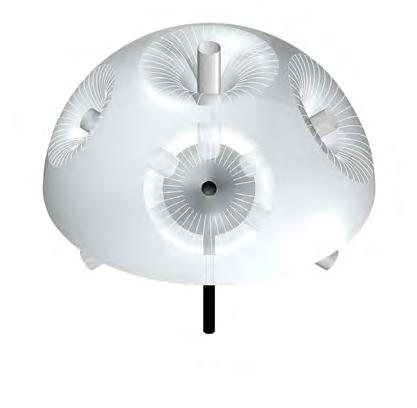
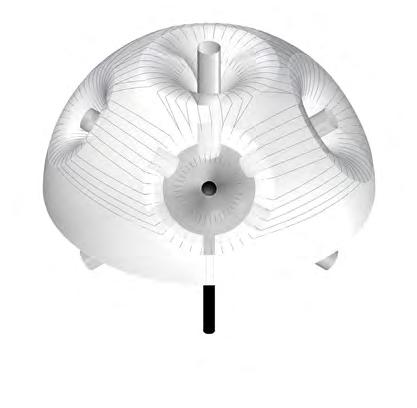
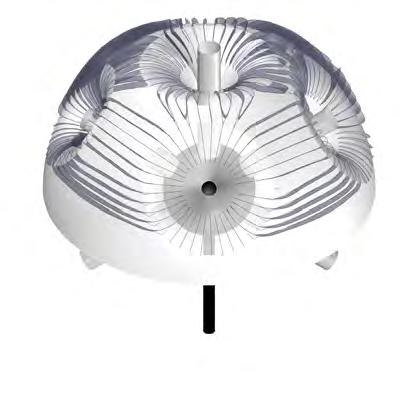
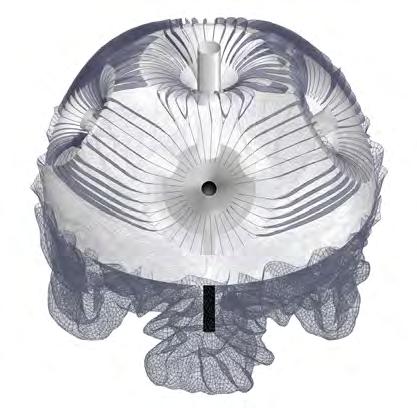
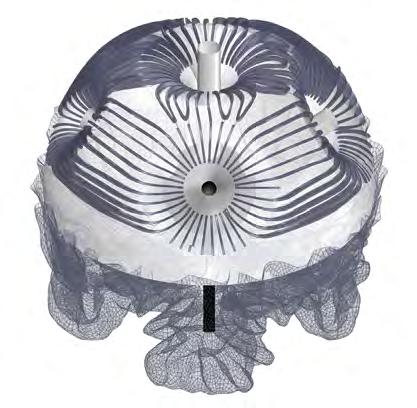
1. Generation of circles with different radiuses
4. Generation of the water collection surface with water collection pockets
7. Offset of the generated polylines. Creation of a surface8. Living tissue structure created by differential growth algorithm
Final morphology of the Collection_filtration module
2. Water collection surface with projected circles on the surface
3. Intersection of the surface with polylines. Solid difference
5. Water collection channels base line on the water collection pockets surface
6. Connection of water collection channels lines
GOAL
GENERATE A MORPHOLOGICAL VARIATION OF THE COMPONENT IN CONSIDERATION FOR THE LOCAL ENVIRONMENTAL CONDITIONS
OBJECTIVESOPTIMISE THE MORPHOLOGY OF THE PRODUCTION_PROTECTION FUNCTION
FITNESS CRITERIA FITNESS CRITERIA 1; RATIO | MAXIMISE VOLUME | MINIMISE SURFACE
FITNESS CRITERIA 2; MAXIMISE SHADOW ON THE LIVING TISSUE STRUCTURE
FITNESS CRITERIA 3; MAXIMISE SUN EXPOSURE FOR ALGAE STRUCTURE
PHENOTYPEGENERATED USING DIFFERENTIAL GROWTH ALGORITHM
GENEPOOL POSITION,OF POINT TO GENERATE POLYLINES FOR GROWTH, NUMBER OF POLYLINES, EXTRUSION DEPTH
In order to sustain the proposed system, there is a need to create a water collection and water distribution system. By providing infrastructure for the collection, filtering, and subsequent distribution of grey and rainwater, the Collection_Filtration module solves the water management issue. Additionally, modules contain a living tissue distributed over the saw dust foam, are generated using a differential growth algorithm. In order to ensure the necessary degree of humidity for maintaining living tissue, excess water or precipitation that is unable to be gathered into the collection pockets is directed into the moss surface to fulfil the biological requirement.
COMPUTATIONAL LOGIC
The aim of the experiment is to develop a population of morphologies that optimise for the following objectives: optimise the morphology to collect the maximum amount of water. For this goal, the following fitness criteria were established: fitness criteria 1 (FC1)– maximises the length and number of rainwater lines which are simulated using average wind vector direction; fitness criteria 2 (FC2)– is set as a ratio to minimise the volume and maximise the surface area; fitness criteria 3 (FC3)– maximises the area of the water collection pockets. The optimisation of surface differential growth that provides valleys for moss distribution was conducted separately, due to the limitation of the computational capacity. Each of these objectives is related to the morphological changes used to construct the form of the Filtration_Production module morphology; these transformations are known as the “genetic code” (or genome). The number of genes or genome addresses the following morphological changes (Fig..86): the size of the base semi-spherical surface set as a gene. The starting radius for pocket morphologies can vary. The number of the guideline for rainwater collection and at the same time their offset distance generated using varying values. The final step is the optimisation of the base surface for the differential growth algorithm where each offset distance is set as a gene.
Fig.86 . Computational logic of the Collection_Filtration module
EVOLUTIONARY OPTIMISATION
Fitness criteria 1 (FC1) was measured as a ratio between the volume and water collection surface. The intention was to minimise the volume while decreasing the surface area of the water collection surface together with its water collection pockets. The FC2 was set in order to increase the surface and number of water collection channels that direct water into its collection pockets. Finally, the FC3 intention was to increase the number and length of simulated rain lines. The rainwater simulation was created using an Anemone plugin for Grasshopper, wherein the directionality for rain was input as the predominant wind vector’s direction. The living tissue structure was not a part of the optimisation process as it was optimised separately due to the physical computational limitations dicted by hardware. Therefore, by knowing the exact values of growth changes for the surface and volume of the living tissue structure, the optimisation occurred only in the primitive geometry.
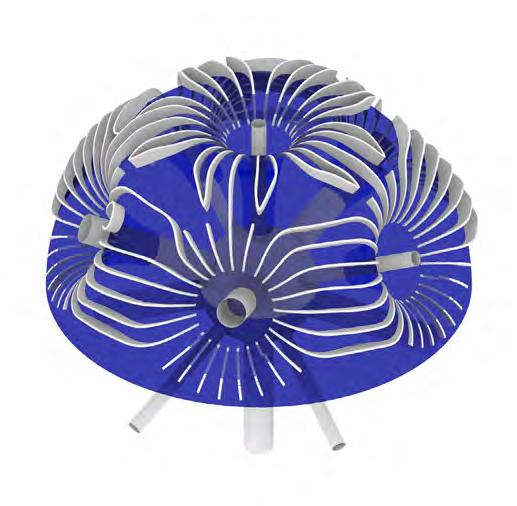
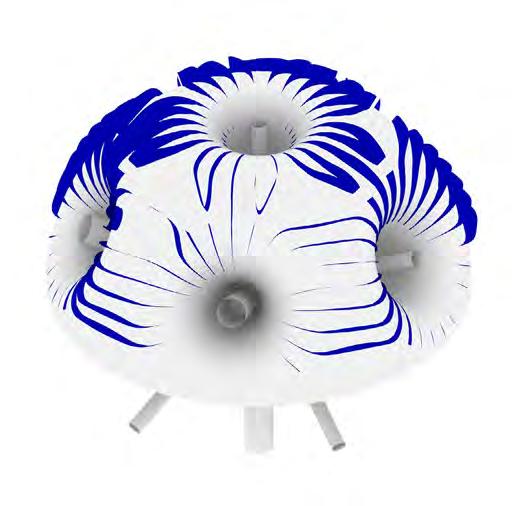
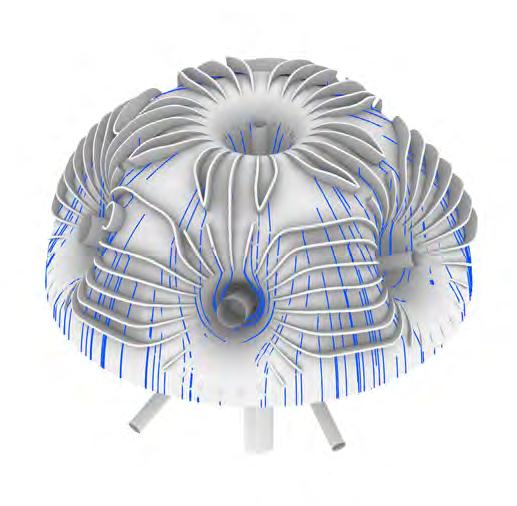
Fitness criteria 1; Ratio
Minimise surface
Fitness criteria 2; Maximise shadow on the living tissue structure
Fitness criteria 3; Maximise sun exposure for algae structure
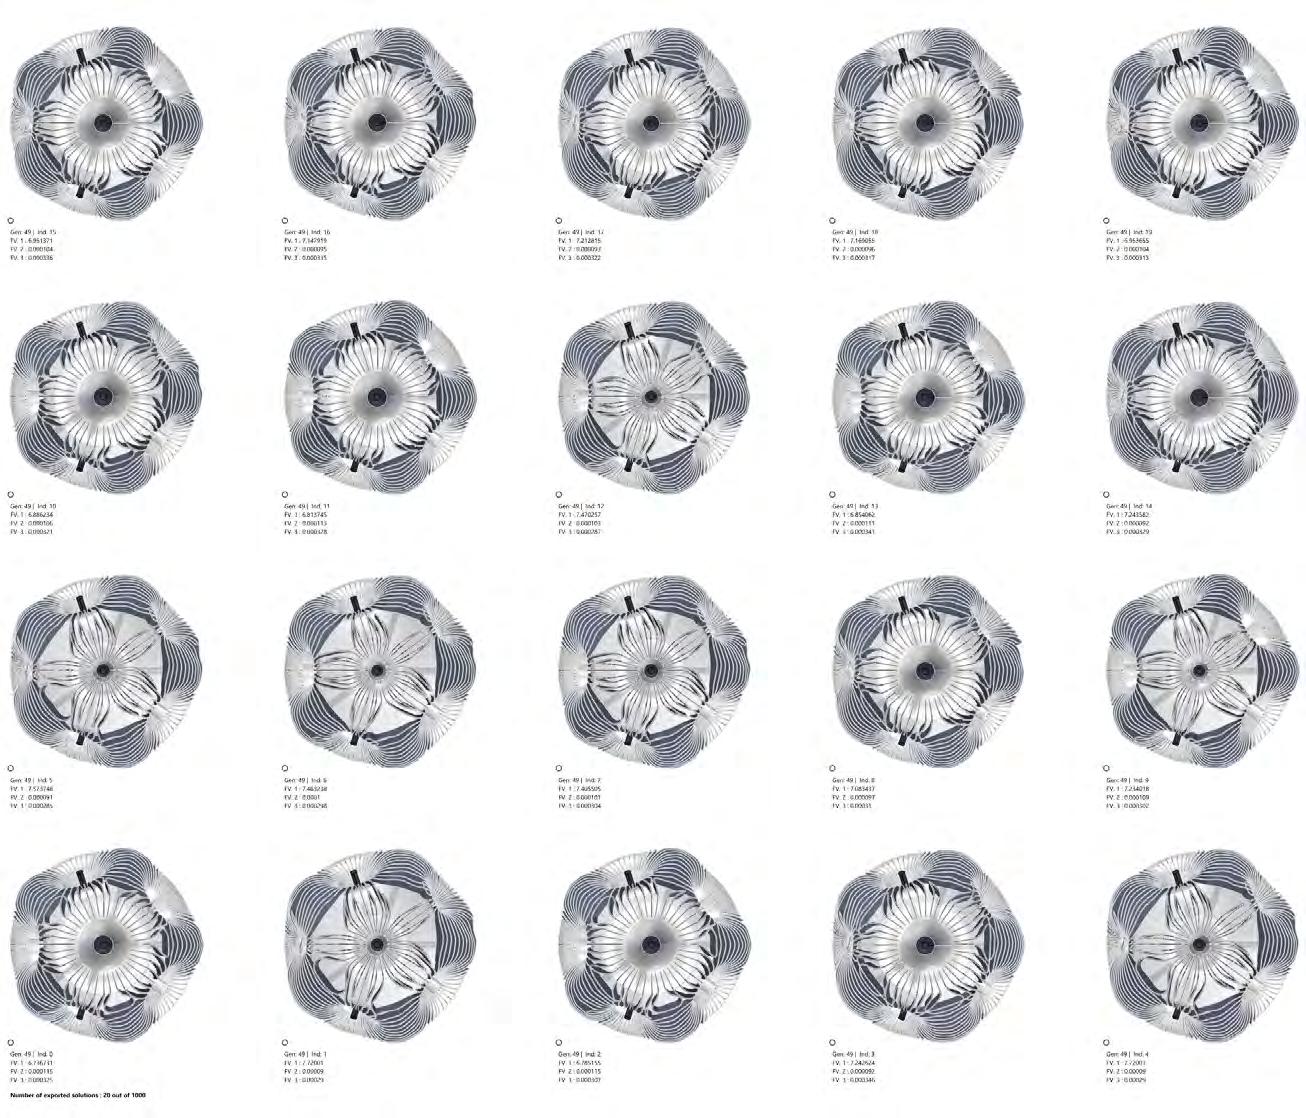
EVOLUTIONARY OPTIMISATION
The result of the algorithm produced 1000 phenotype solutions with three fitness values per solution, totalling 3000 values. The simulation performed well under optimisation as can be observed in Fig.XX showing the Parallel Coordinate Plot graph. From the Pareto Front solutions (Fig..87), it can be observed that the simulation produced a limited variety of phenotypes in terms of the morphology of water collection surface. A high level of visual geometrical variation can be observed in the morphological organisation of water collection channels that direct water into collection pockets. Due to the genes involved in the optimisation process, water collection channels vary in terms of lengths, their offsets from the surface and the patterns, which allow further optimisation in terms of the production process. The simulation showed vital connections between gene values that emerged at later stages of the simulation for further implementation.
Fig.87. This figure illustrates the selected pool of individuals, particularly Pareto Front solutions.


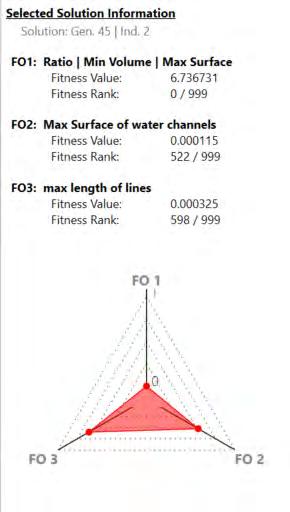
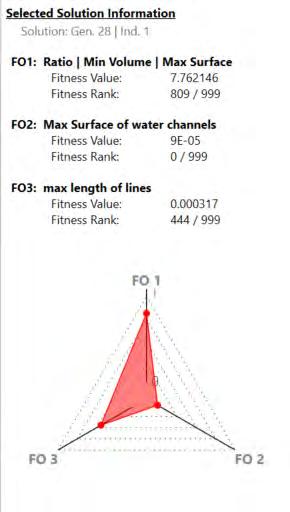
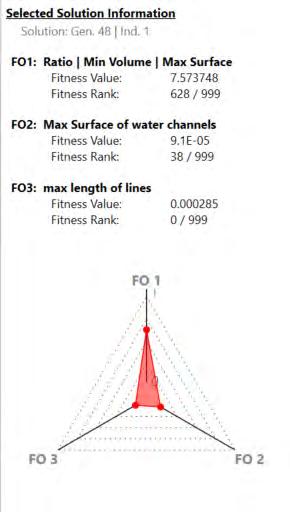
EVOLUTIONARY OPTIMISATION
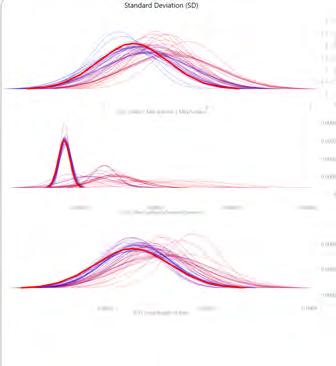
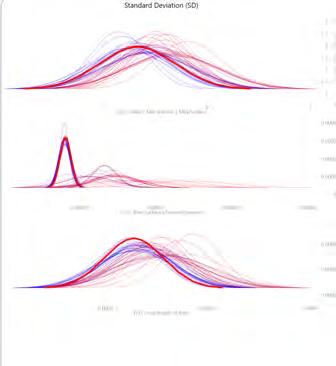
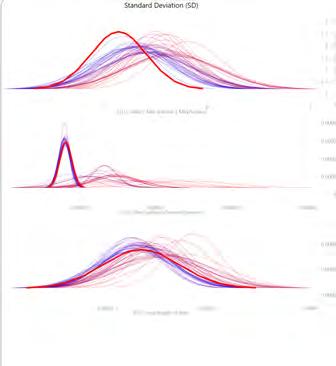
FITNESS CRITERIA 1
Fitness criteria 1 (FC1)- the most optimised phenotype evolved from generation 45 individual 2 (G45I2). The criteria was formulated as a ratio between volume and the surface of the water collection structure. The simulation produced 29 phenotypes with rank 0 for FC1. This individual depicts the highest surface of the water collection pockets compared to other individuals which aids in directing water most efficiently. Fitness criteria 2 (FC2)- the most optimised phenotype evolved from generation 28 individual 1 (G28I1). The criteria was set to maximise the surface area of water collection channels. The simulation produced 48 phenotypes with a rank of 0 for FC2. From the visual analysis of the phenotype, it can be seen that water collection channels have geometrical intersections which should be addressed in the post-simulation optimization process.
Fitness criteria 3 (FC3)- the most optimised phenotype evolved from generation 48 individual 1 (G48I1 ) The criteria was set as a parameter that should increase the length and number of simulated rain lines. The simulation produced 45 phenotypes with rank 0 for FC3. The post analysis shows that individuals
FITNESS CRITERIA 2
FITNESS CRITERIA 3
Fig. 88. Best individuals for 3 Fitness Criteria. The graphs plot all three fitness objectives. The red dots and curves show the selected solution in the entire simulation. It shows how successfully or unsuccessfully simulation optimised this solution for the three fitness objectives.
Fig. 89. The average solution for all fitness criteria with a rank of zero . The red dots and curves show the selected solution in the entire simulation. It shows how successfully or unsuccessfully simulation optimised this solution for the three fitness objectives.
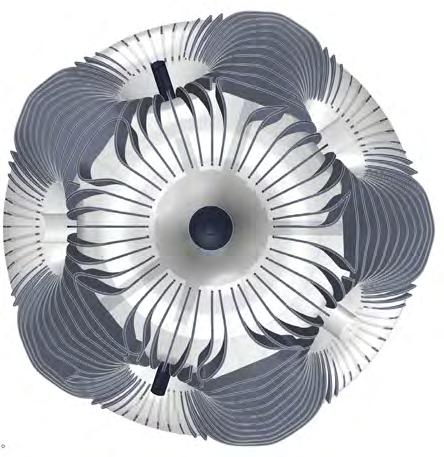
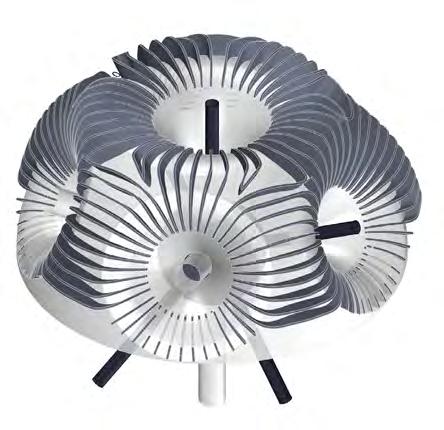
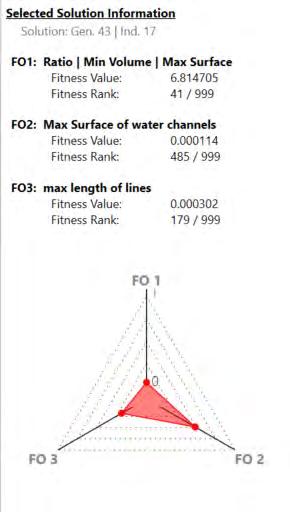
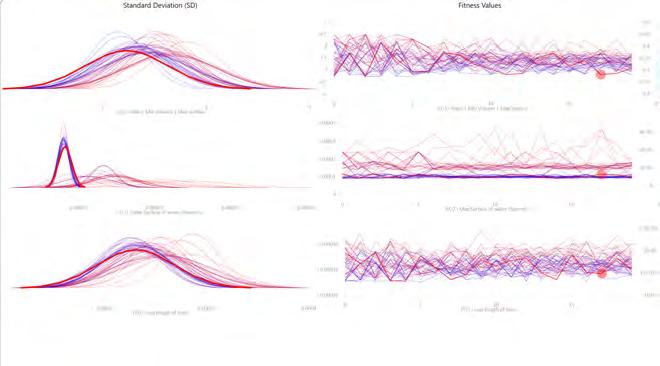
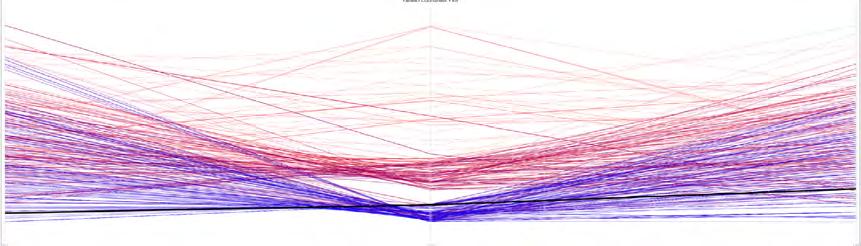
EVOLUTIONARY OPTIMISATION
with high performances of the FC3 have a high offset from the surface values.
The average solution for all fitness criteria with a rank of zero was chosen as generation 43 individual 17 (G43I17) (Fig..89). This individual had a high density of water collection channels with minor intersections which should be addressed in further morphological development processes. FC1 and FC3 informed the development of a water collection surface in which the high variety of water collection pocket morphologies was achieved. This should be addressed in further stages as it can cause challenges with the maintenance as well as with the production stages. Individual 17 from generation 43 was chosen for further development of the Collection_Filtration module.
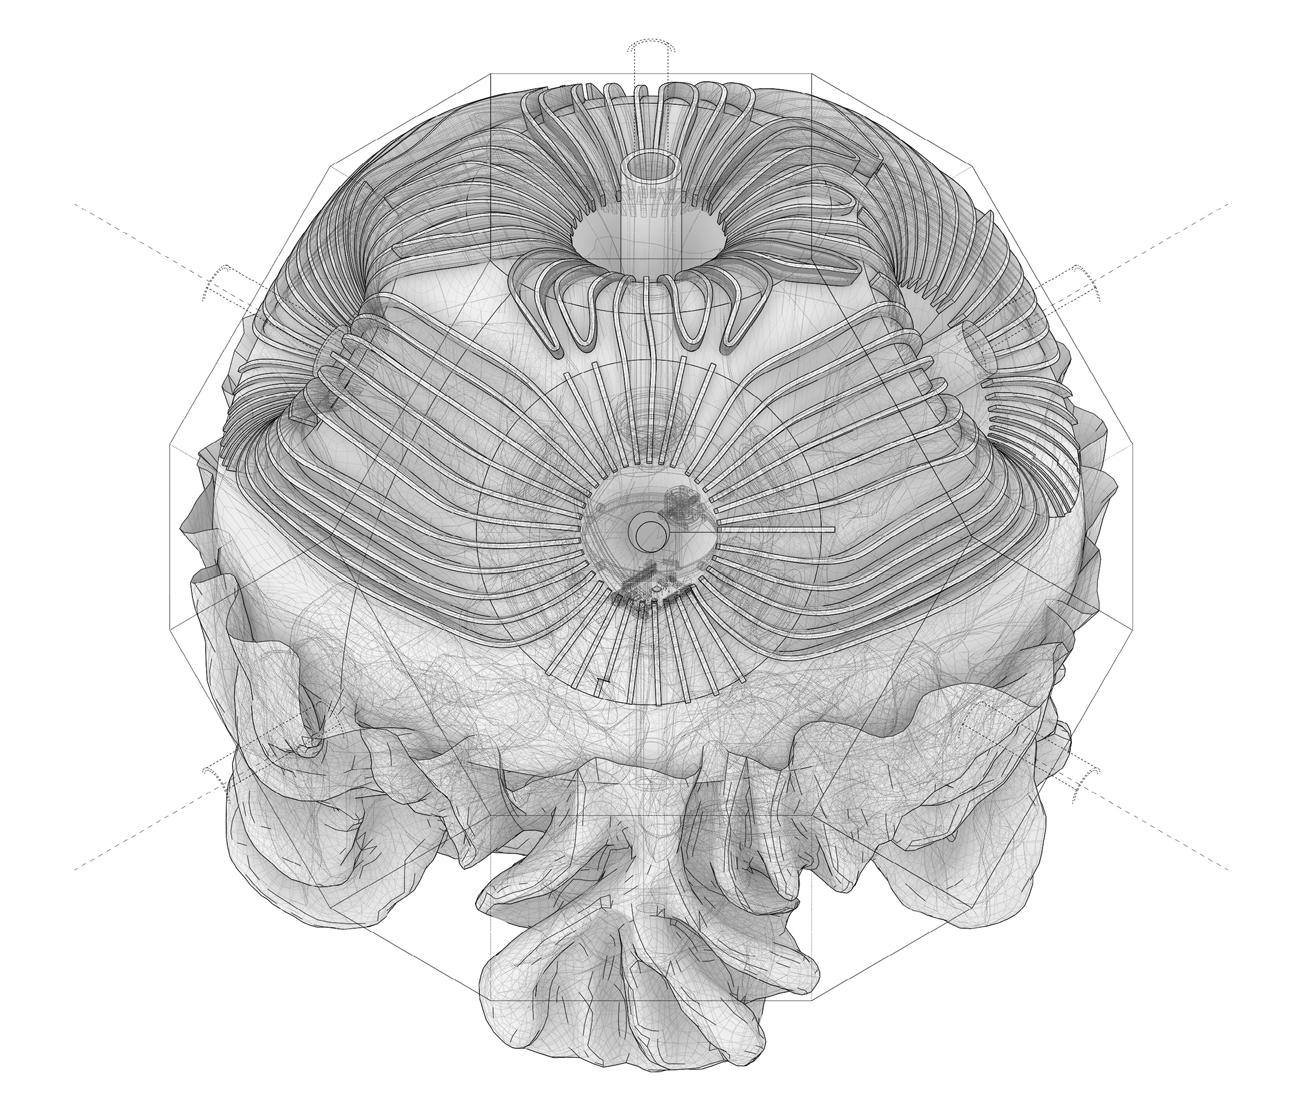
COLLECTION_FILTRATION
The collection filtration module can be identified by its enclosed upper half upon which there are patterned ridges in order to channel the water directly into the collection pods. The pods for storing water inside pass through a filtration membrane and secondary porous substrate to filter any particles out. This dispenses into the collection pod in the central node and the water levels and quality are monitored to determine which component will need water dispensed to it. The water channels between components are hidden within the fixed (non-rotating) hollowed arms of the structure. This ensures clean integration in between. Furthermore, due to the morphology of the slightly smaller upper half of collection as it relates to the larger edge of the filtration bottom half, there is an opportunity for rainwater to directly drip along the corrugated edges of the sawdust and moss section into a secondary concavity. As the moss bi-
Fig. 90. Collection_Filtration module structure
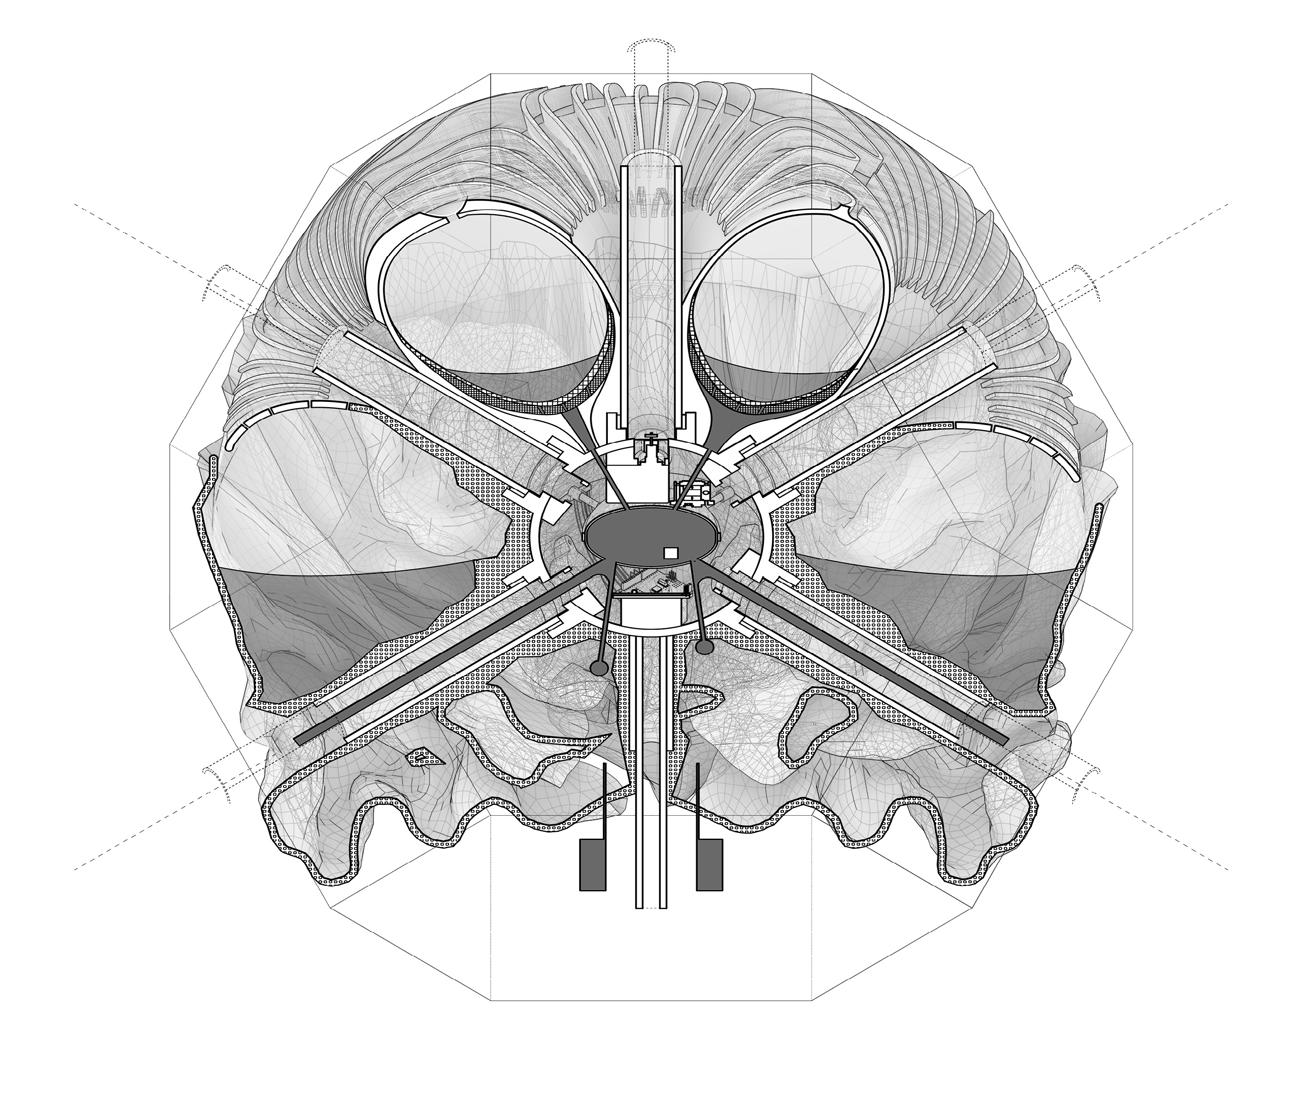
91. Collection_Filtration module section shows the essential details of the morphology
MICROCLIMATE MIST
COLLECTION_FILTRATION
otissue in this needs shaded, humid environmental conditions, the rotational positioning of the module in their larger assembly should be minimised. (Fig..90-91) The microclimate of the bottom portion is aided by mist attached directly from the collection pod and similarly serves to thermoregulate temperature fluxes for its human occupants underneath or nearby.
Fig.
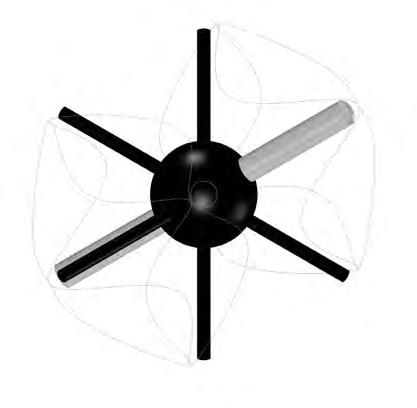


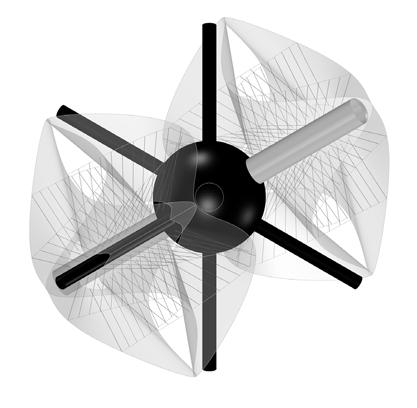
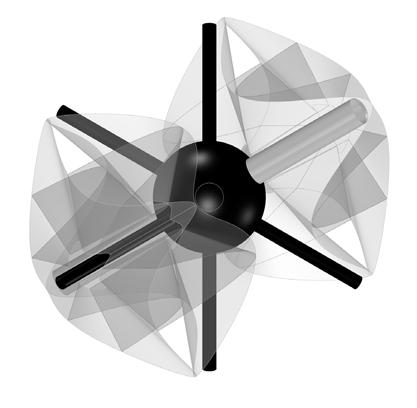
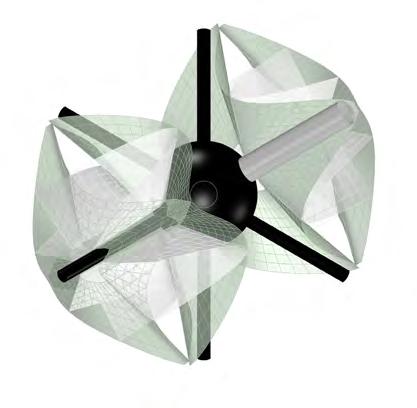
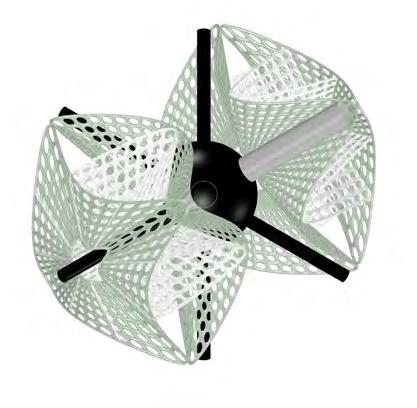
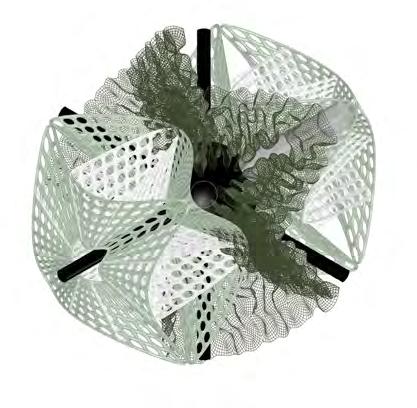
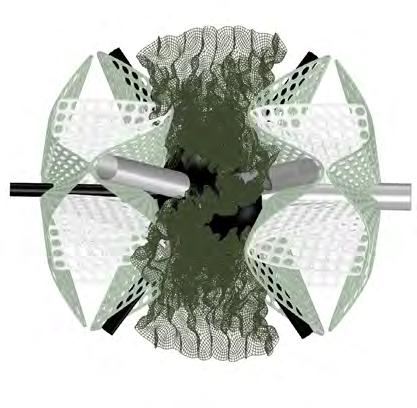
1. Polylines generation
4. Lines generation
7. Membranes multipipe surface creation
8. Living tissue structure created using differential growth algorithm
The final morphological organisation of the Filtration module
2. Exterior and interior surfaces generation
3. Base polylines for the intermediate surface
5. Intermediate surface creation
6. Rebuilding of the surfaces grid size
FILTRATION MODULE
According to the assessment conducted in the research development chapter, some areas of the selected site are not only severely polluted, but at the same time some of these regions have increased wind speed as a result of both the area’s morphological organisation and the rapidly changing environmental context. These highly polluted areas with high wind velocity have high quantities of particles floating in the air creating a non-comfortable environment for human activity. Consequently, a filtration module is integrated into the network development strategies in order to filter pollen grains, dust and soot particles, germs and black carbon.
The module’s morphology (Fig..92) is divided into two sections: the first is a structure that contains living tissue, and the second is made up of various membrane types that can filter and absorb different kinds of pollution. The developed saw dust foam material forms living tissue surface, creating valleys for surface self-shading. The differential growth algorithm is employed to create a continuous surface. The simulation of the surface differential growth was conducted and analysed in order to choose the best performing values for collision radius, number of iterations and surface’s grid structure.
The capacity of the surfaces to capture particles impacts the morphological organisation of membranes that directly inform their perforation. In order to decrease wind velocity and enhance particle absorption, pockets for wind redirection were developed connecting multiple membrane surfaces into one structure. Additionally, the level of porosity on each filtration surface fluctuates, filtering grains of various sizes on each level of the structure. Multiple dimensions of the perforation were evaluated during the modelling of particle behaviour using the Flexhopper plugin for Rhino|Grasshopper.
Fig.92 . Computational logic of the Filtration module
Membrane grid 1
Membrane grid 2
Membrane grid 3
Percentage of catched particles
Membrane 1
Membrane 2
Membrane 3
Moss structure

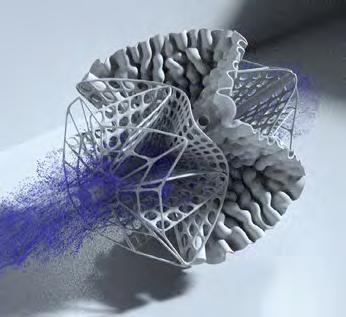

Membrane grid 1
Membrane grid 2
Membrane grid 3
Percentage of catched particles
Membrane 1
Membrane 2
Membrane 3
Moss structure
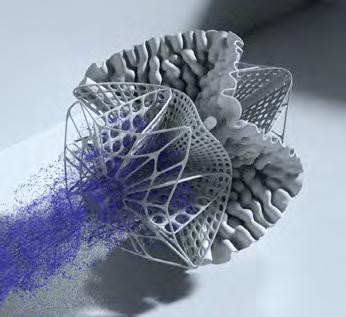
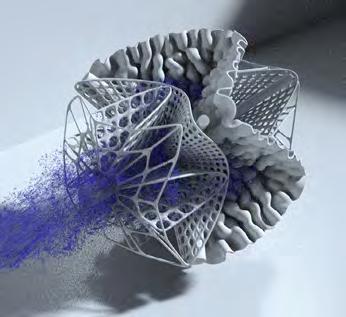
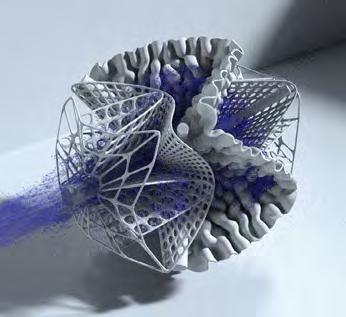
Membrane grid 1
Membrane grid 2
Membrane grid 3
Percentage of catched particles
Membrane 1
Membrane 2
Membrane 3
Moss structure
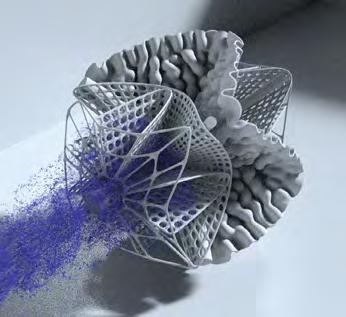
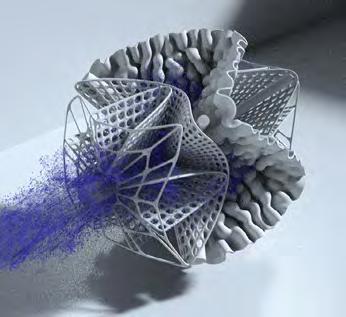

Membrane grid 1
Membrane grid 2
Membrane grid 3
Percentage of catched particles
Membrane 1
Membrane 2
Membrane 3
Moss structure
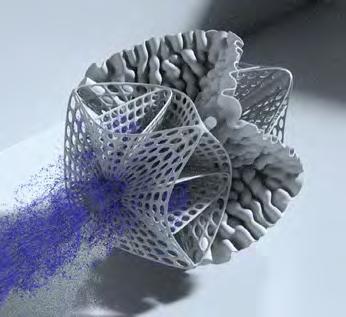
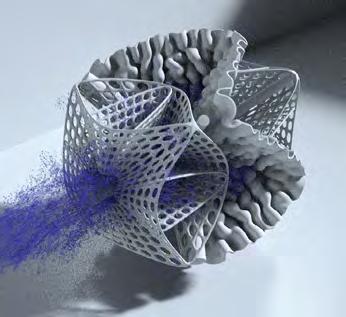
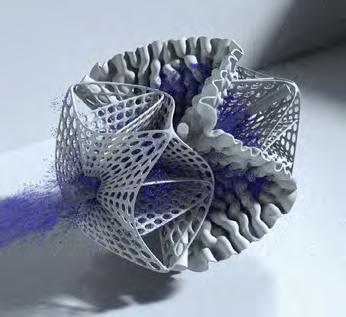
Total Simluation
Particles:
2000000
Particle simulation was set up using 8 different sized filters to analyse the efficiency of the filtration module in trapping particles. In the first particle simulation, by setting the size of the filter grid in membrane 3 as a variable to test its role in filtration, it was observed that the third layer played a crucial role as to how many particles were intercepted: the denser the grid, the better the interception. (Fig..93) Following which, by setting the grid size of the membrane 1 as a variable, it could be observed that the grid size of this membrane should not be too dense, otherwise it will block particles from entering the filter module, thus weakening its overall filtration.
In the second test, based on the findings of the previous simulation, membrane 3 was set to be the densest to focus on intercepting
MEMBRANE TYPE 1
MEMBRANE TYPE 2
MEMBRANE TYPE 3
MEMBRANE TYPE 4
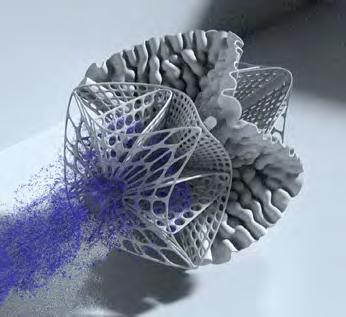


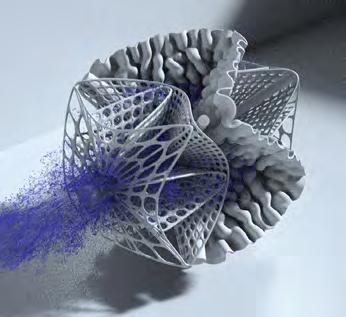
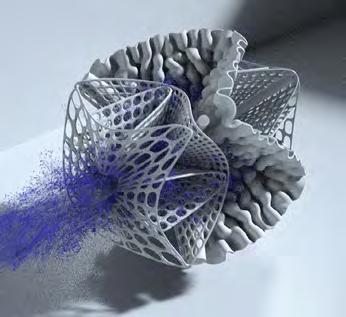
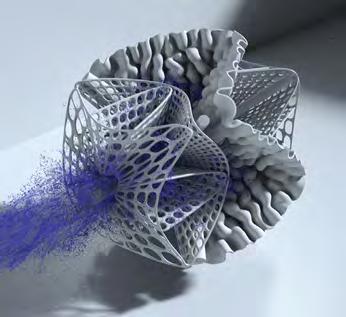
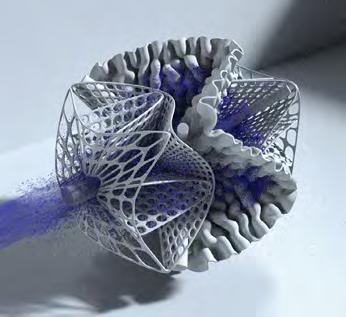
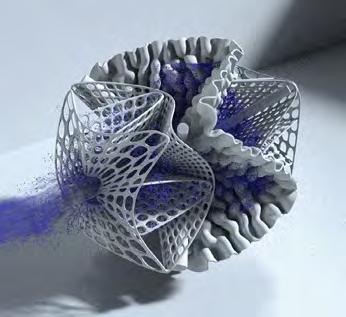
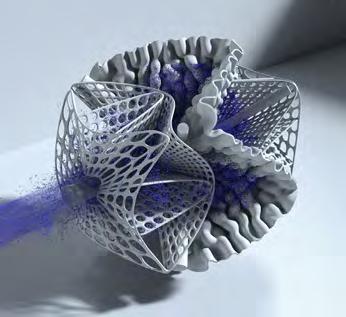
particles with different densities in membranes 1 and 2. By setting the first layer to a medium density and setting the grid size of membrane 2 as a variable, it is observed that membrane 2 acts as a “pocket” in this simulation- the form of the second layer can be used to significantly reduce the flow rate of particles for the purpose of storing them. At the same time, this membrane should not become too dense, otherwise it will result in two parts of the module- the trapping and moss become unbalanced in terms of the number of particles stored. It can be observed that option 7 provides the optimal balance between particle capture efficiency and harmonising the quantity of particle capture between the filtration and moss layer.
Membrane grid 1
Membrane grid 2
Membrane grid 3
Percentage of catched particles
Membrane 1
Membrane 2
Membrane 3
Moss structure
Membrane grid 1
Membrane grid 2
Membrane grid 3
Percentage of catched particles
Membrane 1
Membrane 2
Membrane 3
Moss structure
MEMBRANE TYPE 7
Membrane grid 1
Membrane grid 2
Membrane grid 3
Percentage of catched particles
Membrane 1
Membrane 2
Membrane 3
Moss structure
TYPE 8
Membrane grid 1
Membrane grid 2
Membrane grid 3
Percentage of catched particles
Membrane 1
Membrane 2
Membrane 3
Moss structure
. Particles simulation
MEMBRANE
Fig.93
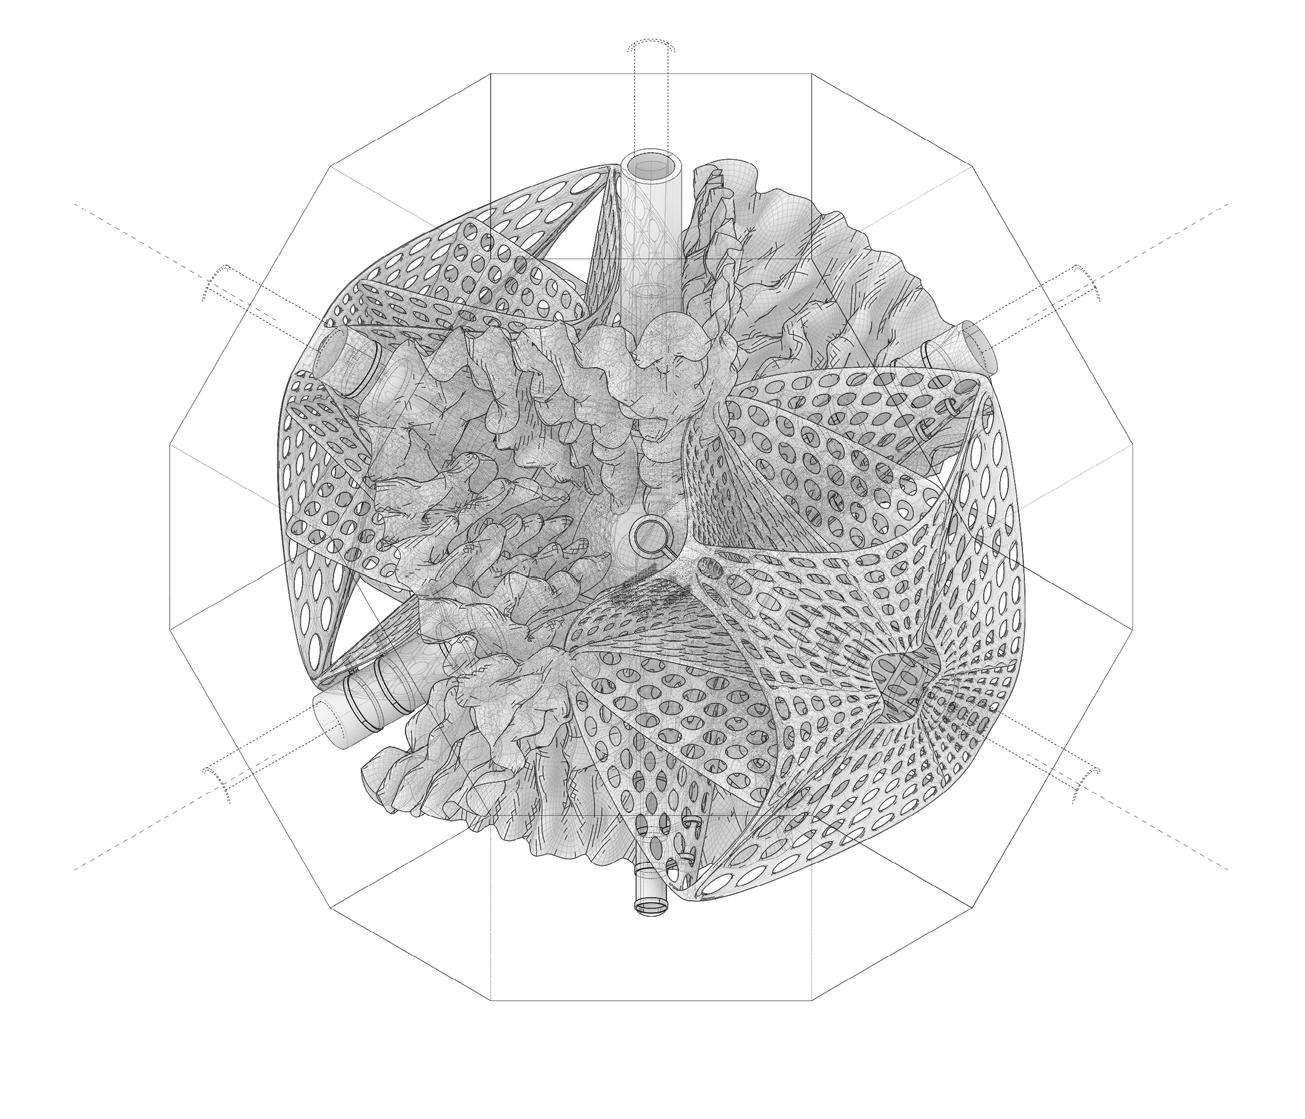
COLLECTION_FILTRATION
The Filtration module is designed similarly to the production and collection details while prioritising its eponymous function. The dual membranes of varying apertures are designed to filtrate particulate matter (PM) of varying sizes. This can be curtailed or expanded depending on localised conditions of environmental specificity. The arms are designed to align it to receive a higher level of wind vector hits in order to ensure maximum exposure to PM. There is a secondary layer of filtration behind the dual membranes. From the other end, the filtration module also incorporates the production detailing for the living tissue. In this context, moss plays an important role for filtration: it is capable of absorbing toxic chemical gases, nitrates, and hazardous pollution while combining 50% of it into fuel for itself. Water is dispersed into the living tissue to comply with the biological requirements of water via pod through the sawdust material layer. Furthermore, because the dual membrane is clipped into place along the length of arms, it is possible for replacement should the internal sensors in the central sphere indicate high pollutant exposure has been met.
Fig. 94. Filtration module structure
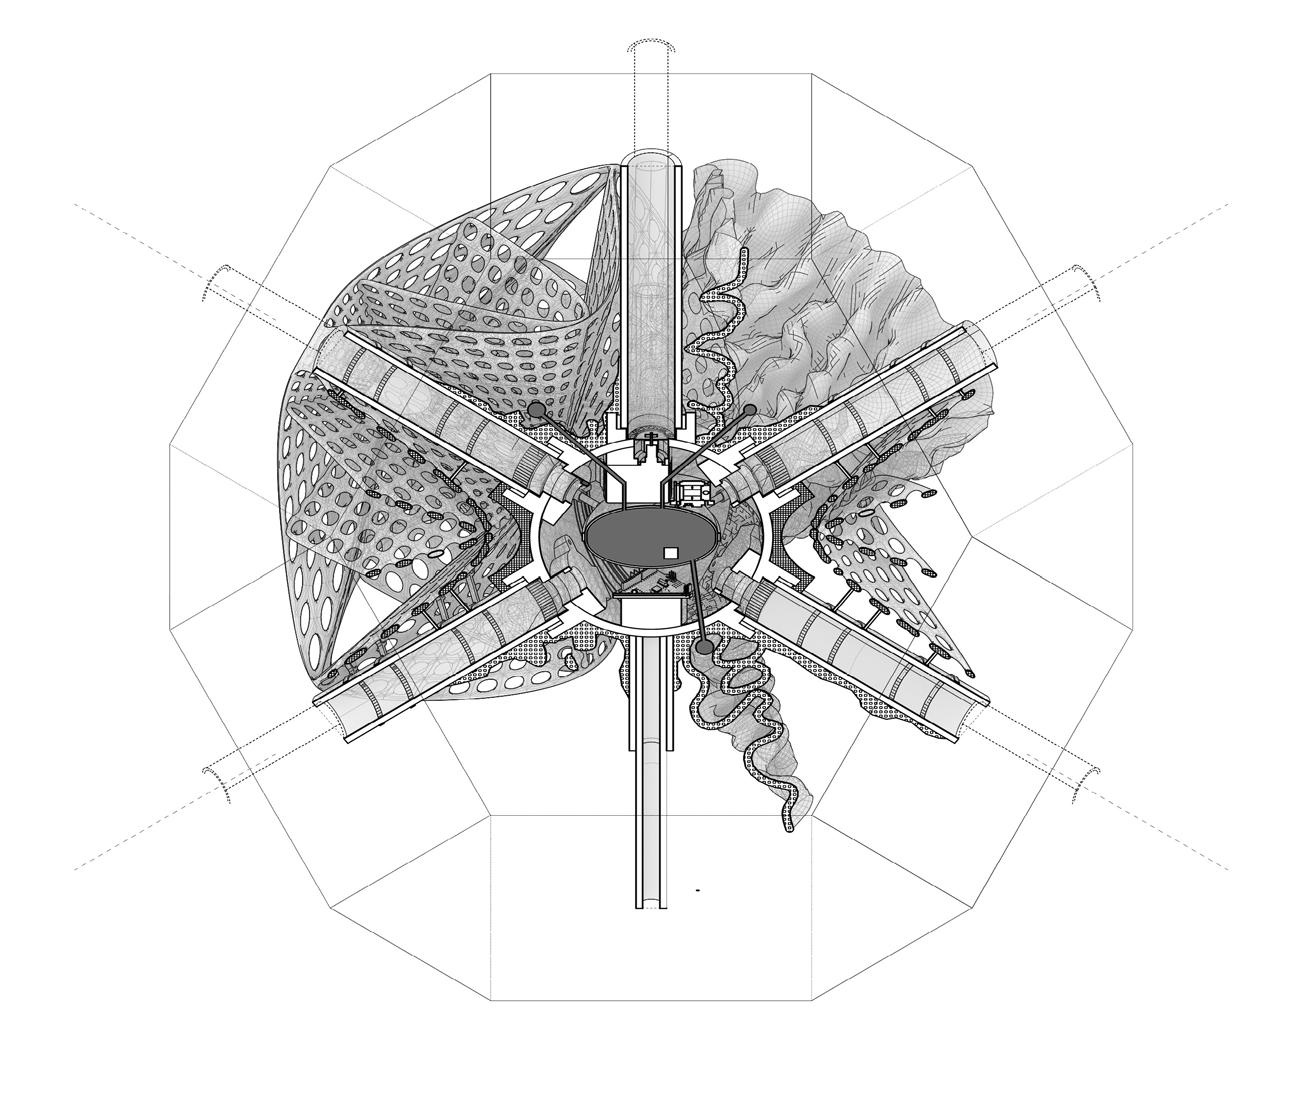
KINETIC JOINERY DEVELOPMENT
The kinetic joinery system has been developed to fit within the octahedron shapes of each component module. By implementing the same system with varying internal hardware localised inside the central sphere, it is feasible to mass-produce the modular structures and outfit them with the specificity of the components after fabrication. The arms can be customised to accommodate various clipping or fastener systems needed to attach different pieces of the collection, filtration or production modules. This contributes ultimately to the sustainability of production by removing any unnecessary elements in their fabrication as well as curtailing any confusion during assembly. Each module arm can be fixed into the milled sphere and fastened into place. A simple bearing solution allows freedom of rotation via an internal motor server which is present in all modules. The upper and bottom half of the sphere can be unbolted and disassembled into two pieces in order to outfit with the appropriate internal hardware. This provides a familiarity between modules should there be a need for human intervention.
Fig. 95. Filtration module section shows the essential details of the morphology
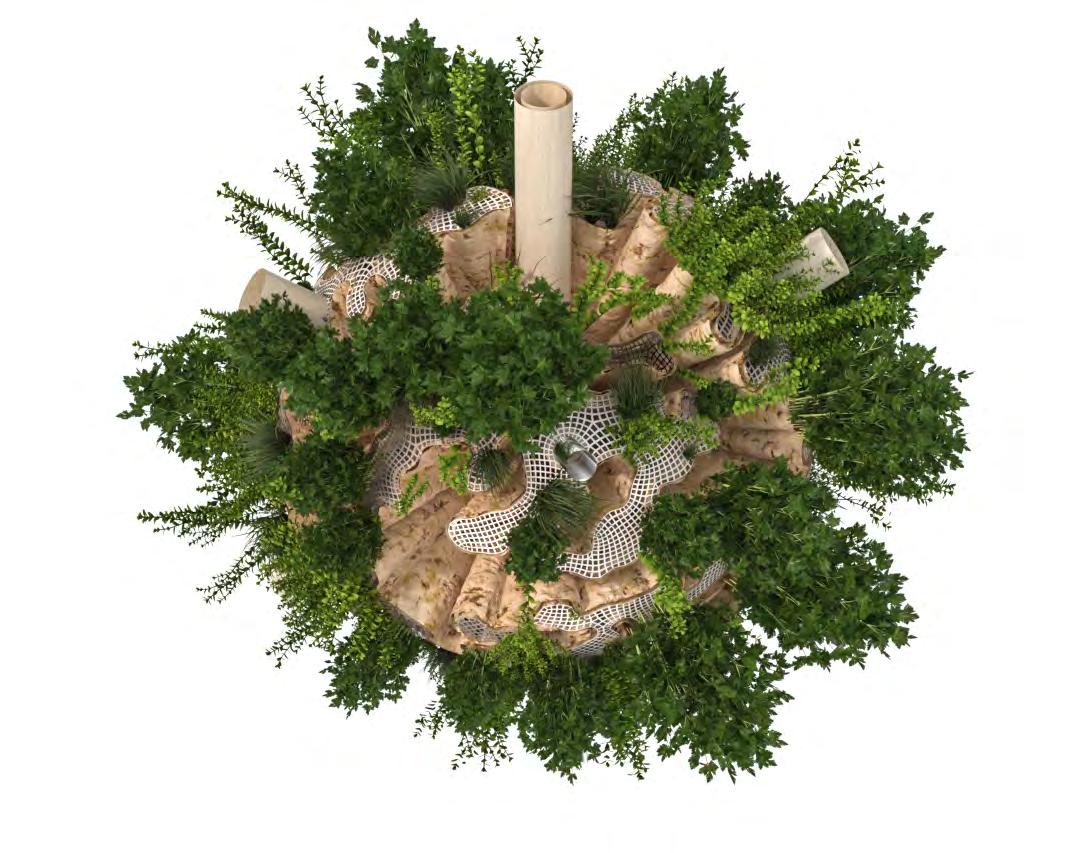
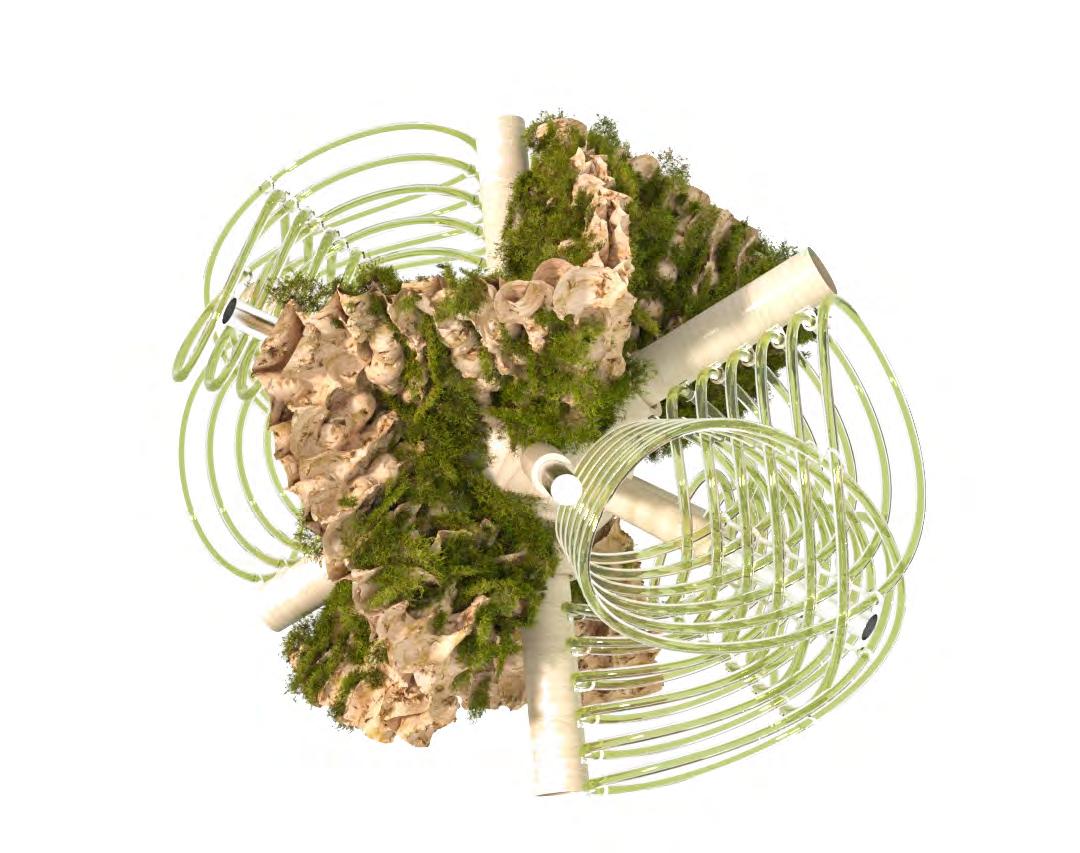
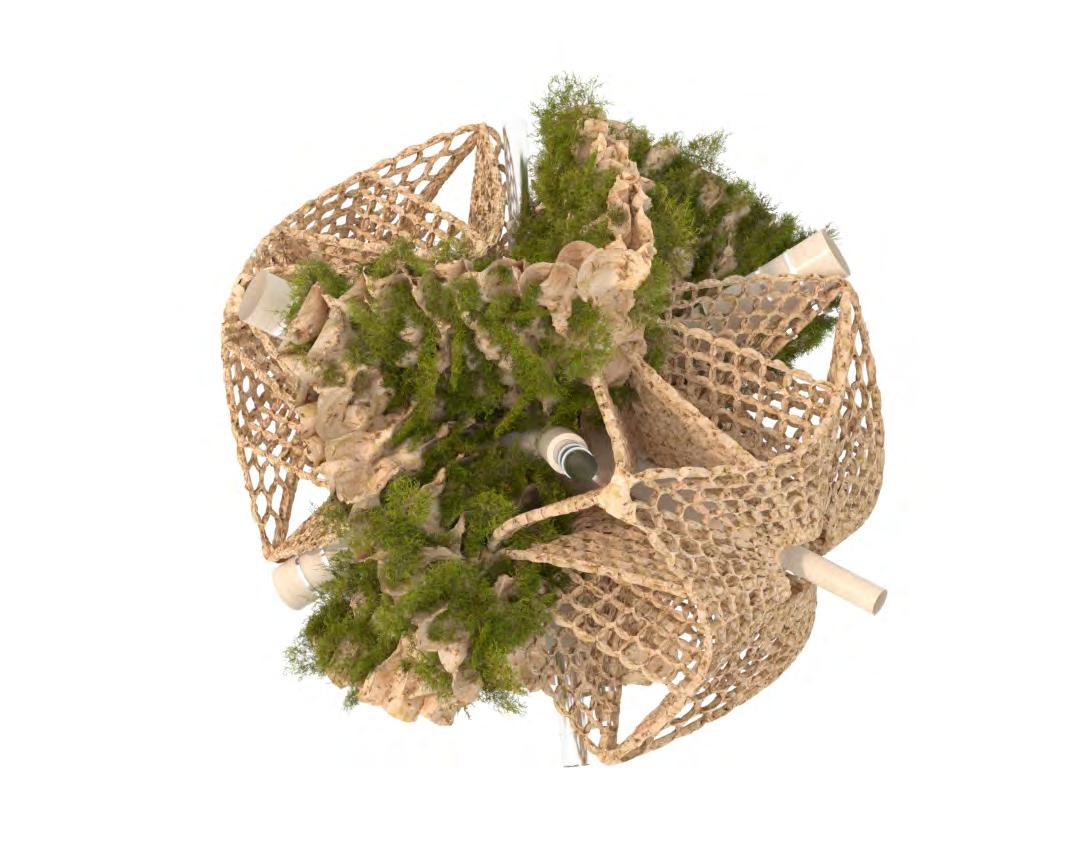
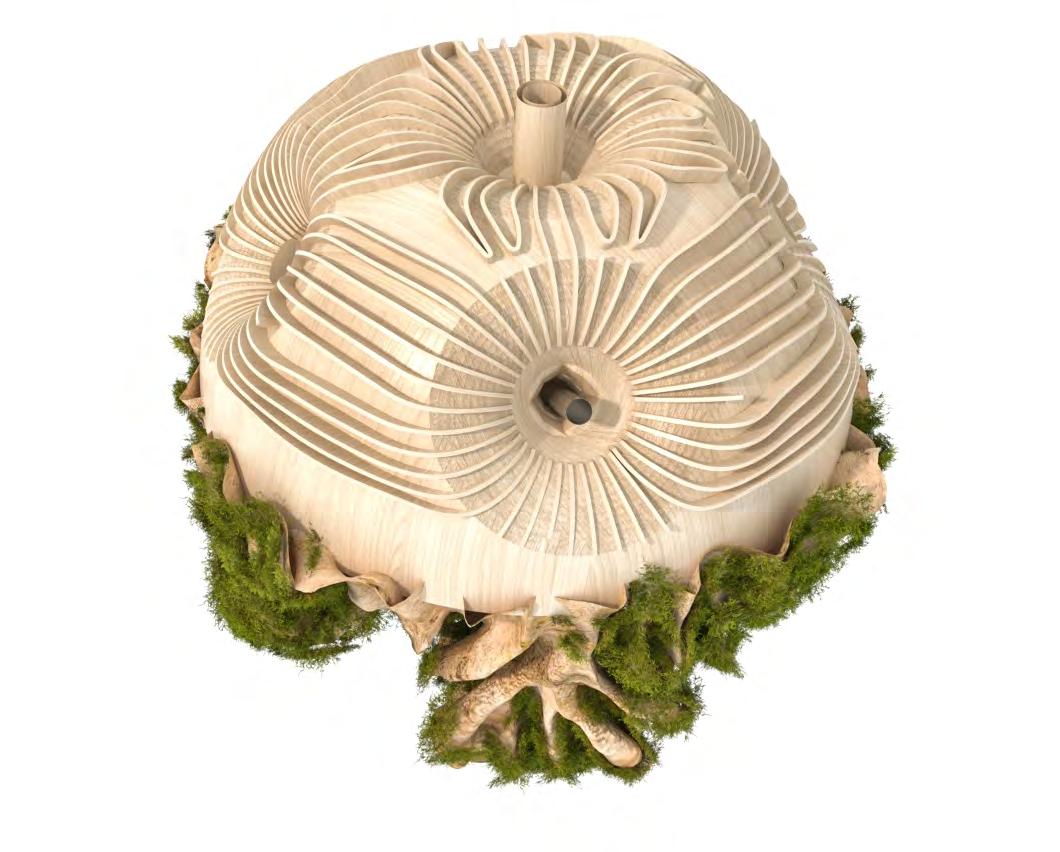
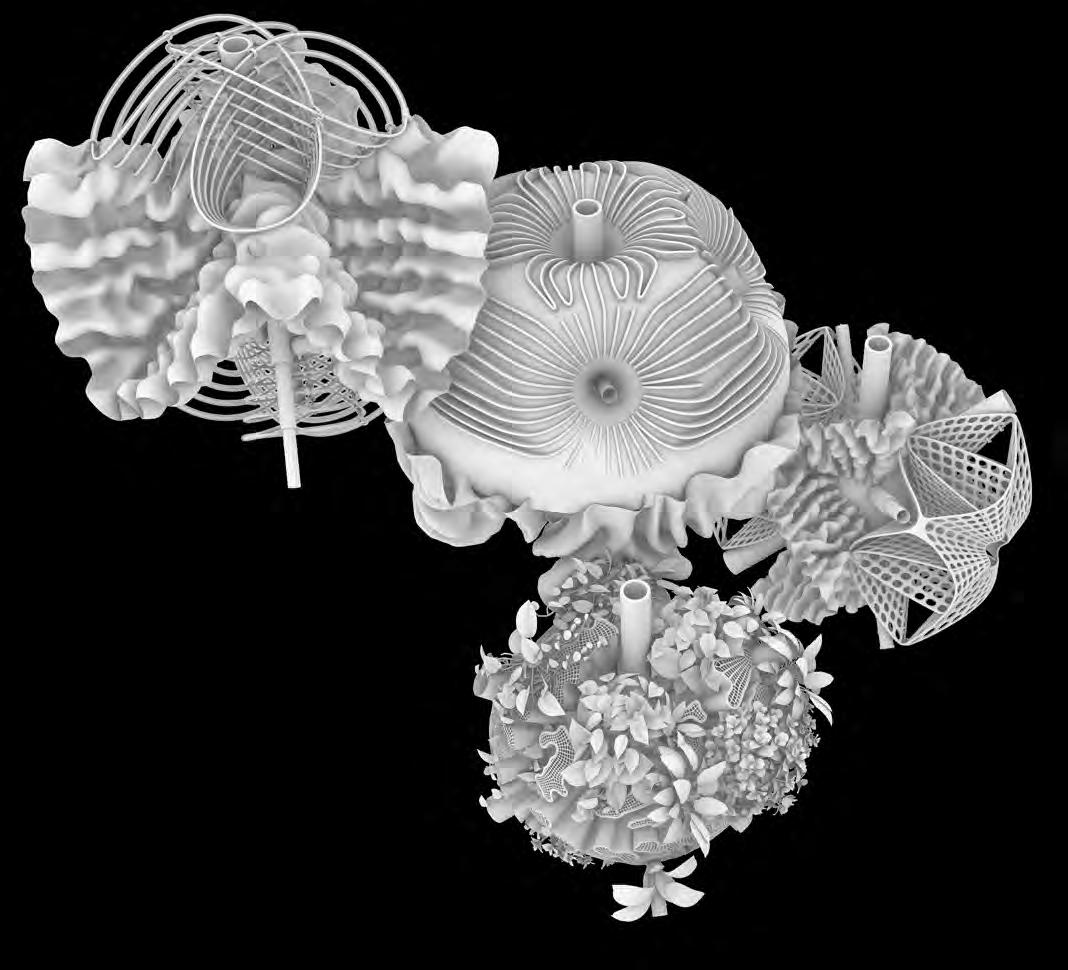
CONCLUSION
While the technical detailing for the project has been considered and designed on an individual module basis, the ultimate reflection on the assembly has prioritised the module’s ability to be functionally unique while structurally ubiquitous; the structure remains constant while the interior fittings are adaptable to serve the four different functions. In this way, no matter the relationship of one programmatic function to another, there is a clearly outlined proposal in the transition from one functional assembly to another. Moreover, by identifying that larger groups of similar functions ie. filtration or collection functions can work together in higher quantities in order to maximise the volume of liquids passing through between modules, the system of filtration effectively works as a stand-alone isolated method between other programmatic modules- it can pool all similar liquids together in unison to facilitate faster filtration. The modules were therefore designed to have functionally-specific detailing which would not affect the fabrication process; each structural module was fabricated in the same fashion allowing for change should there be environmental changes such as meeting the amount of pollution extraction for a particular site location or removing elements within the assembly which have met the material’s contamination extraction limit.
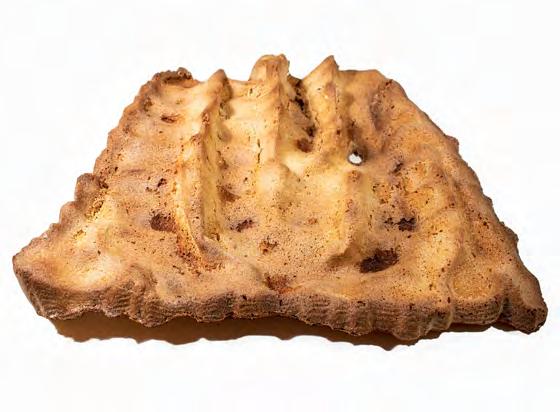
MATERIAL IMPLEMENTATION
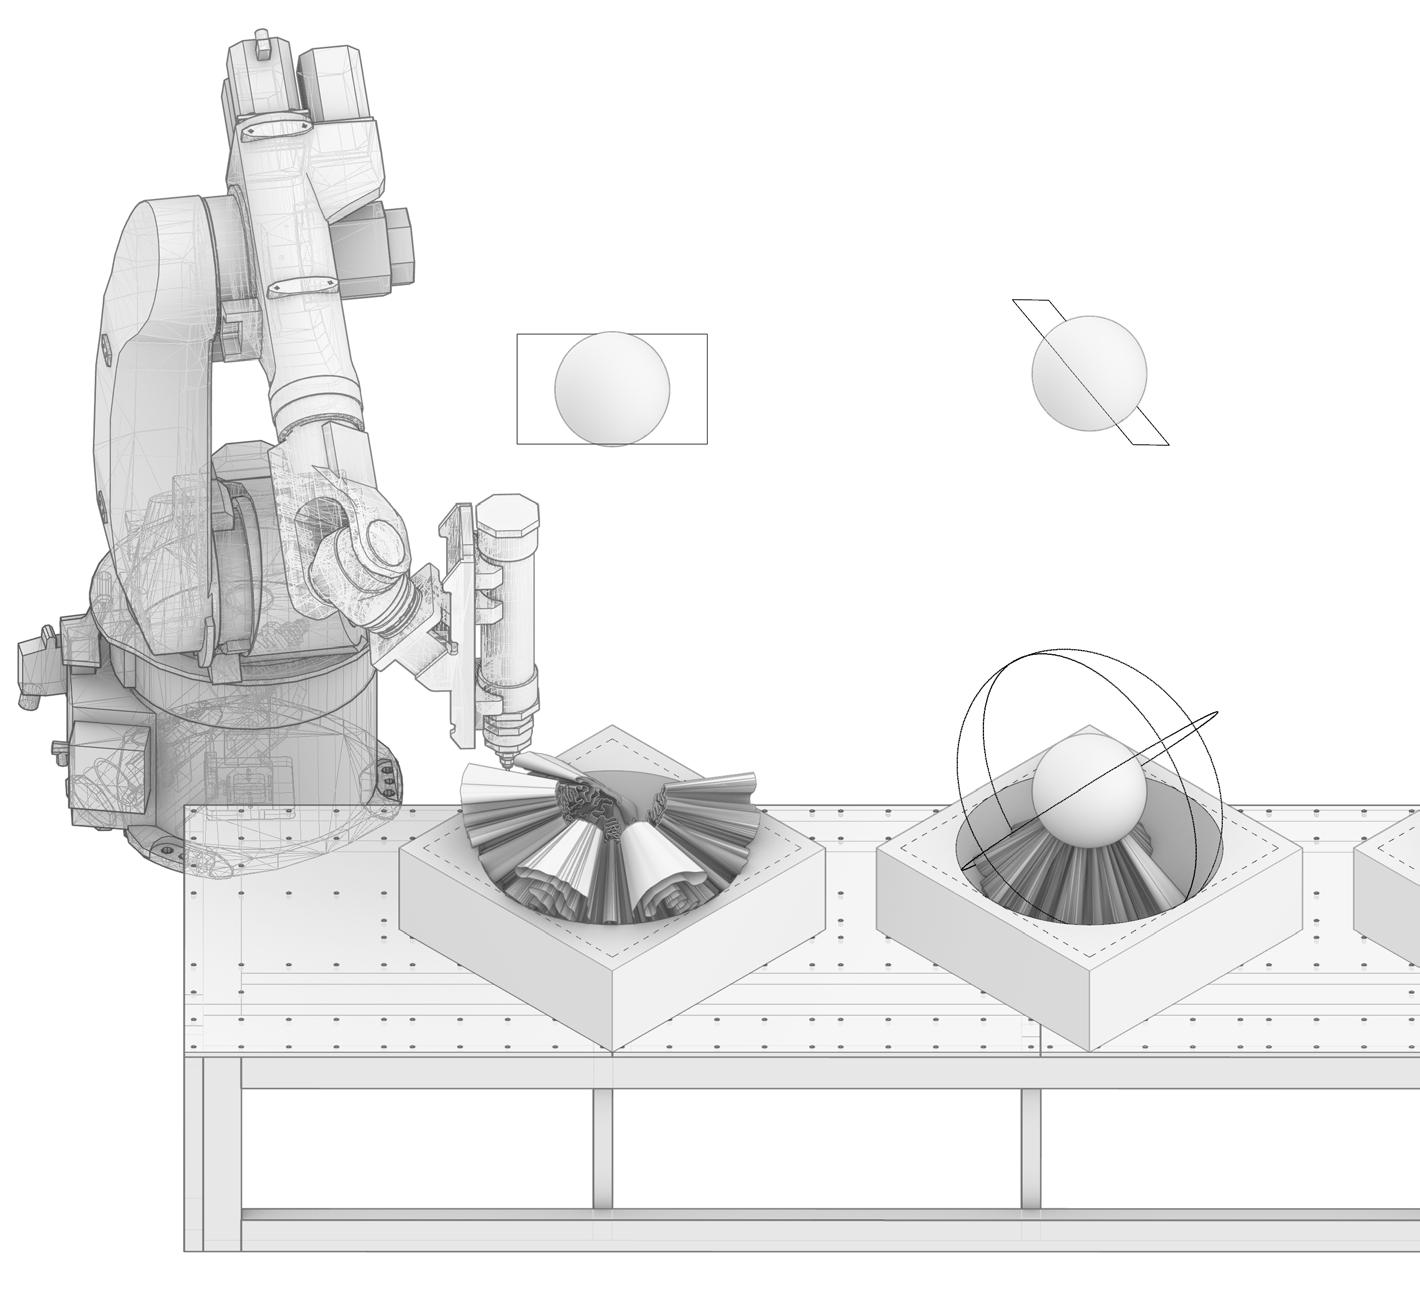
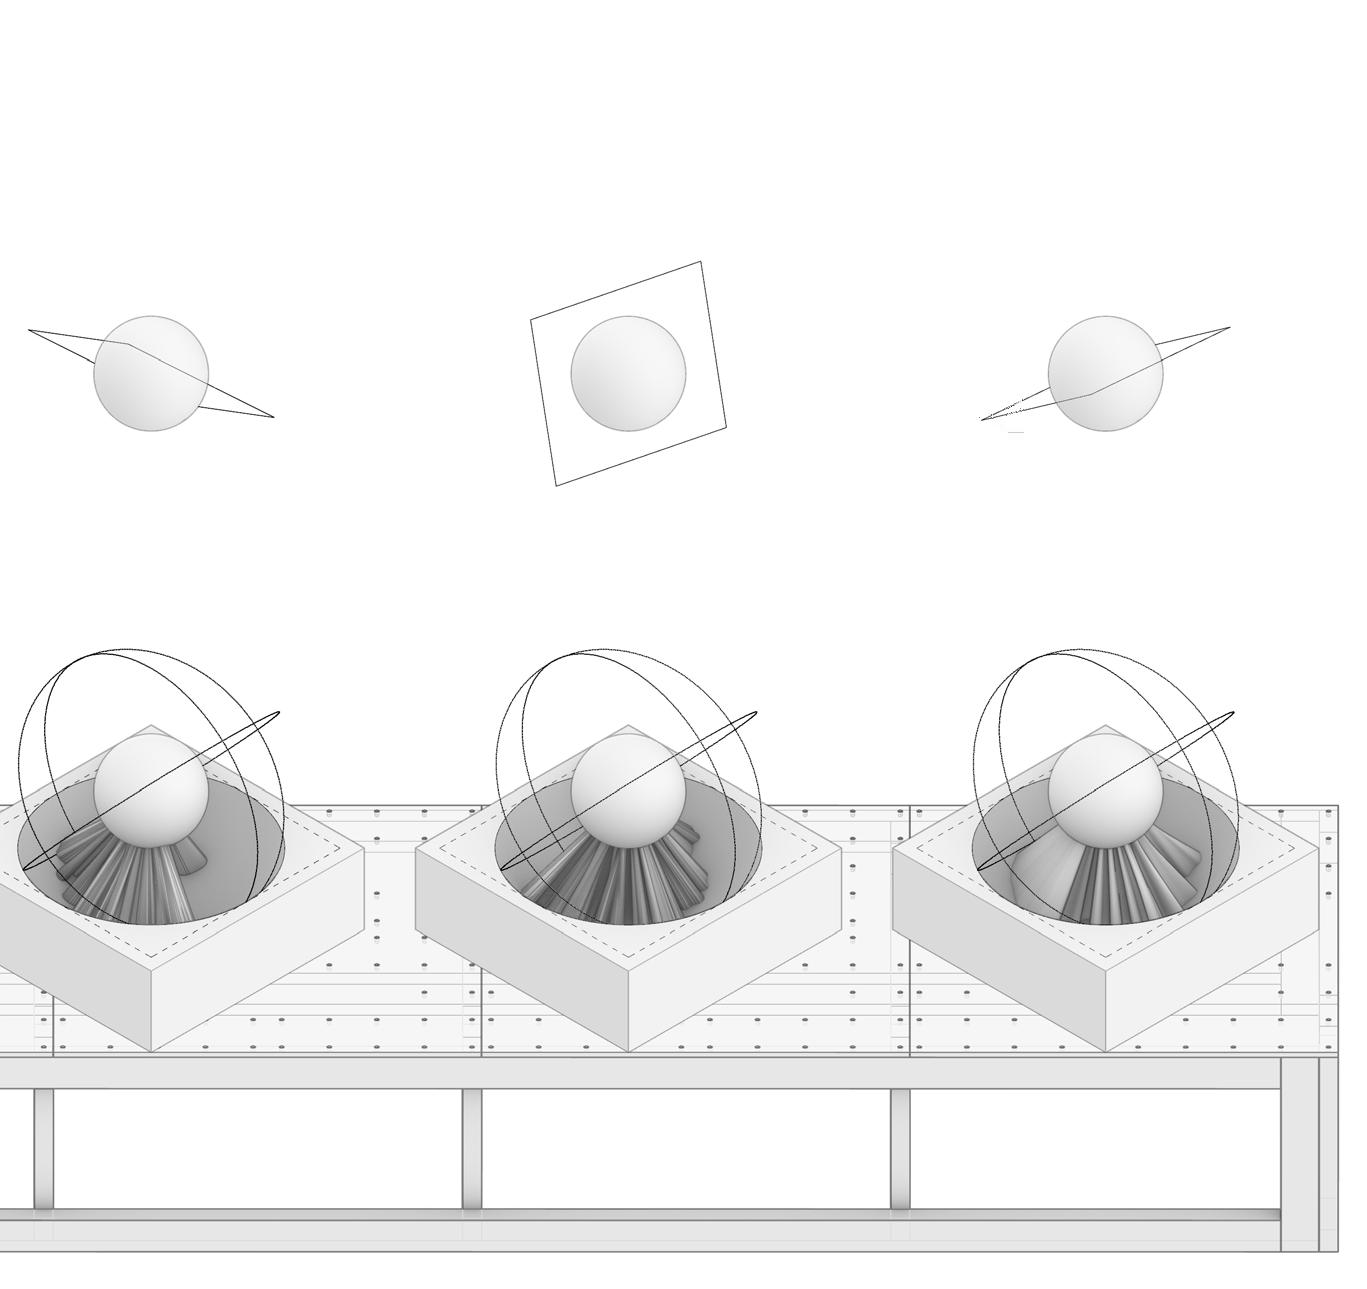
Logic for robotic extrusion. Usage of the same morphology as a base surface for extrusion will allow the creation of complex geometries. The structure should be always located in the centre even if morphology is different
The production process of the bio-bot module was considered from the environmental and economic perspectives simultaneously. Hence, saw dust for morphological development was aimed to be utilised from the milling process of timber scaffold of the bio-bot thereby intending to reduce the carbon footprint.
DESIGN IMPLEMENTATION
In order to fabricate the final morphologies computed in the design development phase, fabrication techniques for moulding and robotic extrusions were utilised after the physical material tests were being conducted and adequate techniques were determined.
Fig.96.
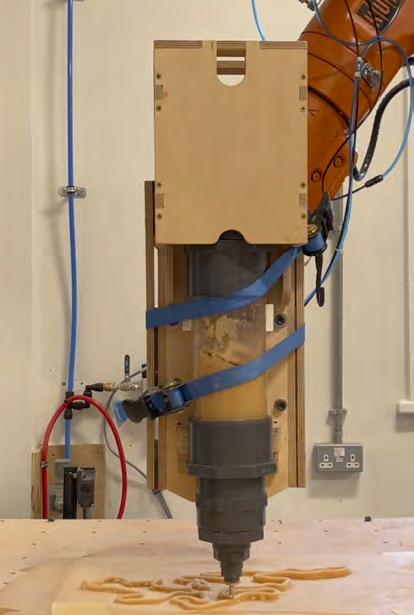
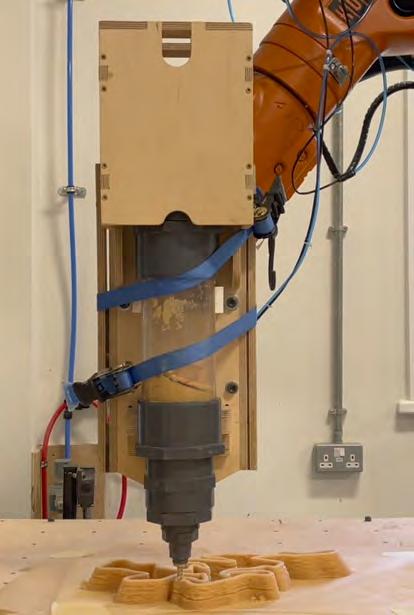
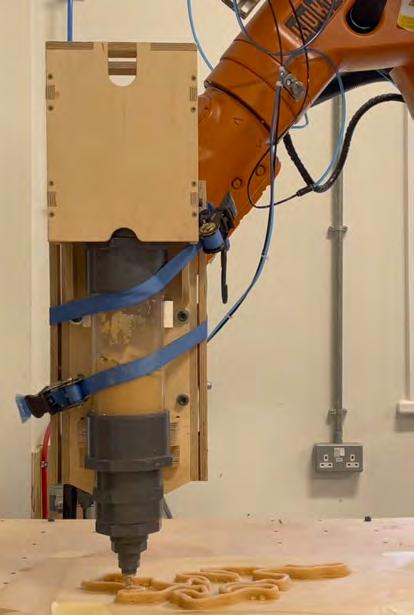
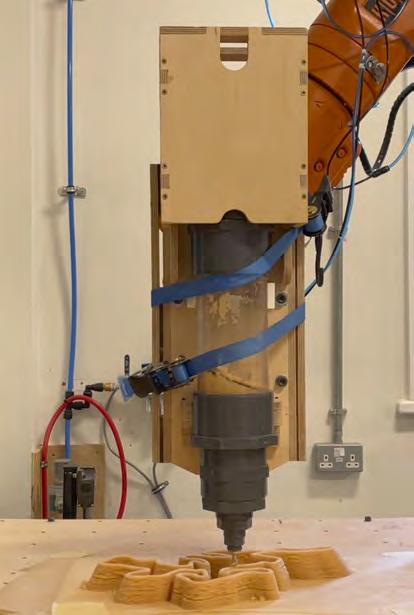
The physical characteristics of the designed morphologies consisted of long continuous pocket-like forms with manifolds to aid the circulation of water, in order to support the growth of medium shrubs and plants aimed to be fabricated by the extrusion technique. These morphologies were not aimed to be porous but to possess comparatively higher structural strength. Hence the methodology of extrusion using robotic end effector to extrude the saw dust resin mixture was utilised. After previously successful extrusion experiments, steps were laid out to fabricate 1/8th part of the morphology by extrusion methods. These generated forms, when rotated and adjusted along their central spherical axis , could be assembled to produce the final morphology, hence sufficing to the aim of modularity. (Fig..96).
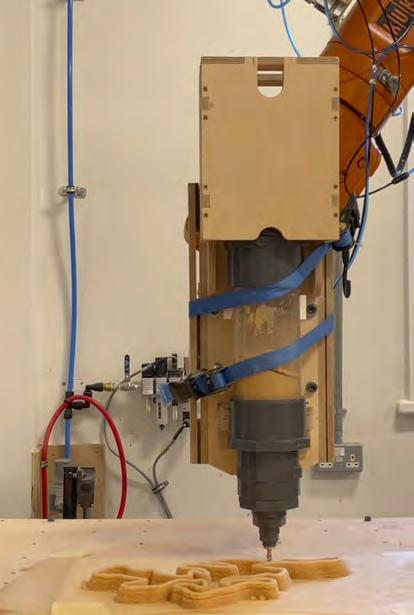
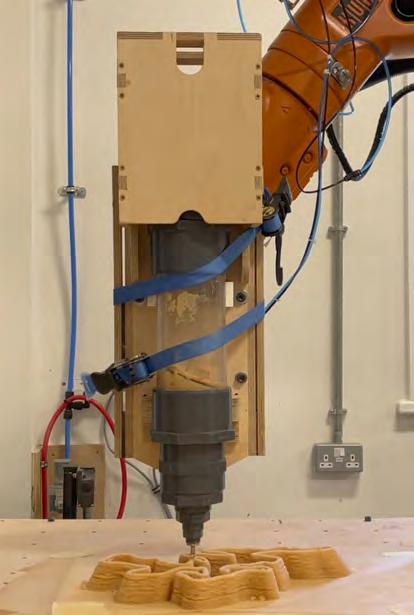
Experiment 3
Fig.97. Robotic extrusion of sawdust material on the flat surface;
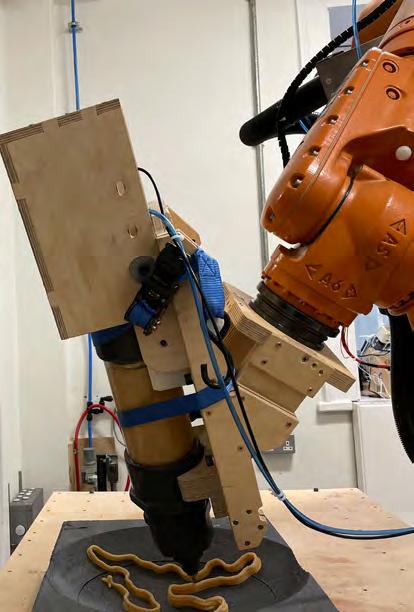
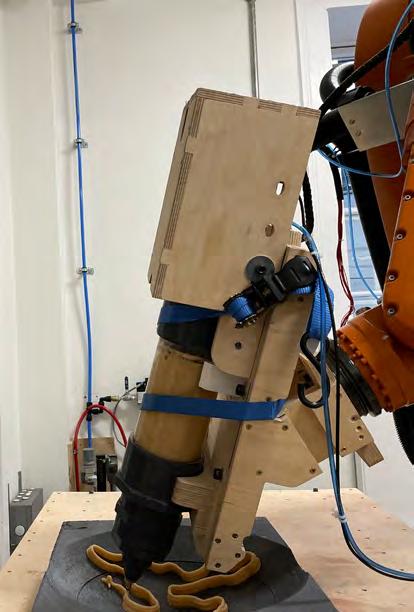
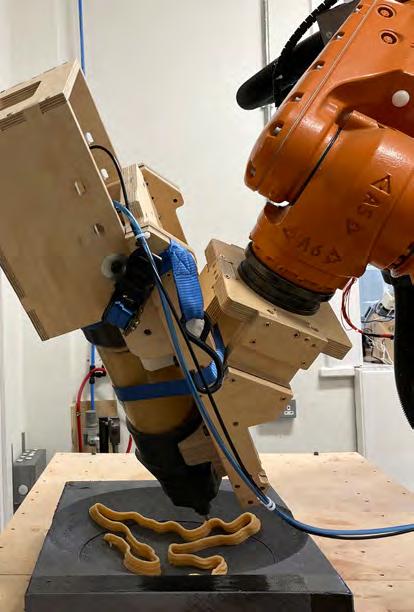
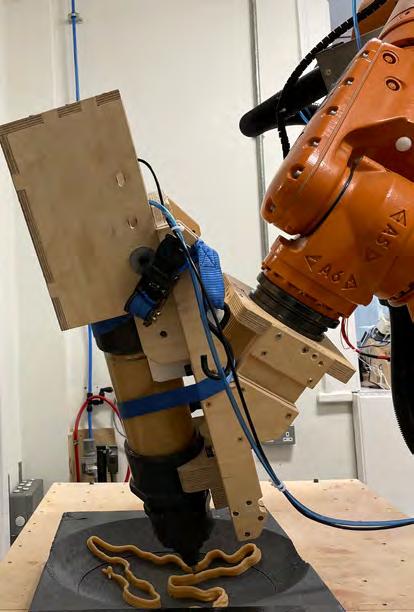
In order to execute this process, a hemispherical mould made from foam was milled. The radius of the hemisphere was equal to the radius of the morphology to be extruded. After the adequate mixture was being prepared for the extrusion, the final morphology was extruded on the hemispherical mould as a base, hence, the toolpath was developed based on these geometrical implications.
LIMITATIONS OBSERVED
The extruded morphologies were let to air dry at room temperature in a non-laboratory environment. The temperature, pressure and humidity levels were not controlled, leading to non uniformity in the air drying process. As a result, there was uneven contraction of material while drying, leading to generation of some shear cracks.
Fig.98. Robotic extrusion of sawdust material on the curved surface; Experiment 4
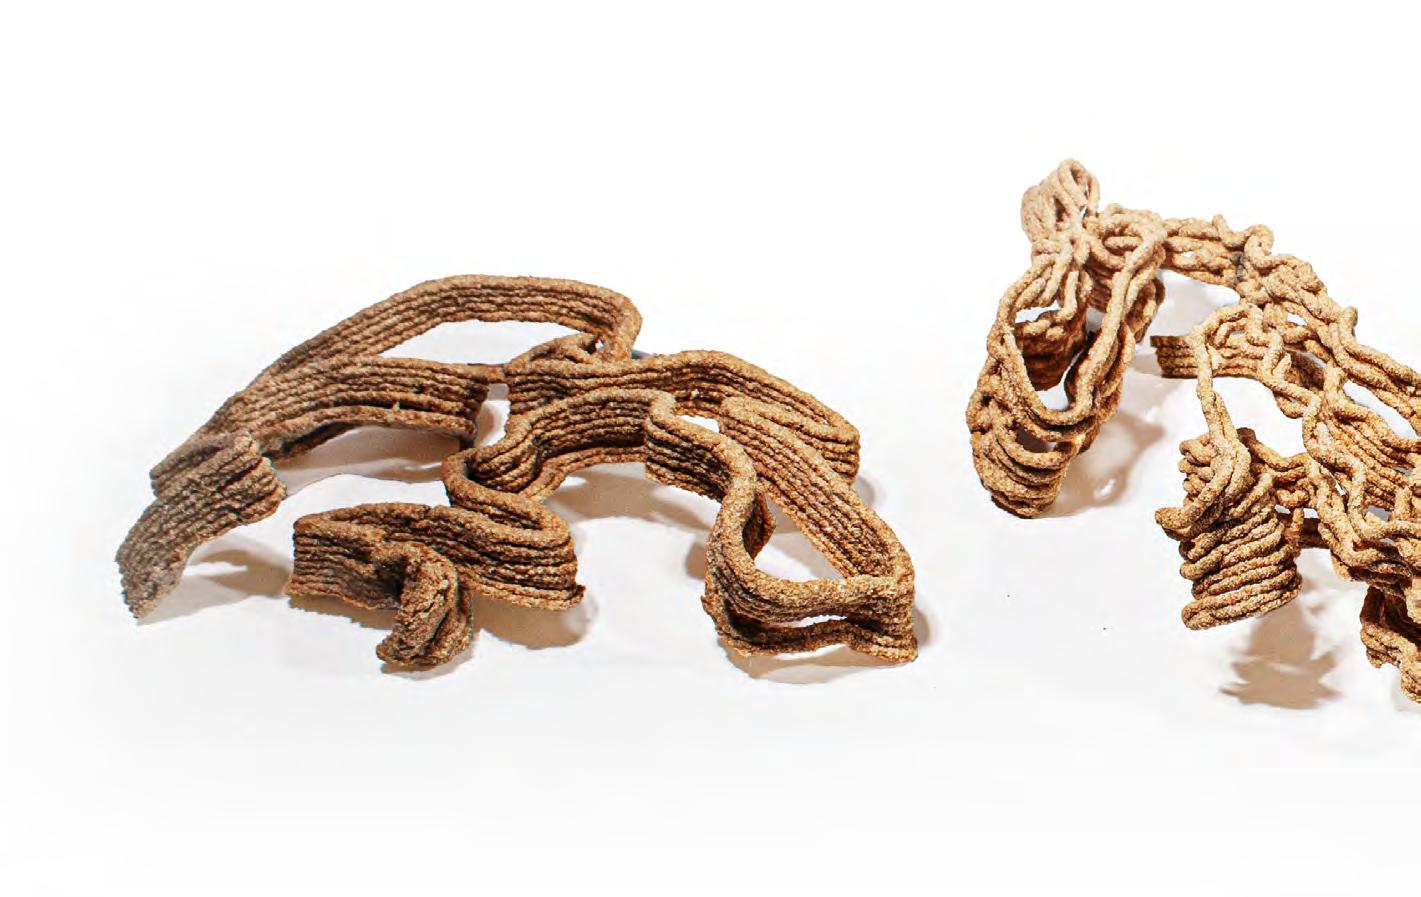
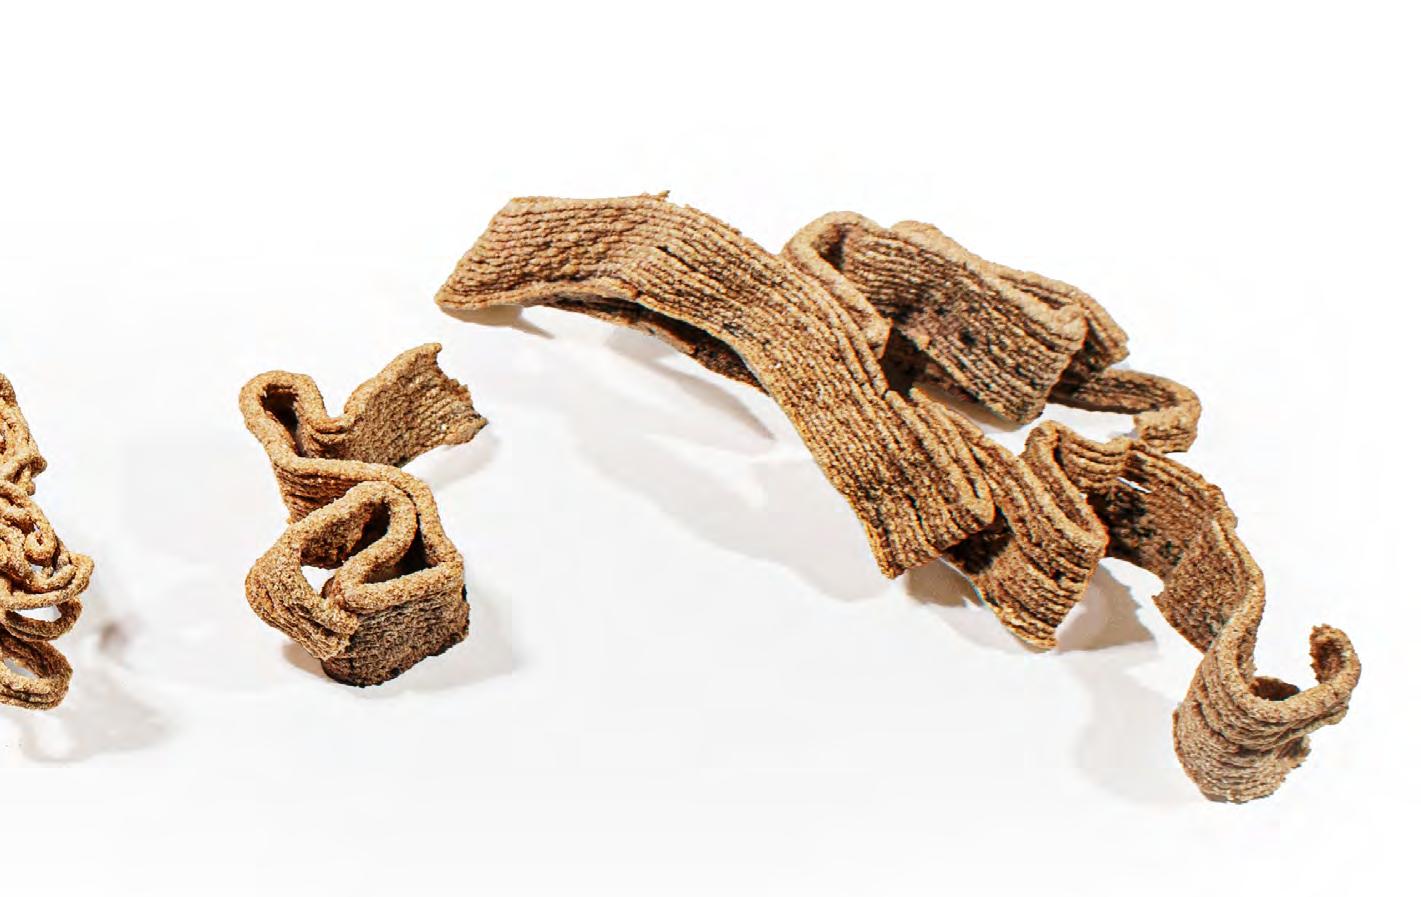
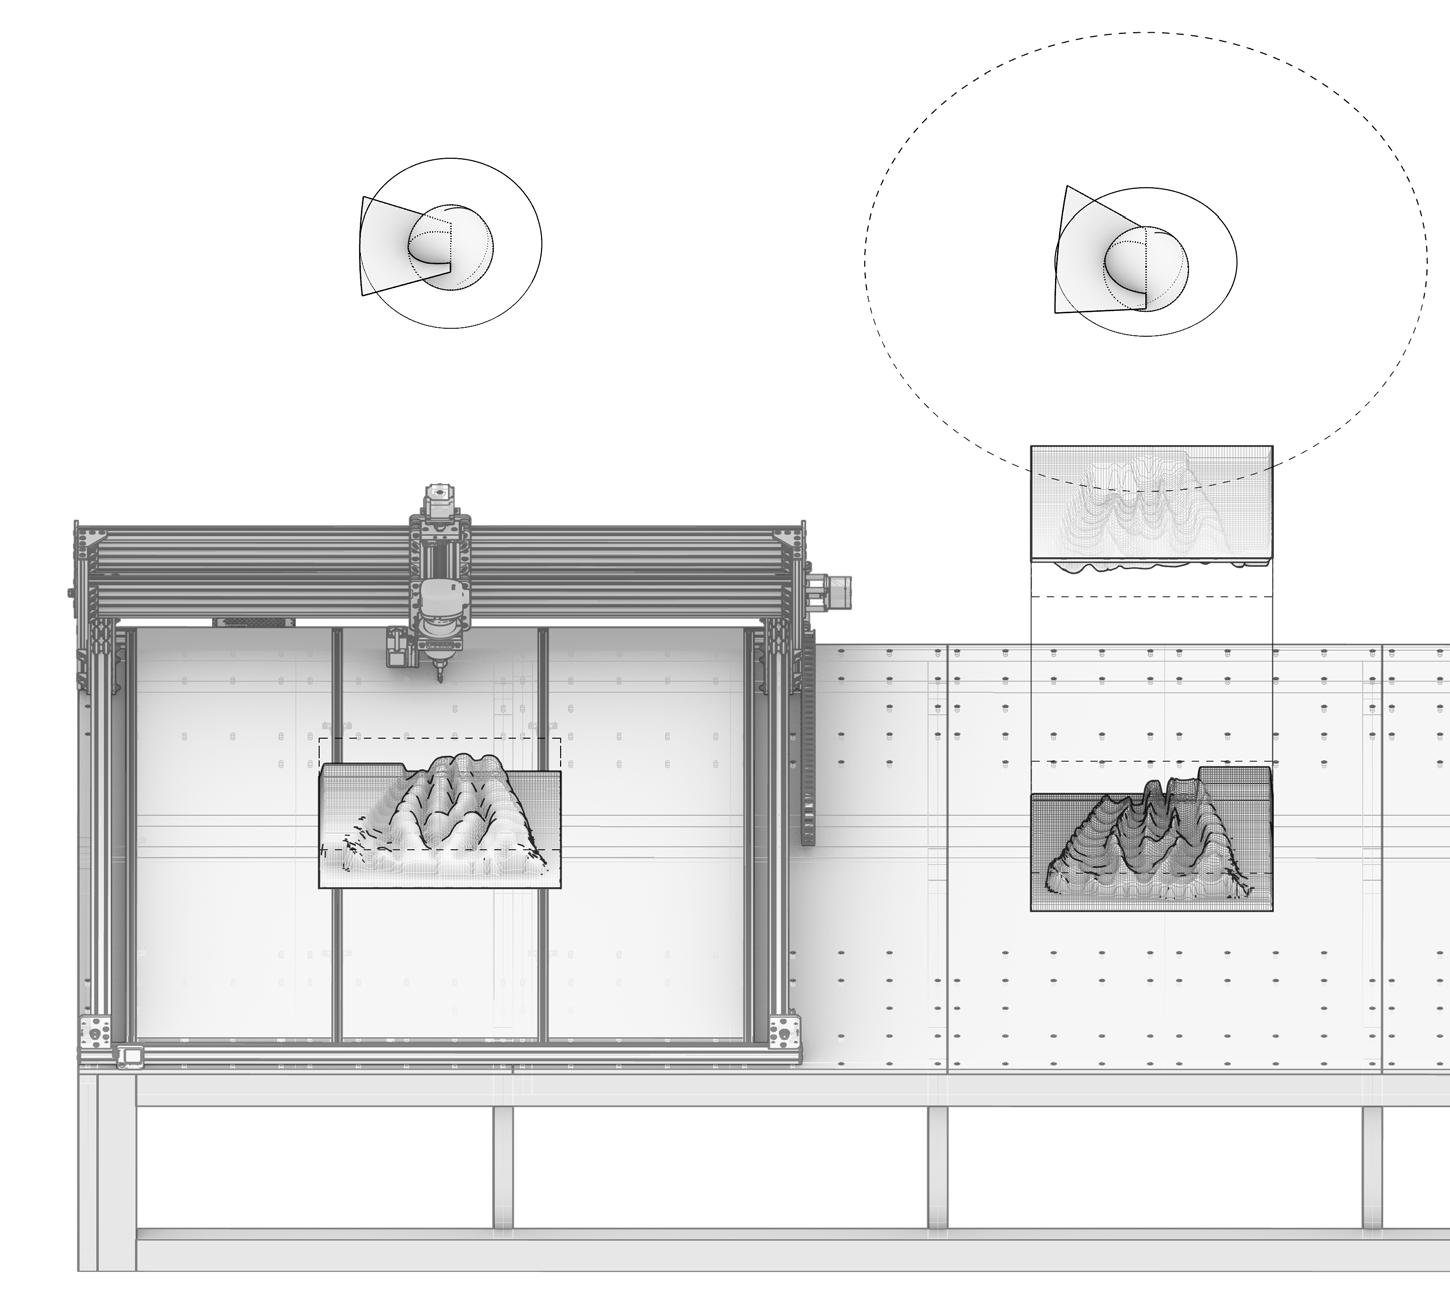

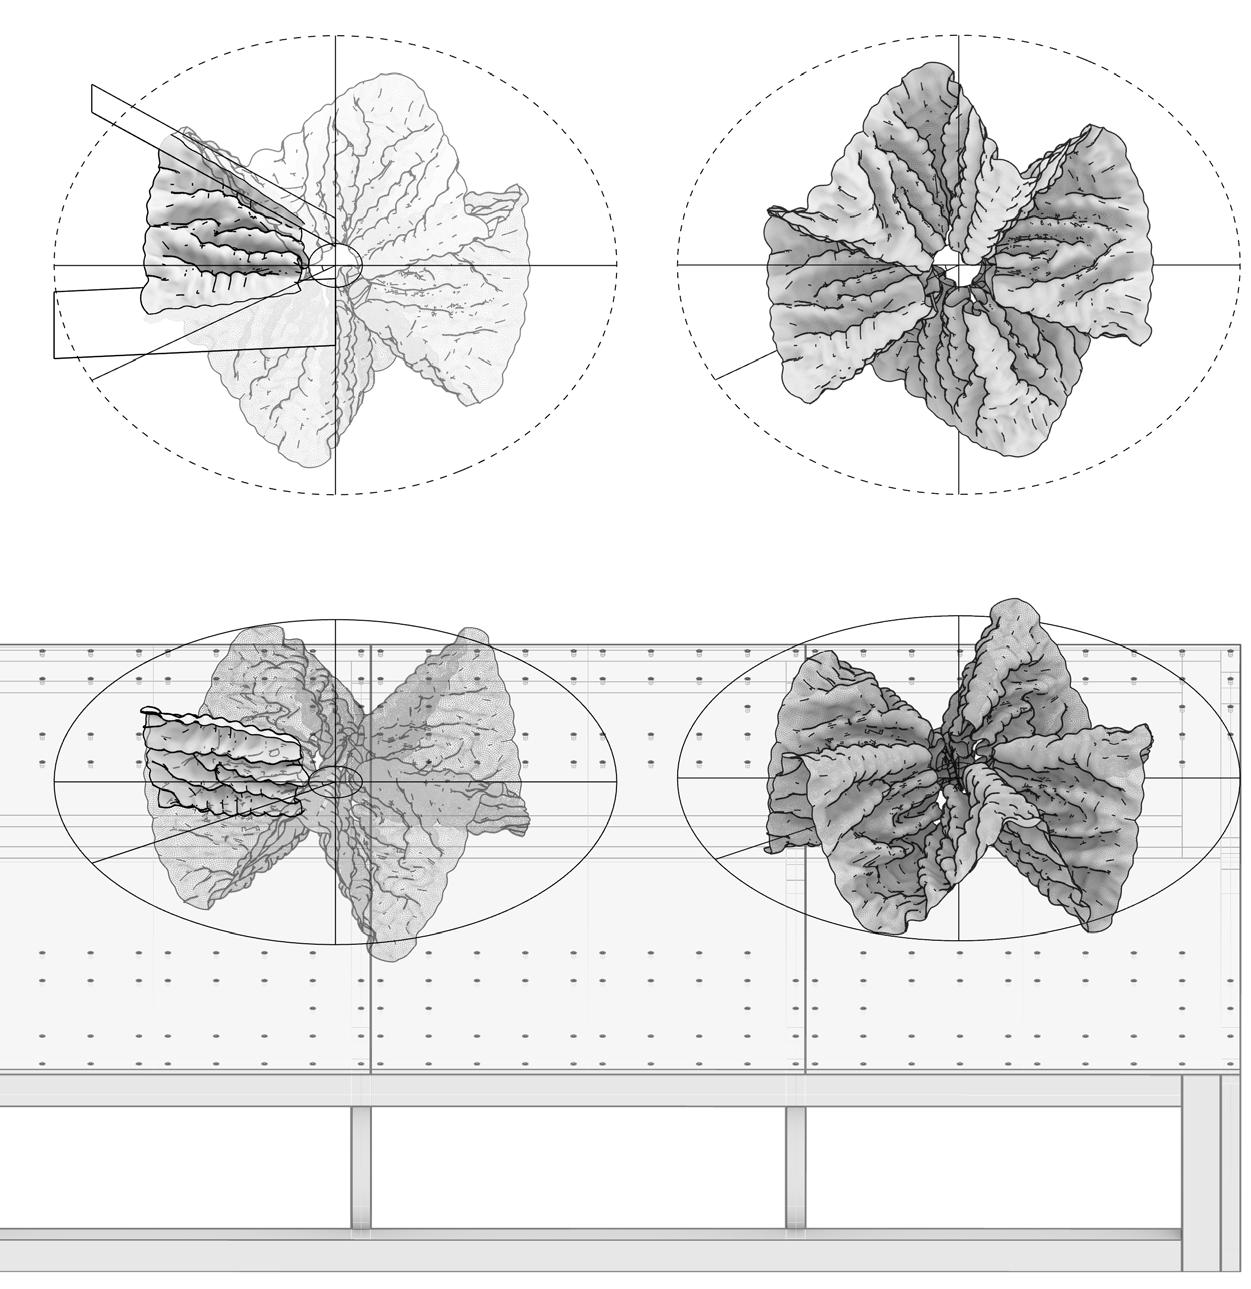
Logic for creation of the living tissue structure using CNC milling. The surface should be subdivided into flat morphologies
MOULDING
The physical characteristics of the designed morphologies that consisted of high surface area to volume ratio with manifolds, and algorithmically generated crevices, were being aimed to possess high porosity in order to support the growth of green living tissue and aid adsorption of black carbon. Therefore these morphologies were intended to be physically cast in the formulated biomaterial through moulding. After previously successful moulding experiments, steps were laid out to fabricate 1/8th part of the morphology by moulding methods (Fig. 99). This 1/8th part mirrored along the edges generated the full morphology to a full 360 degree circle.
Fig.99.
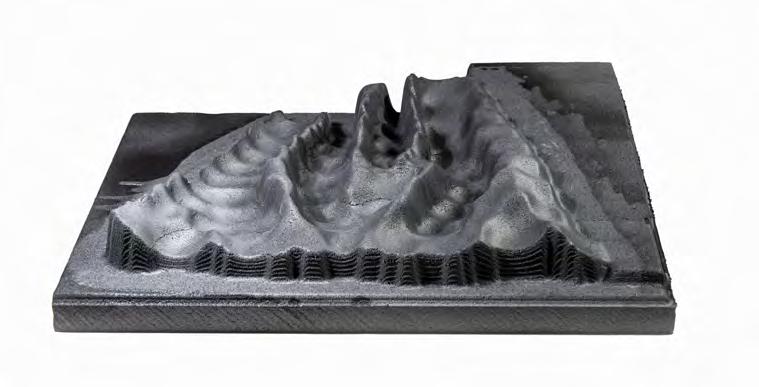
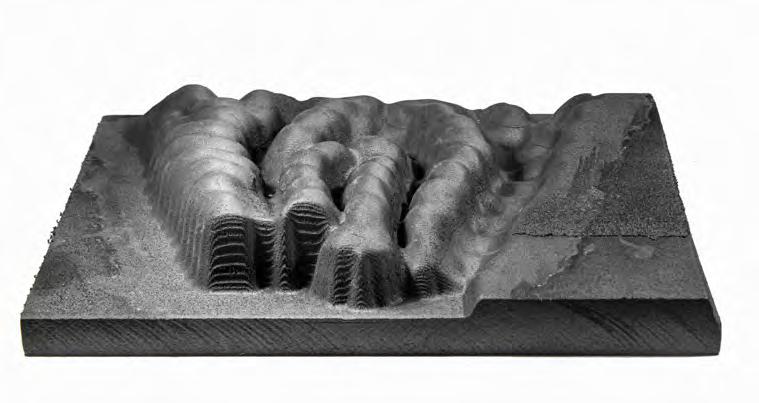
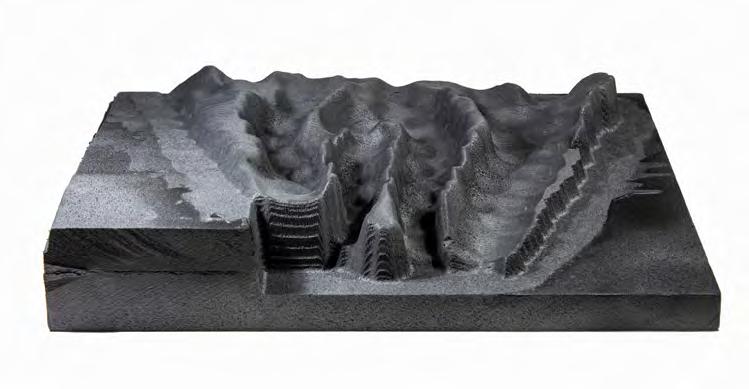
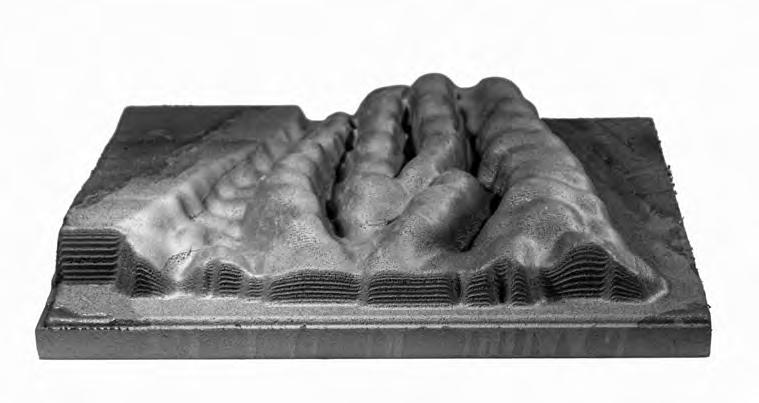
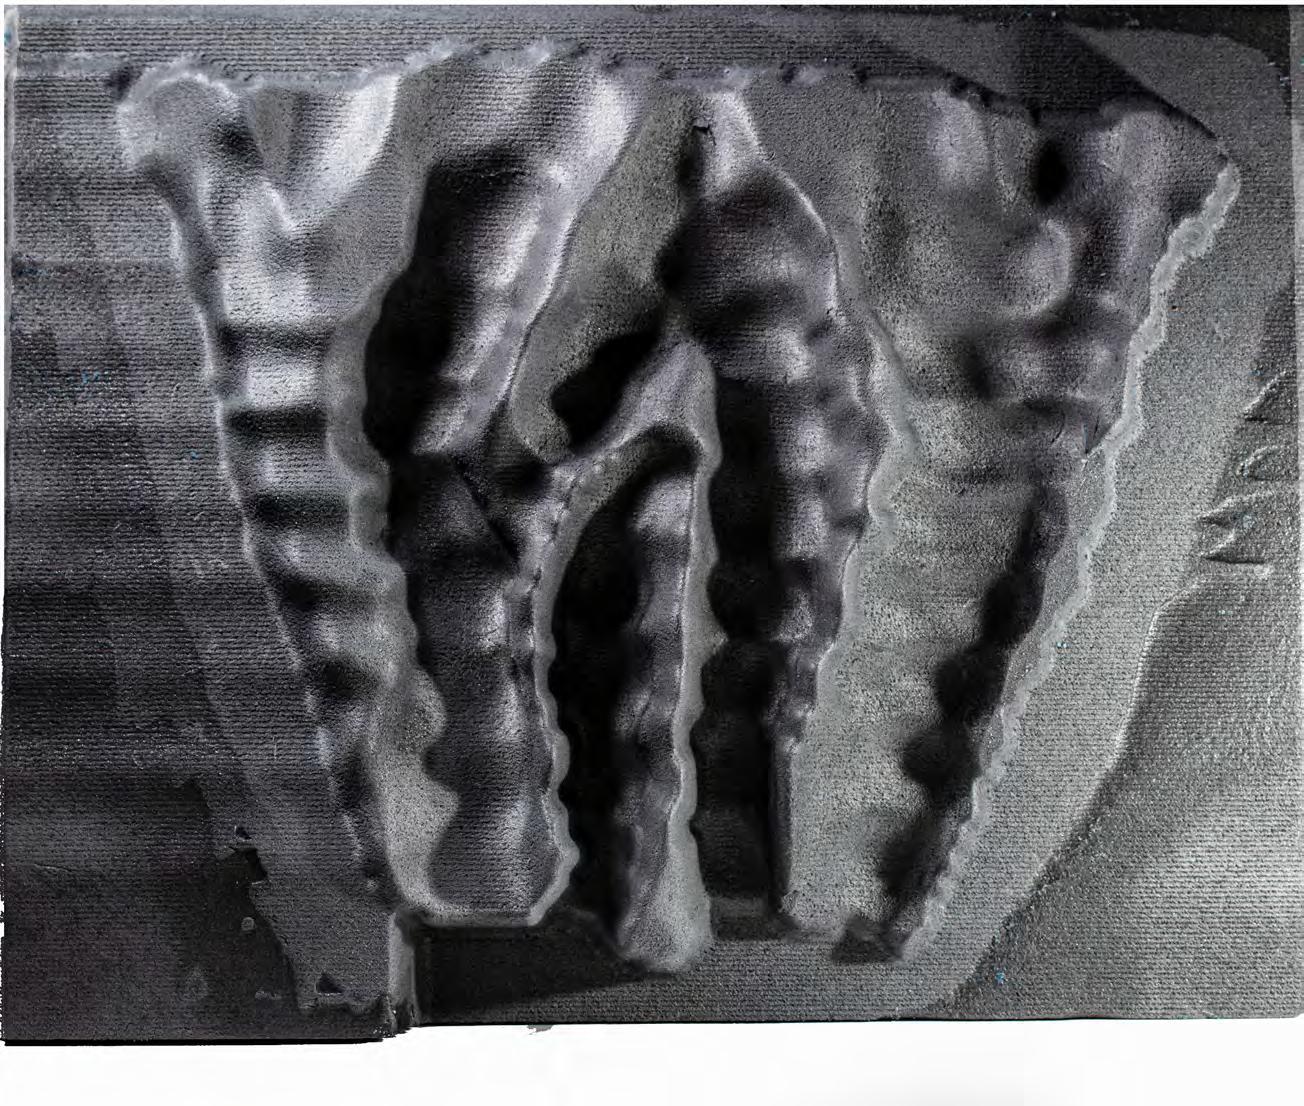
Fig.100. The living tissue structure surface made of foam after the CNC milling
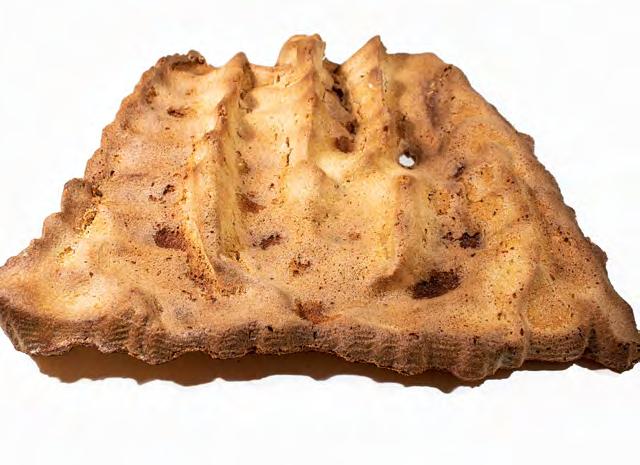
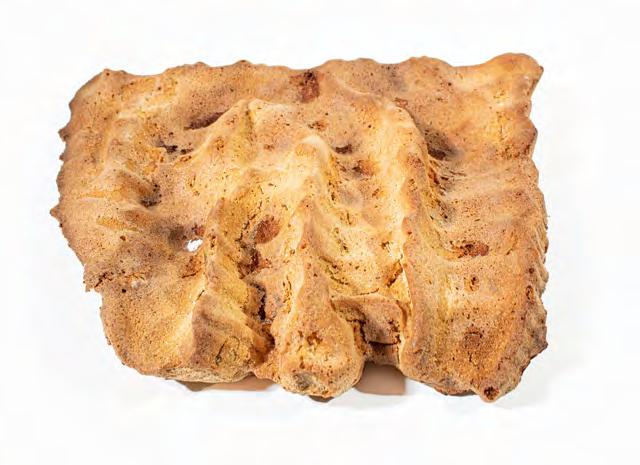
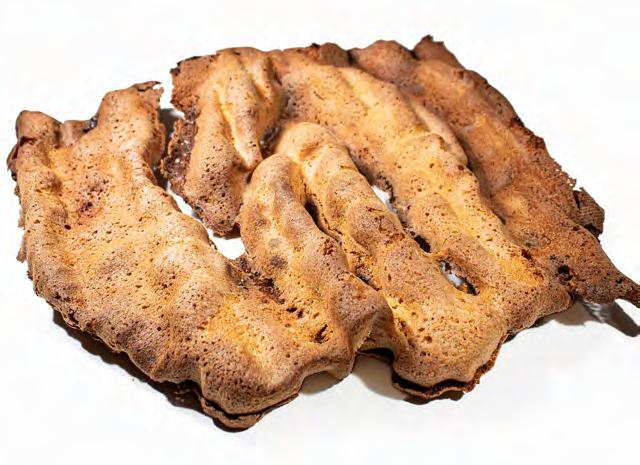
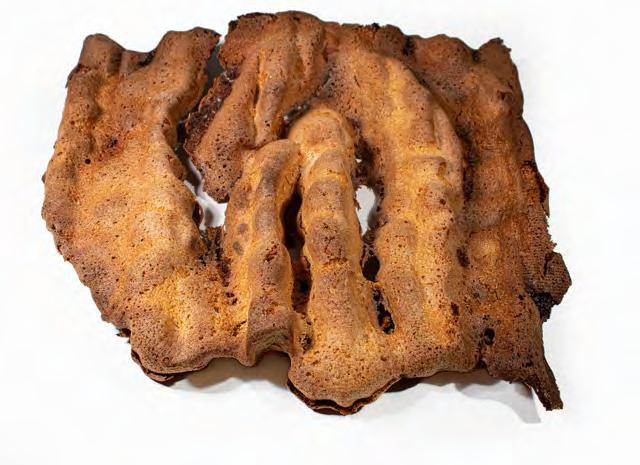
The process was executed with the help of creating double moulds. Firstly a mould for the 1/8th part of the morphology was created by milling a grey Roland foam, but since the foam mould is not feasible for baking, a second mould was cast using a thermosetting silicone with a high melting temperature of 500 C recast on the foam mould. The silicone mould was used as the final mould for casting the raw mixture of sawdust biomaterial composite to be baked further in the absence of oxygen at a temperature of 230 C.
Fig.101. The living tissue structure surface after baking in a silicone mould
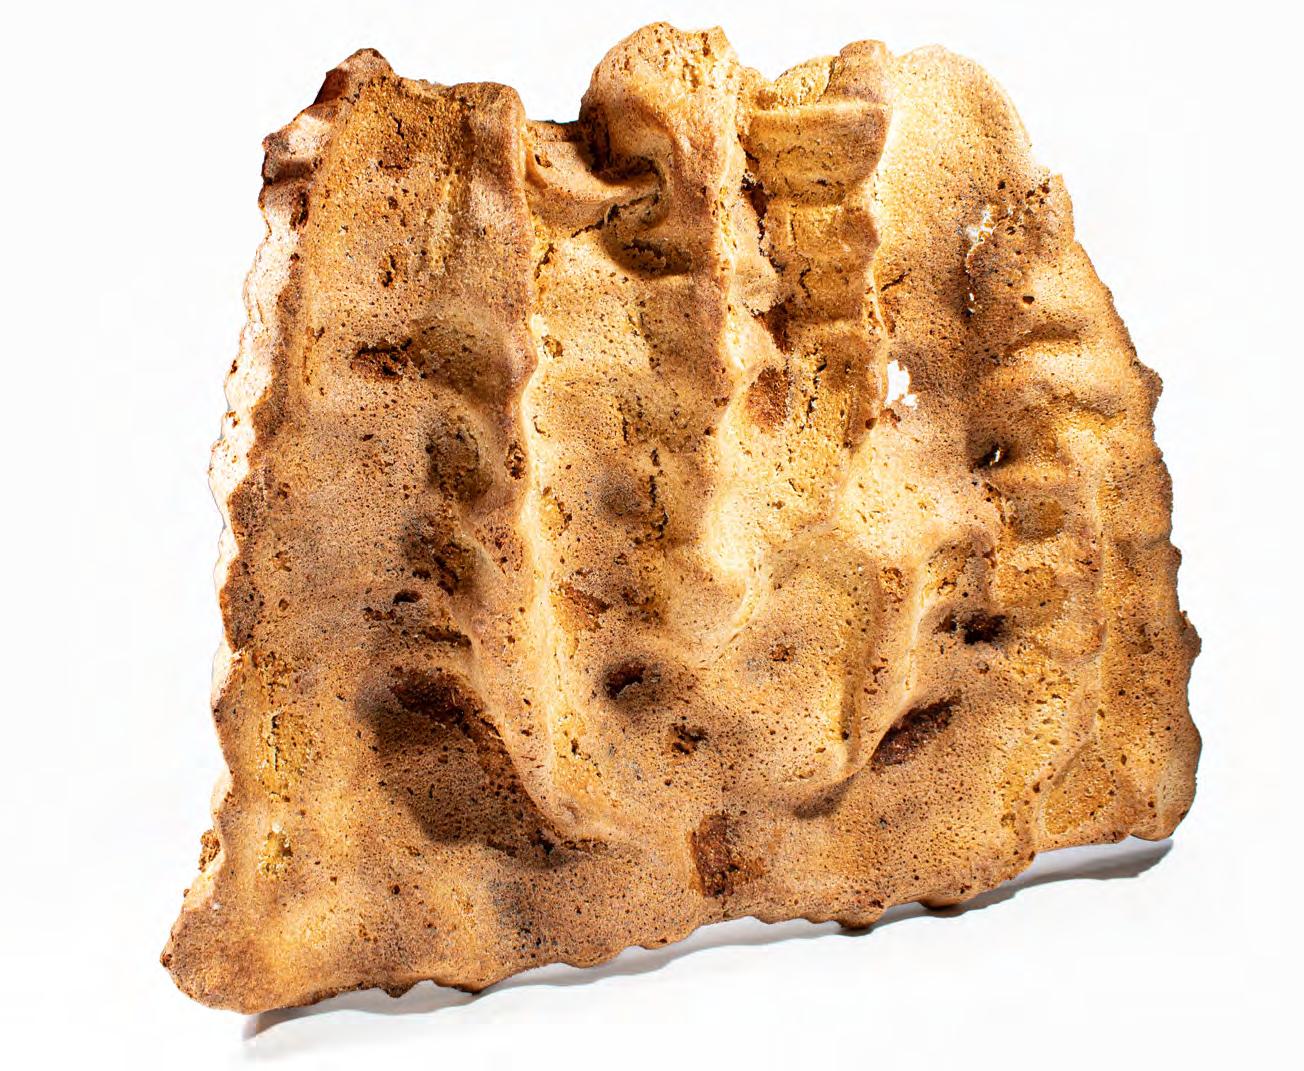
LIMITATIONS OBSERVED
The experiments were conducted in a home oven as opposed to an air-drying furnace. Hence, it could be observed that the heating was irregular, leading to crystallisation in certain regions.
Fig.102. The living tissue structure surface after baking in a silicone mould
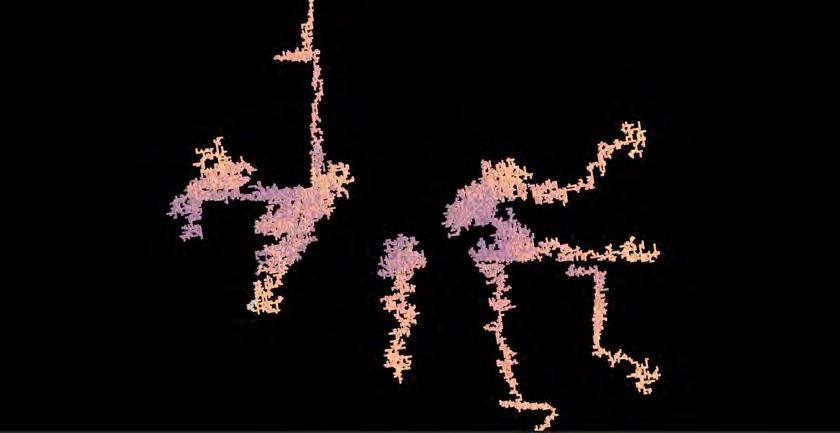
NETWORK DEVELOPMENT
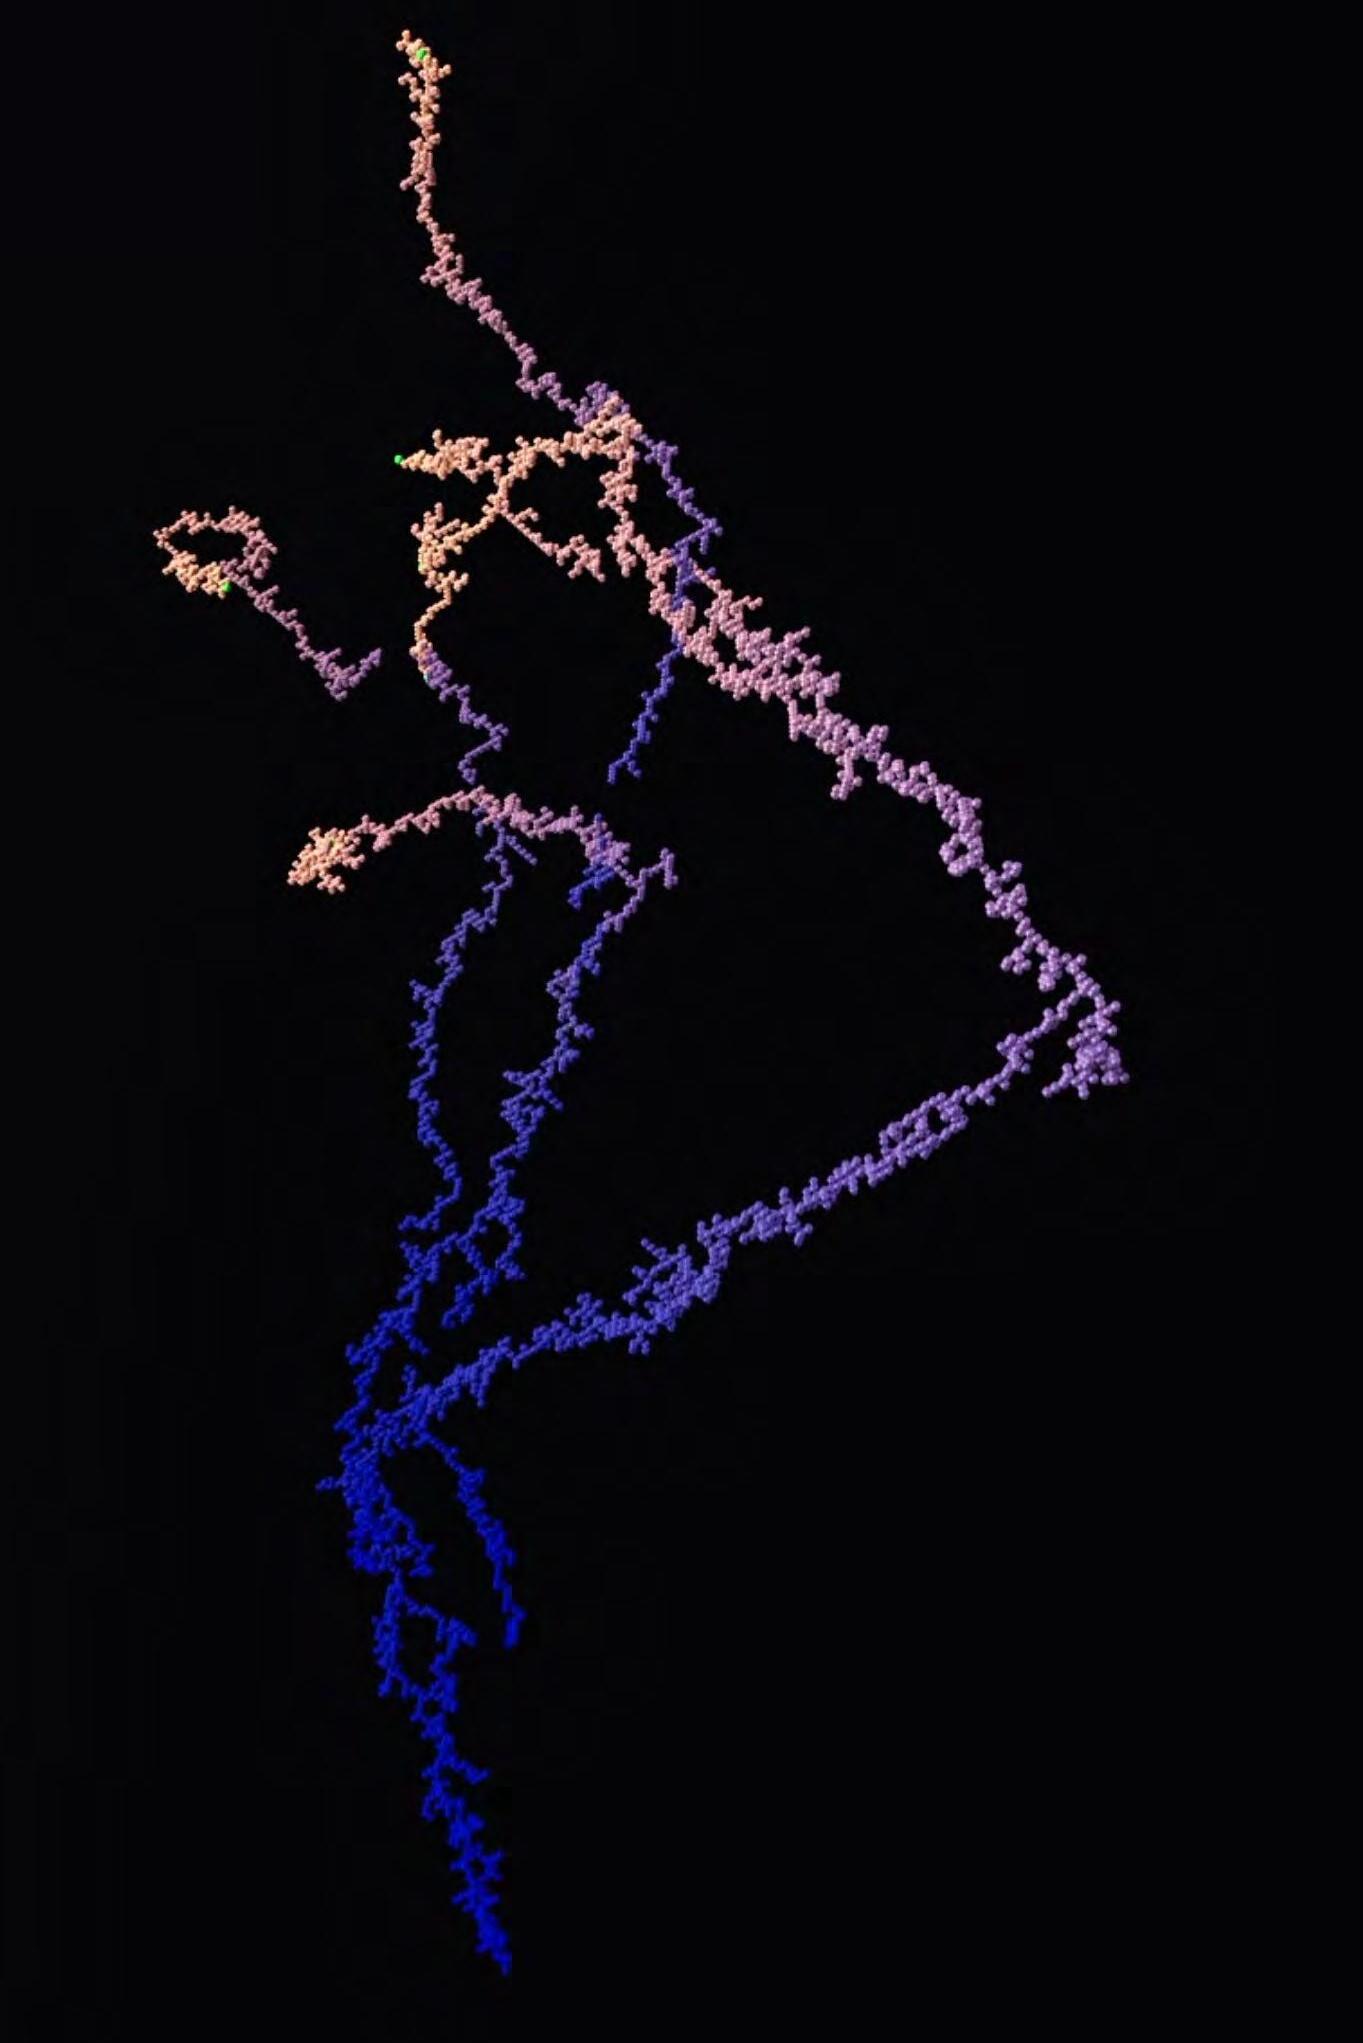
DLA AGGREGATION
Diffusion Limited aggregation algorithm was implemented to generate the network. According to MIT AI Laboratory: 110 a broad category of behaviour known as diffusion-limited aggregation underlies a number of dendritic growth-related phenomena, including the development of ice on a window pane, lightning and sparks, and urban sprawl. The particles or individual units that make up a specific “resource” diffuse freely until they are caught by and help to form a static structure. “The clusters generated by this process are both highly branched and fractal.”111 Diffusion Limited Aggregation (DLA) is used as a framework for generating networks that produce highly branched and fractalised forms. DLA is an appropriate method to necessitate the connection to multiple green spaces which begin to split at several locations. (Fig..102)
Fig.102. Attracted DLA algorithm growth example
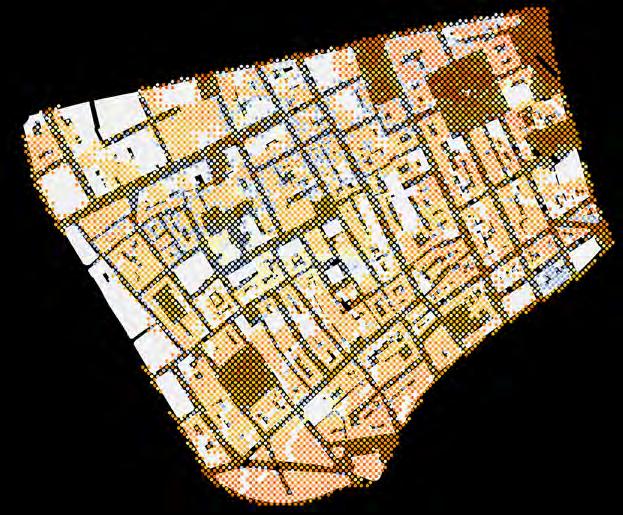
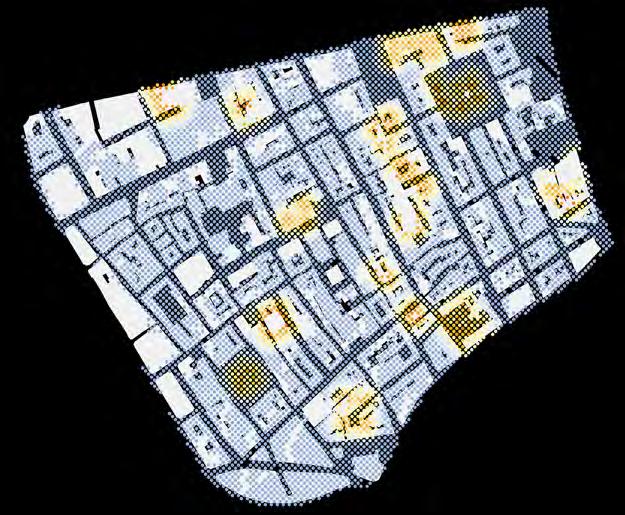
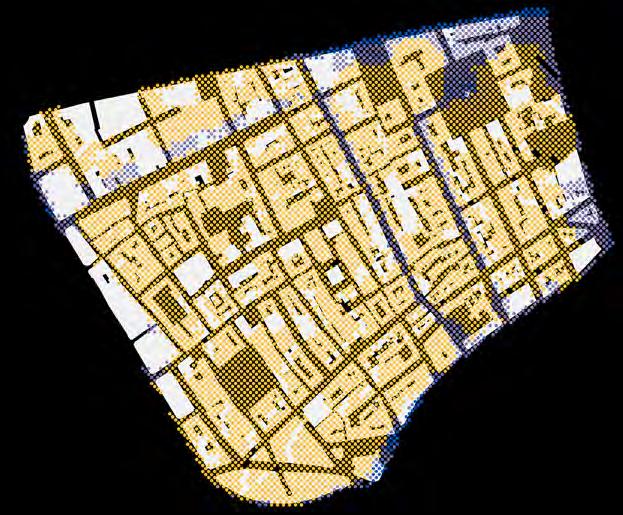
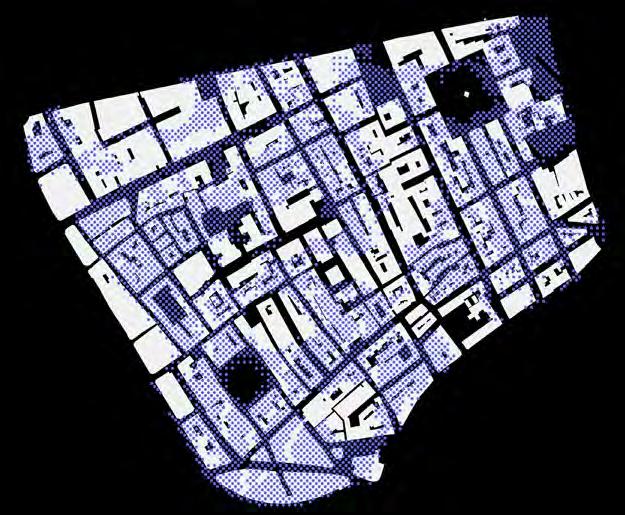
An analysis method was conducted in the design problem algorithm to examine the environmental parameters and their impact on the heat island effect. In order to define the exact area of the network implementation, several environmental parameters and their values were reevaluated to define the area with the highest heat island effect parameters; defined as the area for investigation. Generated data directly informed the area of investigation and simultaneously their functional distribution by running a comparative analysis between these parameters. The analysis extracted the exact quantities of each module that should be implemented in this particular area of investigation and their relationships to other problematic areas. For this goal, several further assessments were carried out, focusing in particular on sun exposure, heat emission, pollution, and green connectedness. The field of points was generated considering building constraints and subsequently, these points were tested toward the above-listed parameters.
An analysis method was conducted in the design problem algorithm to examine the intensity of the solar gain on the generated field of points. Points were taken into consideration as a potential area of the research in the case where the exposure received by the created field exceeds a specified threshold-, more than 8 vector hits out of 10 possible vector hits. Conducted heat emission analysis revealed areas
Fig.103. Solar radiation analysis
Fig.104. Connectivity of existing green tissue
Fig.105. Pollution mapping
Fig.106. Extracted area of implementation that has high heat island effect parameters
Solar radiation | Heat emission (Fig..103)
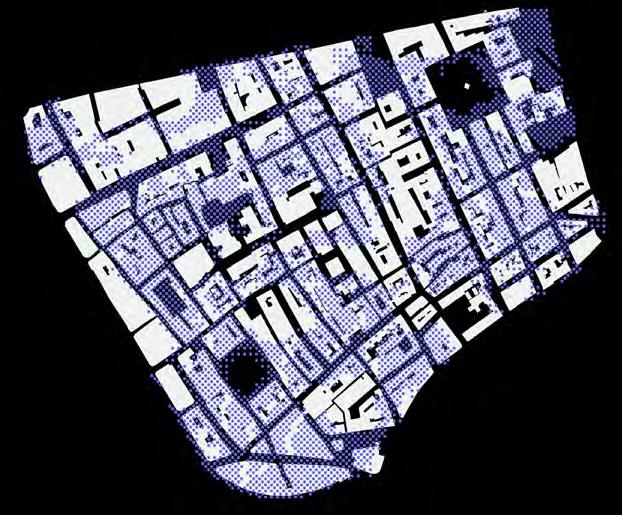
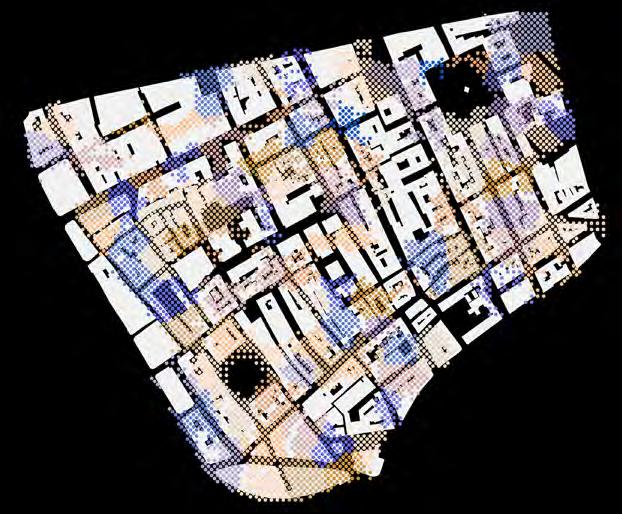
Fig.107. Extracted area of implementation that has high heat island effect parameters
Fig.108. Clustering of the first order (10 clusters)
Fig.109. Subsequent clustering strategy
Fig.110. Extracted centre of each cluster
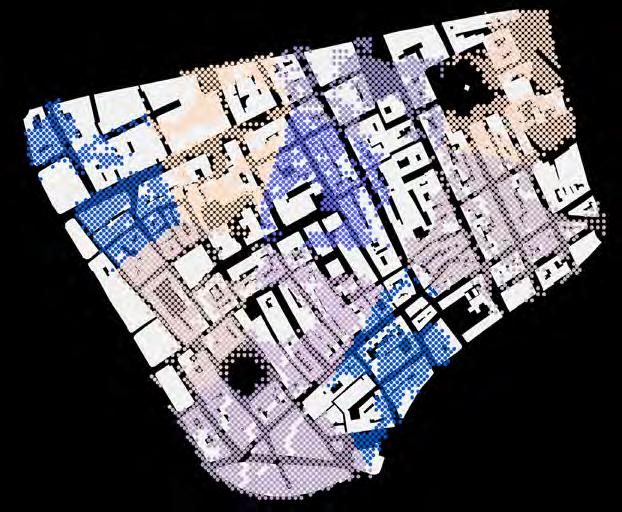
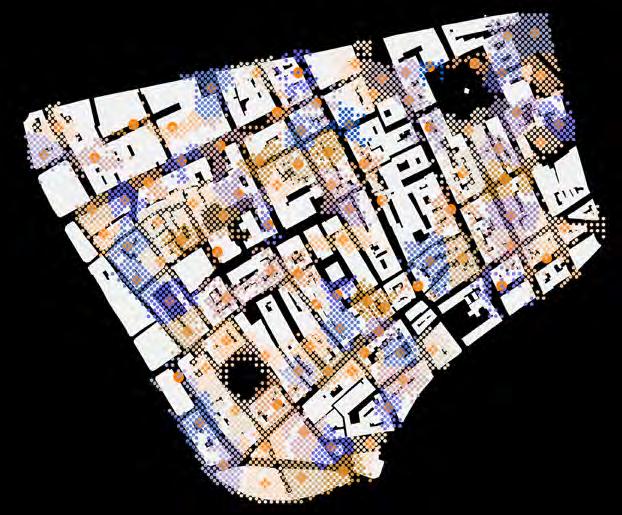
with high thermal conductivity. The parameters obtained in the solar gain analysis were remapped considering the thermal conductivity of the materials. Therefore, solar radiation analysis applied on the heat emission map revealed the area of implementation.
Green network connectivity (Fig..104)
The existing green network was tested in order to identify disconnection from regional green network areas. The connectivity was analysed by measuring distances between existing natural landscapes. The threshold for considering green areas connected was established at 25 metres. The threshold was established according to experimental results conducted in the article “Bumblebee Movement in a Fragmented Agricultural Landscape”; bumblebees forage on flower patches mainly at the distance of 25 metres from their hive. However, sometimes they were observed at a distance of 250 metres from the nest. Therefore, the average distance of 25 metres was input as the maximum distance between the green area. All points which were located out of the 25 metres threshold were considered as possible areas for investigation.
Area of investigation (Fig..106)
In order to identify the area of investigation, the above-described analyses were combined, such that each point located in the generated field obtained 3 values. These values were remapped from 0 to 10 in


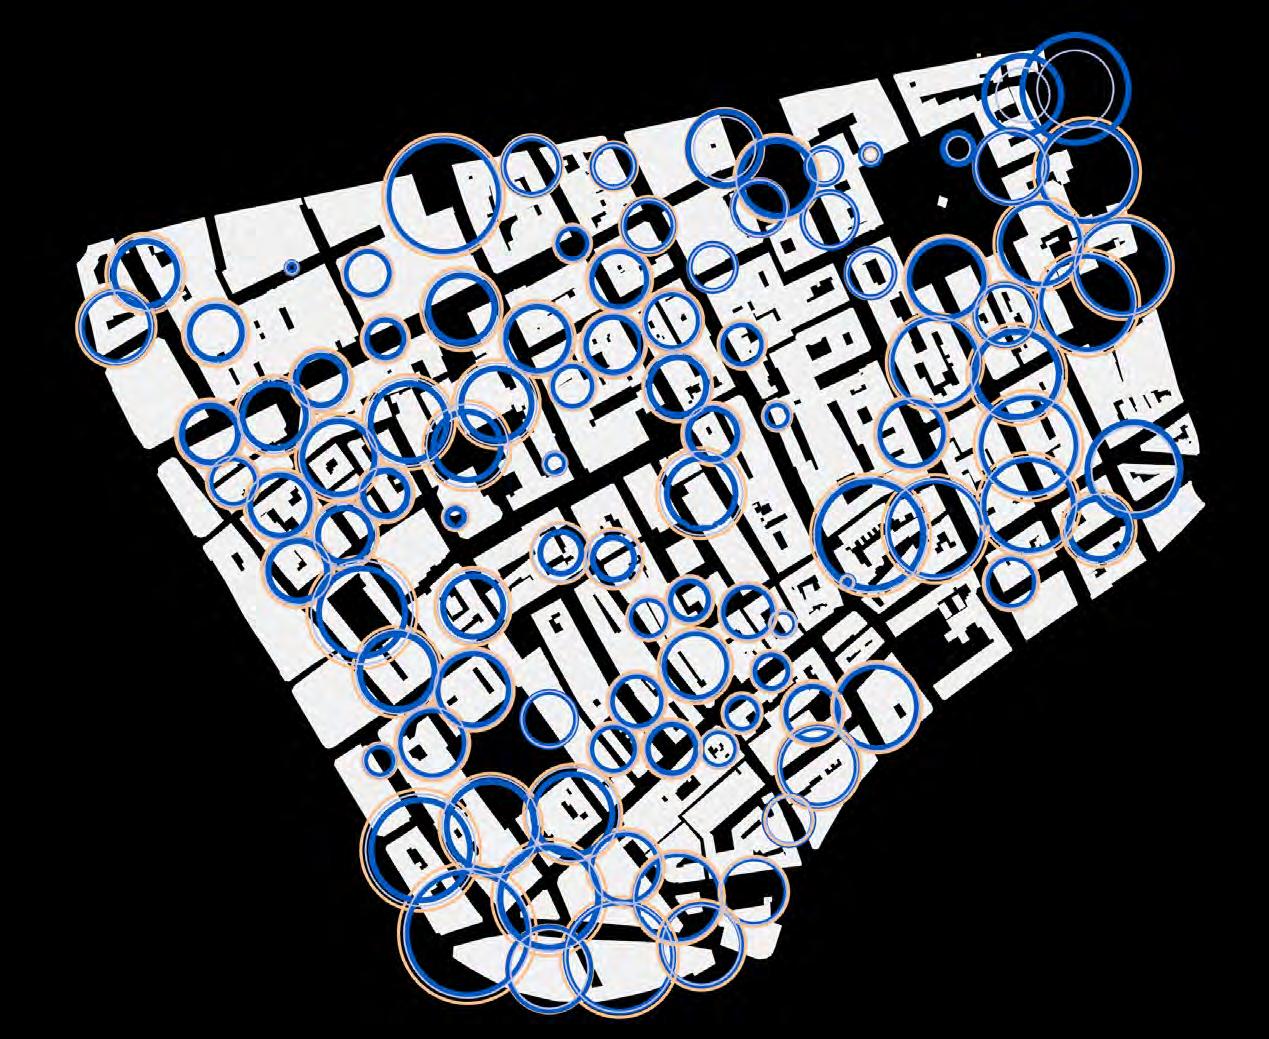
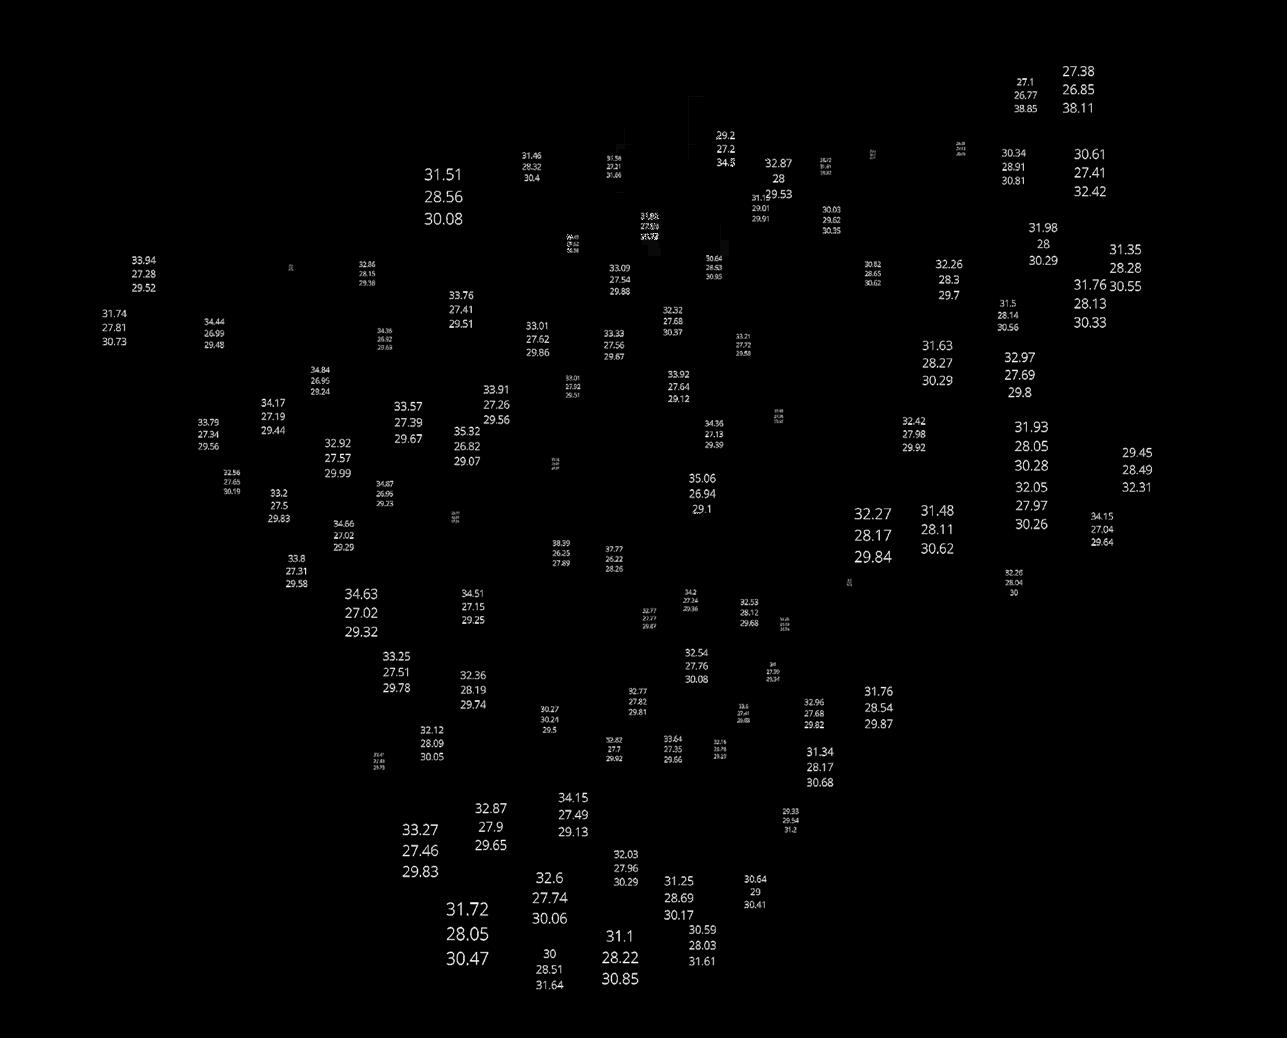
order to receive comparative parameters. Therefore, points which achieved higher than 25 in sum were identified as an area for investigation.
Clustering strategy (Fig..107-109)
In order to receive particular parameters for network implementation, the area has to be subdivided into smaller regions to have a comparison of the parameters and their impact on the functional distribution. The generated area of investigation was subdivided into 10 clusters using a machine learning Gaussian clustering algorithm. Subsequently, each cluster was subdivided once more. This subdivision was implemented as each previously obtained cluster had different environmental parameters ie. high heat island effect area, therefore in order to define the exact number of areas for implementation, each cluster had to be tested individually. The number of second-level sub-clustering should be tested as it influences the number of the attractor points- areas of intervention and their values.
Attractor points (Fig..112)
Subsequently, each cluster was analysed individually and as a whole in order to receive the particular number, weight and area of influence for the attractor points. The average point or centre of a cluster was
Fig.111. Percentages of Production_protection, Filtration_production and filtration functions;
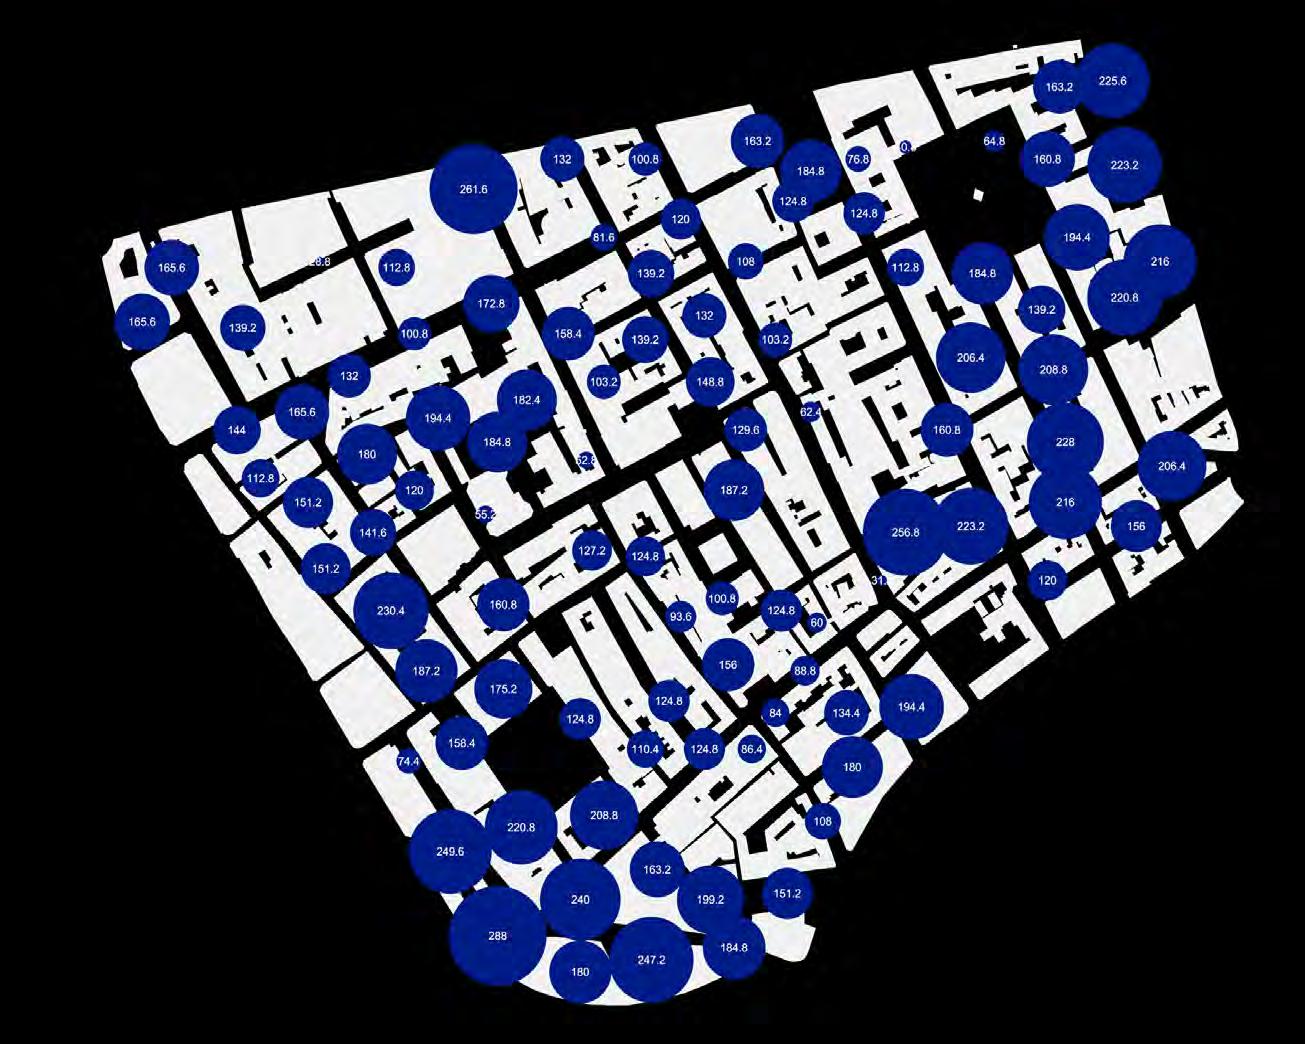
extracted from previously generated groups. The next step was the analysis of the cluster parameters remapped to the number of points located in the cluster. This step revealed the area of investigation in relation to other areas and informed the weight and particular area of impact for each attractor point. Finally, the values obtained for each attractor point were re-evaluated and informed the particular percentage of each function needed to impact the problem of the area.
In order to identify the exact number of functional modules needed their performance, particularly CO2 absorption rate and O2 production rate, were evaluated. Previously obtained values for attractor points were reevaluated according to the performance of each module. This step revealed the exact number of each module to implement within the network. In order to establish a relationship between the quantity of materials used in formulation of the design morphologies based on their functions and their performative aspects, quantities identified in similar research experiments had been referred to as a basis of information. However these quantities are subject to further justification and experimentation in this research. Although, It was stated that 470 g carbon dioxide could be absorbed by 1000ml of activated saw dust composite undergone through pyrolysis. 113 1000ml of algal solution could absorb 8.27 grams of carbon dioxide and release 6.03 g of oxygen114 which was used as fundamental information for quantification of the Collection_Filtration module as it can be further translated to further calculate the raw material required for desired quantification.
Fig. 112. Area of implementation and requared number of modules to impact CO2 emmision;
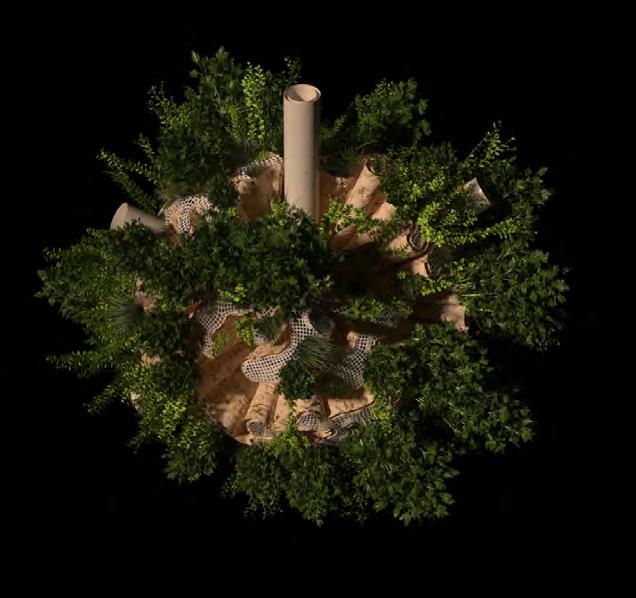
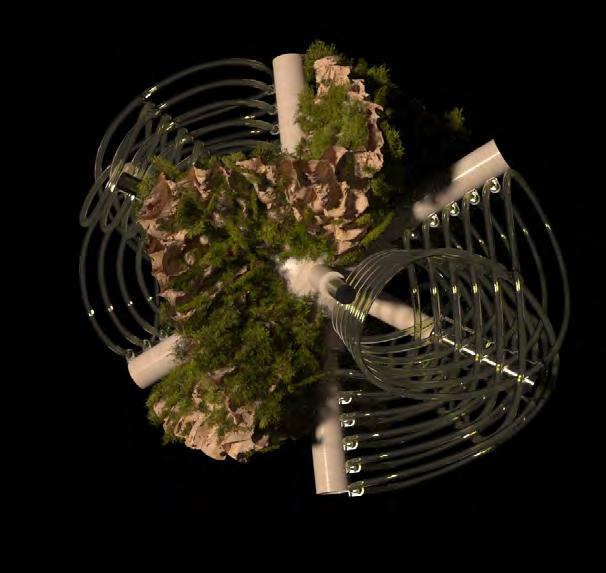
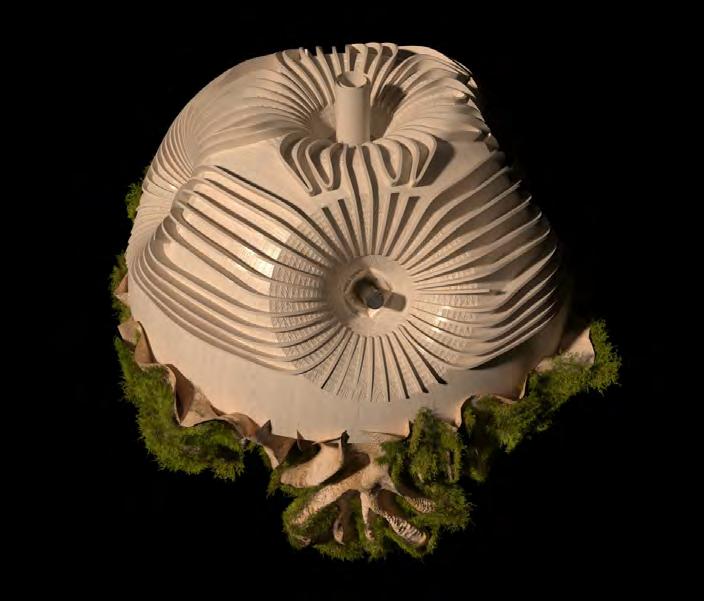
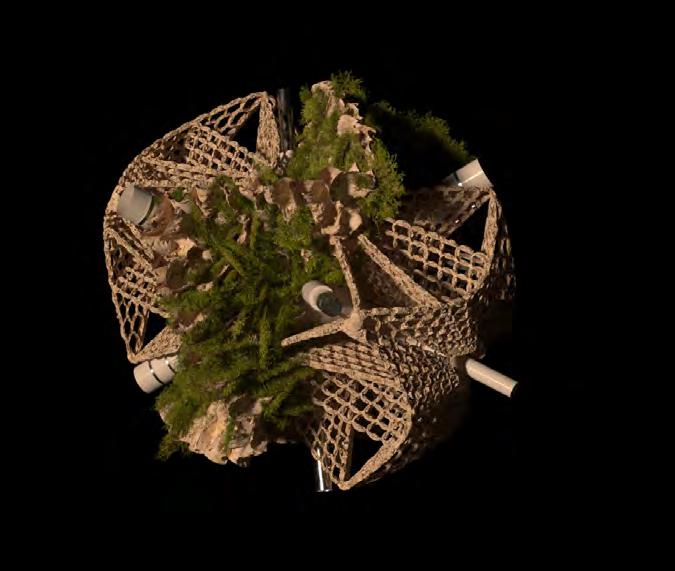
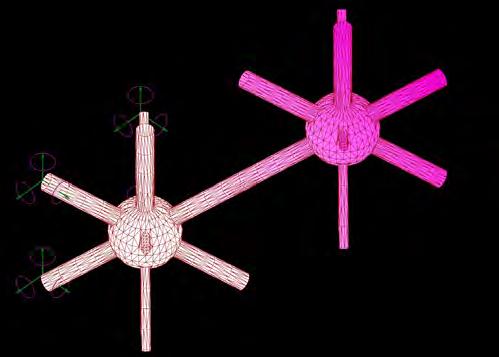
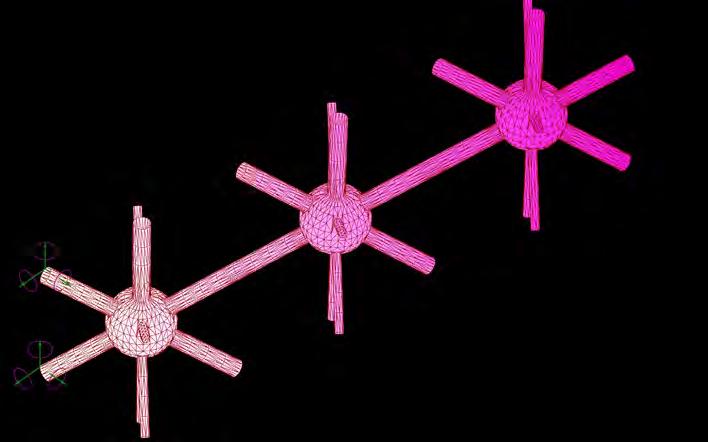
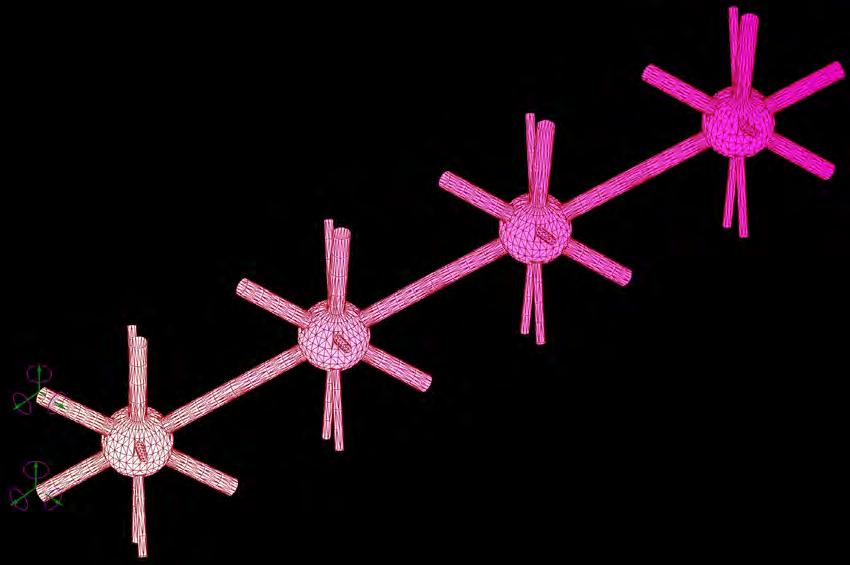
In order to understand the cantilever limitations that should be implemented within the network generation framework, the finite element analysis was conducted. The analysis was set up for testing using the Karamba plugin for Rhino | Grasshopper. The analysis was conducted on a variety of connected structures using only 2 points of connection to the building and analysed from 2 to 6 connected modules. (Fig..114-115) As the structure of the modules consists of wood, wood was implemented in the analysis to understand the real parameters of displacement. The FEA analysis was tested considering the worse case scenario- particularly the linear aggregation of modules. As a visual representation, displacement results shown have been increased 50 times.

Material: wood; Cantilever: 1.9 m;
Cross-section: 1.5cm;
Supports: wall connection;
Load: self-weight;
Displacement: 0.04 cm
Load: wind pressure 0.0072 kPa
Displacement: 0.028 cm
Material: wood; Cantilever: 2.7 m;
Cross-section: 1.5cm;
Supports: wall connection;
Load: self-weight;
Displacement: 0.34 cm
Load: wind pressure 0.0072 kPa
Displacement: 0.46 cm
Material: wood; Cantilever: 3.4 m;
Cross-section: 1.5cm;
Supports: wall connection;
Load: self-weight;
Displacement: 1.27 cm
Load: wind pressure 0.0072 kPa
Displacement: 1.33cm
Finite element analysis ;
Fig.114.
Material: wood; Cantilever: 4.2 m;
Cross-section: 1.5cm; Supports: wall connection; Load: self-weight; Displacement: 3.43cm
Load: wind pressure 0.0072 kPa
Displacement: 3.28 cm
Material: wood; Cantilever: 5 m; Cross-section: 1.5cm; Supports: wall connection; Load: self-weight; Displacement: 7.76 cm
Load: wind pressure 0.0072 kPa
Displacement: 5.3 cm
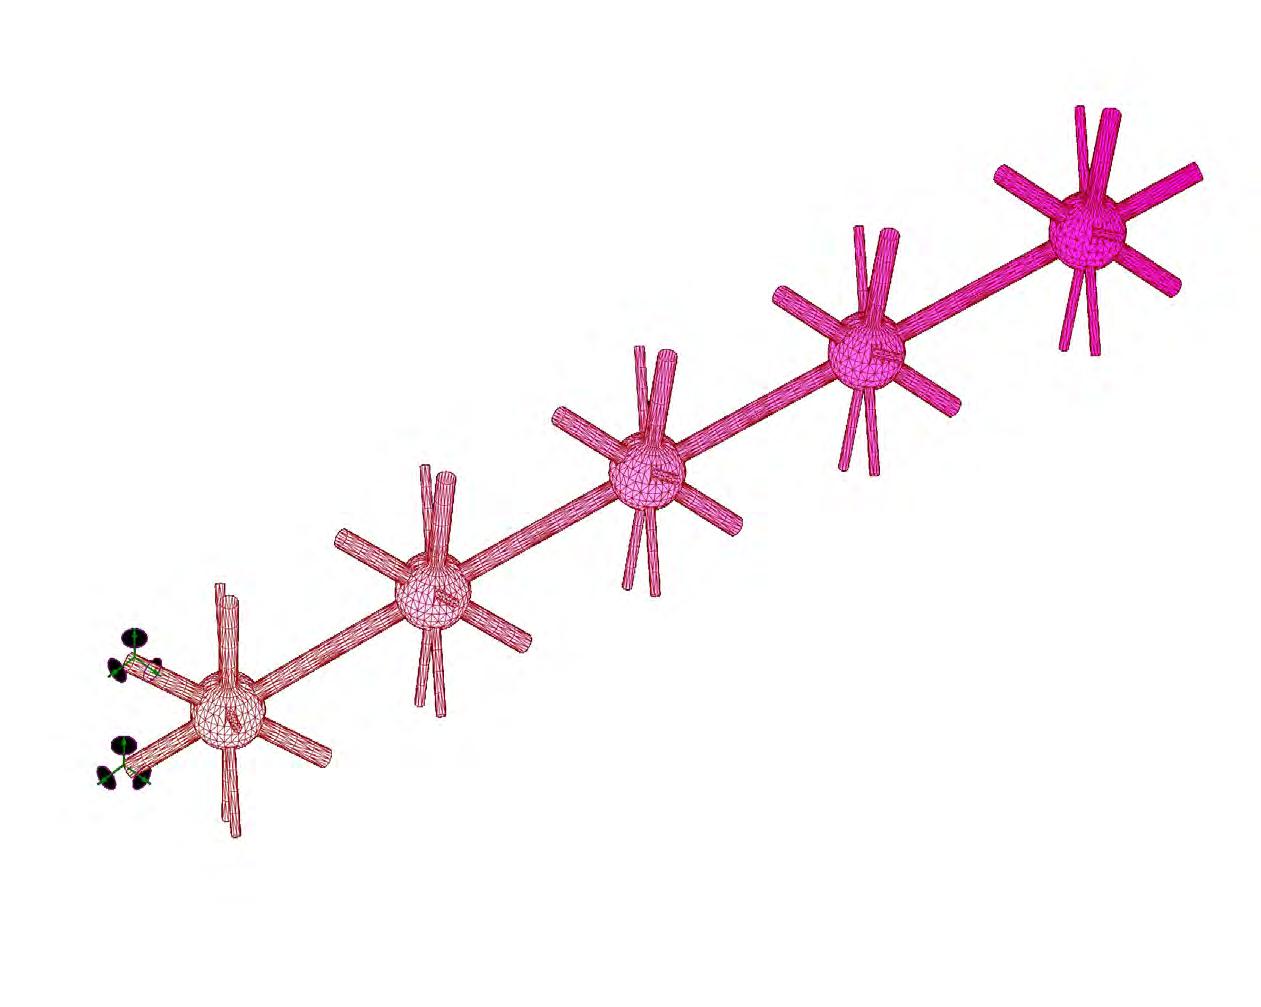
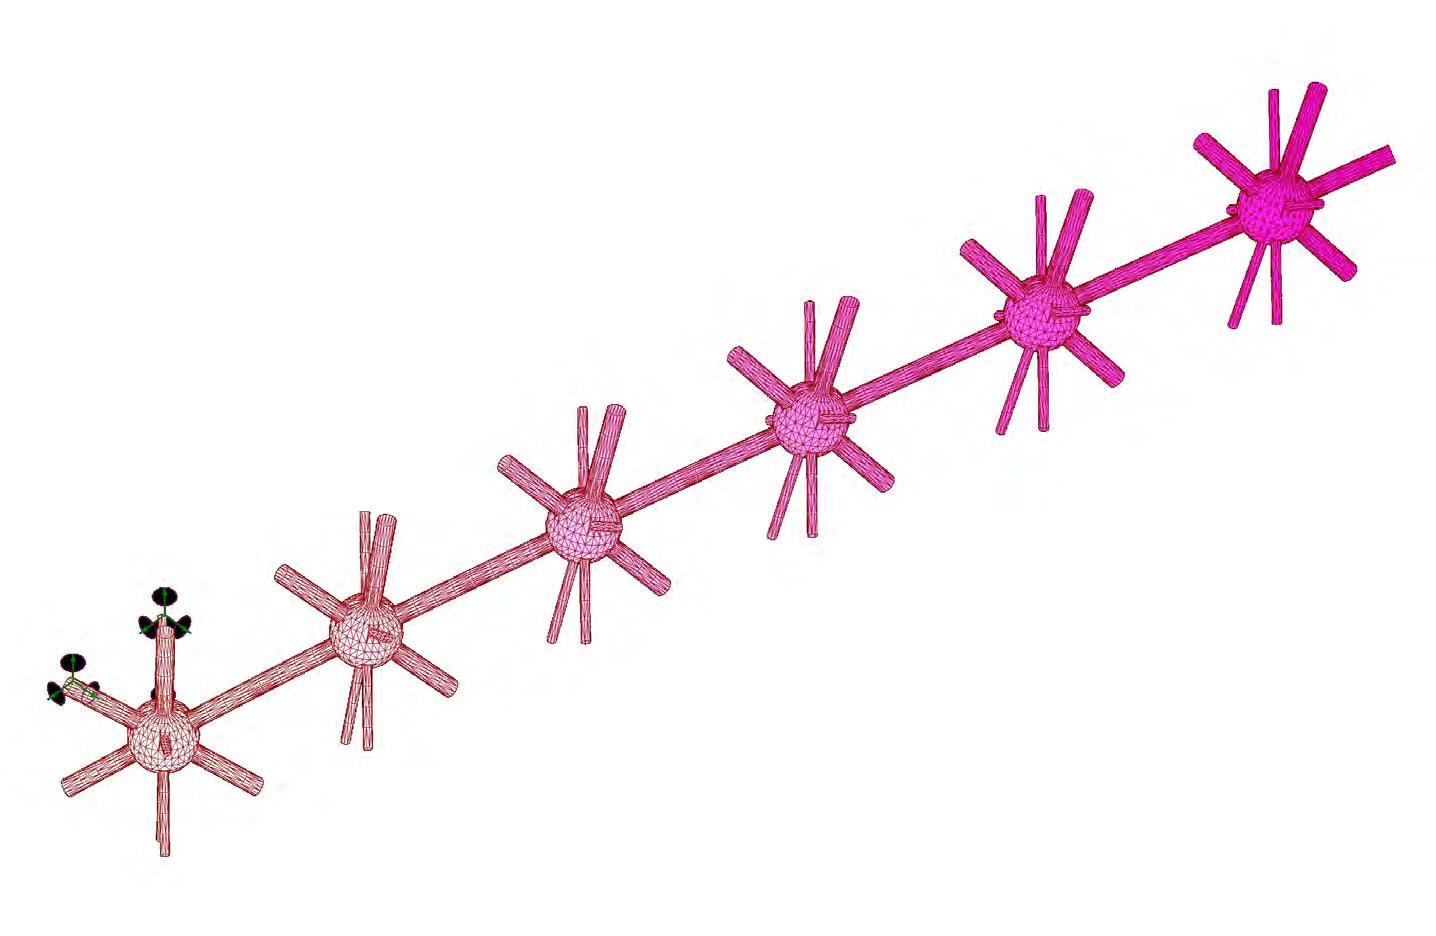
The analysis showed that connections of 5 modules in a linear assembly considering the section of the shell as 1.5cm and wind pressure of 0.0072kPa, the displacement value will be 3.42cm and 3.48cm respectively. While the connection of 6 modules linearly showed that considering self-weight and wind pressure of 0.0072kPa, the displacement value will be 7.76cm and 5.3 cmrespectively. Therefore, obtaining lengths of the modules was implemented as a cantilever constraint, at 4.5 metres. The conducted set of experiments took into consideration only bearing structure, without taking into account any supplementary materials and equipment needed for their performance. Therefore, in the following stages of the research development, the structural capacity of the modules should be reevaluated.
Fig.115. Finite element analysis ;
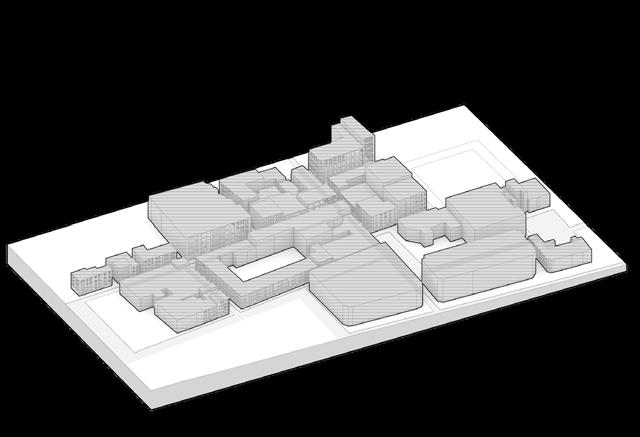
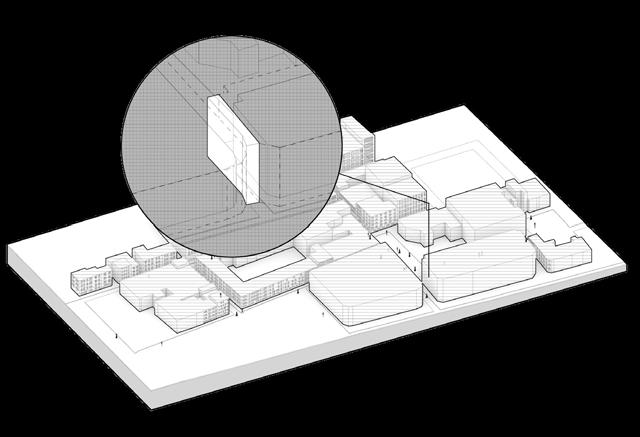
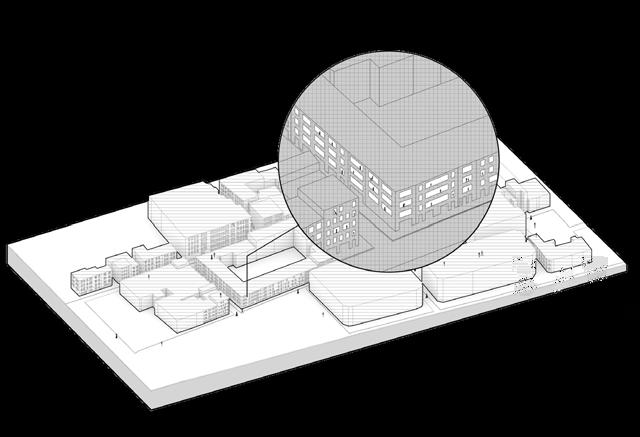
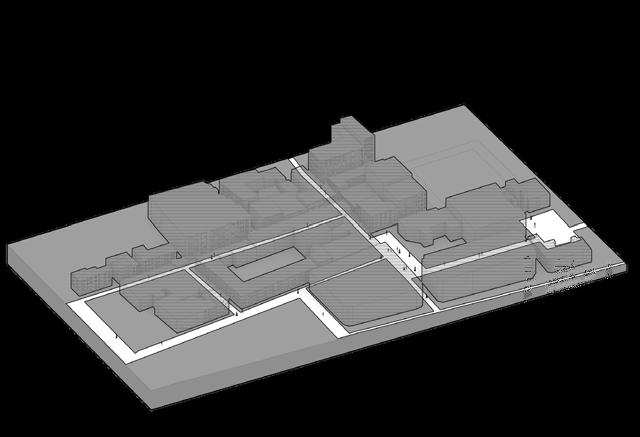
The research utilises two stages of implementing the Diffusion Limited Aggregation algorithm. In the first stage, the DLA simulation assigns a random walk between each particle and its attachment to the attractor point. At the moment that the needed criteria, in this case quantity, is met, the DLA simulation changes its criteria and moves on to the second stage. At this point, the new indicator for the attractor point becomes green tissue, empty facades, available rooftops or underused pedestrian sidewalks. This is carried forth until the completion of the simulation and becomes the new points of influence as well as the attachment rules for the new module placements.
In order to control the performance of the aggregation certain constraints were implemented. First of all, building volumes (Fig.116) were considered as obstacles, therefore, modules could not be aggregated inside of them. The second constraint was windows (Fig.118), where each window was offset a metre in order to not disrupt sightlines or exposure to light. The next obstacle for aggregation was transportation lines or roads (Fig.119). Modules could not be aggregated closer than 4 metres to the road to allow transportation movement. The final constraint was the structural cantilever limitation (Fig.117).
Fig.118. Visual and solar exposure constrain for windows
Fig.116. Rules 1: Building obstacles
Fig.119. Transportation and pedestrian road buffer
Fig.117. Cantilever limitation
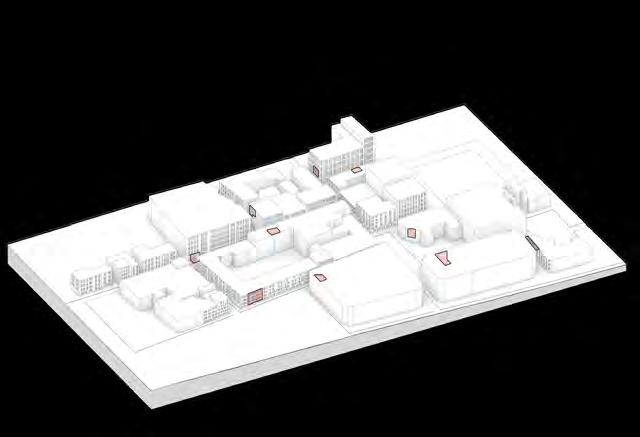

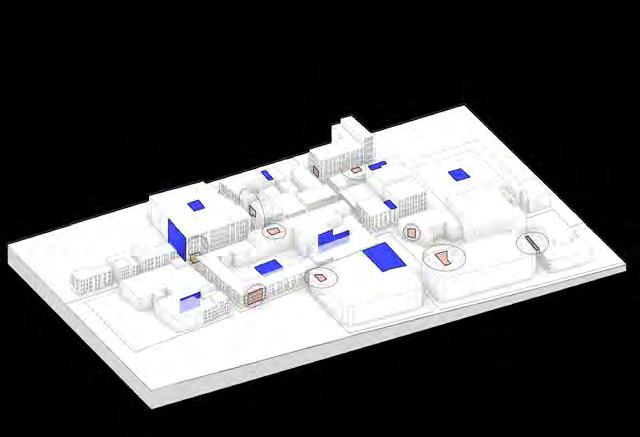
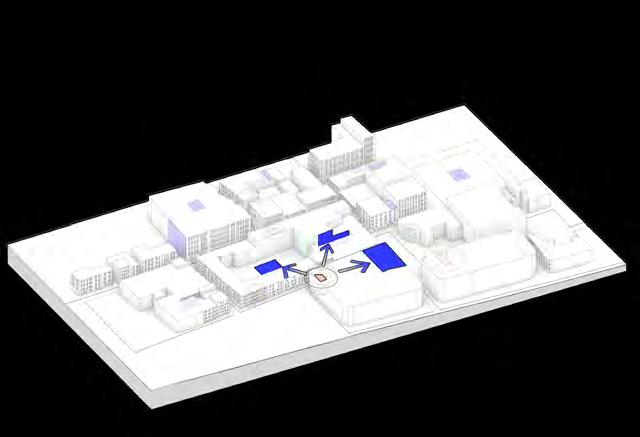
In the process of aggregation, agents wert first selected to accumulate and assemble in the problematic regions outlined by prior attractor analysis. (Fig.120-121) Within this procedure, the varying quantities of agents reflected the severity of the localised conditions by region. Once the number of agents required for each region was satisfied, the agents set out to find the attractors within their radii to establish the connective network. (Fig.122-123)
Therefore, in this project, the DLA Aggregation-based network is constructed by changing the two distinct modes into one another and by monitoring the global aggregation count, with the constraints of the local environmental conditions to allow the network to meet the area of issue whilel reconnecting the green areas simultaneously.
Fig.120. The beginning of aggregation locations
Fig.121. Remapped weight of each location considering needed CO2 absorption
Fig.122. The second level of the DLA algorithm. Areas of attraction
Fig.123. Attracting vectors


The green network design strategy was employed based on the sequential logic of its application. Firstly the affected regions prone to different levels of pollution and scarcity of green cover were identified and mapped. These regions were addressed as points of origination of the network growth, based on the quantification measures and resolution factors.
As the modules have been resolved to assemble along the informed growth of this network generation. The directionality of network growth was manifested by identifying the regions of adjunctions to the physical realm being identified from the existing street maps, satellite maps, and field site inspections, the project identified four parameters to determine the directionality of the growth, as growth attractors to be connected throughout network generation in the test region identified for the application of network design strategy.
The first parameter consisted of fragmented green zones that needed to be reconnected through network formations in order to recreate the lost links of ecosystems, revive metabolic balance and enhance the production of oxygen in the atmosphere. The second parameter for network growth development was identified as large vacant roofs that radiate large amounts of solar heat into the atmosphere, in order to aid thermoregulation. The third parameter being vacant building facades that are undermaintained with lack of lighting and decrease the quality of the cityscape, and the fourth major parameter being identi-

Fig.124. Growth indicators type distribution (isometric)

fied as the interstitial spaces, allowing the multidirectional growth of network at ground levels leading to the formation of interactive user defined public spaces. It can be summarized from the green network development strategy that the fundamental objective of this project is to re loop the green tissue in the urban fabric, hence this component is examined as the primary parameter to determine the growth of the network leading to thermoregulation of the atmosphere. The network must reach and cover huge unoccupied rooftops with high heat emission in order to ameliorate the urban heat island effect. Thirdly, vacant building facades, which absorb solar radiation and store heat, are also covered with enormous advertising spaces, which have a negative influence on the cityscape are also identified as target regions for network implementation and expansion. As part of the open public space, the network is iterated to expand at ground level , with identified street-level growth attractions serving as targets for the network to be attained, creating a multidimensional symbiotic realm of nature, biobots, humans and living species.
Fig.125. Growth indicators type distribution (top view)

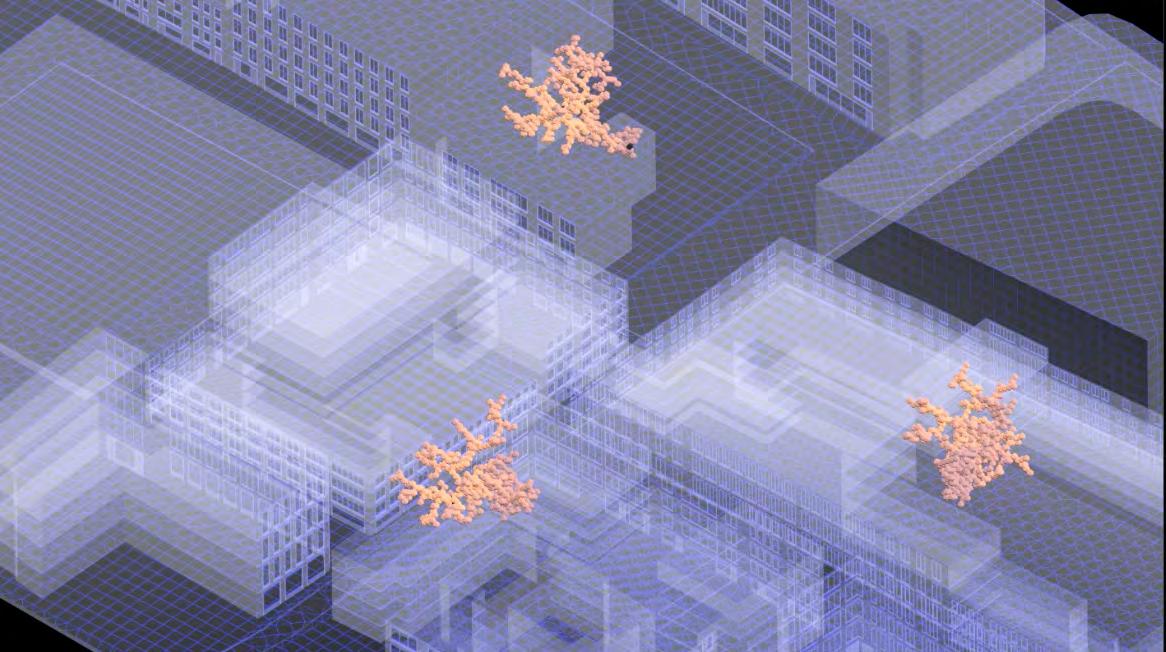
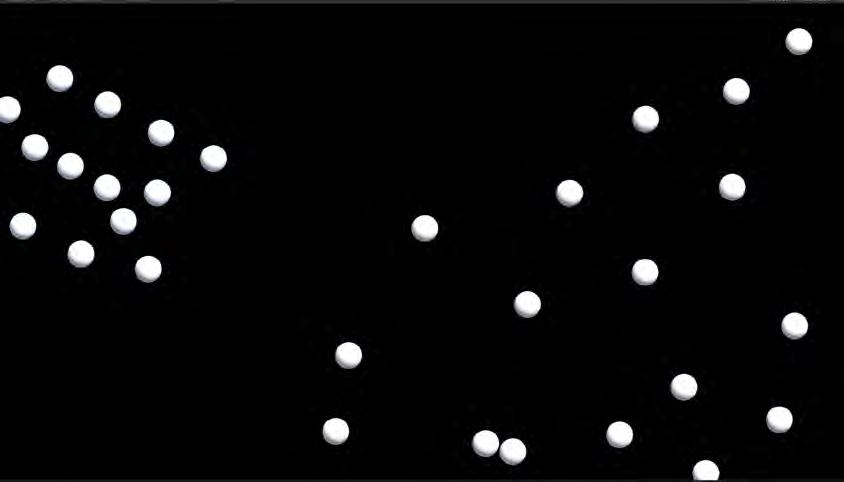
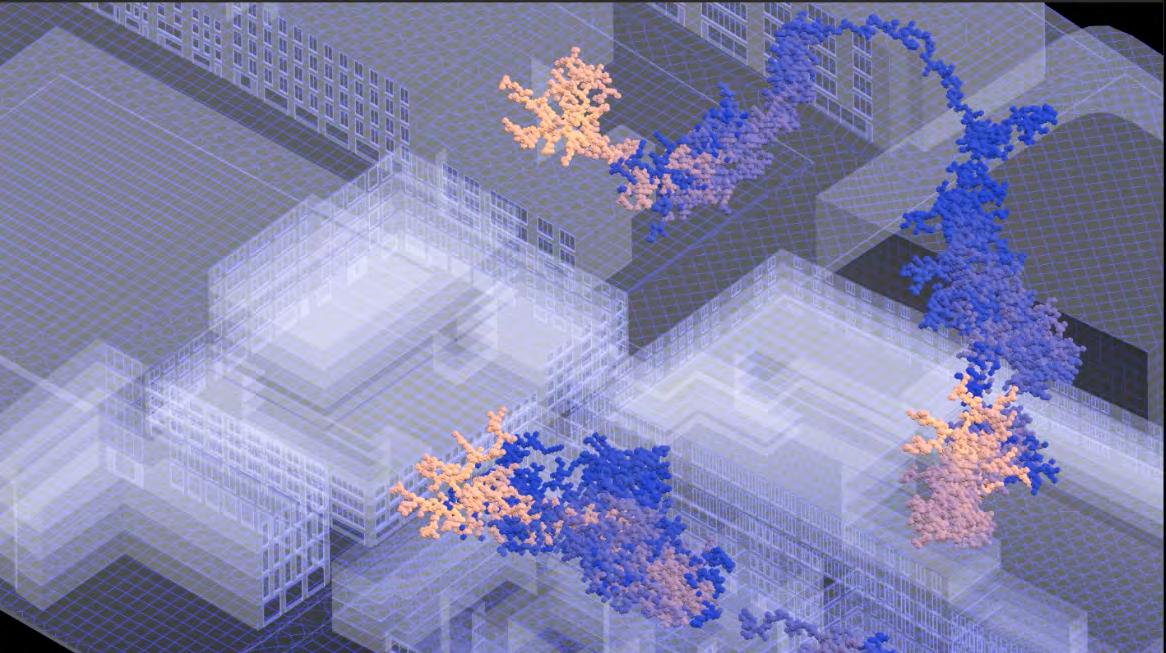
Fig.126. Starting points and count (option 1)
Fig.127. Agents assembling at starting points (option 1)
Fig.128. Final network morphology (option 1)


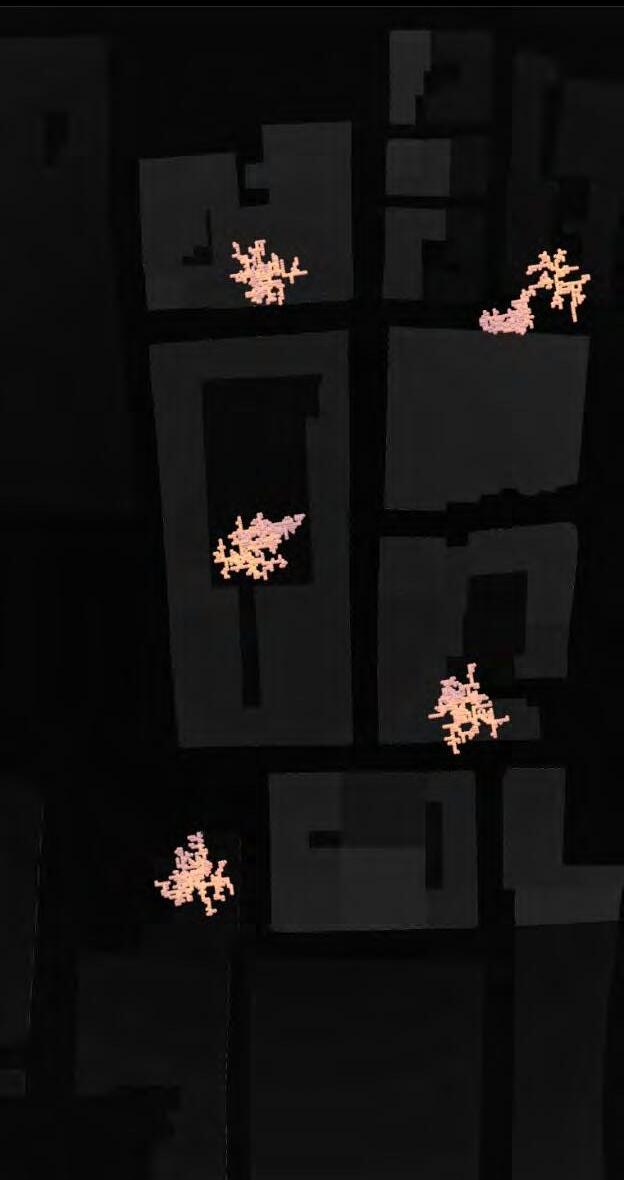
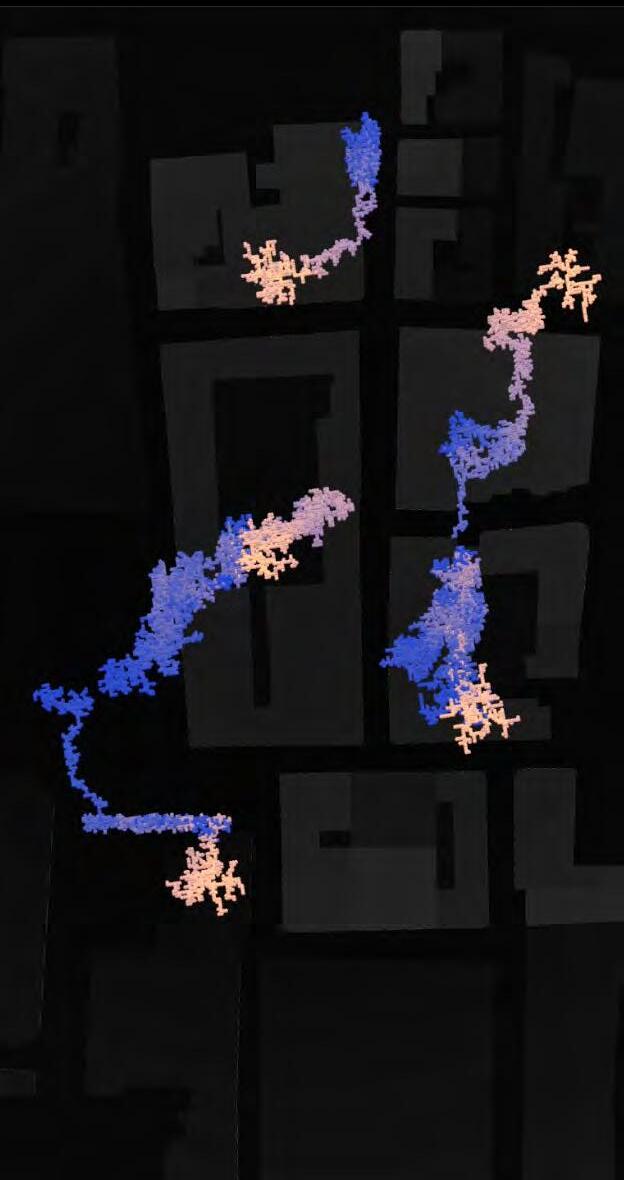
NETWORK OPTION 1
The generated network should be tested to identify how many attractor points will cover the problematic area, as their numbers have a direct impact on the type of aggregation. As a clustering strategy was implemented as an approach for identifying the location of areas of implementation, the number of the clusters had to be tested in order to input the best performing options. Different clustering levels were utilised to determine the optimal clustering level for the local environment. Four different clustering levels were implemented, dividing the parameters into 5, 10, 15, and 20 locations for implementation, testing and observing whether the resulting network morphologies for each choice met the required performance and positively feedback into the existing environmental conditions.
In the network generation simulation for option 1, the clustering level was set to its maximum range, which produced 5 locations as the starting point for the network generation. It was observed that setting the starting point to 5 resulted in fewer network branches and a more linear network morphology- important in identifying continuity. The lack of sufficient branches to reach each attractor caused the network to grow repeatedly and intersect already generated morphologies, resulting in redundancy and a large number of agents clustering in certain areas. This led to a reduction in the resources allocated to individual agents such spatial and environmental limitations and consequently their effectiveness in the test region. These results of the first iteration proved to result in network inefficiency.
Fig.129. Starting points and count (option 1) (top view)
Fig.130. Agents assembling at starting points (option 1) (top view)
Fig.131. Final network morphology (option 1) (top view)
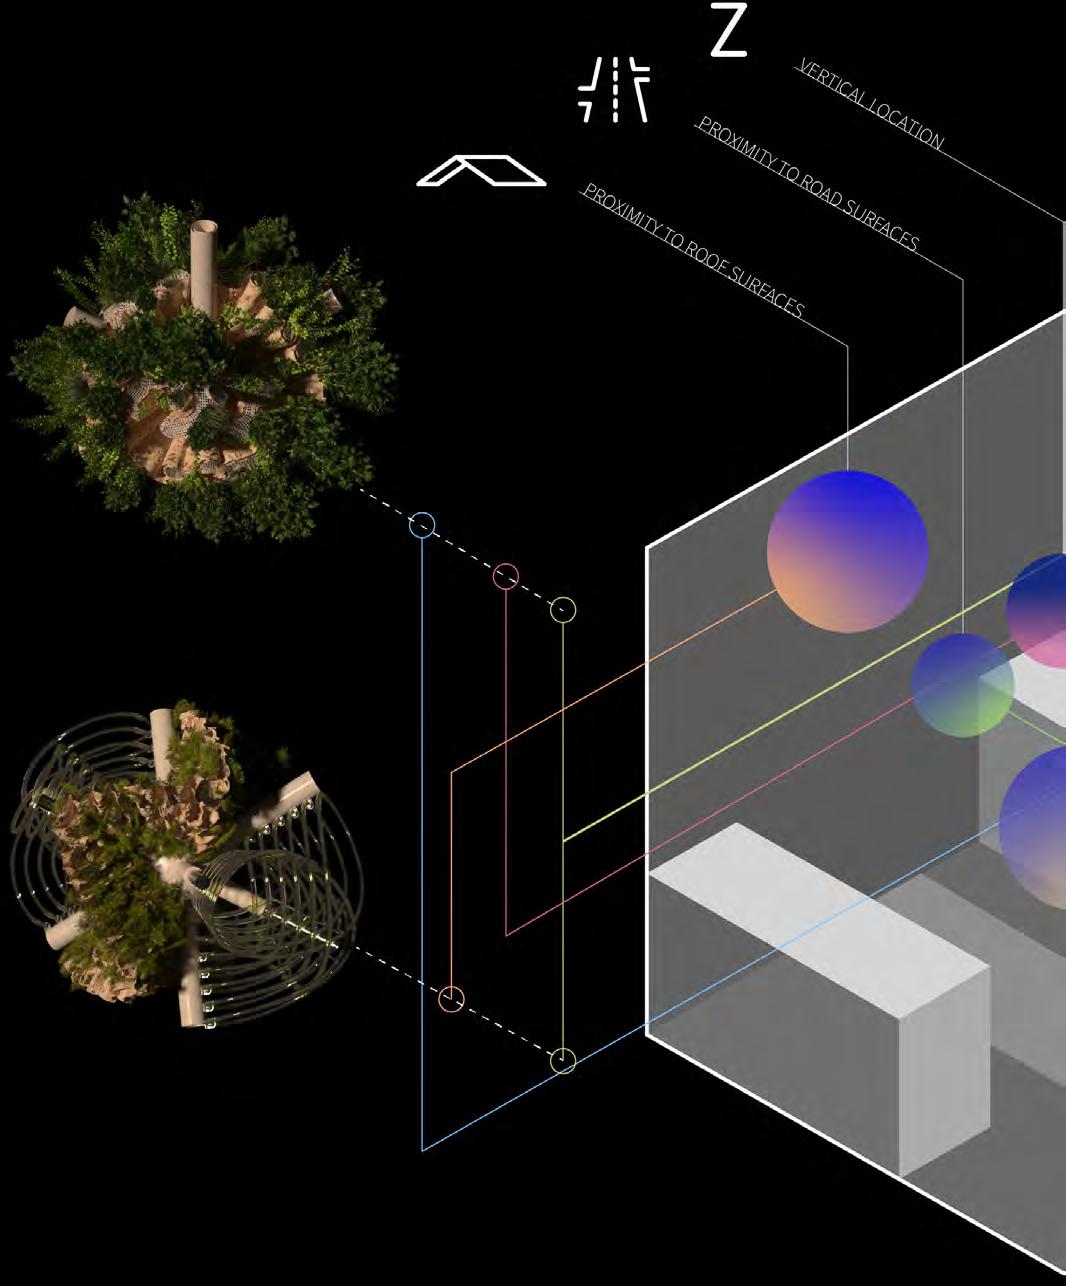
The post aggregation analysis (Fig.132) identifies both the gradient of change as well as optimal placements for each function. Filtration_ Production and Filtration modules are located based on proximity to roads and roof surfaces for accessibility, whereas the filtration module is located above the transportation roads to decontaminate the area. Production_Protection and Filtration_Production modules locations are impacted by sun exposure, wherein the second one is located in areas which are the most exposed to direct sunlight, while the first should be placed in areas in which half of the day can be shadowed according to the plant taxonomy study. The wind vector hits influence the distribution of the Filtration and Collection_Filtration modules as they both should receive the maximum rain and wind exposure compared to other functions. Simultaneously, the vertical distribution positions Production_Protection at the lowest height while Collection at the apex for managing access and rainwater respectively. Finally,
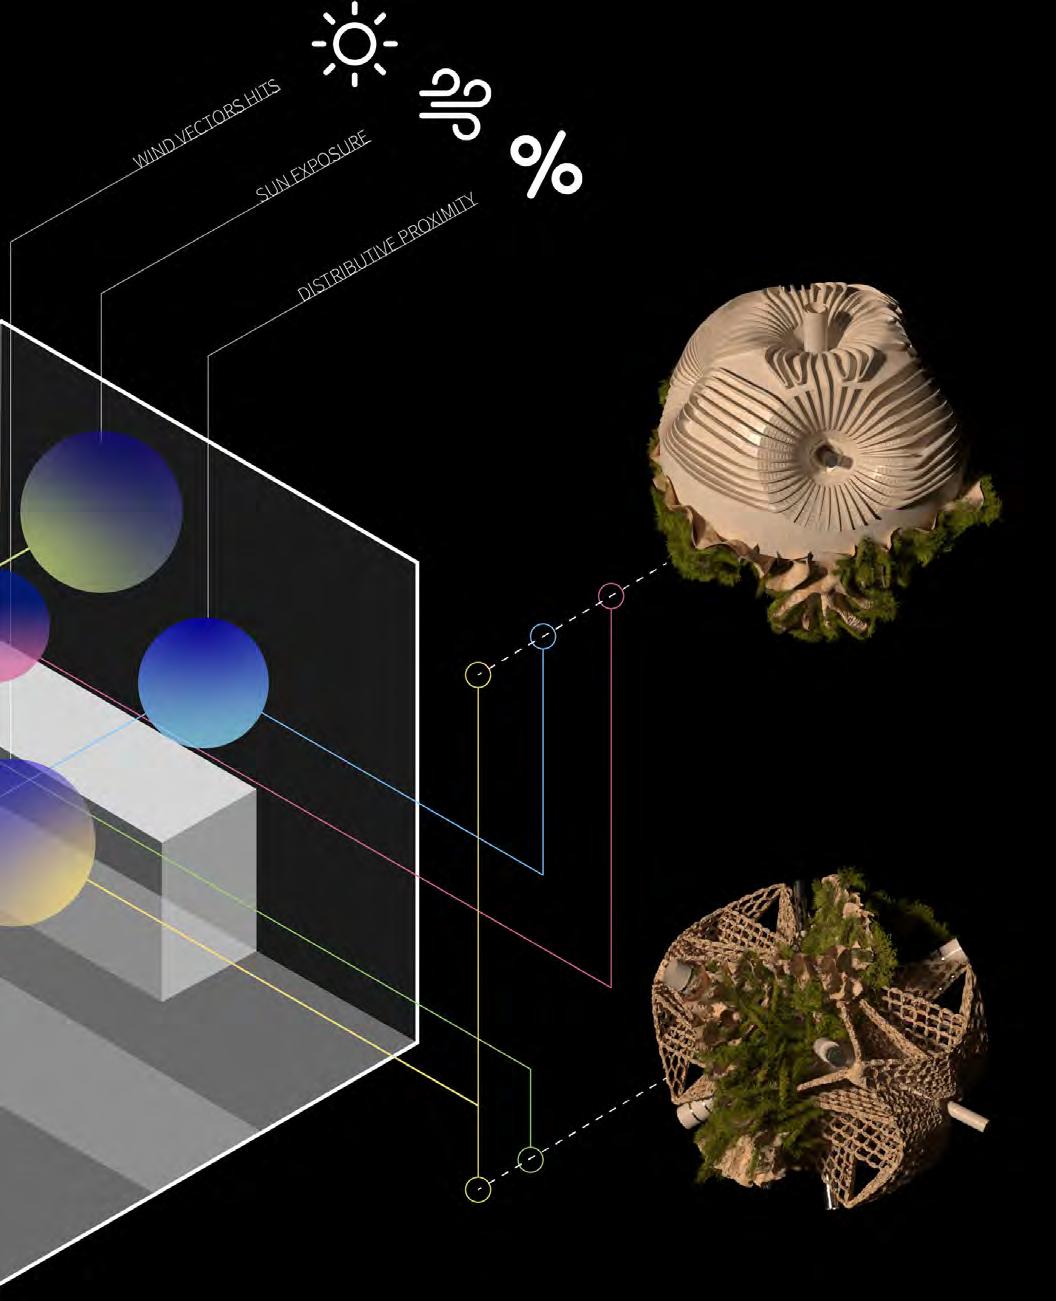
connectivity of the green network impacts quantities and proximities for Production_Protection continuity. These tests punctuate the gradient of change needed within each function for their final distribution within the system.
The distribution of the Collection_Filtration modules was considered using the distributive proximity analysis. The aggregated network was organised into clusters of 15-20 modules, with at least one water collection module required in each of these clusters. The ultimate location of the water collection modules was influenced by clustering with the determined gradient of change for this function. The analysis revealed the areas of investigation explained on page XX which helped to define the percentages for each function was implemented on this stage. The obtained gradient of change for the other three functional modules were implemented considering previously obtained percentages for their distribution.
Fig.132. The logic for post aggregation optimisation of the location of each functional module
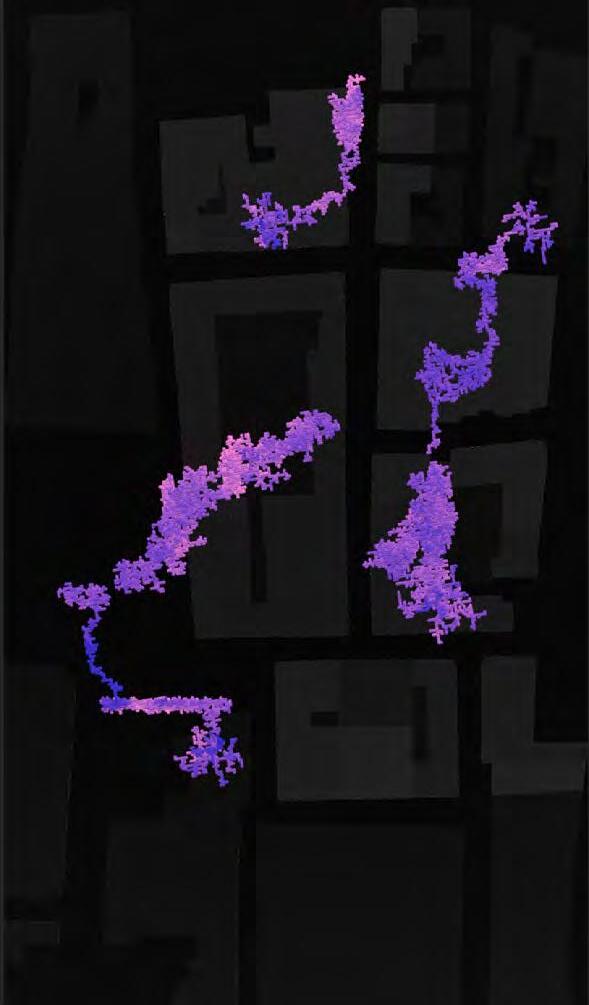
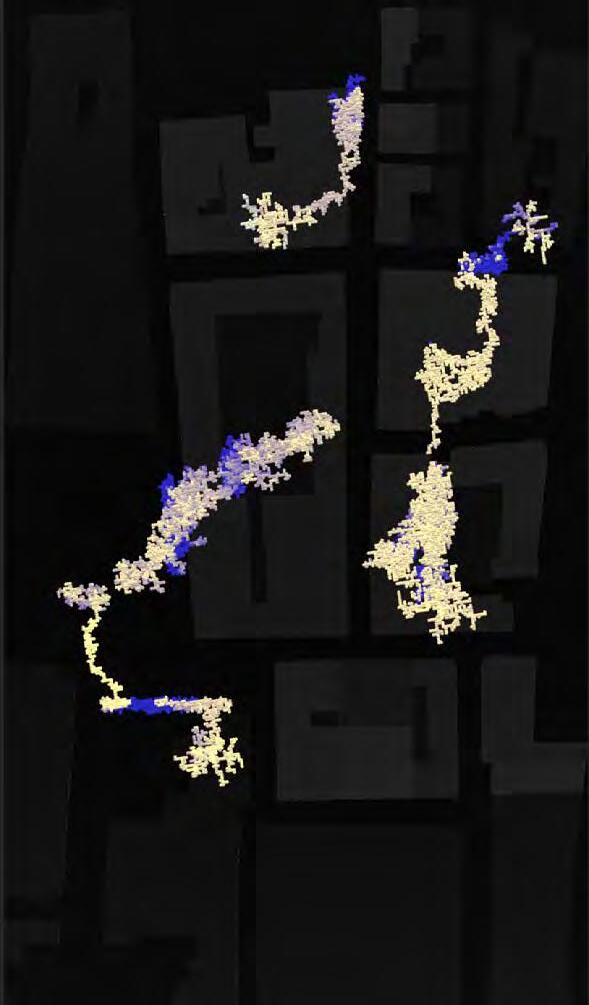
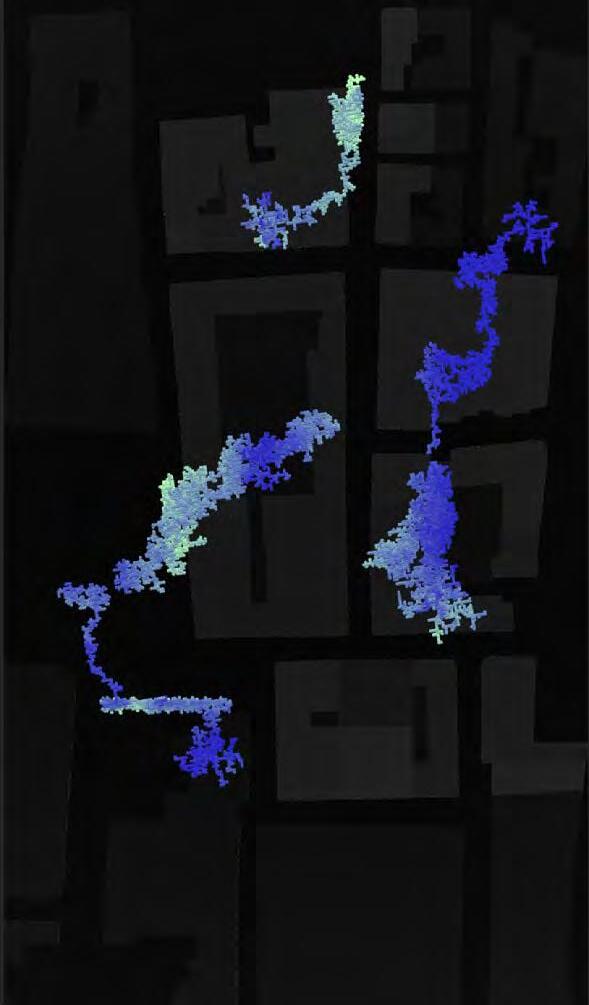
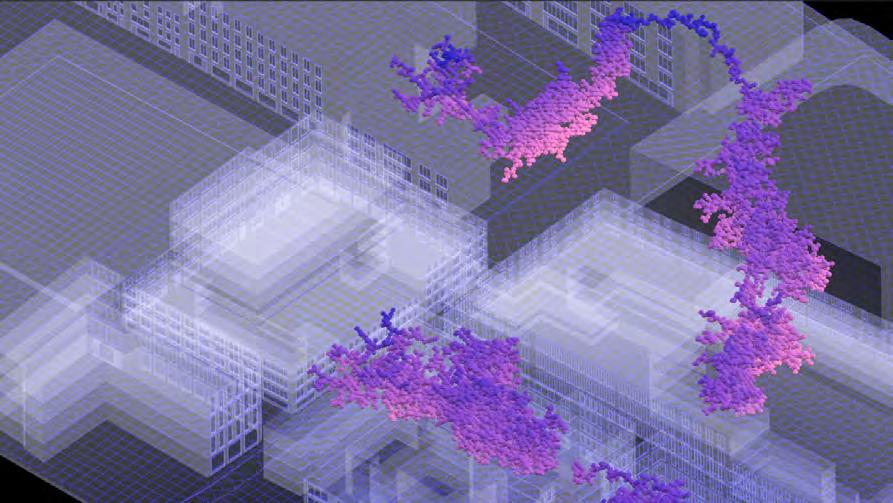
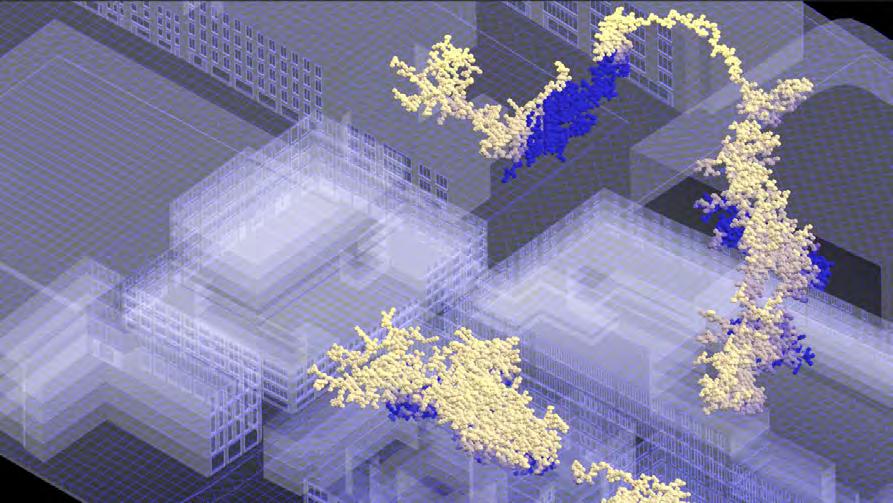
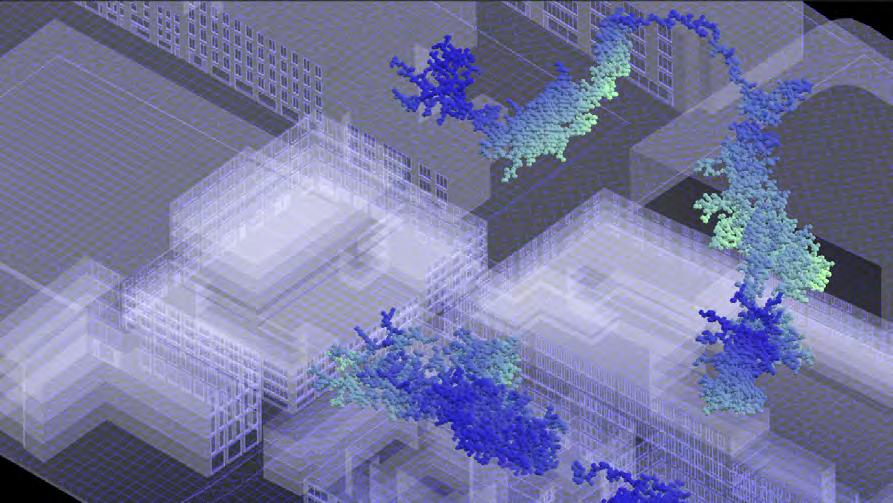
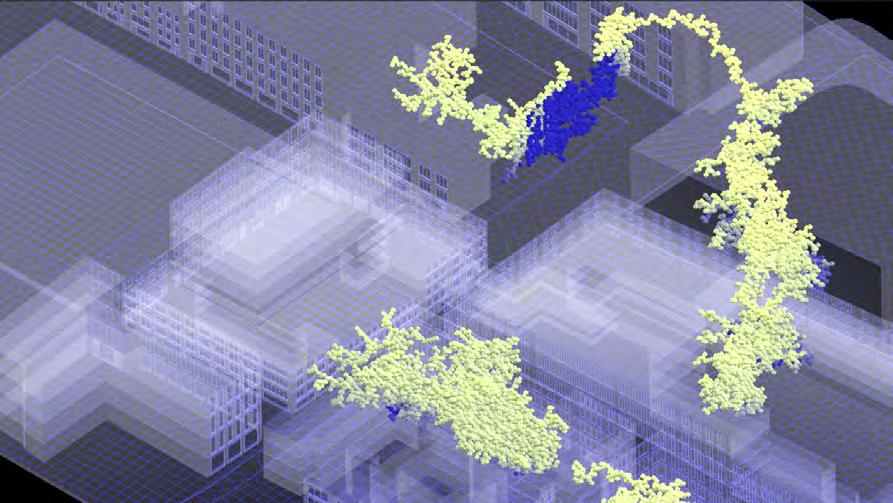
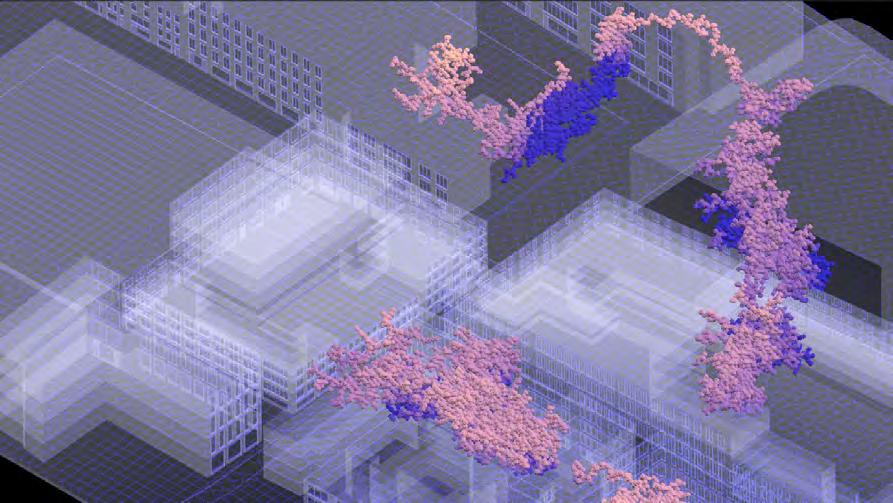
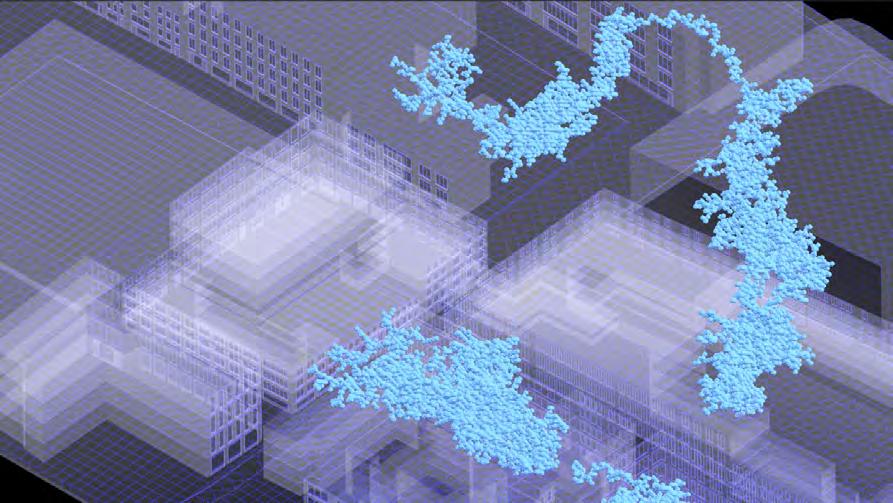
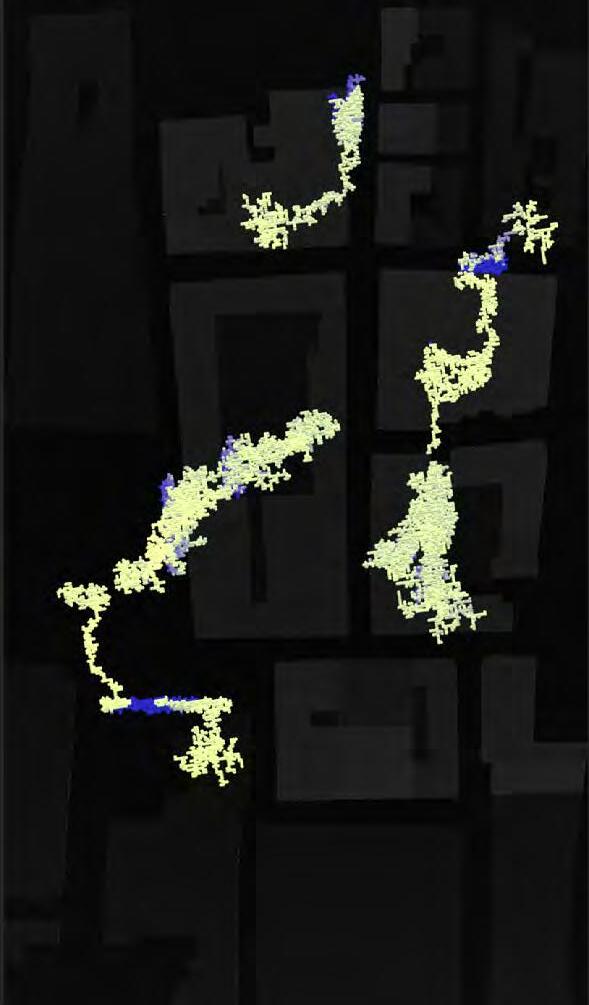
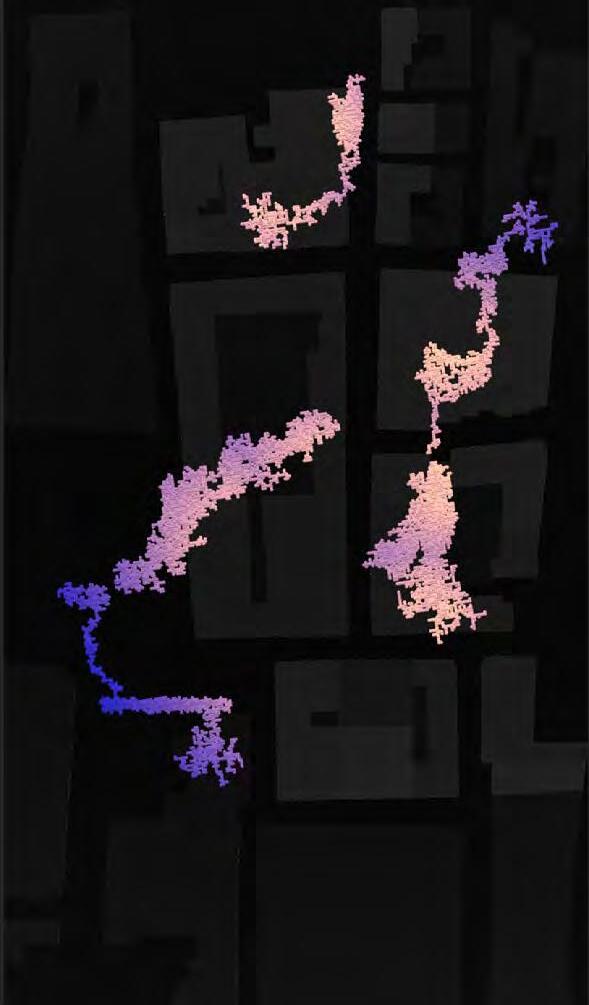
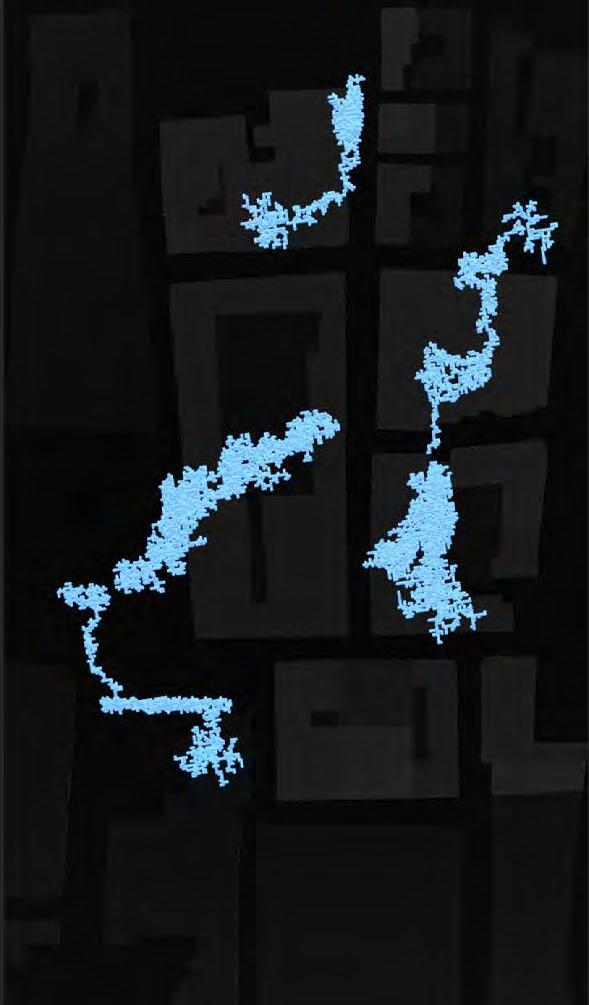
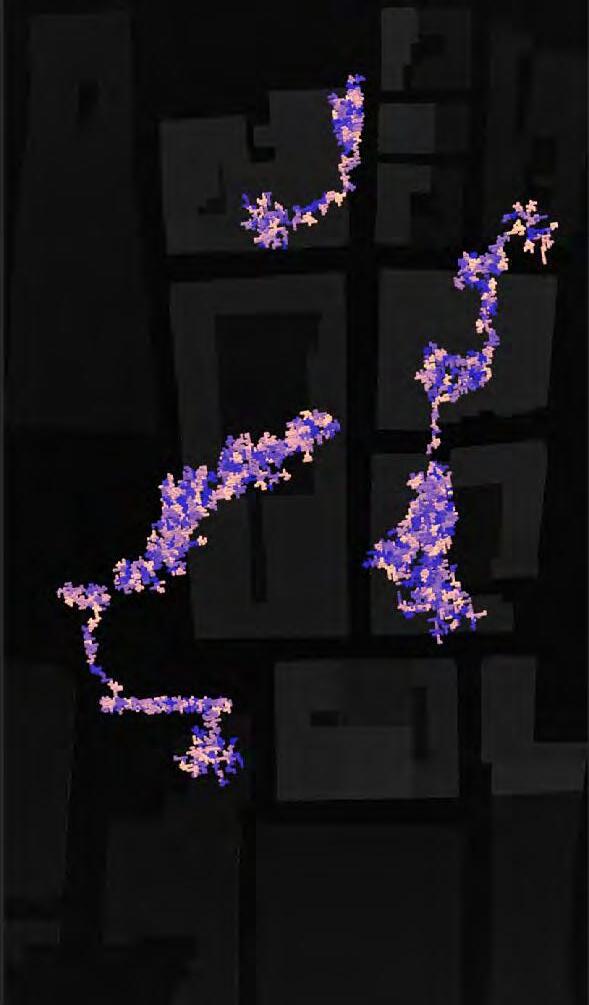
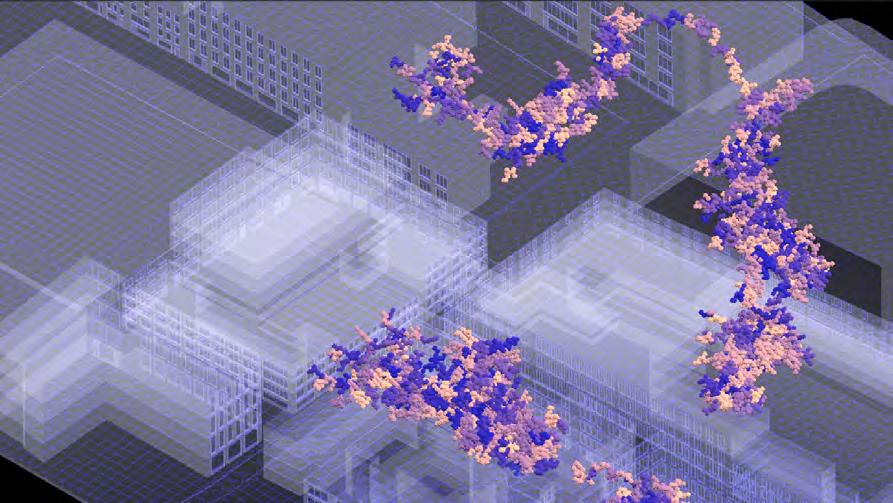
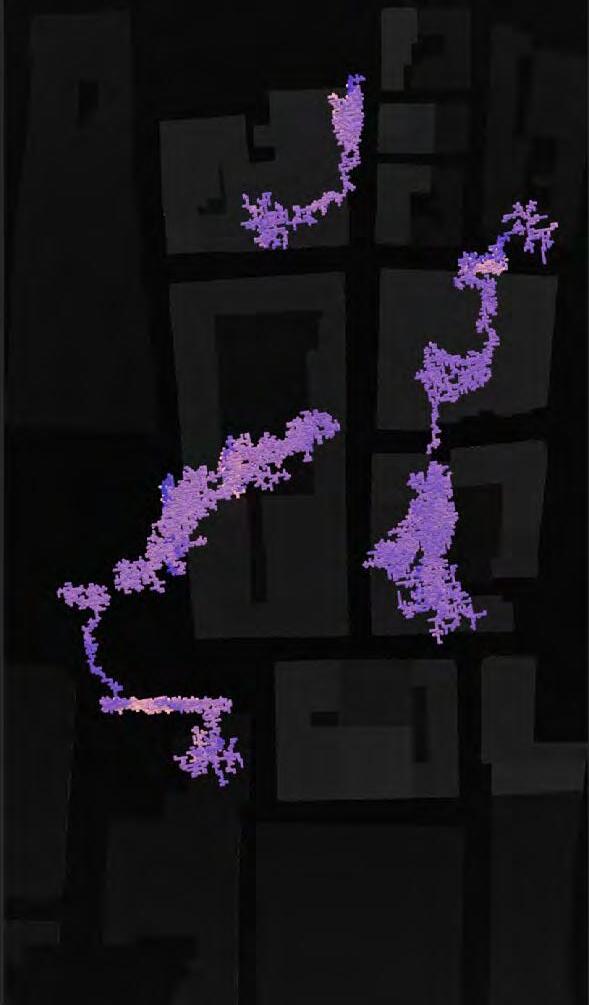
PRODUCTION_PROTECTION MODULE GRADIENT OF CHANGE
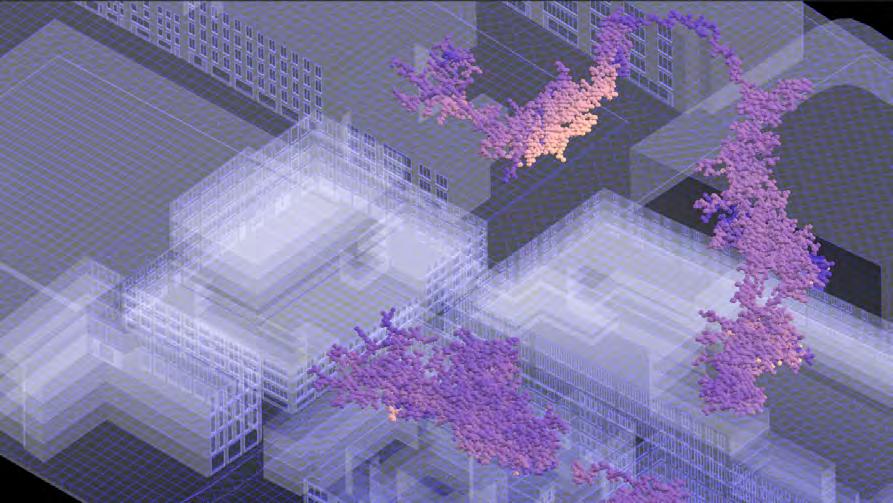
FILTRATION_PRODUCTION
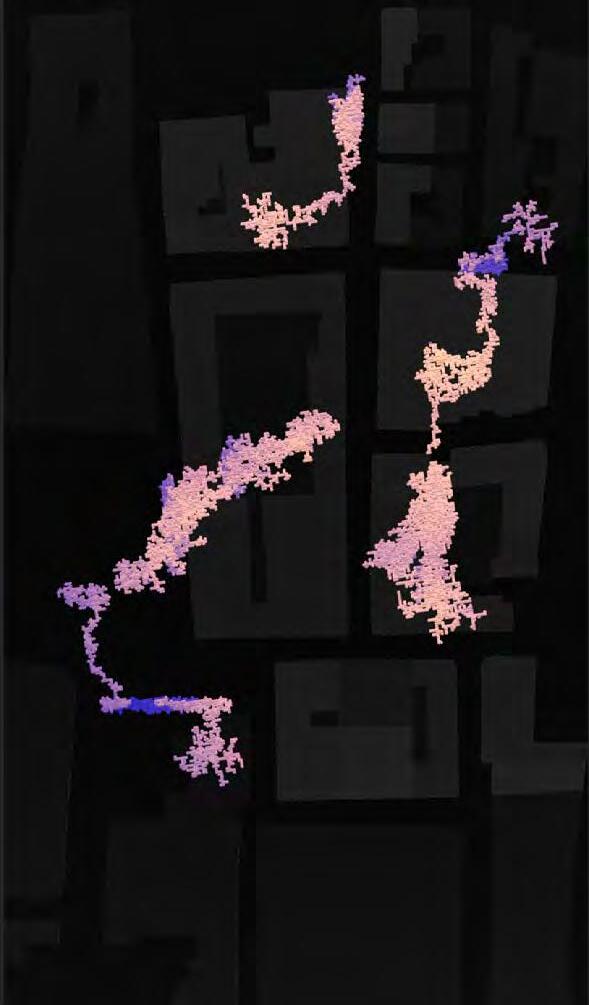
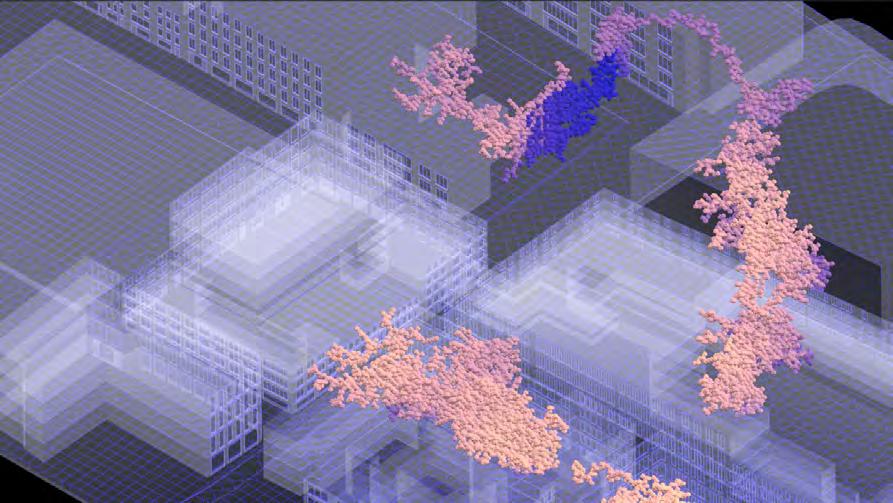
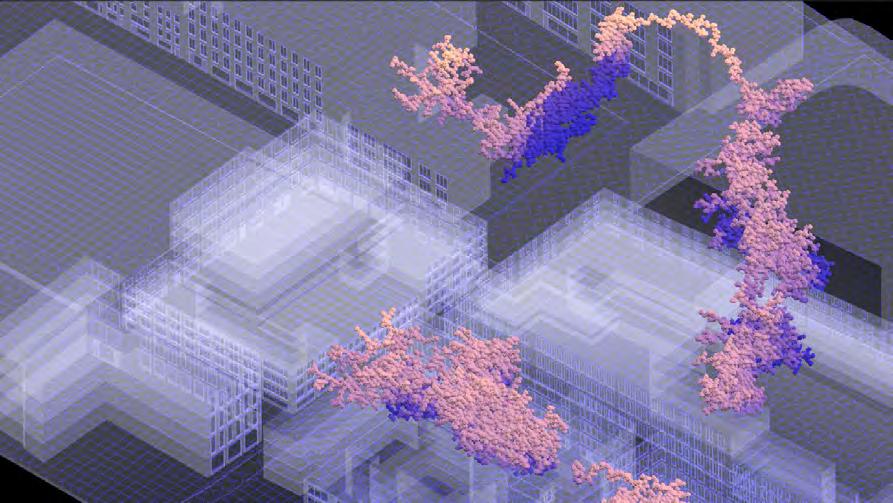
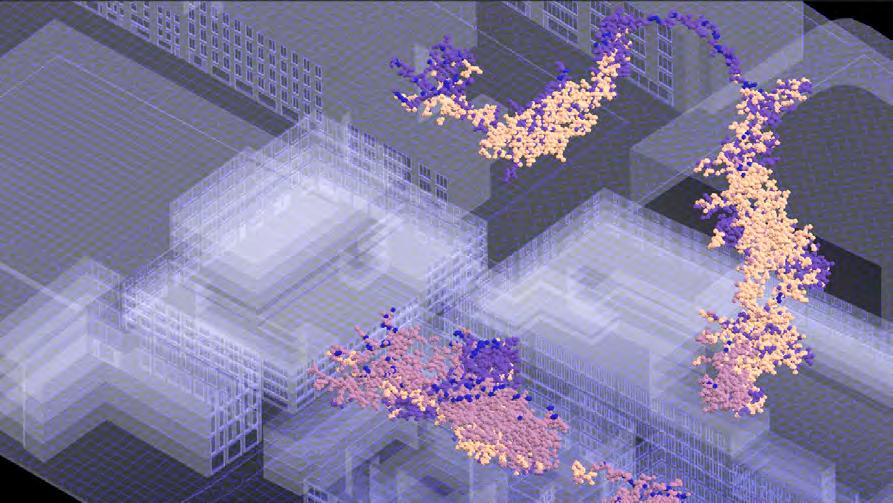
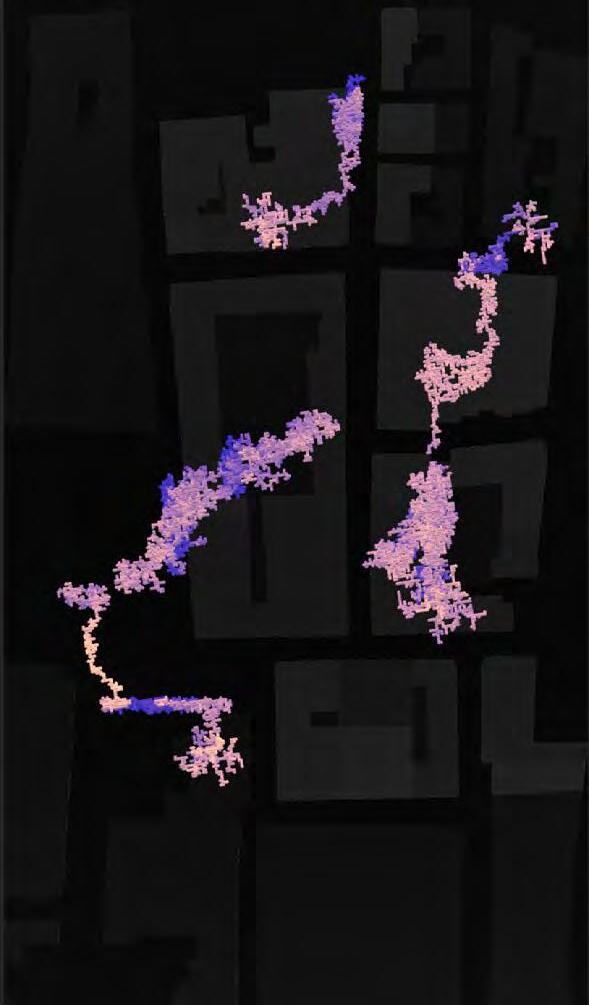
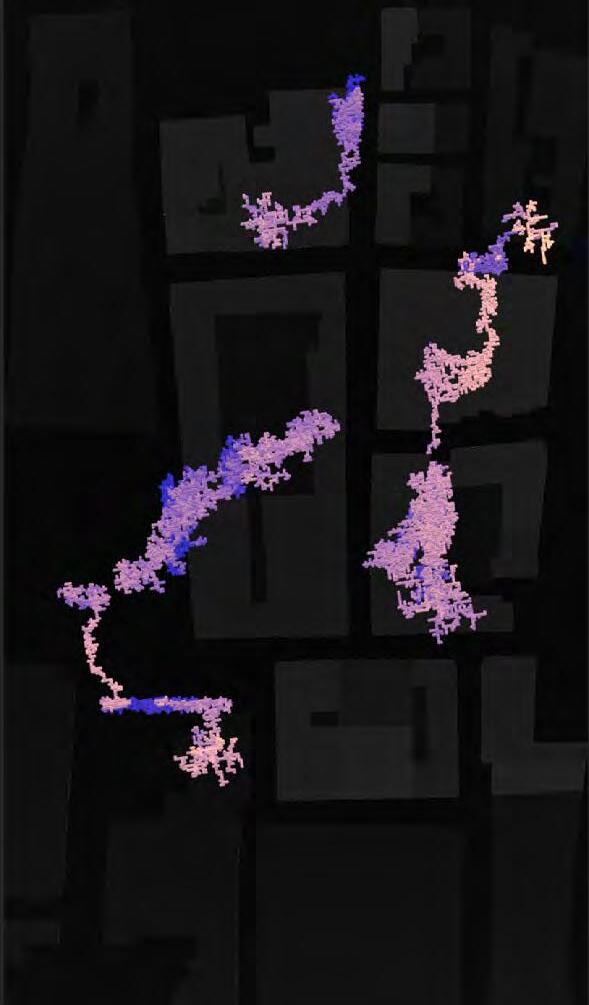
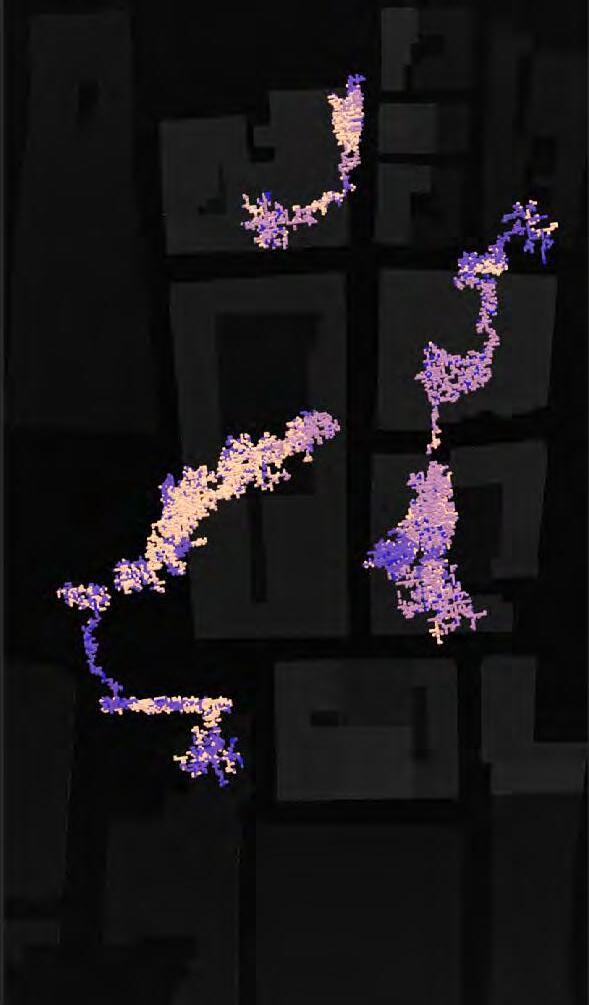

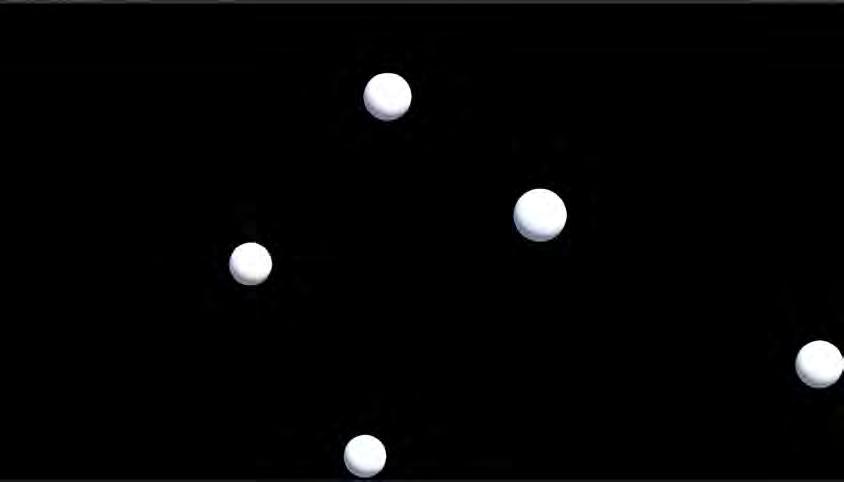
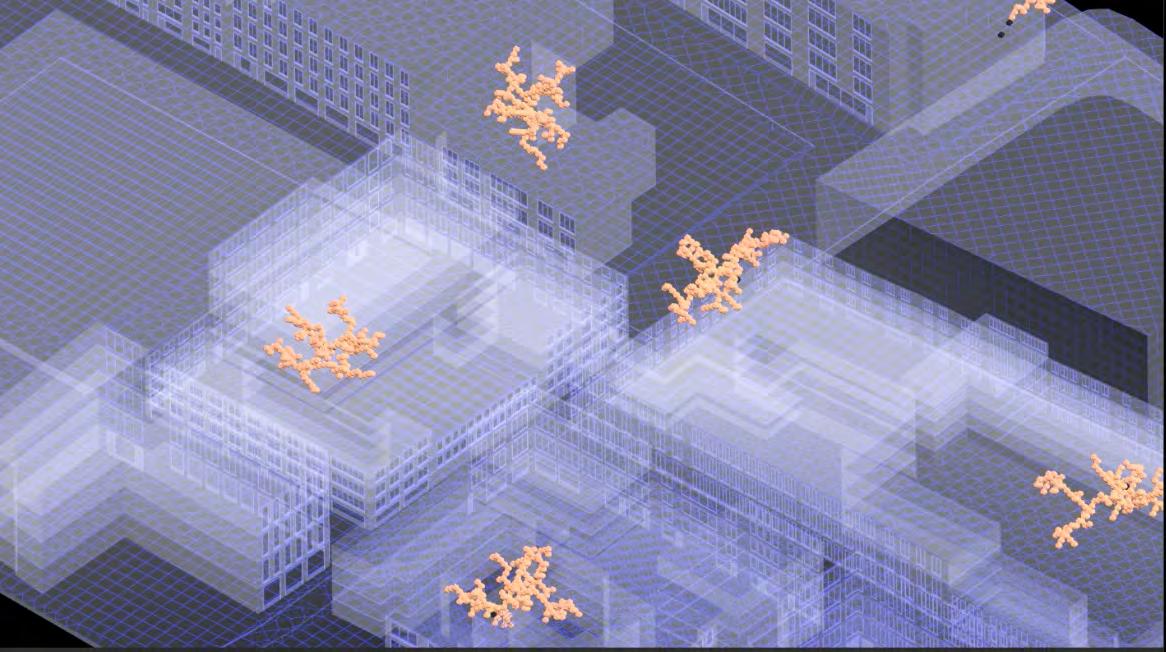
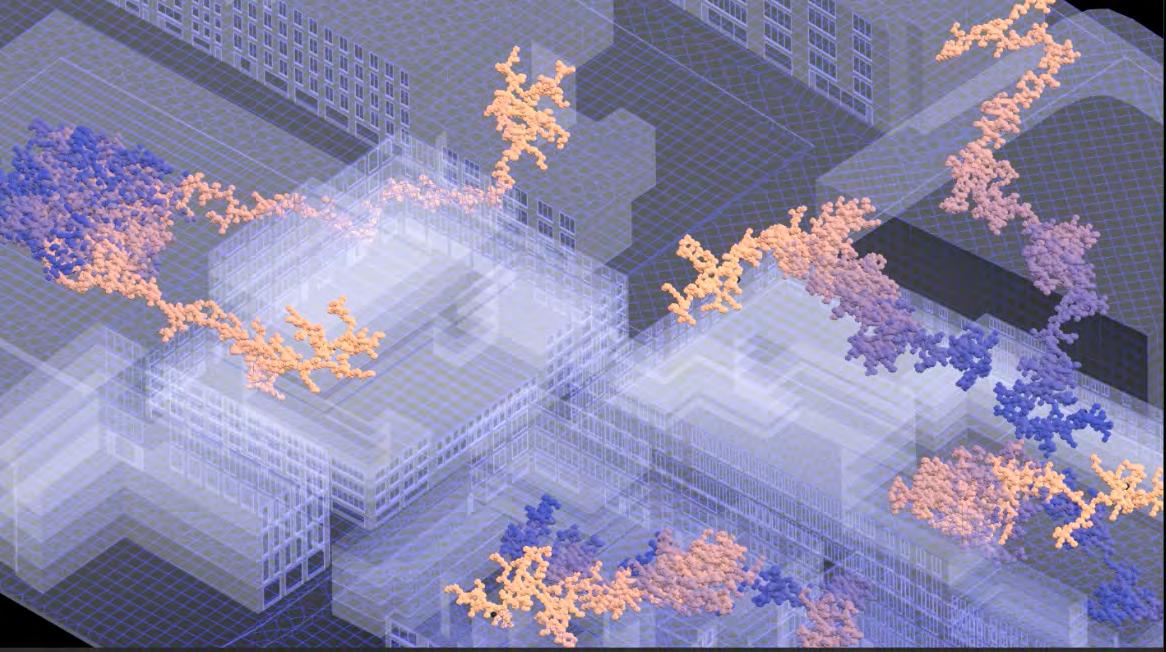
Fig.134. Starting points and count (option 2) isometric
Fig.135. Agents assembling at starting points (option 2) isometric
Fig.136. Final network morphology (option 2) isometric

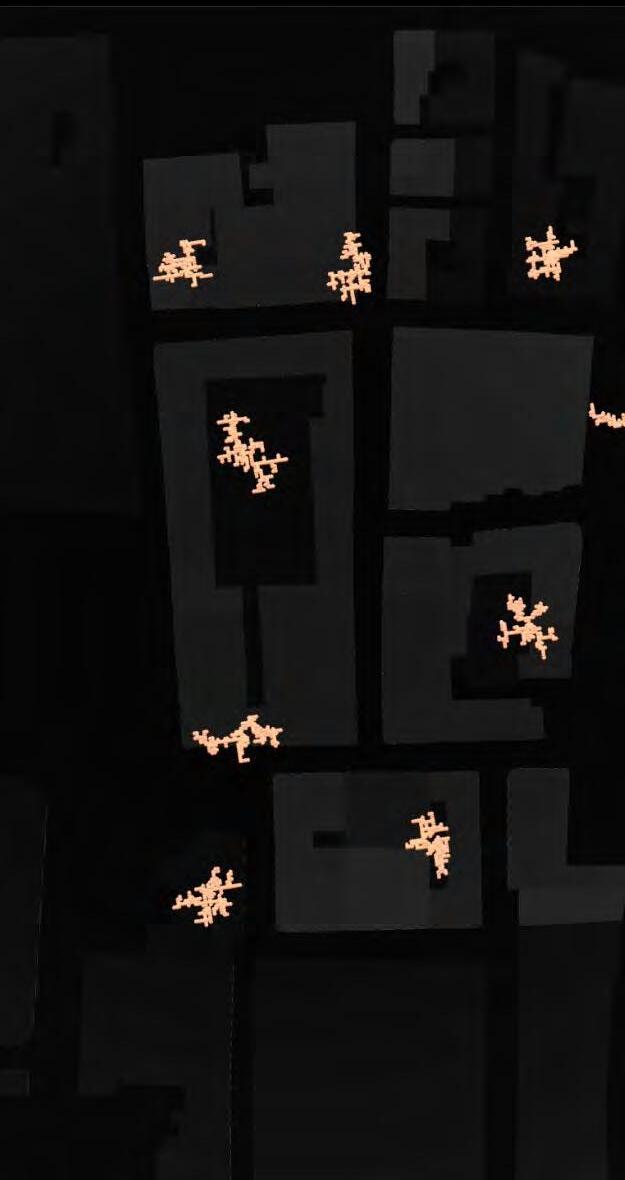
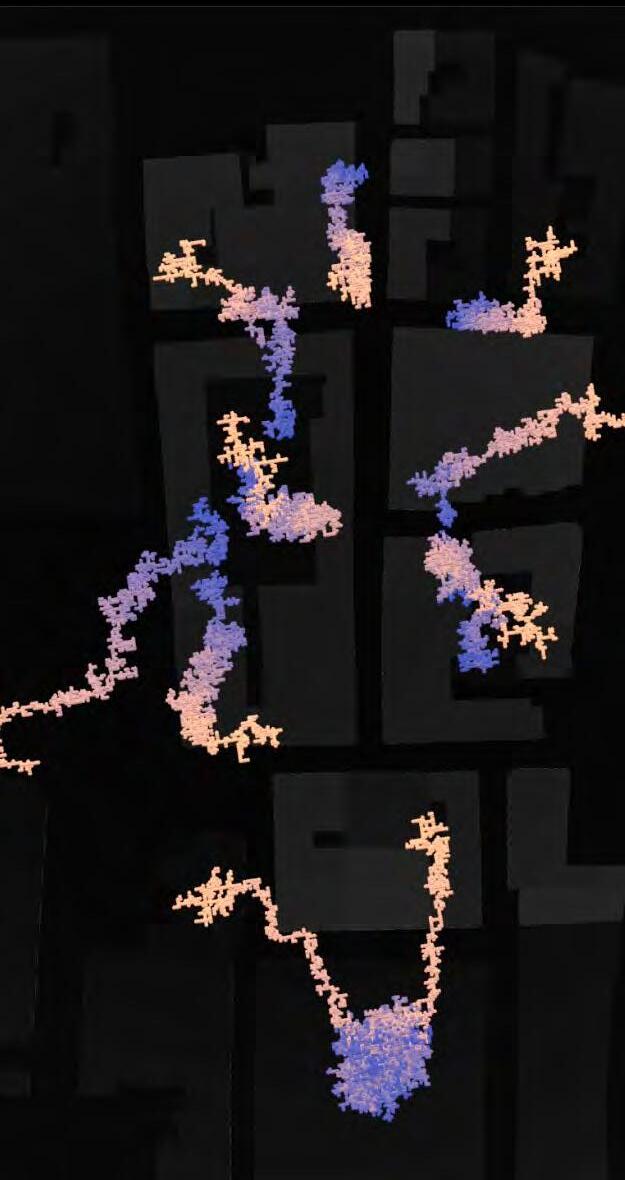
NETWORK OPTION 2
In the subsequent network generation simulation for option 2, the clustering level was set to the next highest range, resulting in 10 locations as the starting point for network generation and a decrease in the number of agents that needed to be generated first at each of the locations. It was observed that by setting the starting point to 10, more branches were successfully generated and therefore a larger accumulation of agents in certain areas was mitigated compared to option 1, but the goal of this decentralised network distribution was still not achieved due to the continued overlapping behaviour between network generation. This, again, led to redundancies in the network morphology and inefficient utilisation of the individual agents.
Fig.137. Starting points and count (option 2) top view
Fig.138. Starting points and count (option 2) top view
Fig.139. Starting points and count (option 2) top view
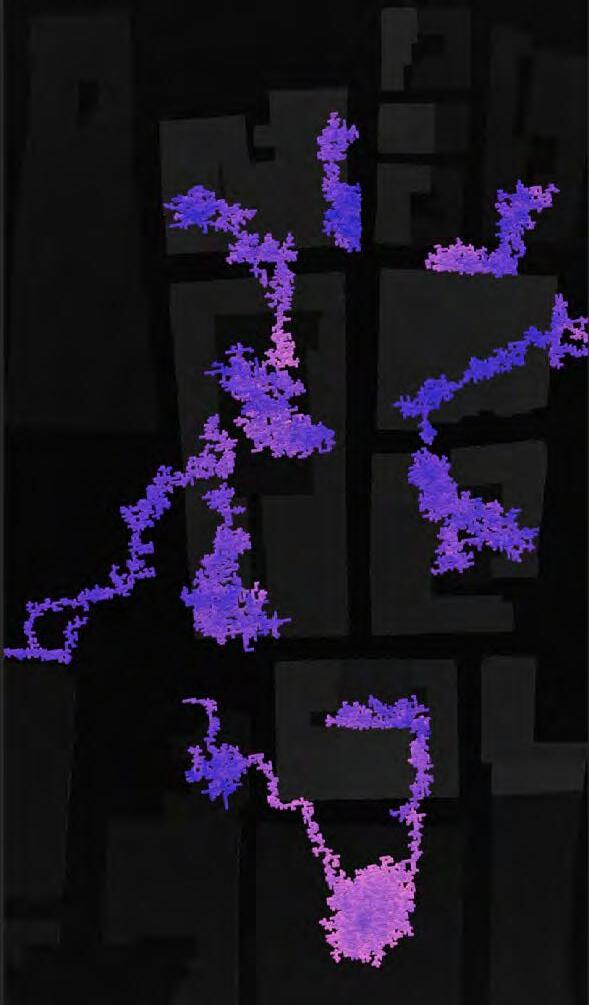
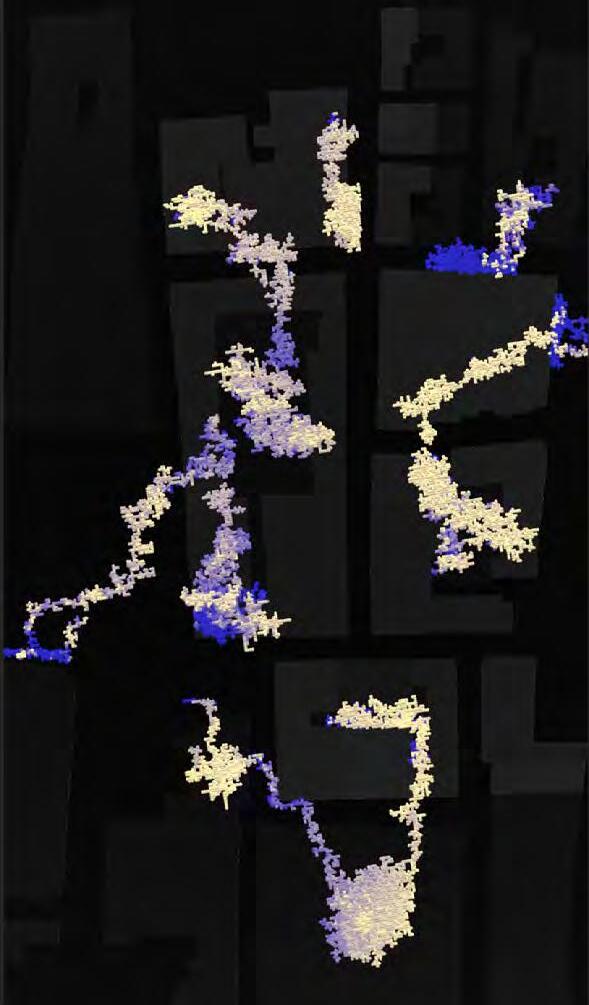
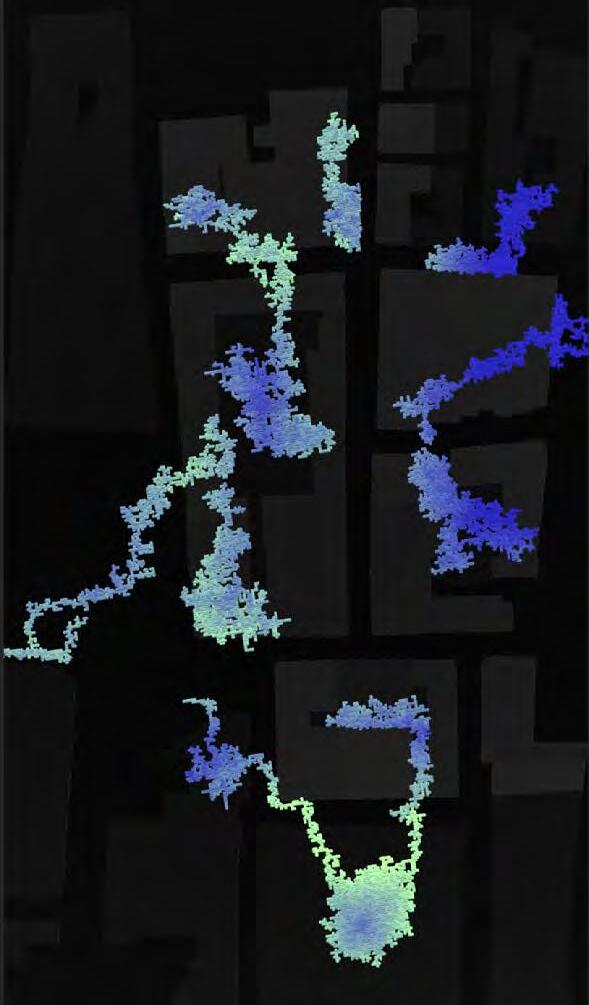
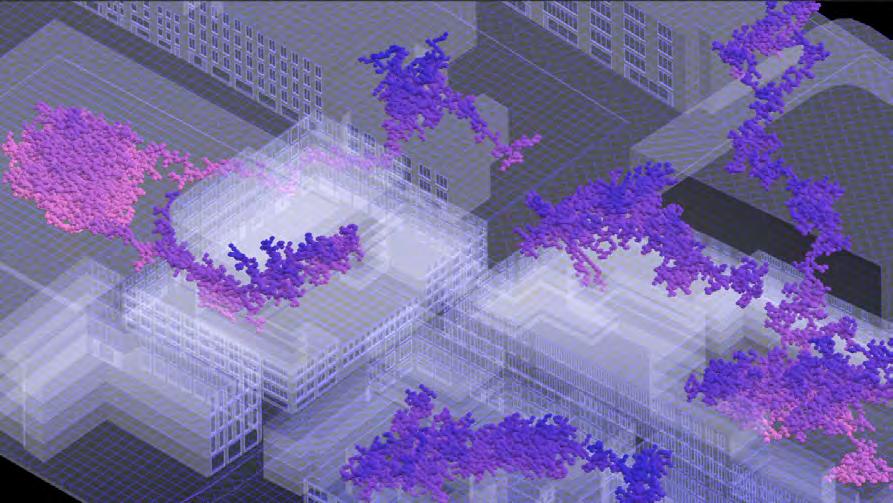
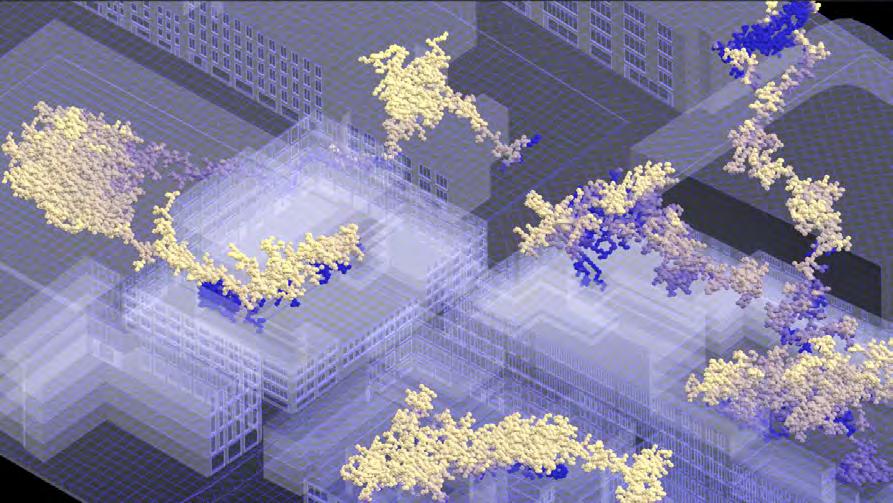
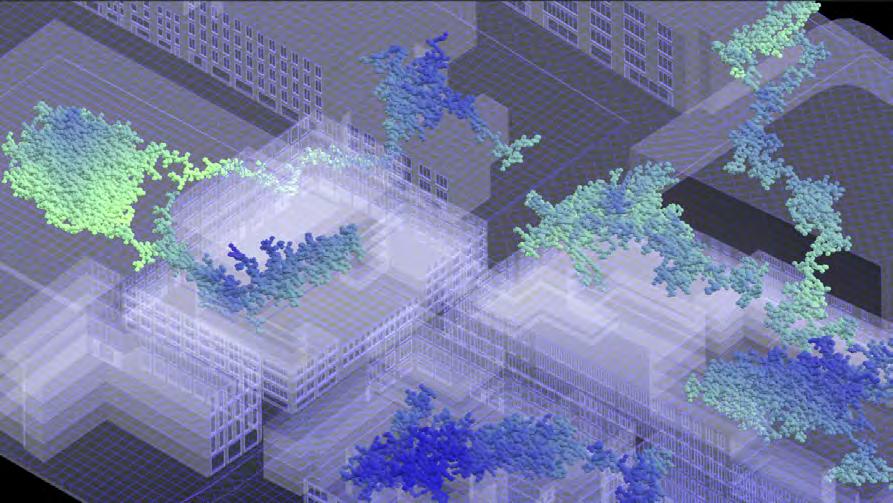
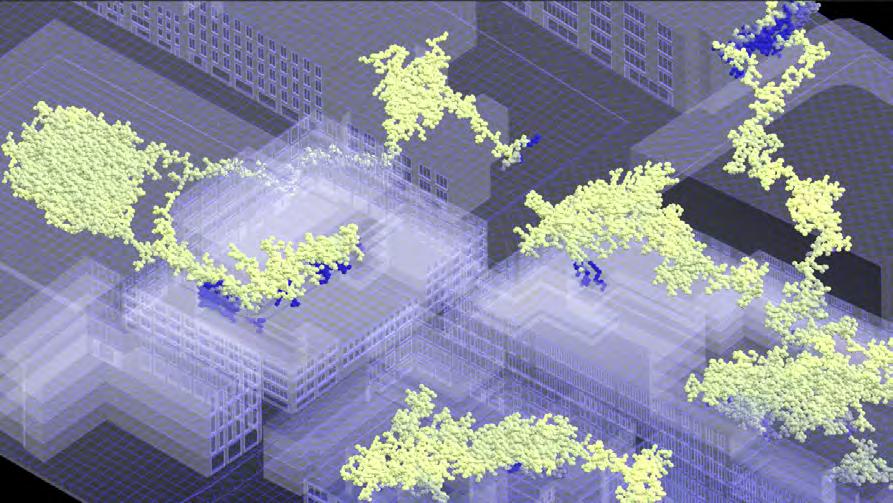
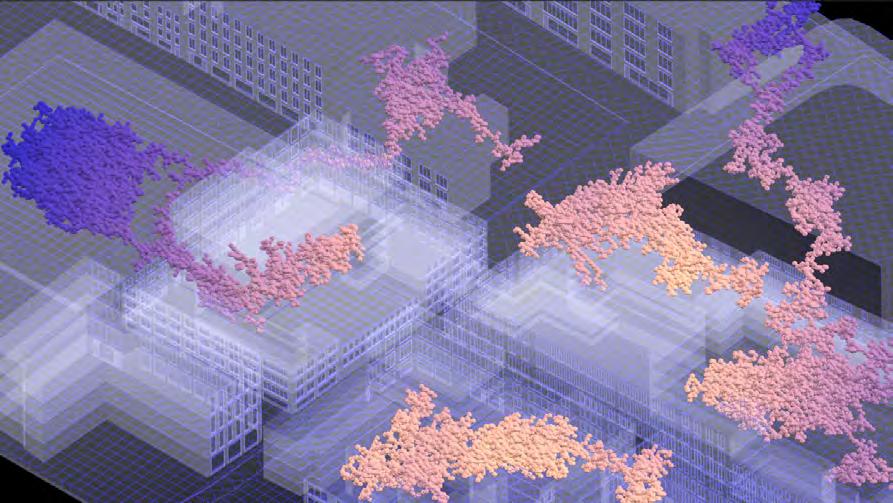
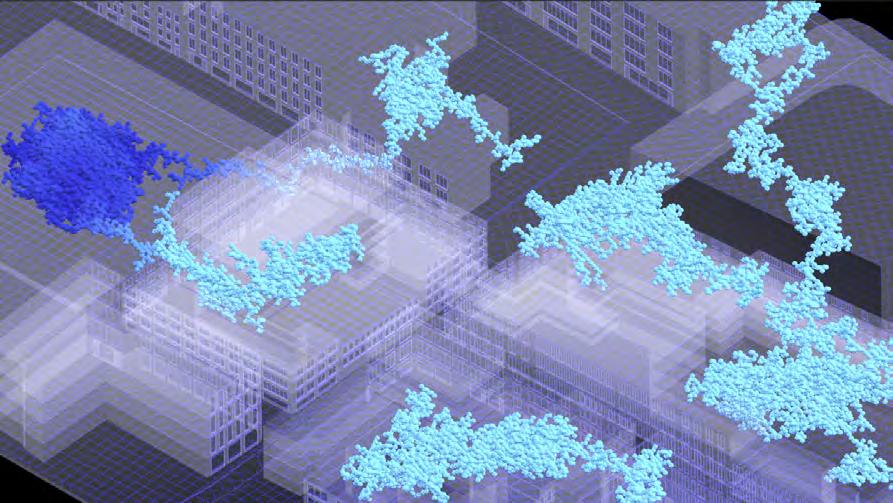
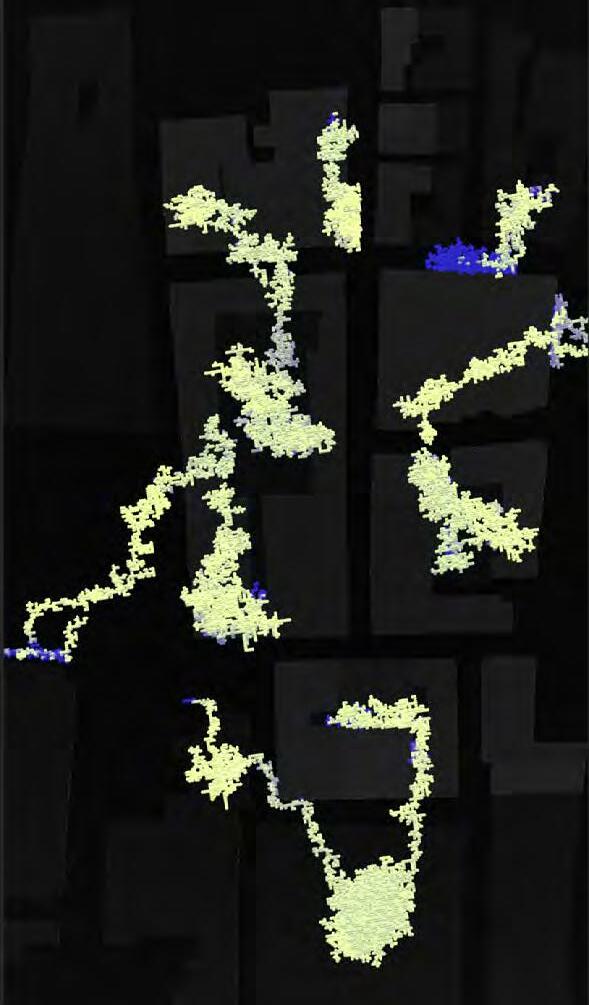
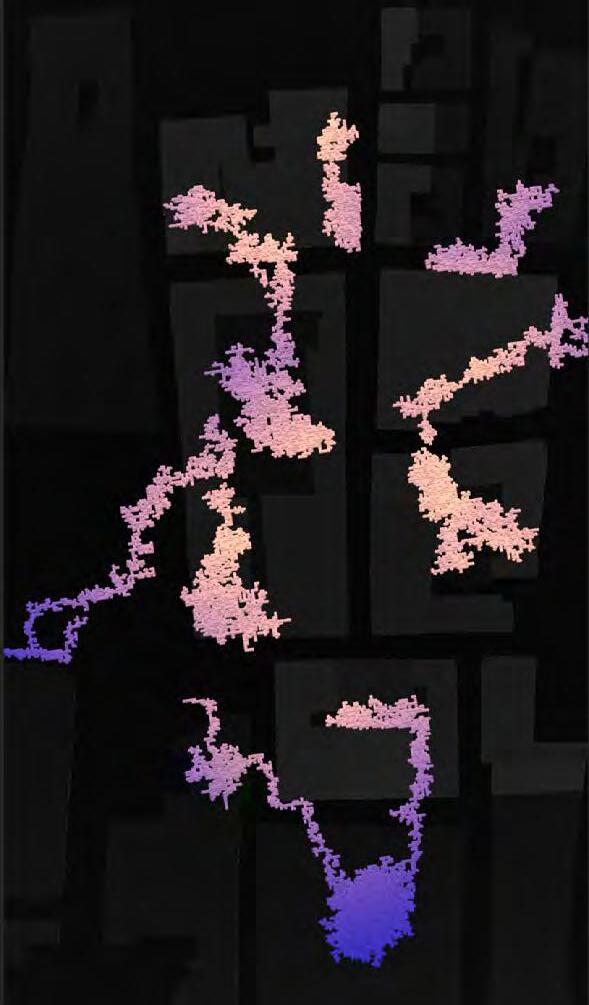
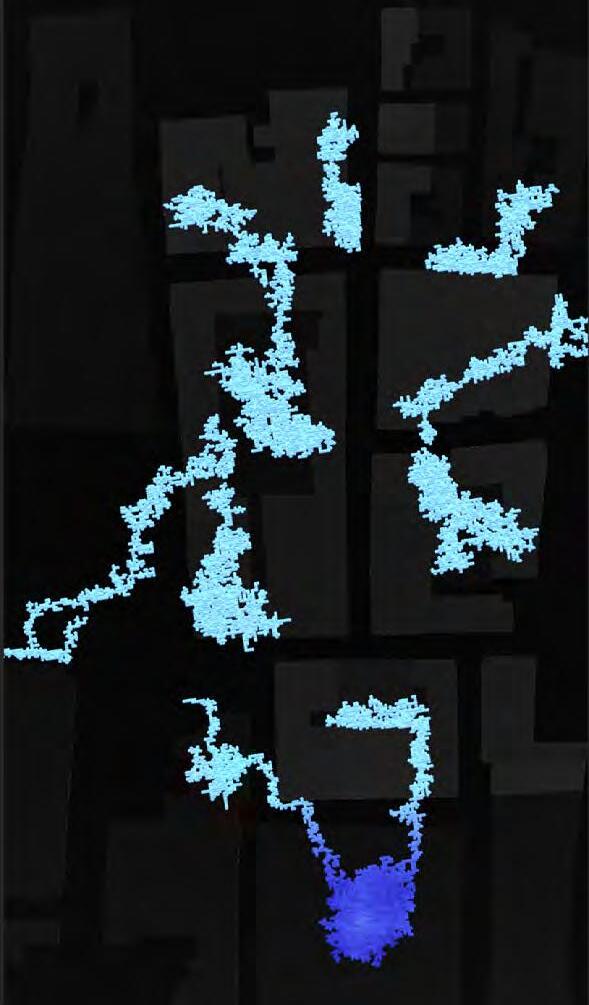
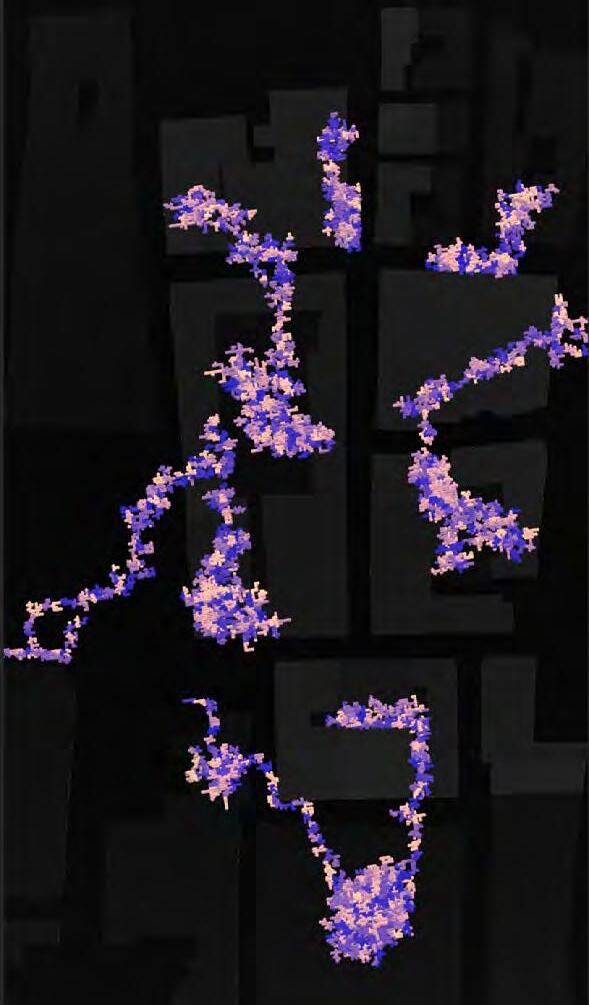
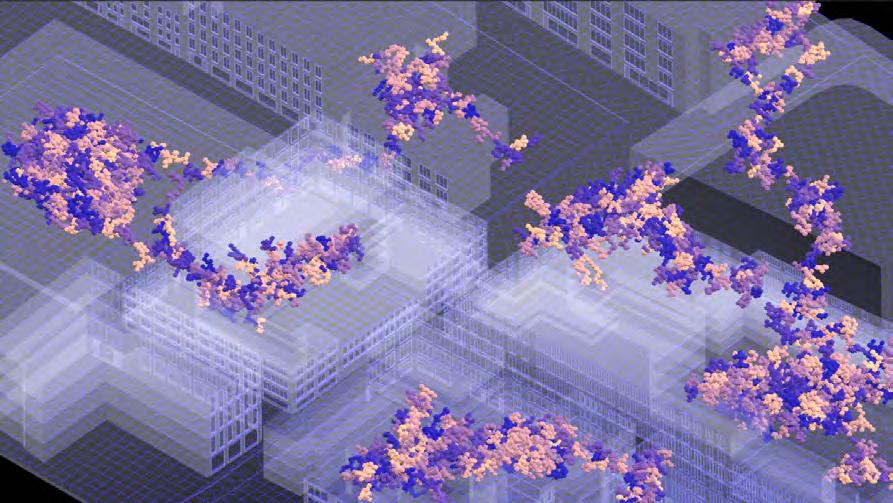
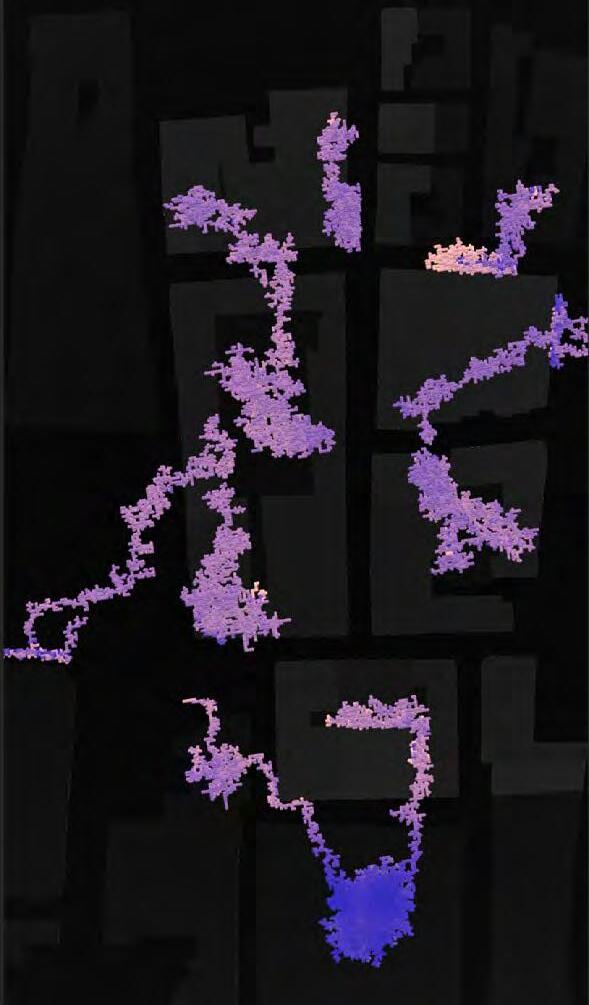
PRODUCTION_PROTECTION MODULE GRADIENT OF CHANGE
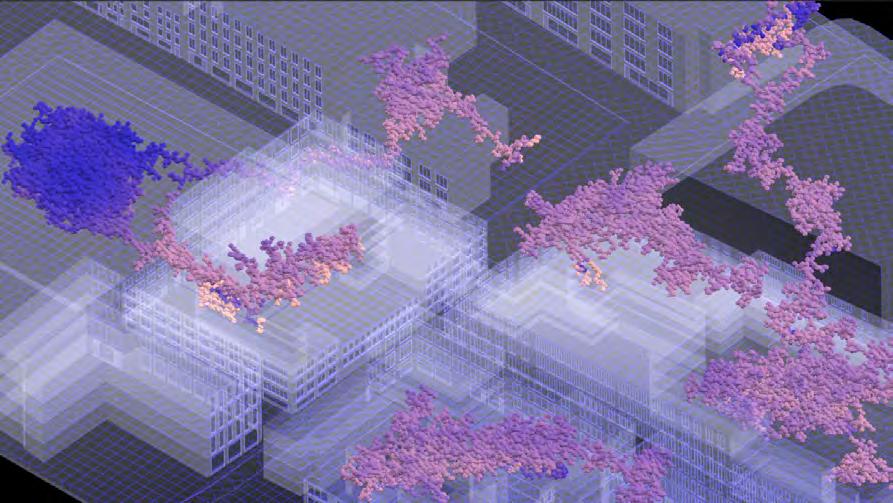
FILTRATION_PRODUCTION
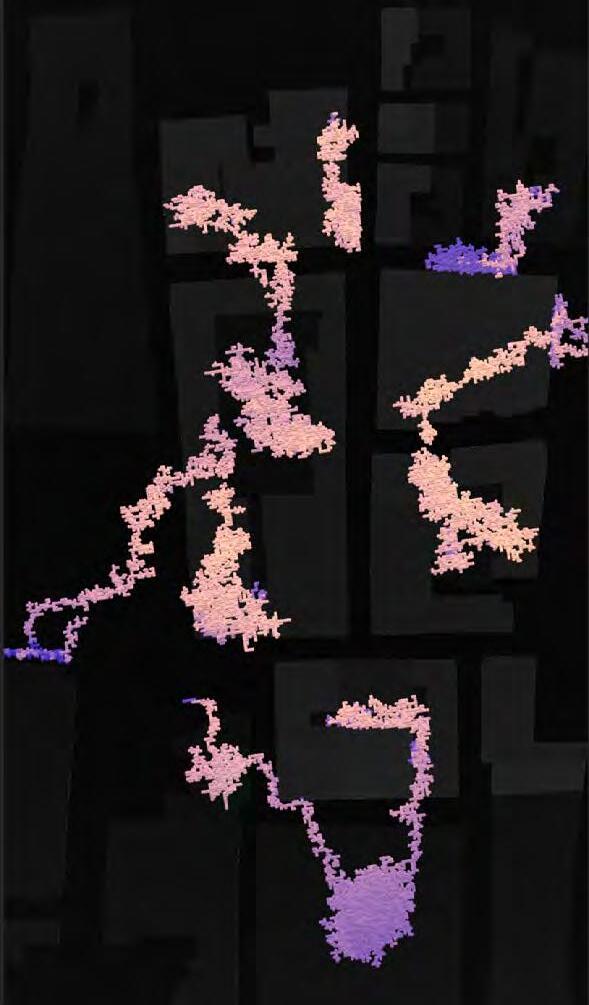
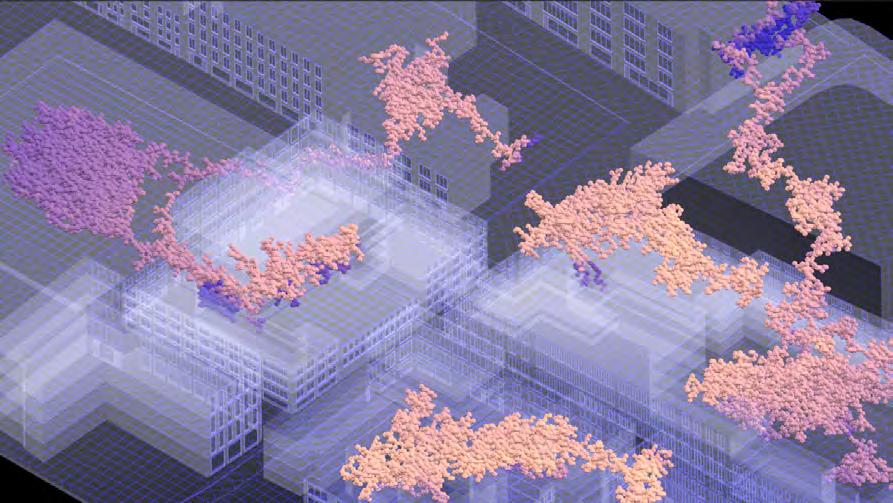
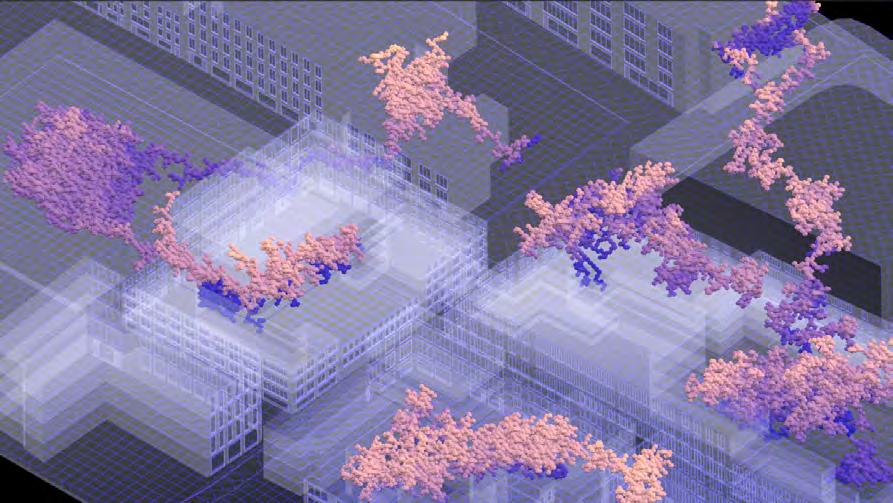
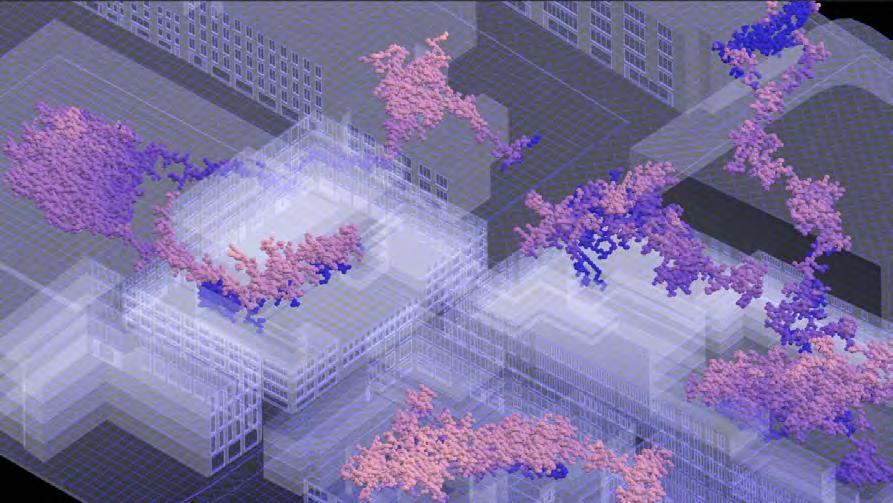

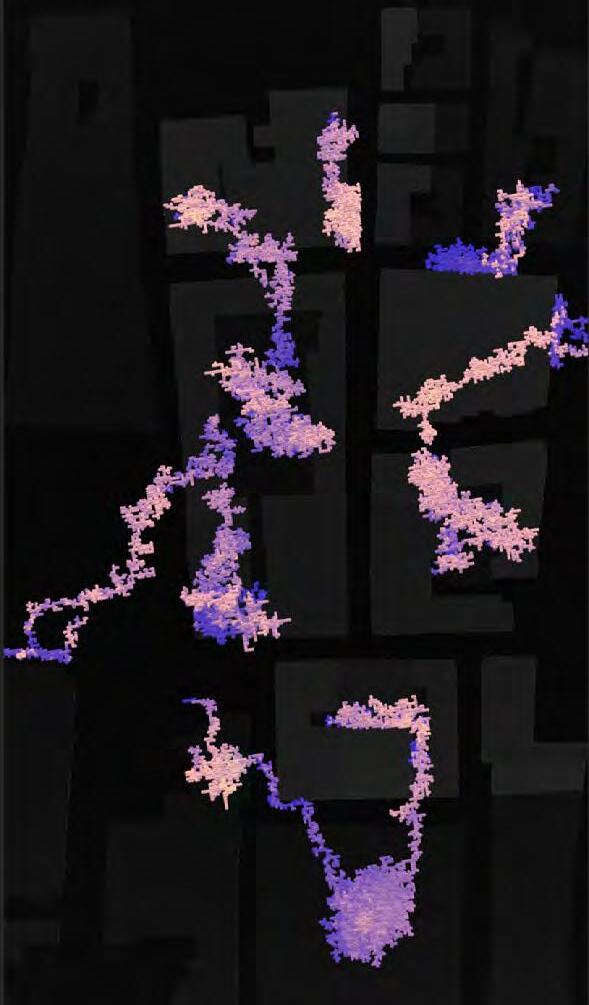
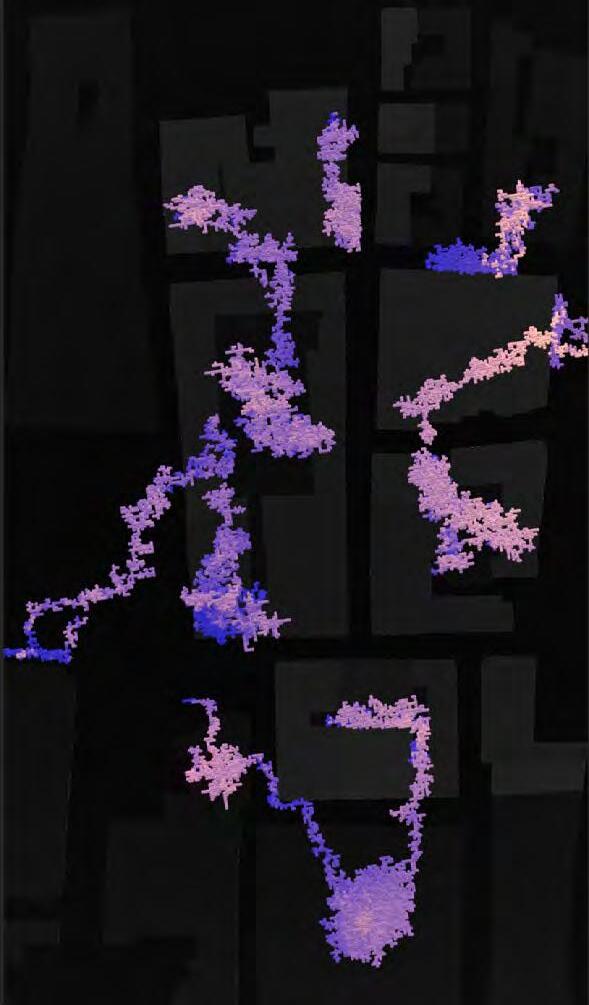
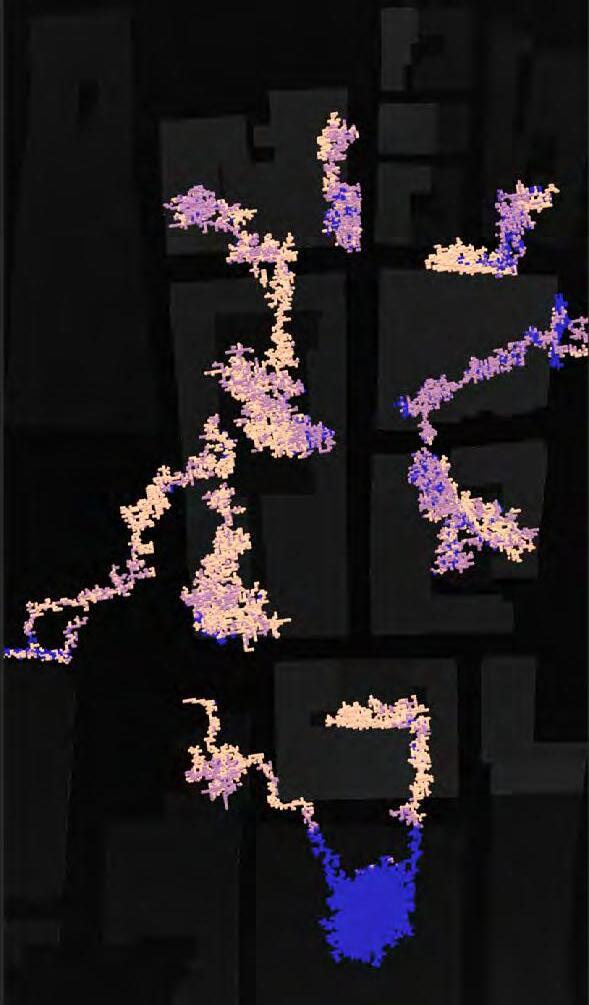
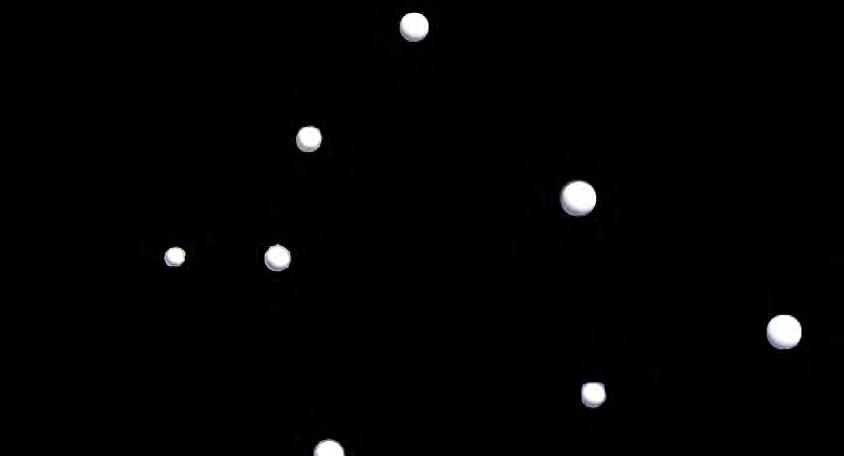
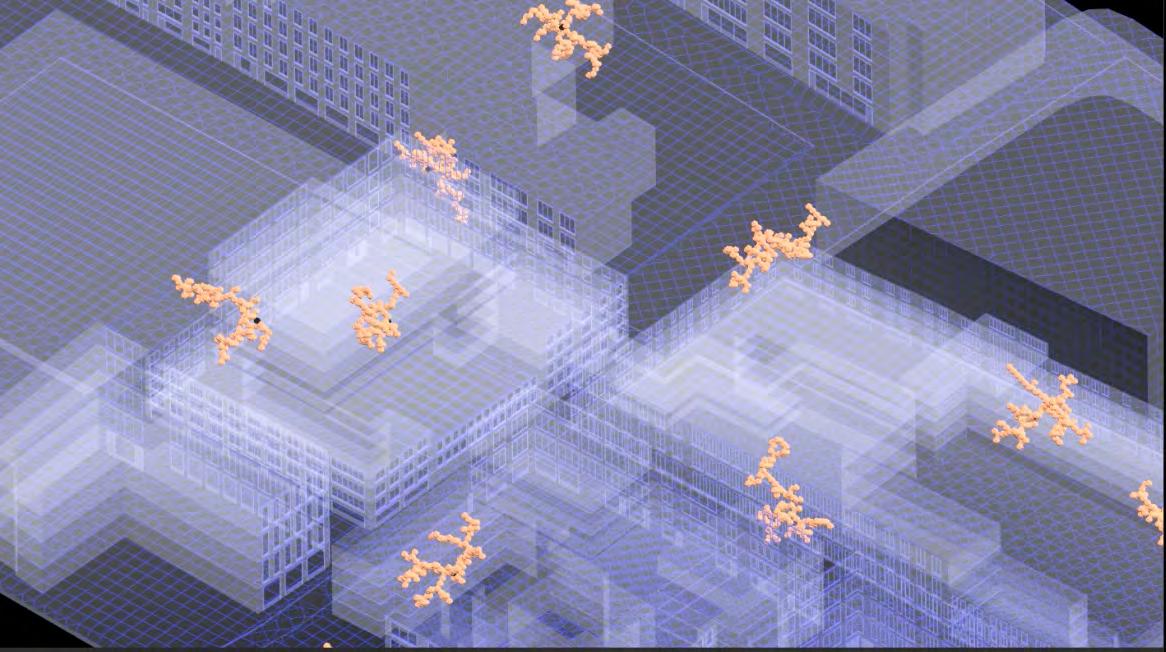
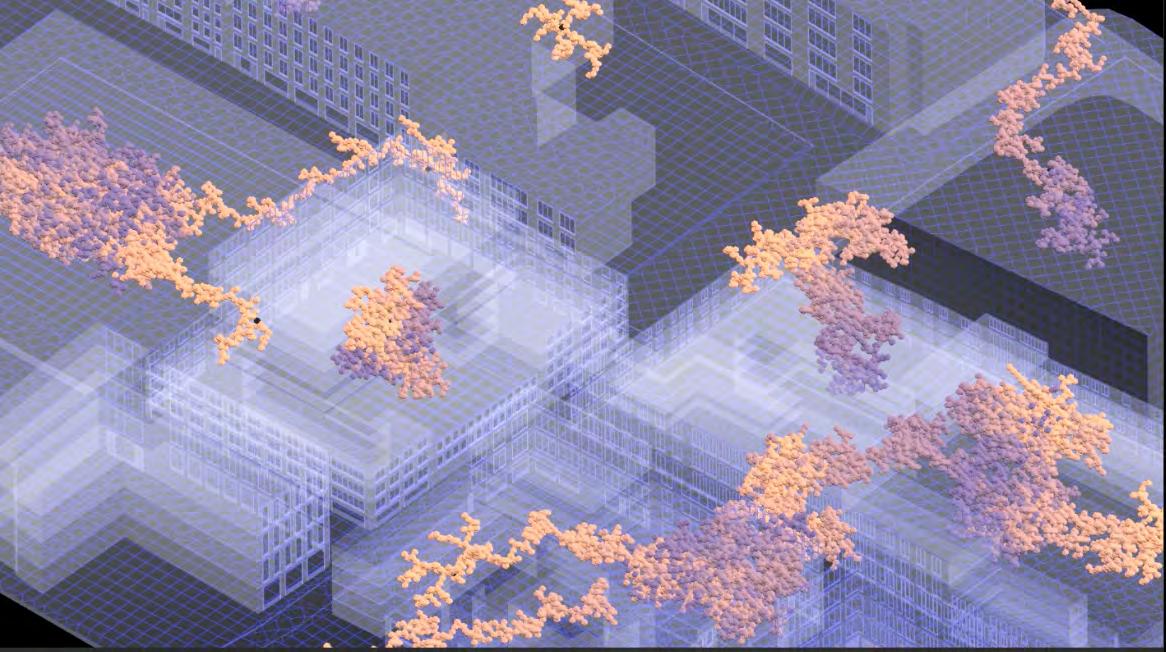
Fig.142. Starting points and count (simulation 3) isometric
Fig.143. Agents assembling at starting points (option 3) isometric
Fig.144. Final network morphology (option 3) isometric

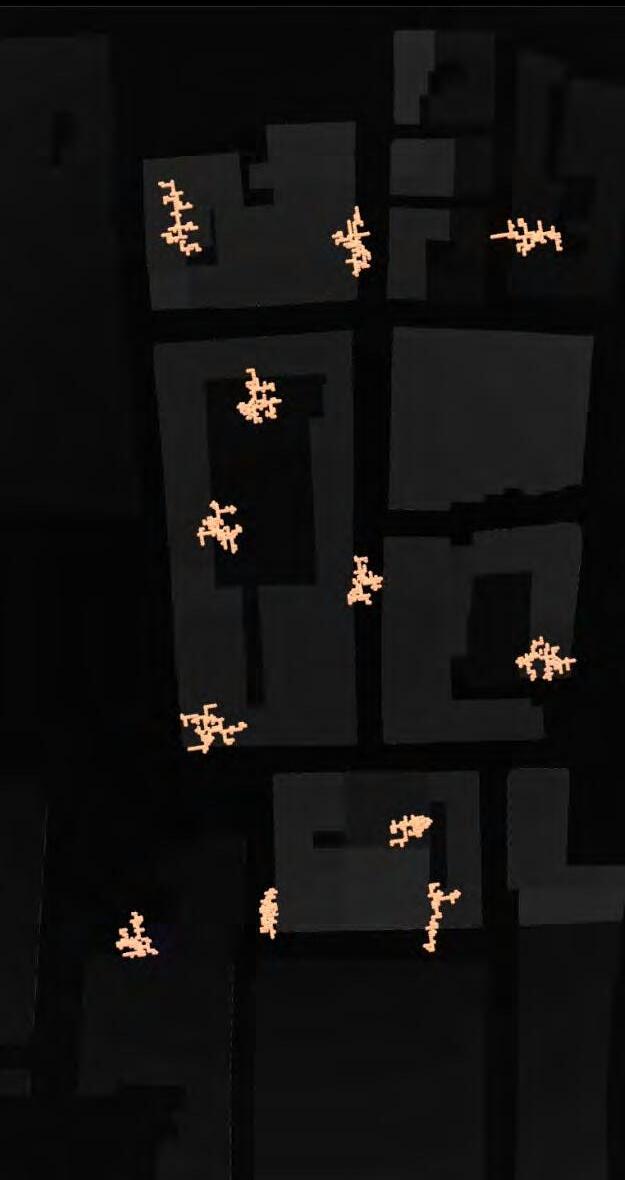
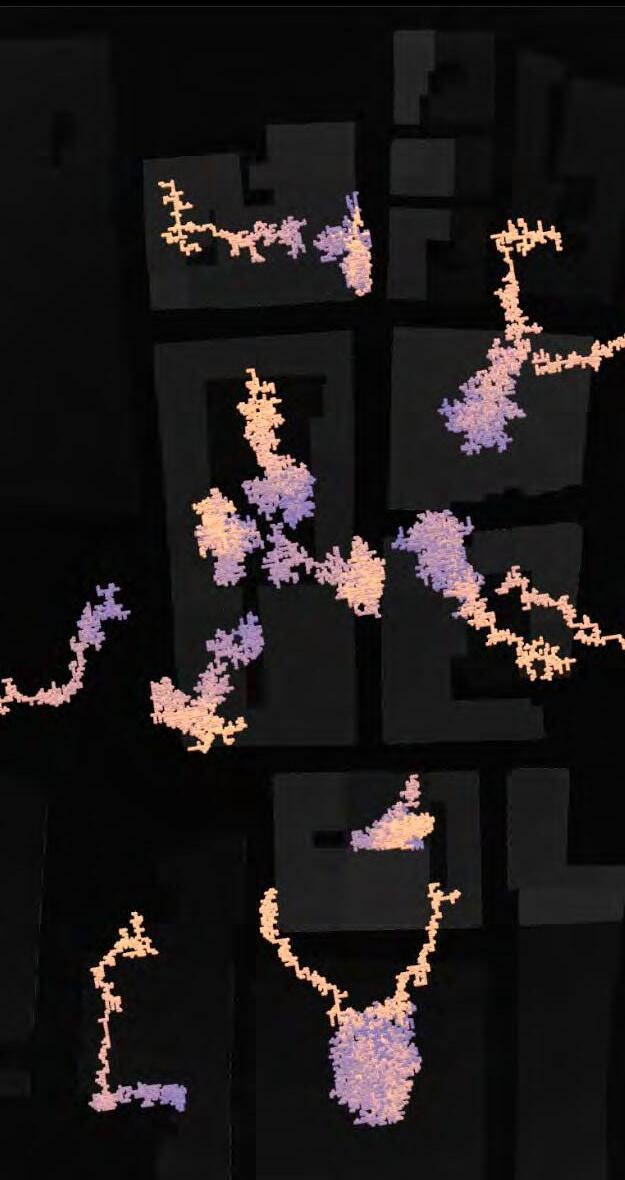
NETWORK OPTION 3
In option 3 of the network generation simulation, the clustering level was set to a medium threshold, resulting in 15 locations being used as the starting points for network generation, with the number of agents required to be generated first for each location and successfully being further reduced. It can be observed that by setting the starting point to 15, the network as a whole generated more branches and thus each attribute was more easily reached compared to the previous options 1 and 2. It was also observed that the network distribution of the morphology between the starting point to the attractor became less more regularised compared to both options 1 and 2, allowing for the use of fewer agents to achieve the goal of connecting the various target locations. Simultaneously, the vast buildup of agents in specific regions was drastically decreased. Therefore, when the clustering level was set to a medium threshold and utilised 15 locations as the starting point for network generation, this network generation best met the requirements of the project.
Fig.145. Starting points and count (option 3) top view
Fig.146. Starting points and count (option 3) top view
Fig.147. Starting points and count (option 3) top view
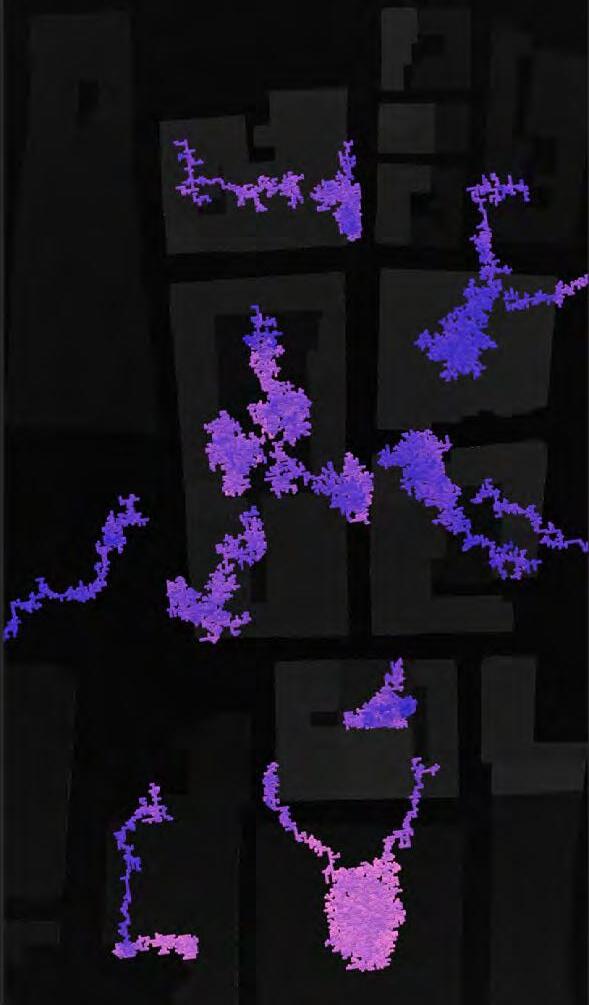
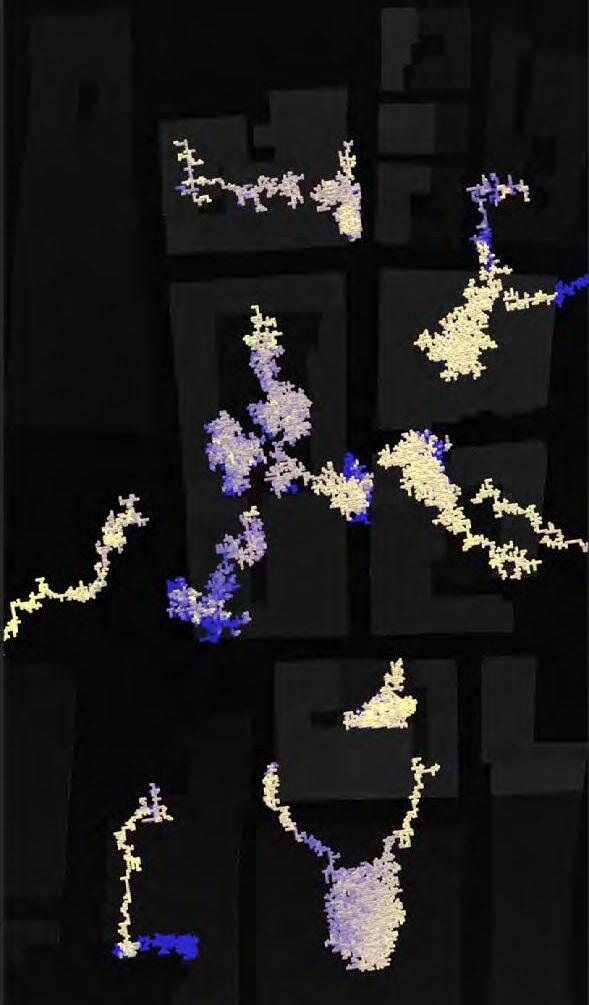
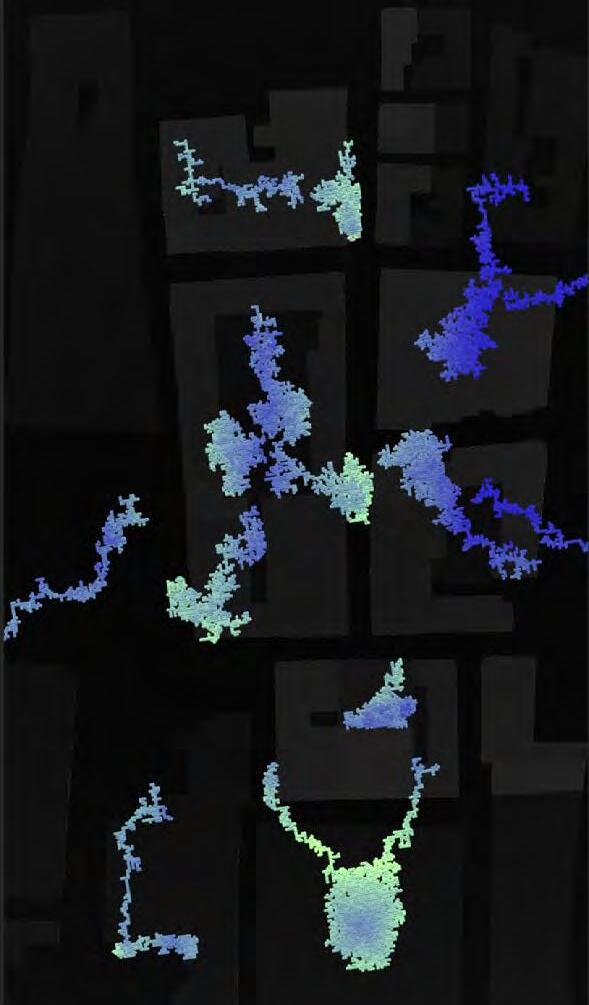
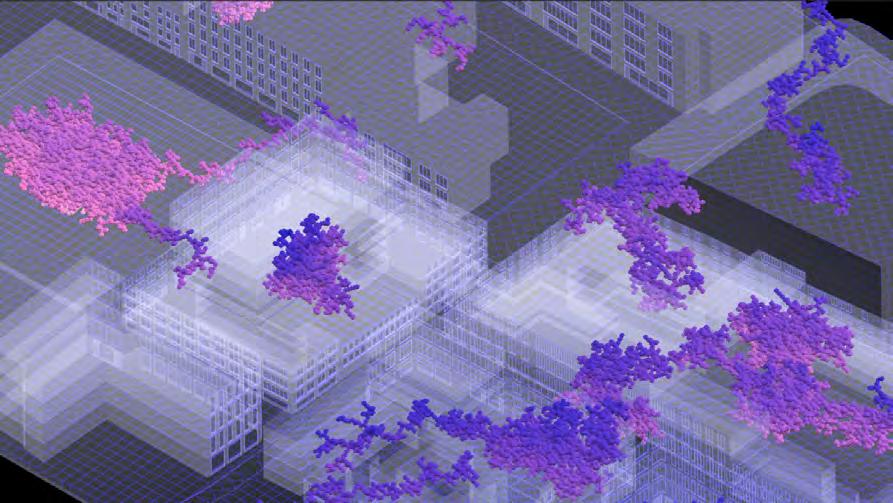
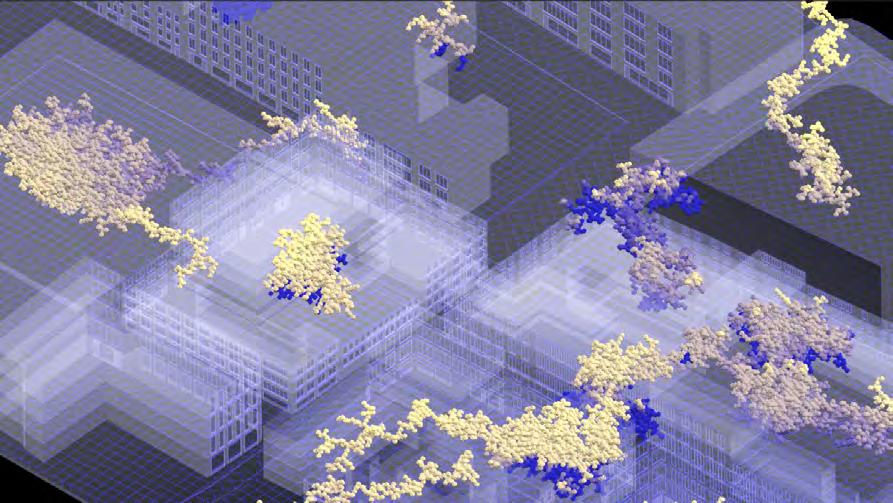
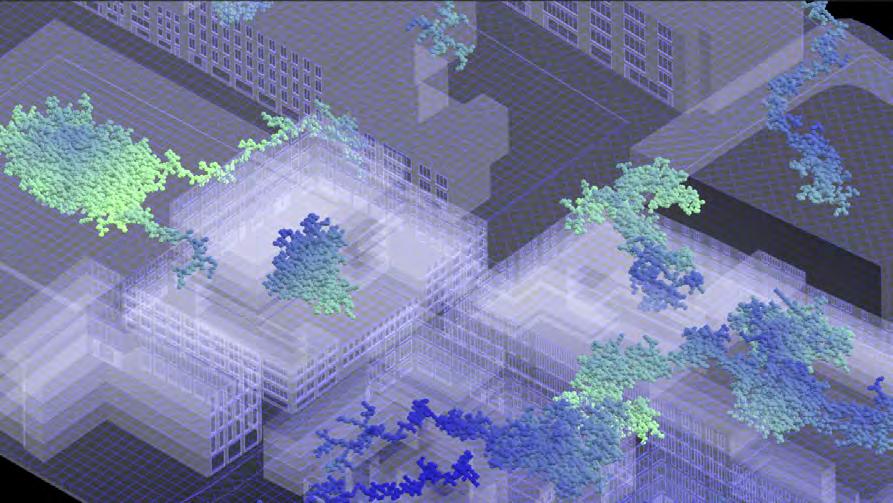
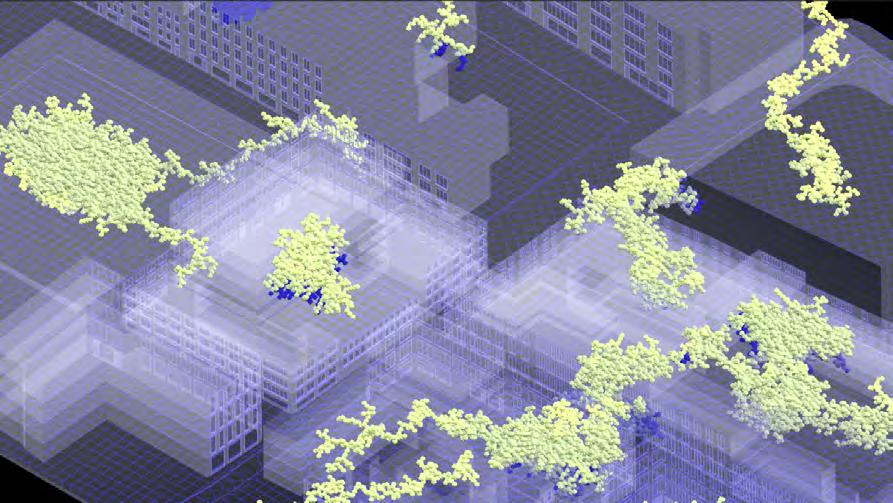
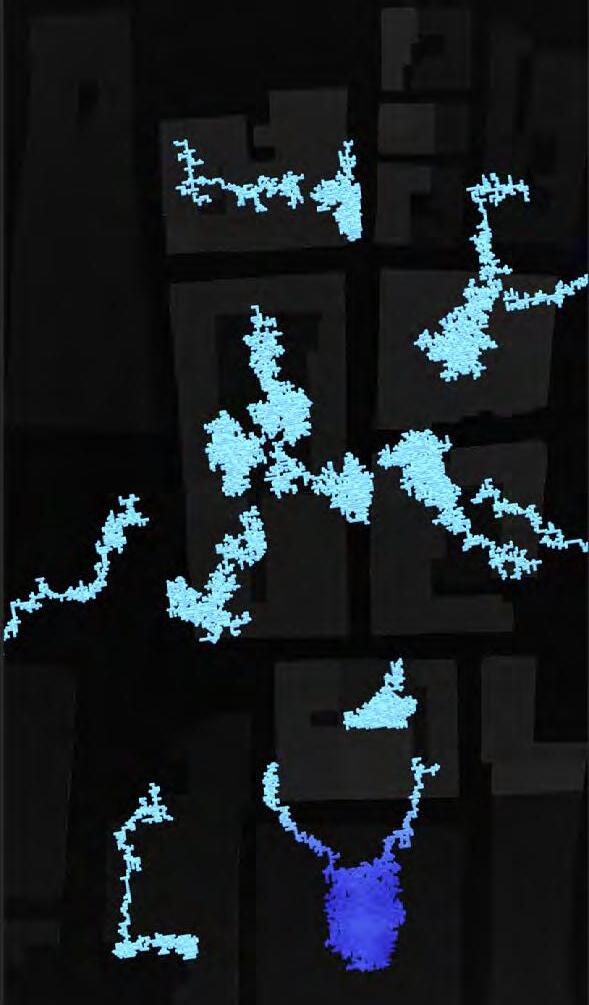
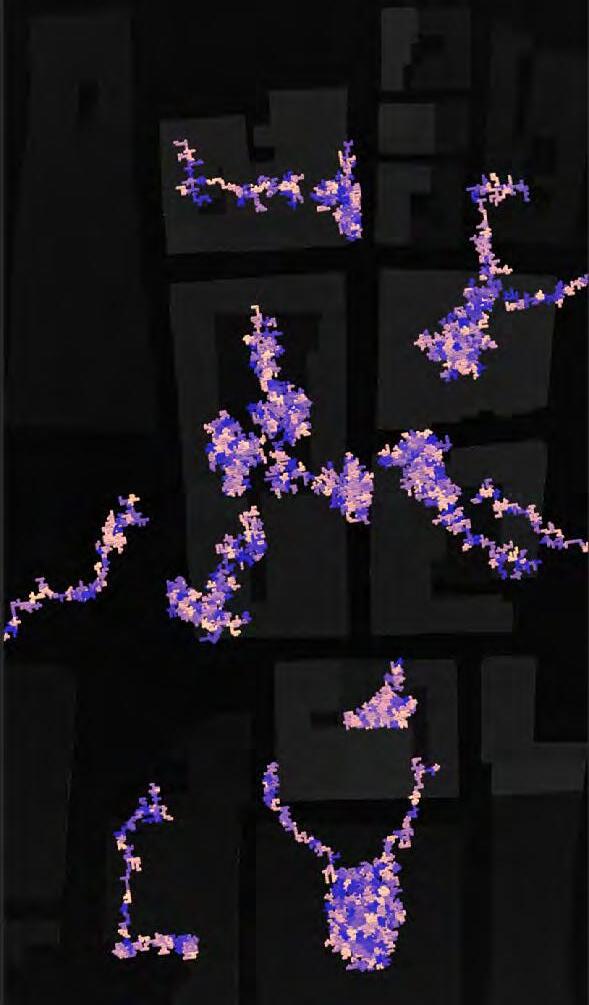
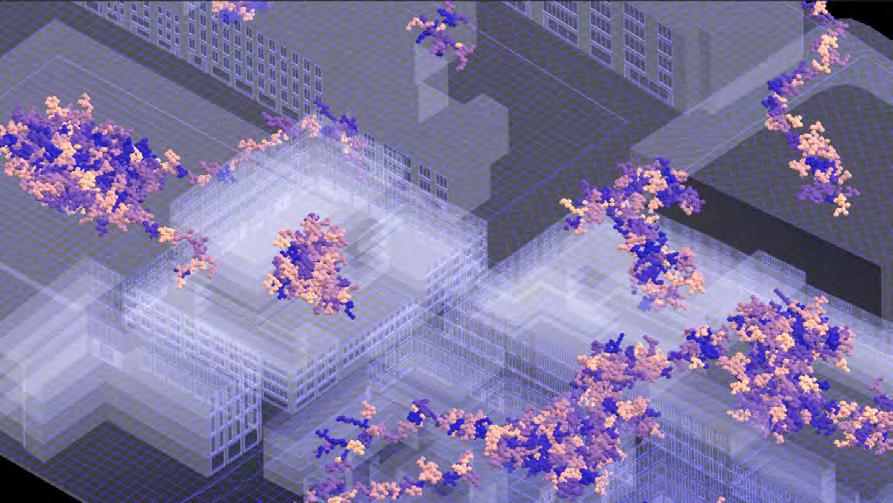
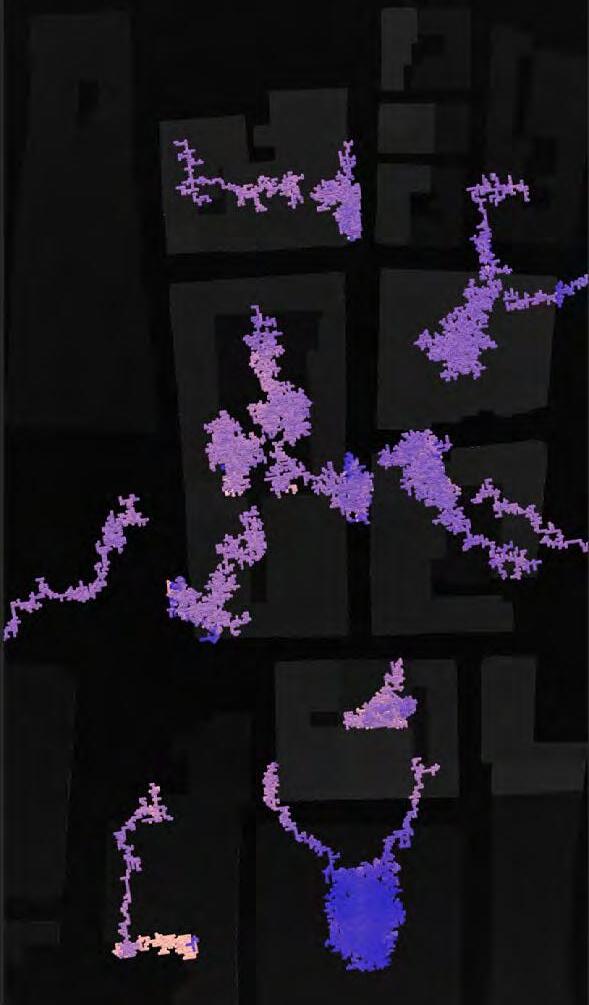
PRODUCTION_PROTECTION MODULE GRADIENT OF CHANGE
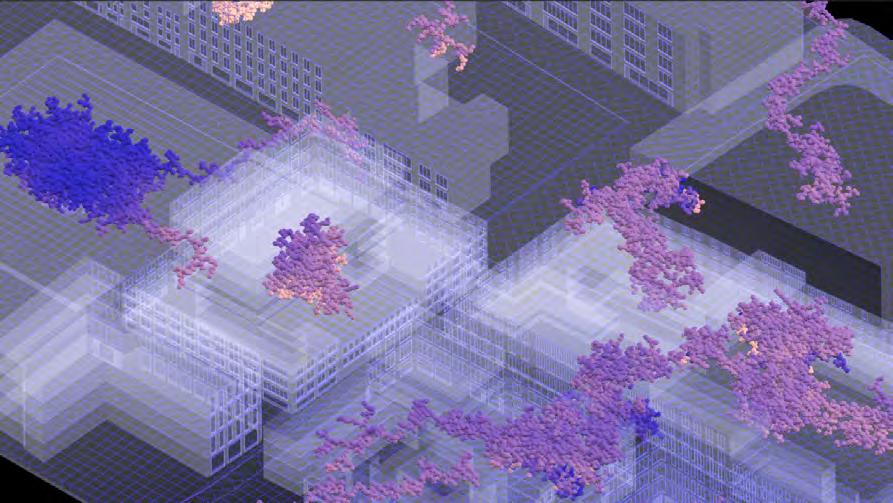
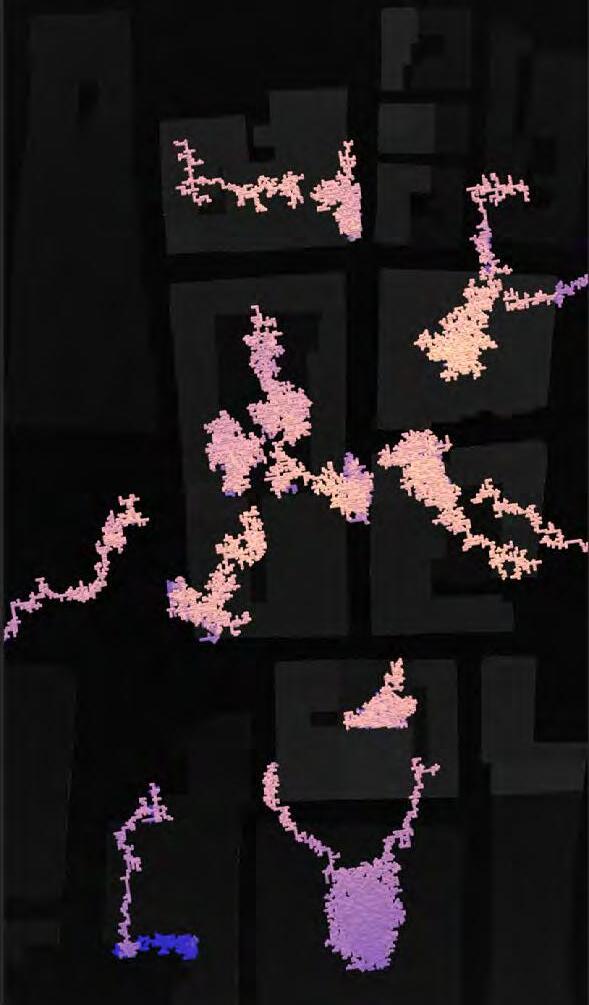
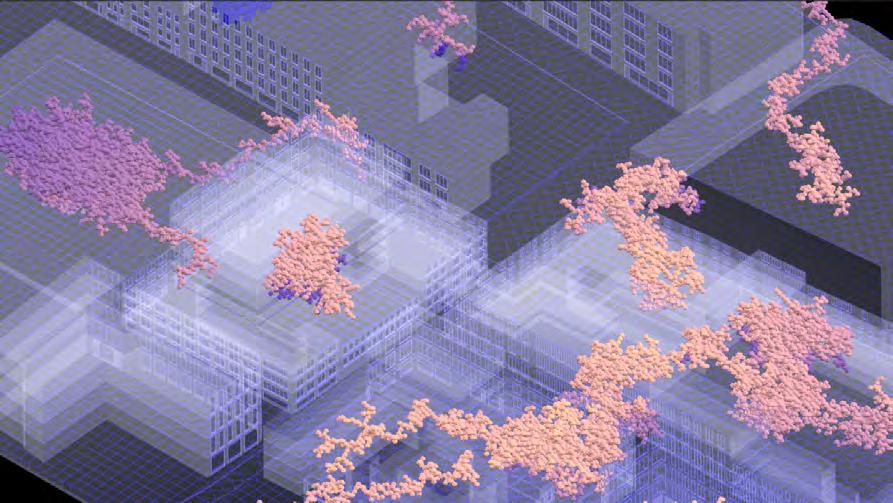
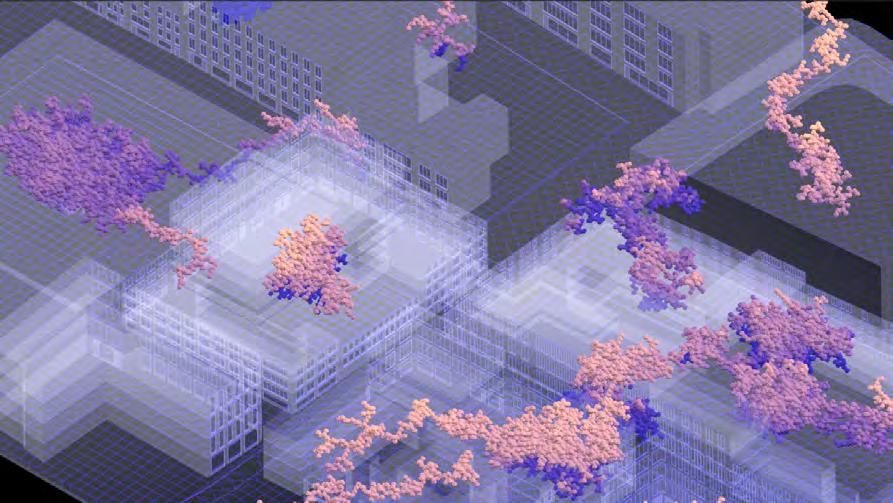
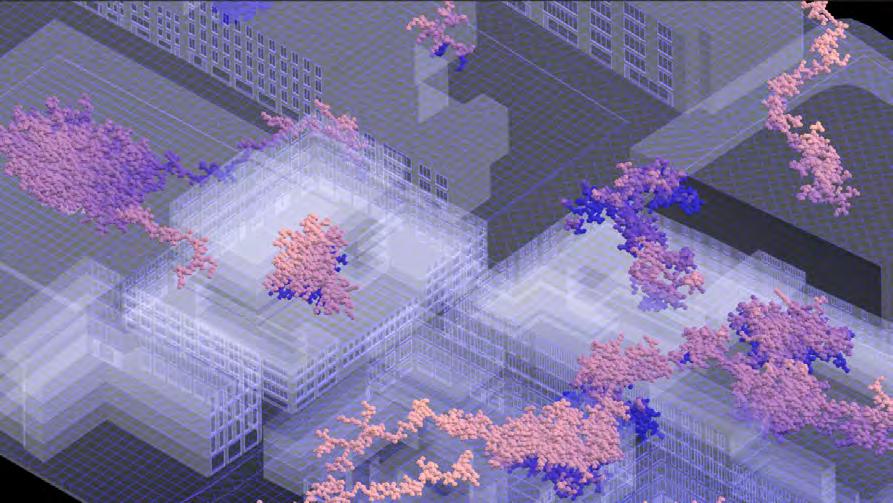
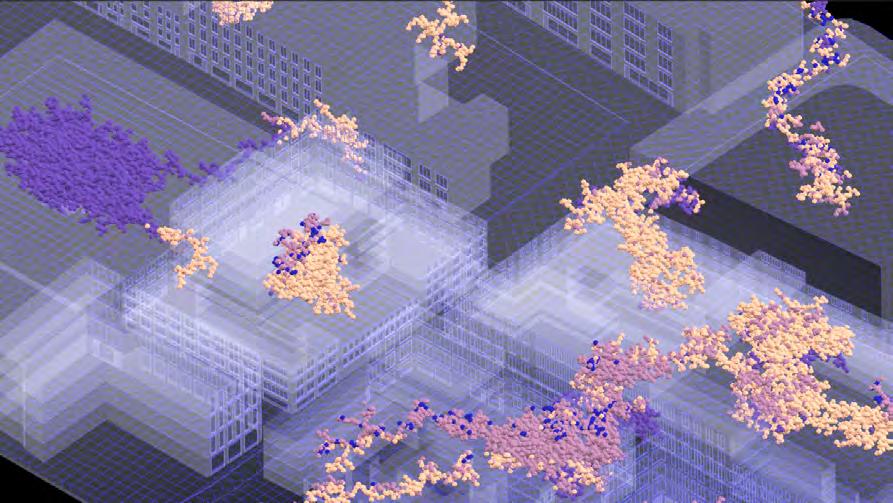
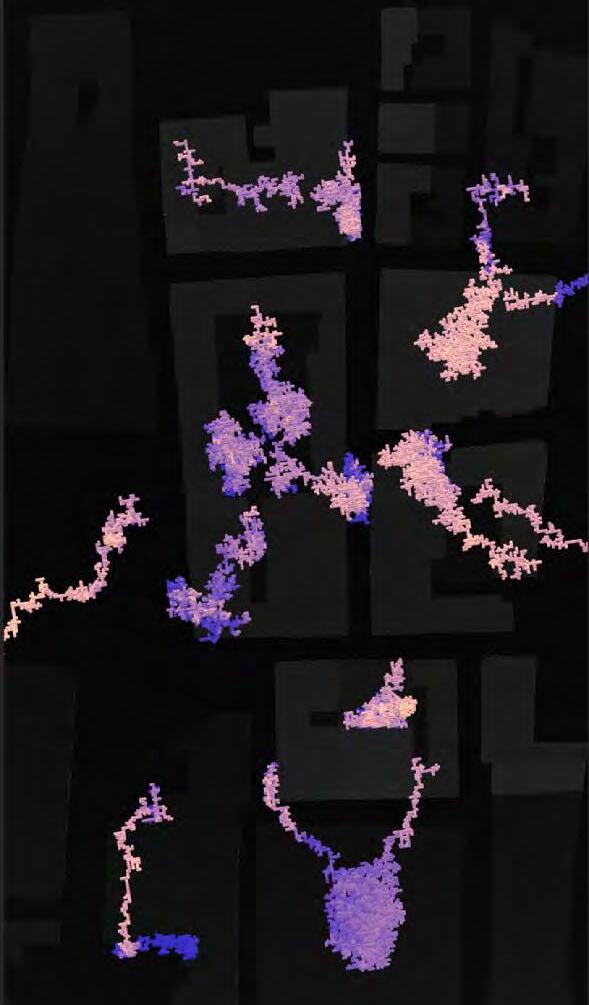
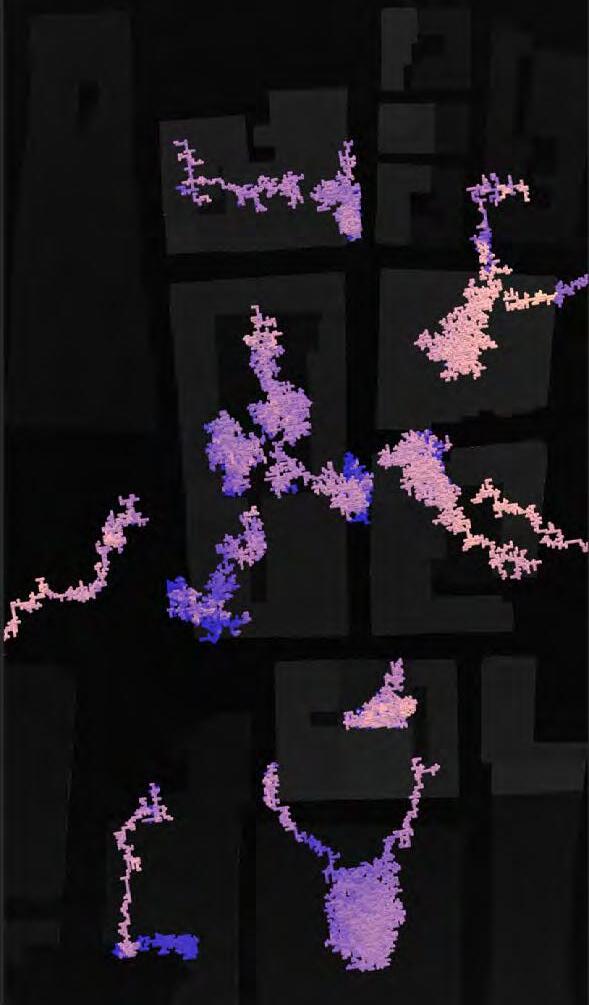
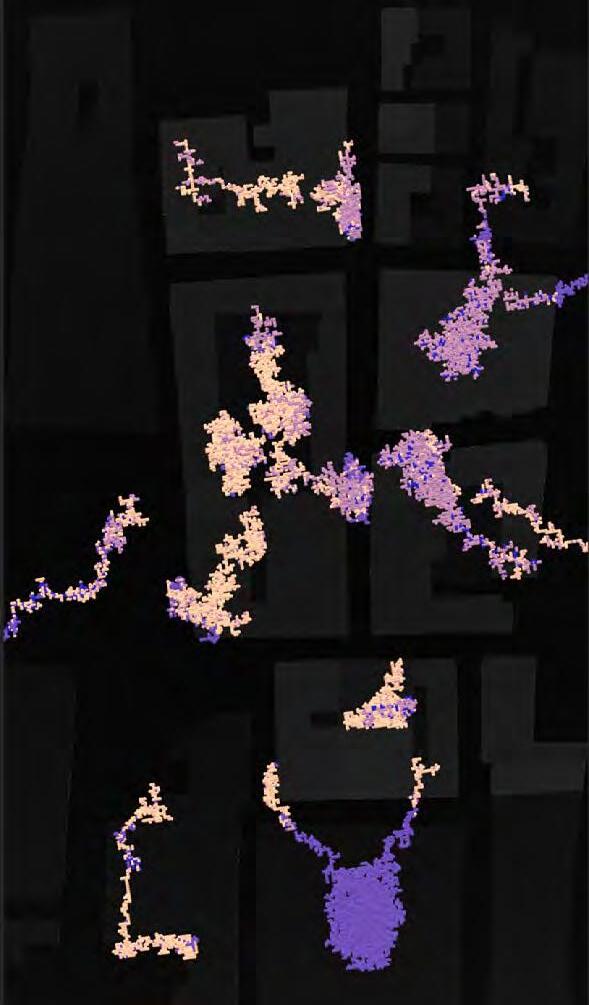
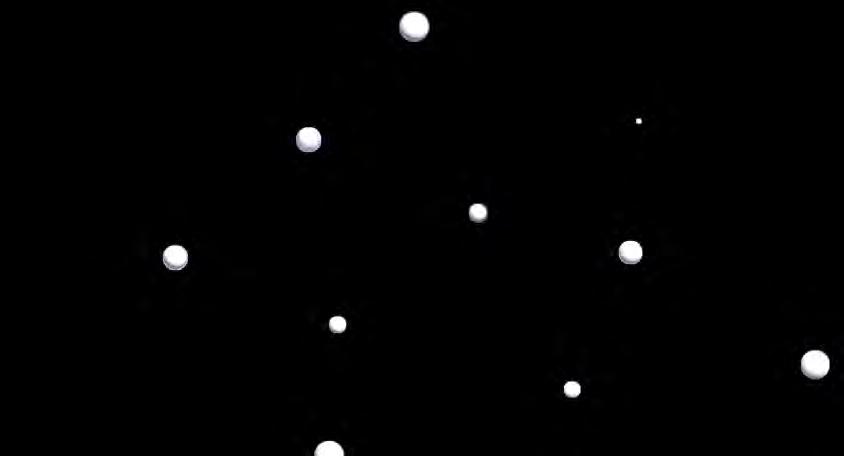
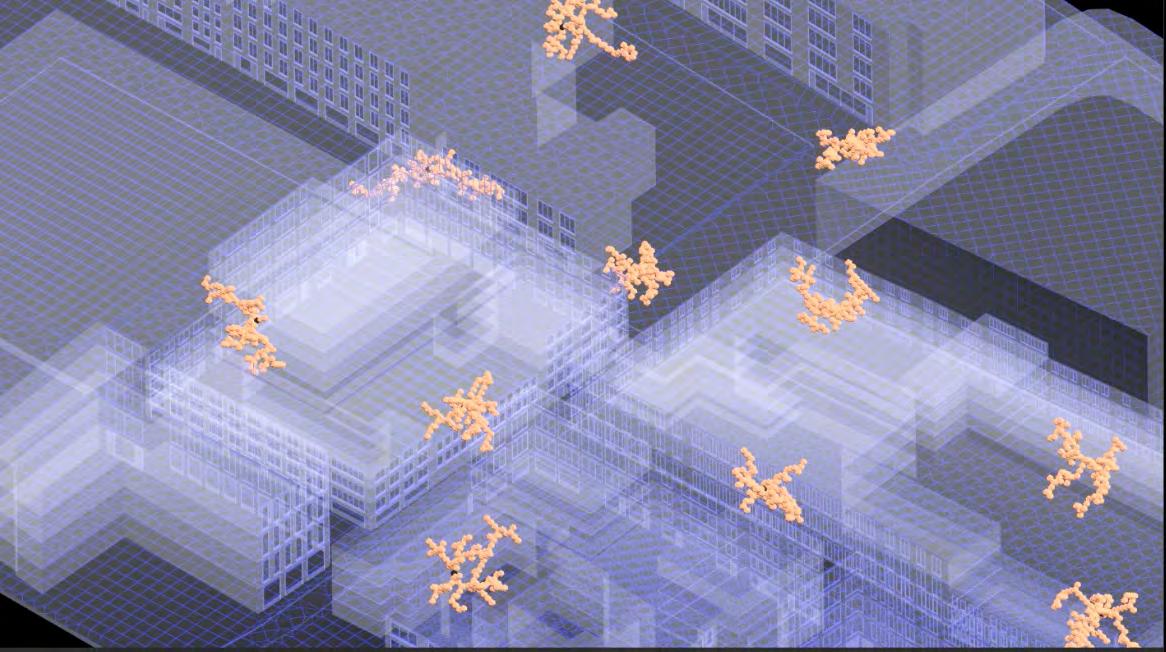
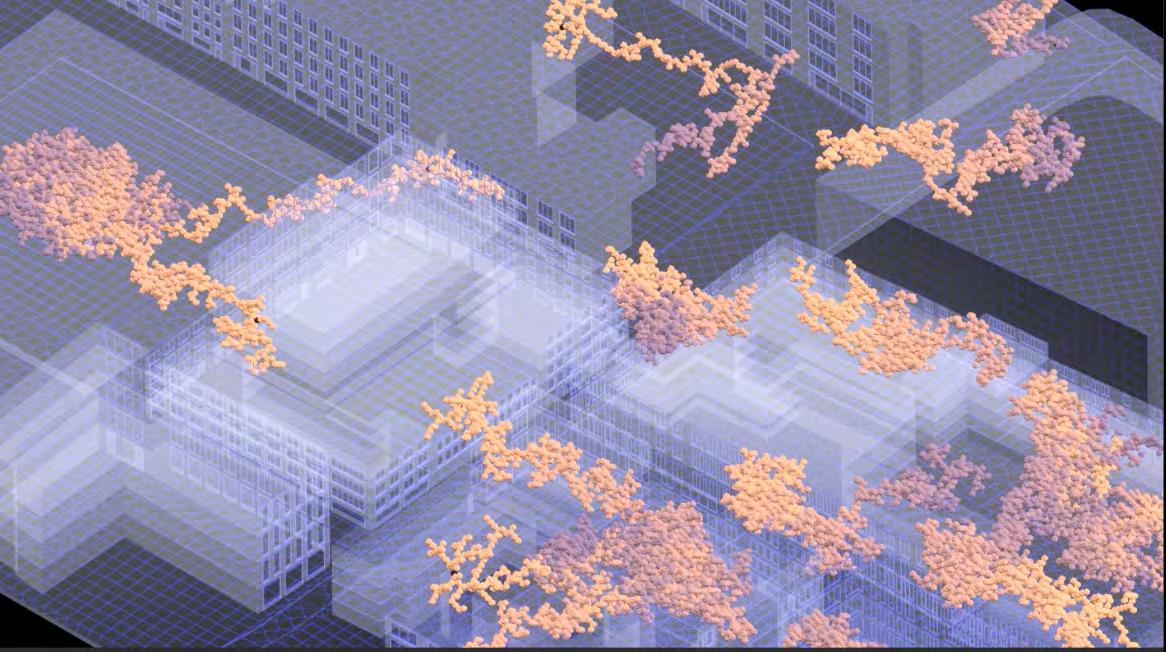
Fig.149. Starting points and count (simulation 4) isometric
Fig.150. Agents assembling at starting points (simulation 4) isometric
Fig.151. Final network morphology (simulation 4) isometric
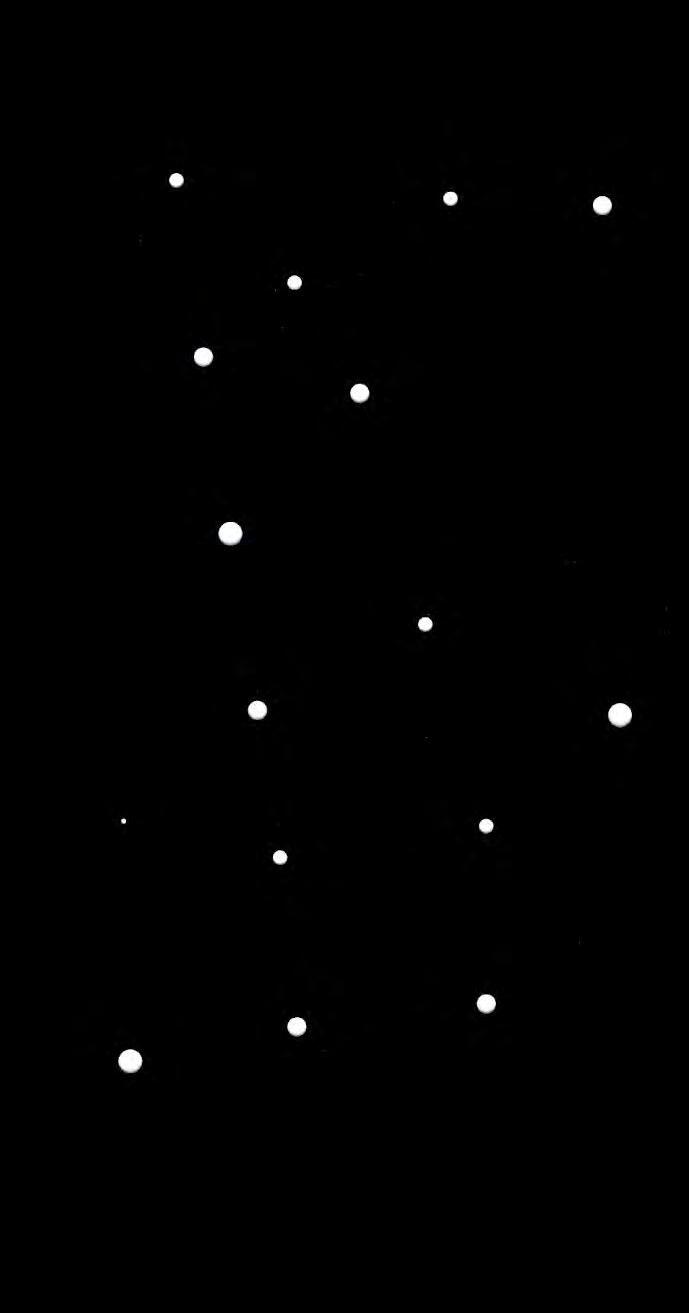
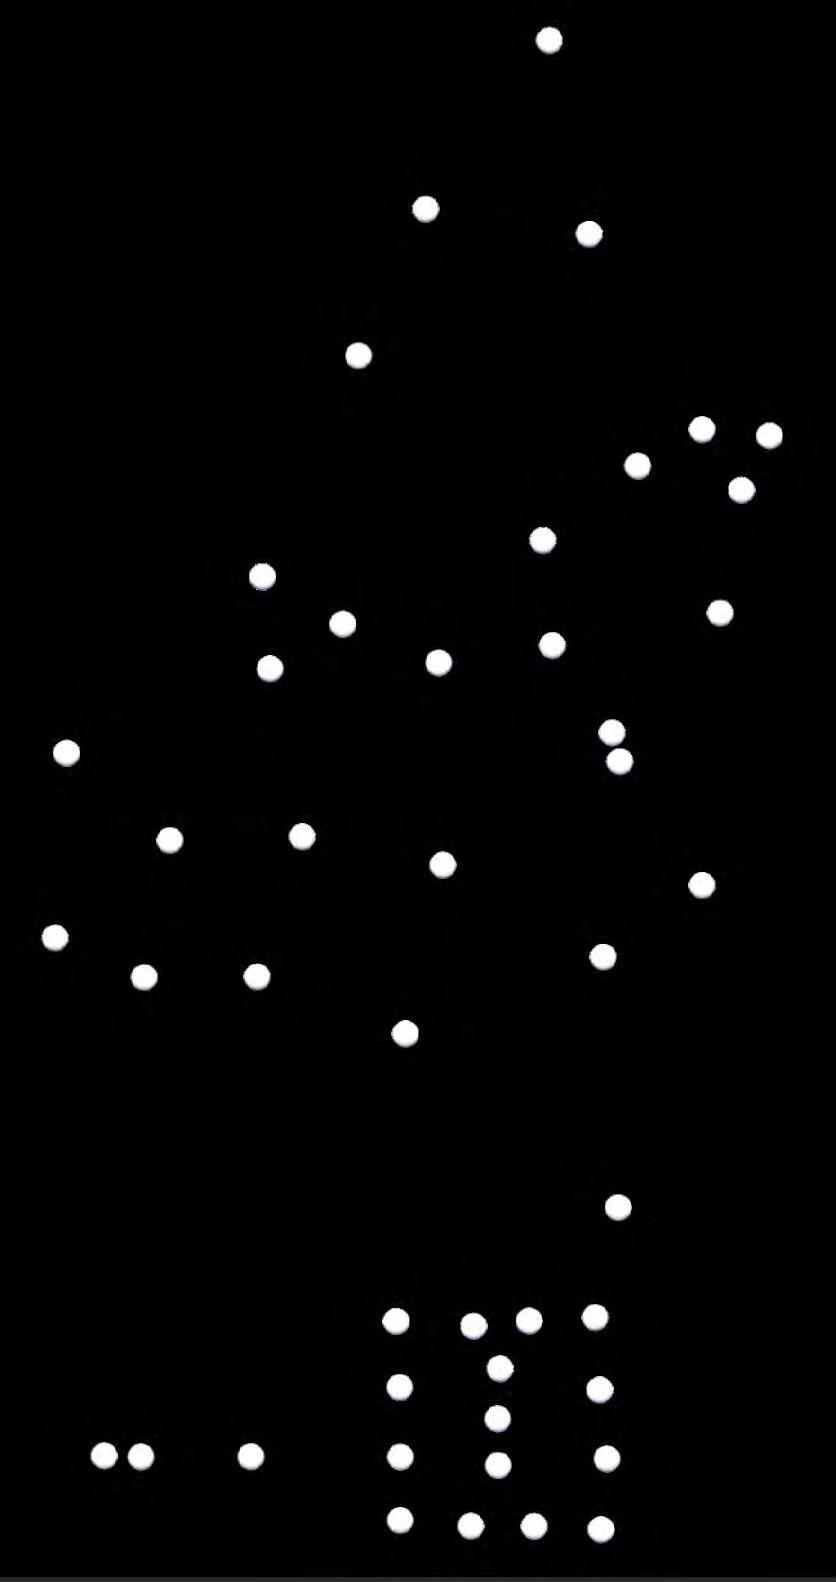
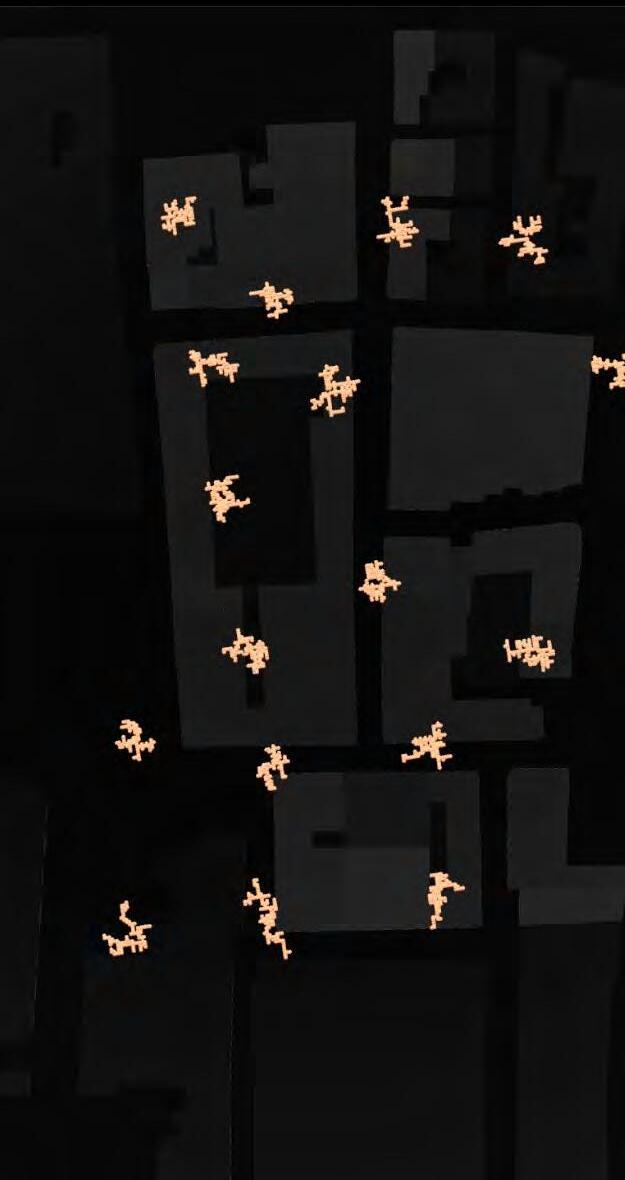
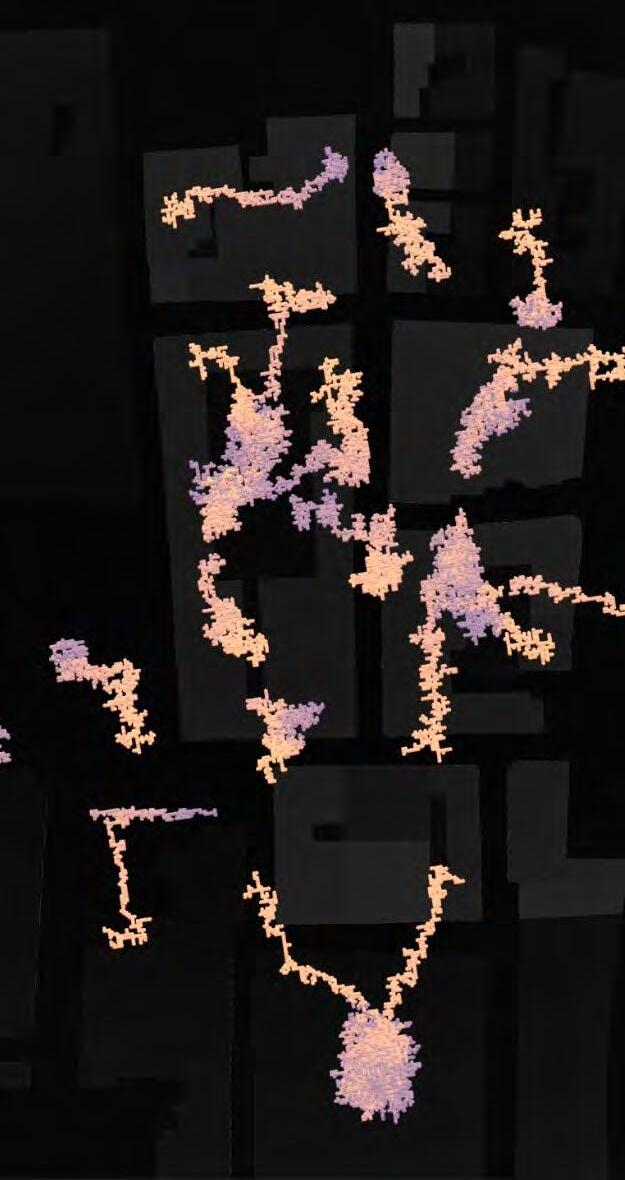
NETWORK OPTION 4
In option 4 of the network generation simulation, the clustering level was set to the lowest threshold, resulting in 20 locations being generated as the starting points for the network, while the number of agents required to be generated first for each location was also reduced to the lowest level. By adjusting the starting point to 20, it was noticed that the network morphology reverted to a more linear rather than branching form, as the number of starting points and attractors became more proportionate. There was a one-to-one relationship extracted between the number of start points and the number of attractors, thus as the number of starting points increased, each attractor became more spatially accessible for growth and the network morphology became more fragmented. Therefore, this simulation did not meet the design requirements of reconnecting green spaces.
Fig.152. Starting points and count (simulation 4) top view
Fig.153. Starting points and count (simulation 4) top view
Fig.154. Starting points and count (simulation 4) top view
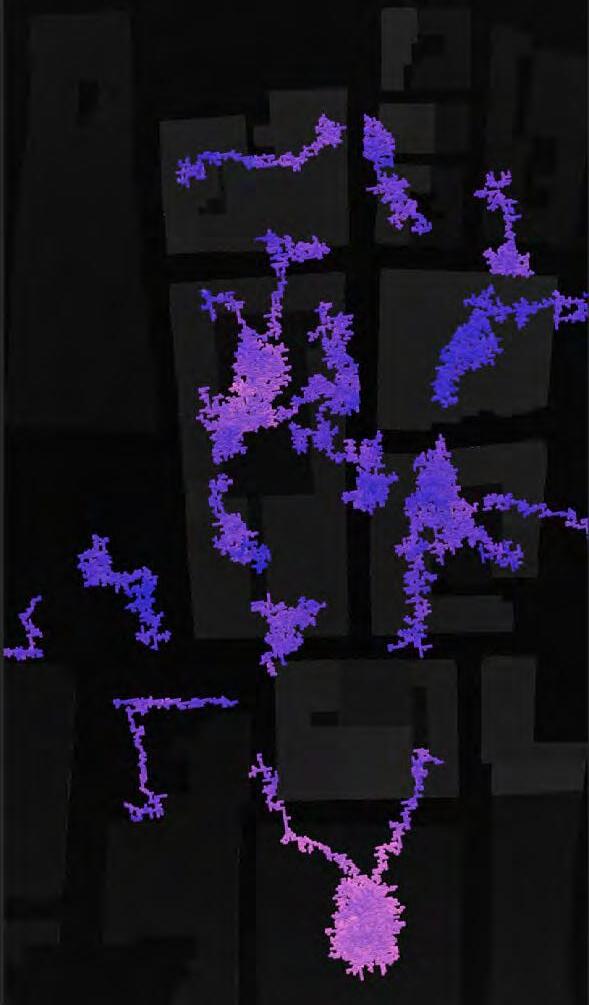
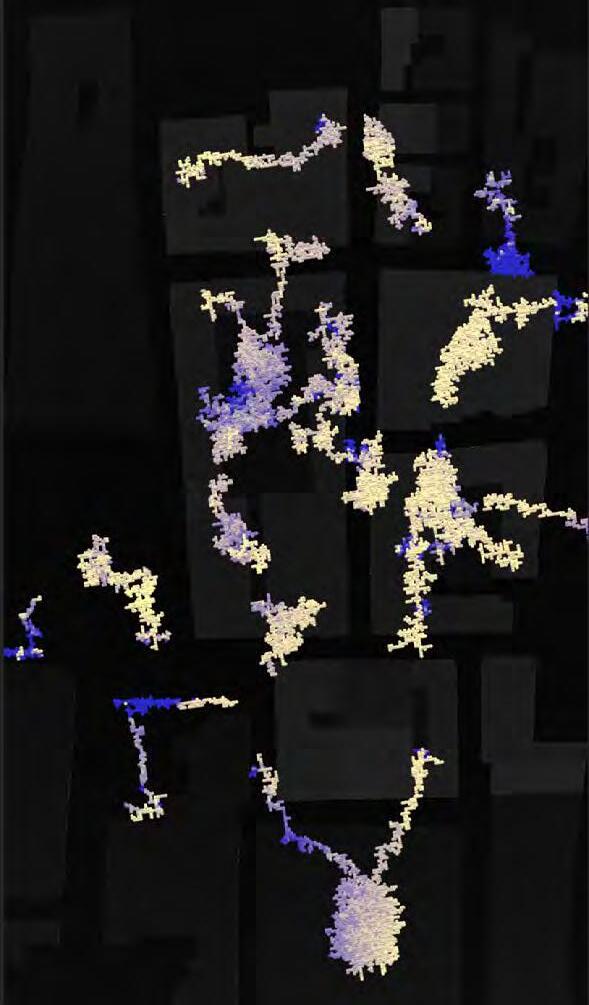
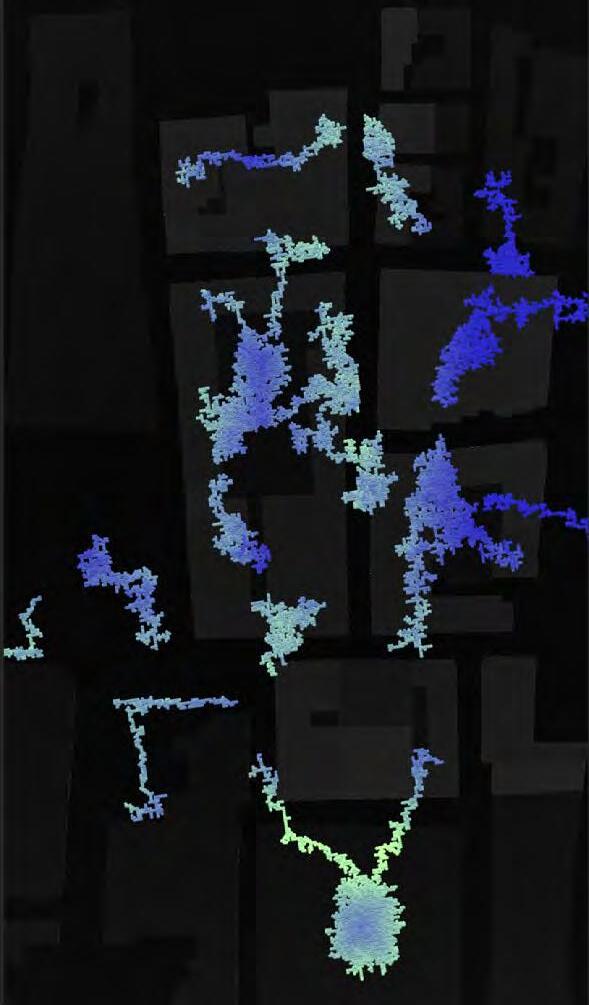
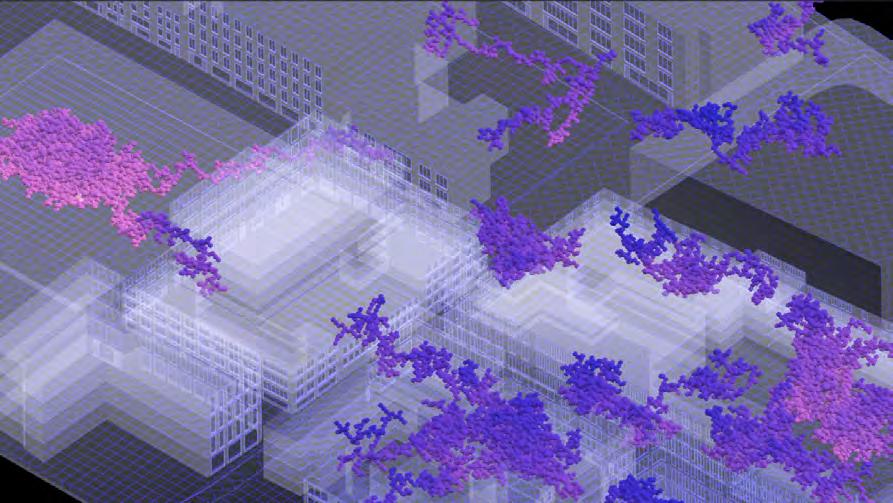
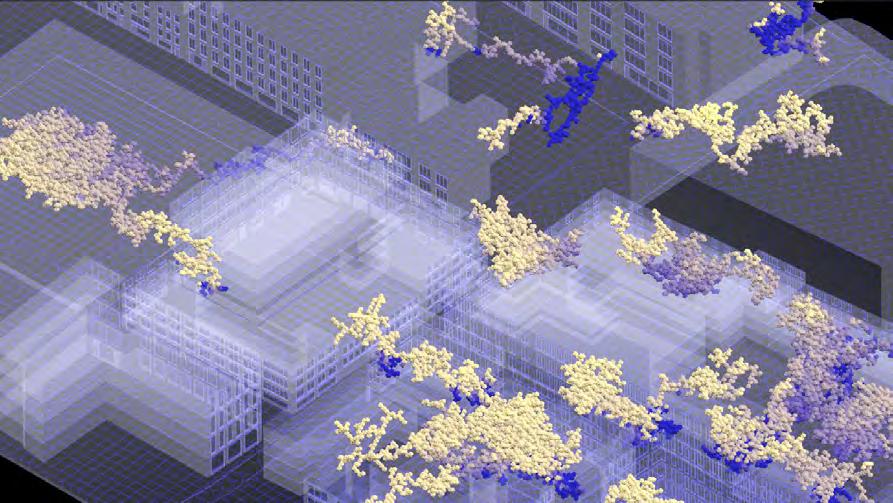
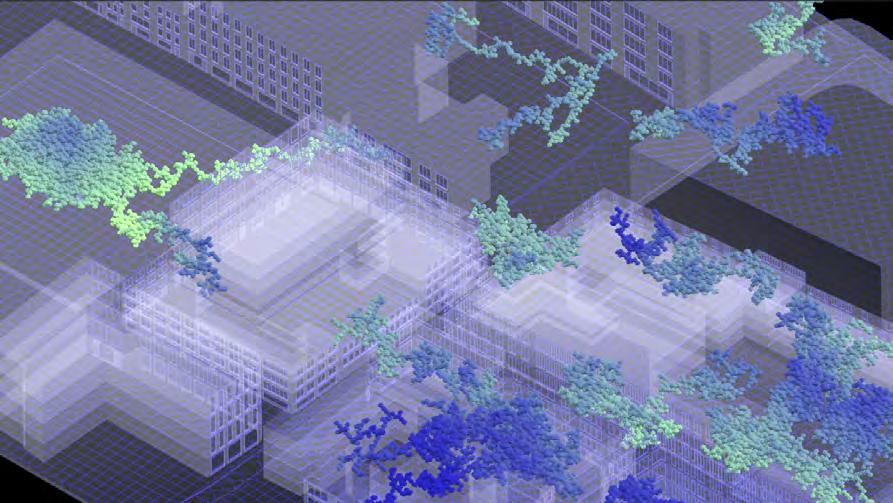
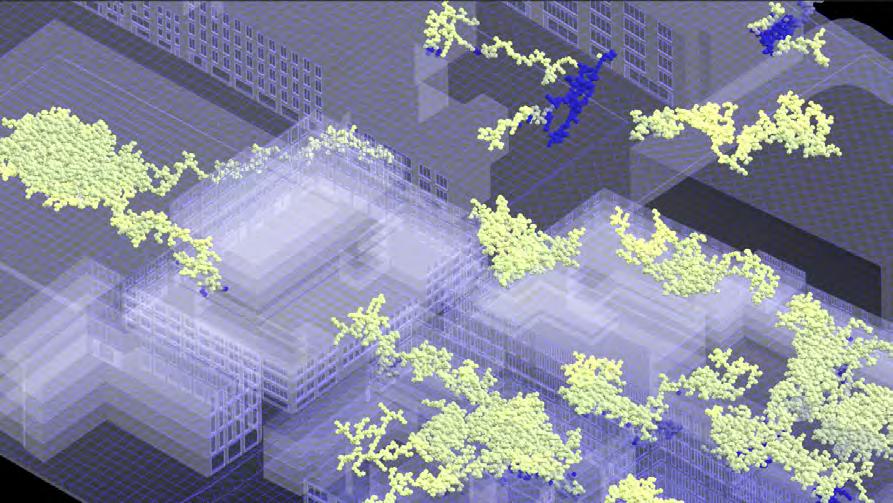
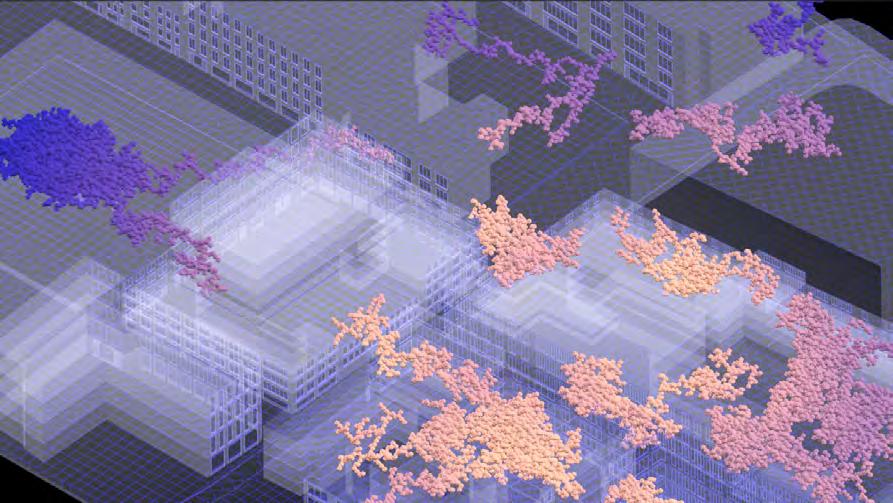
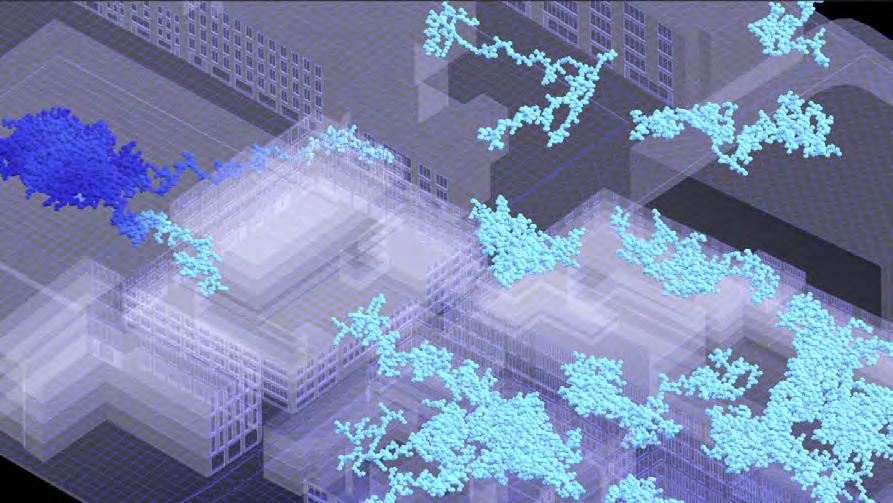
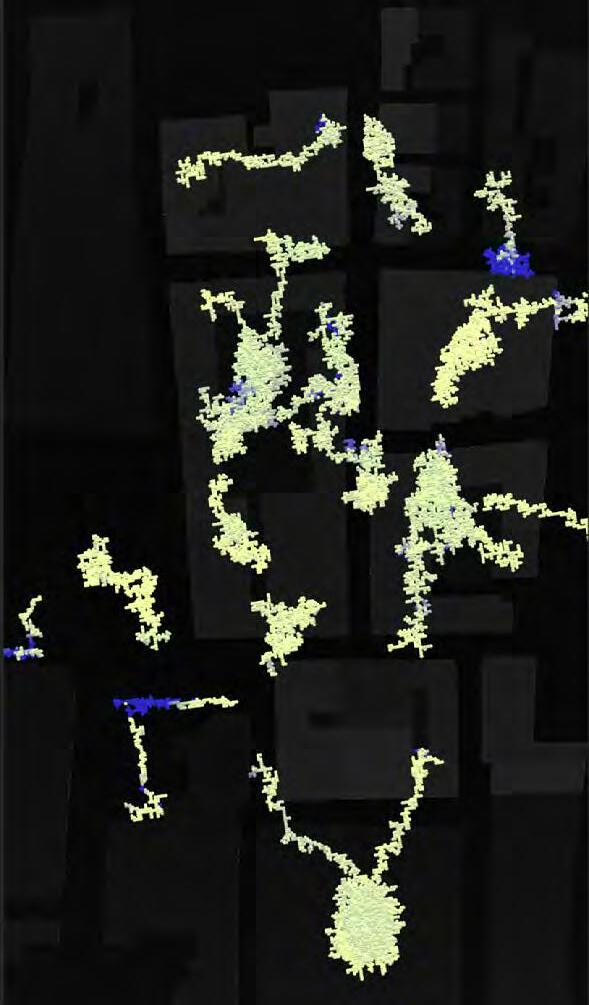
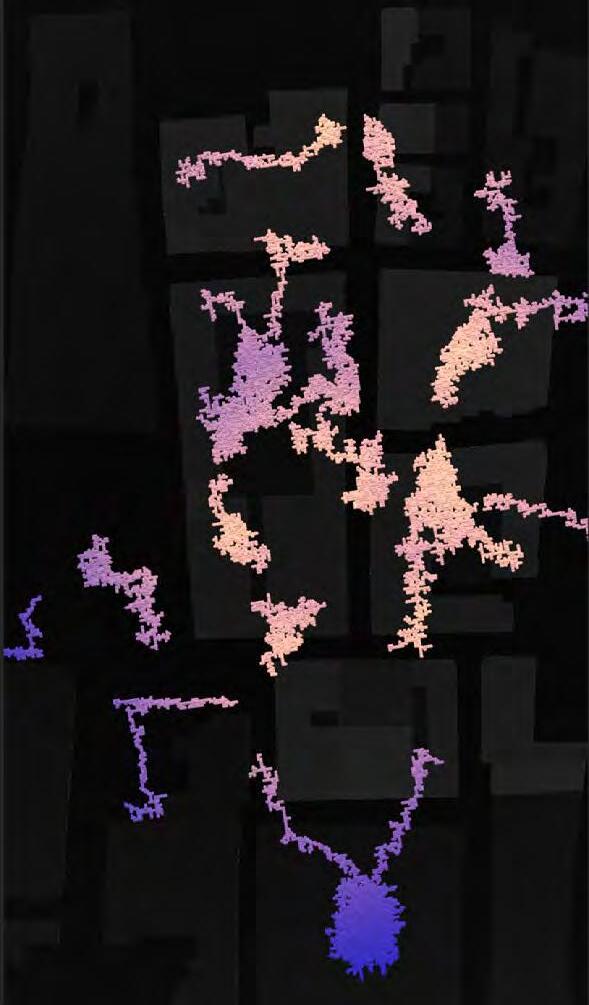
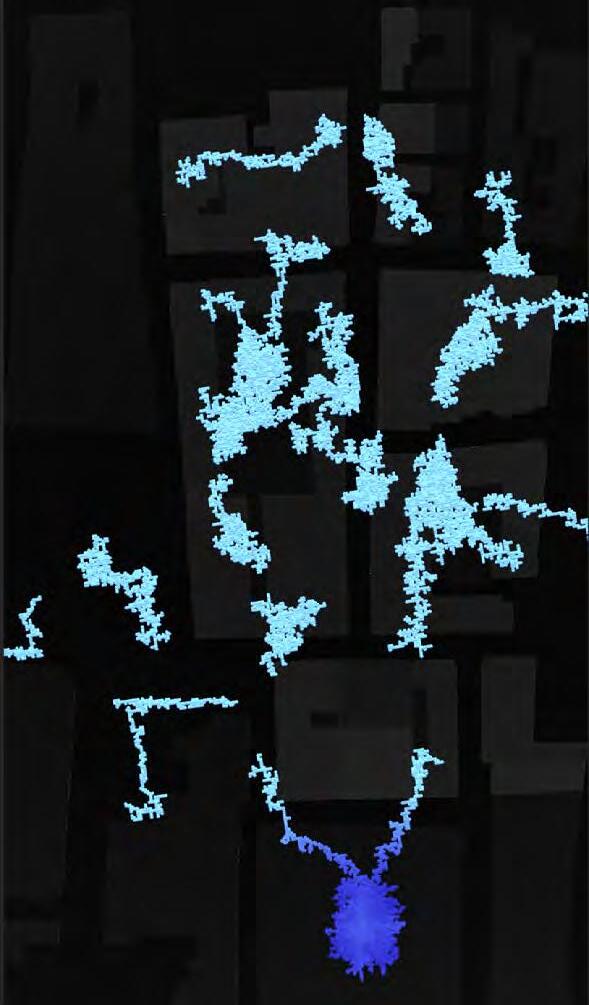
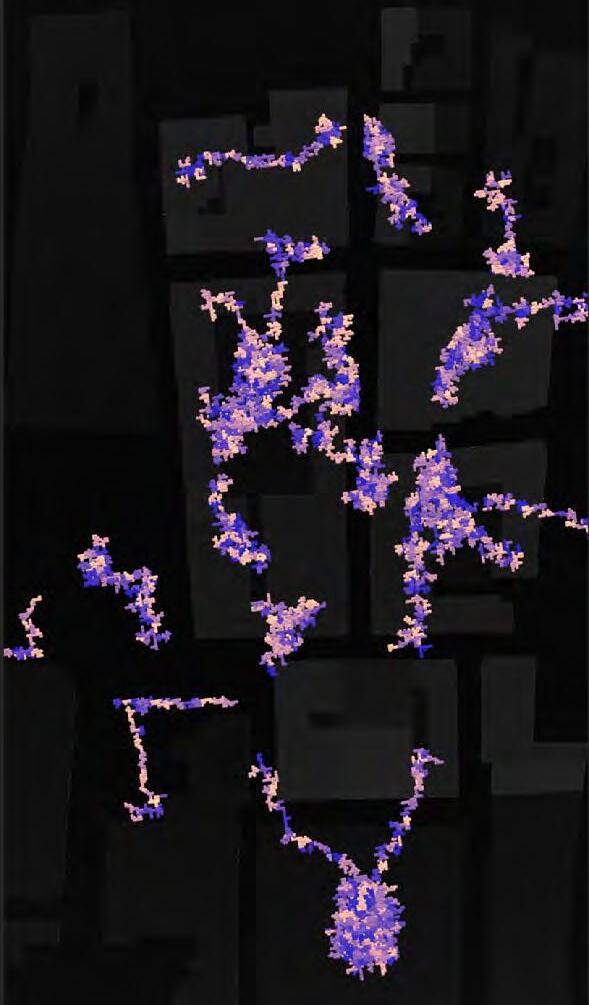
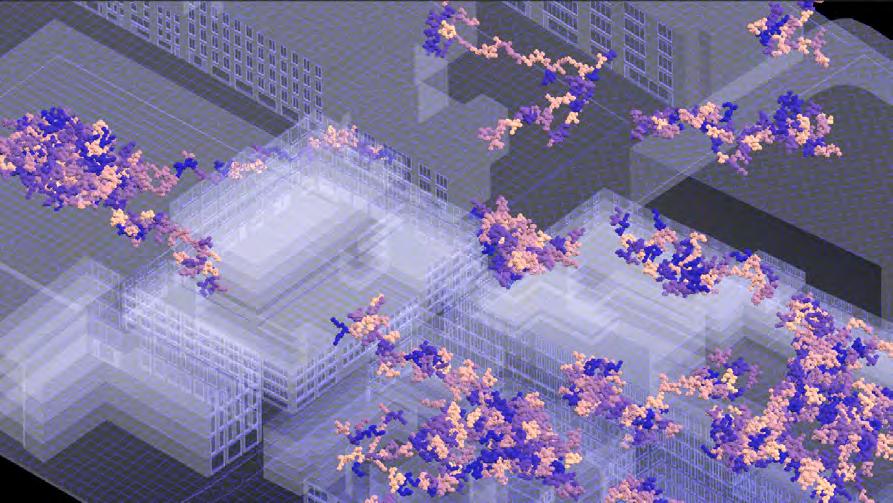
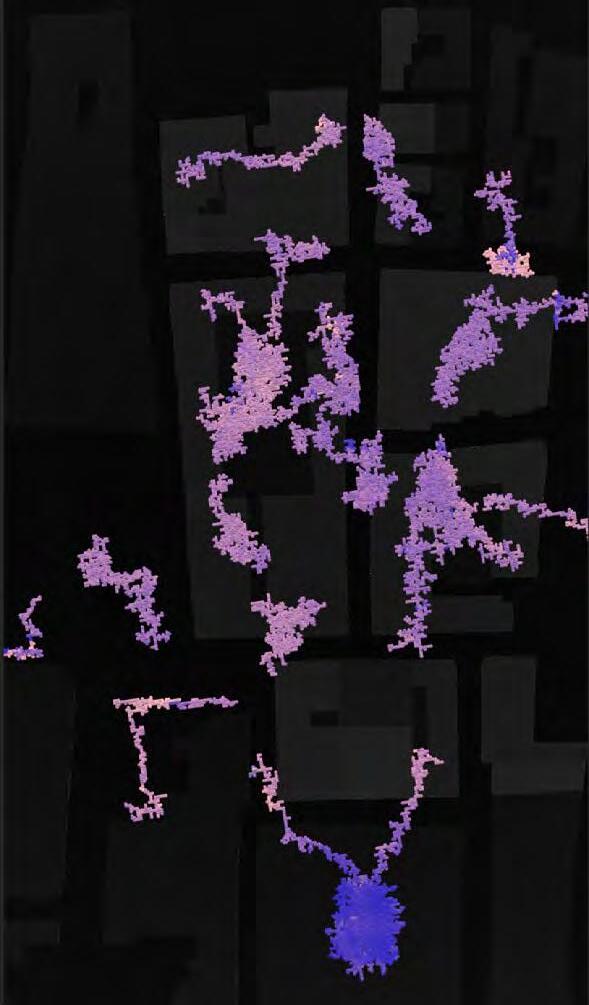
PRODUCTION_PROTECTION MODULE GRADIENT OF CHANGE
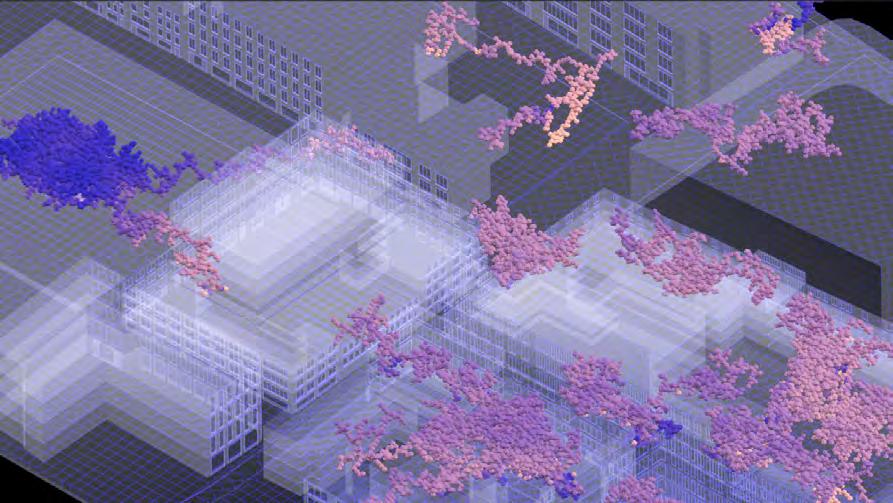
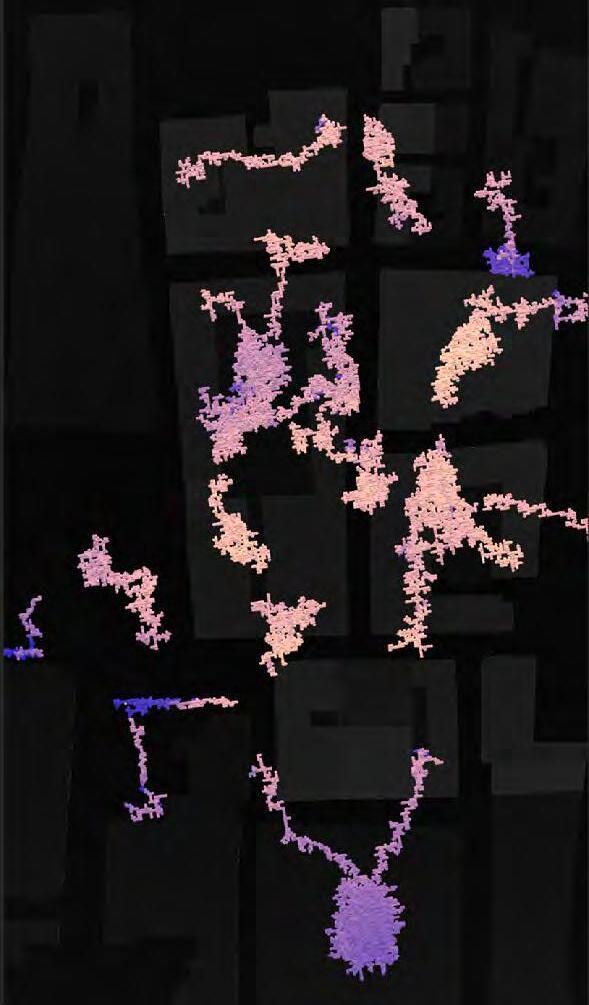
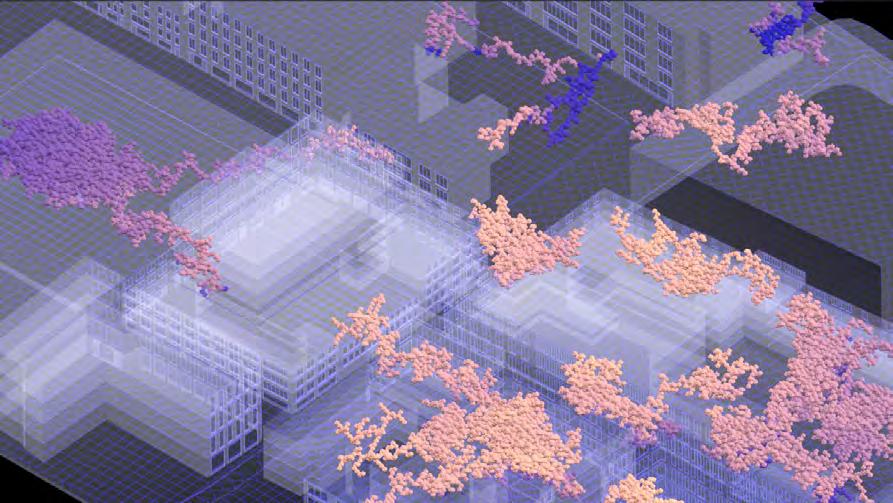
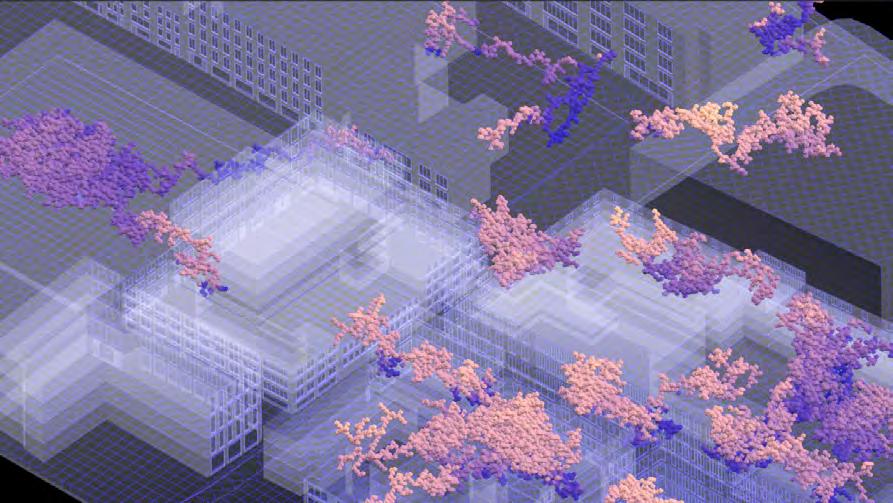
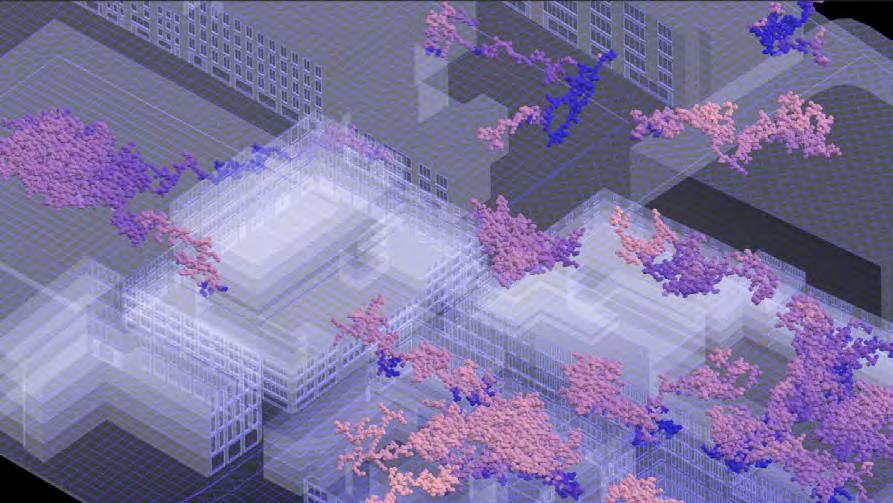
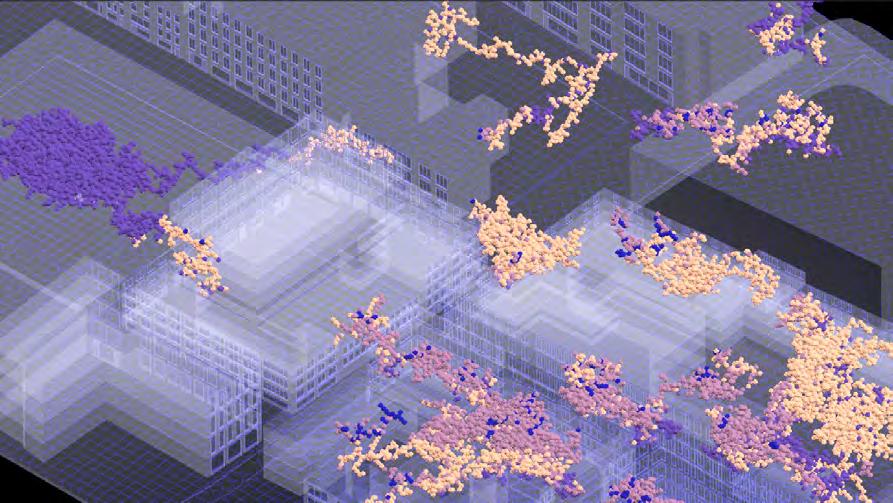
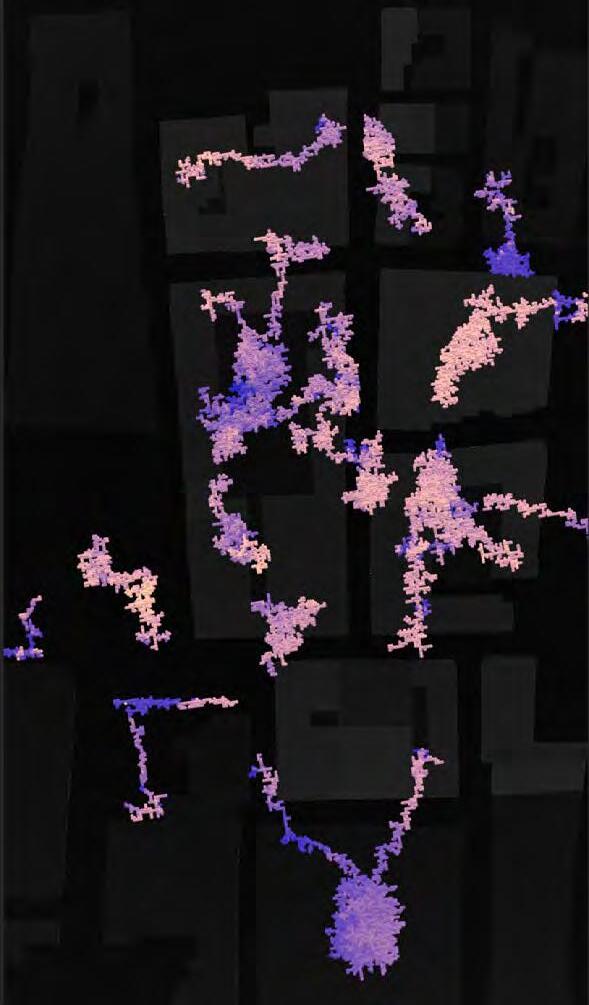
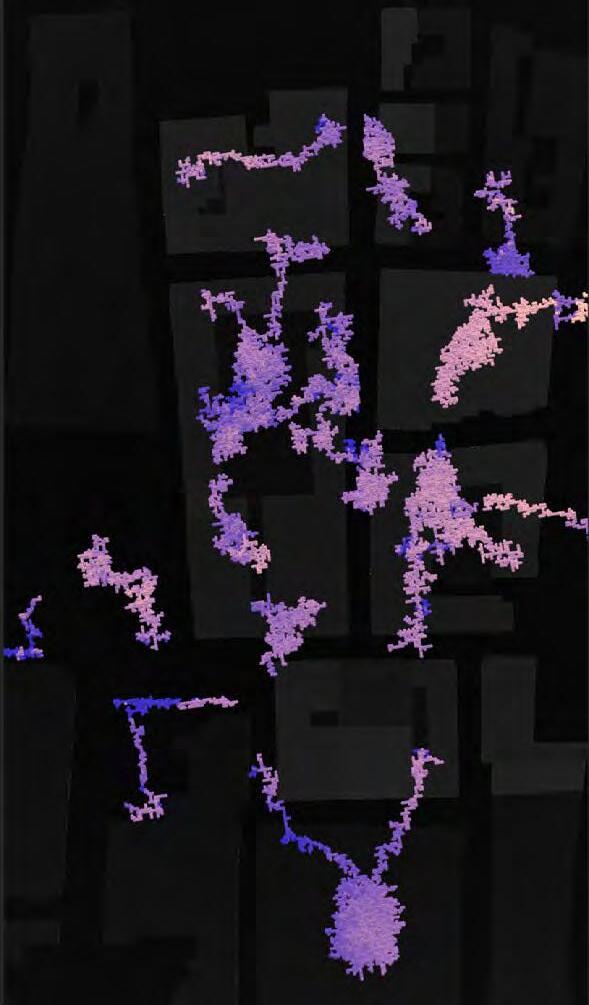
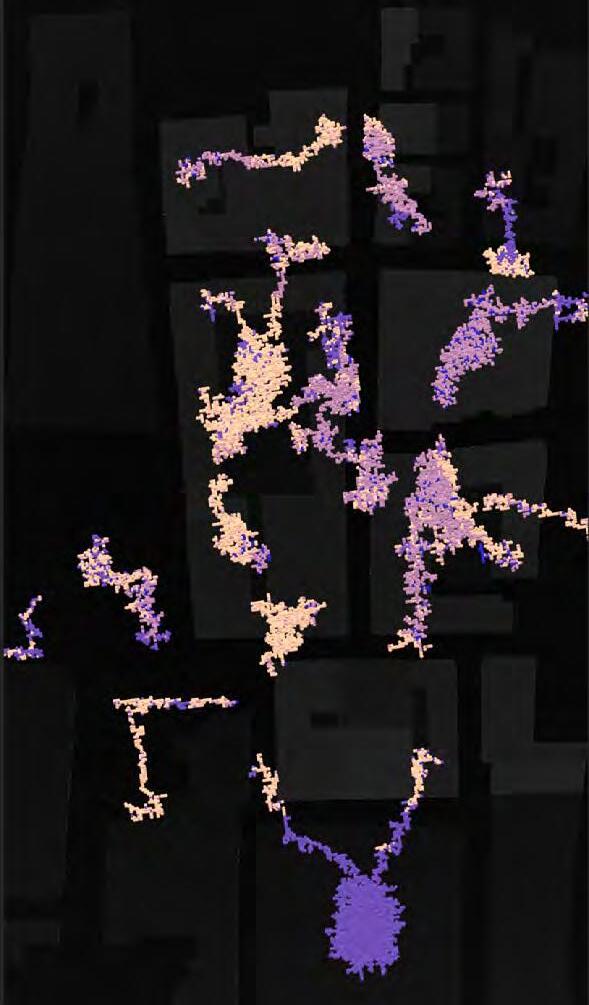
Fig.157. The final functional distribution for aggregation number 1
Fig.158. The final functional distribution for aggregation number 2
The simulation produced 12597 modules.
Production_Protection - 4470 modules
Filtration_Production - 3577 modules
Filtration - 3822 modules
Collection_Filtration - 728 modules
The simulation produced 19525 modules.
Production_Protection - 7092 modules
Filtration_Production - 5819 modules
Filtration - 5385 modules
Collection_Filtration - 1229 modules
Fig.159. The final functional distribution for aggregation number 3
Fig.160. The final functional distribution for aggregation number 4
The simulation produced 19030 modules.
Production_Protection - 7108 modules
Filtration_Production - 5331 modules
Filtration - 5675 modules
Collection_Filtration - 916 modules
The simulation produced 19152 modules.
Production_Protection - 7116 modules
Filtration_Production - 5337 modules
Filtration - 5736 modules
Collection_Filtration - 963 modules
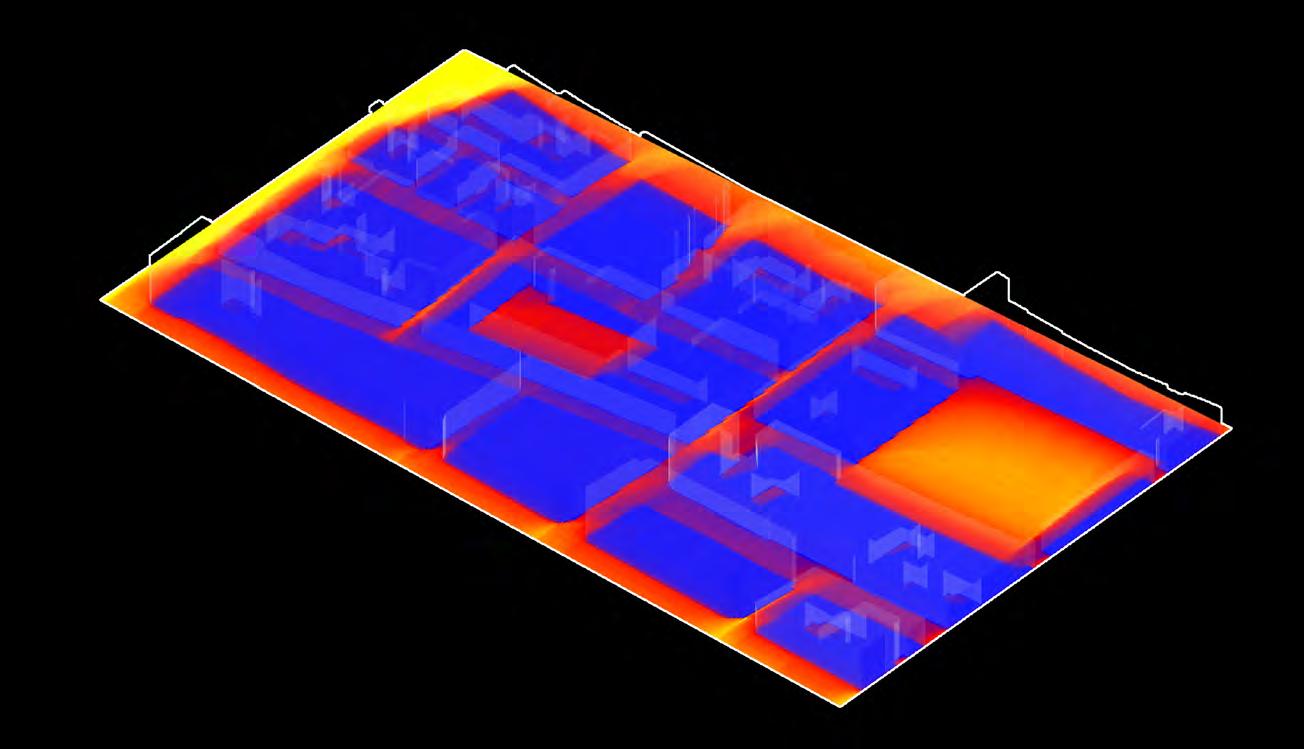
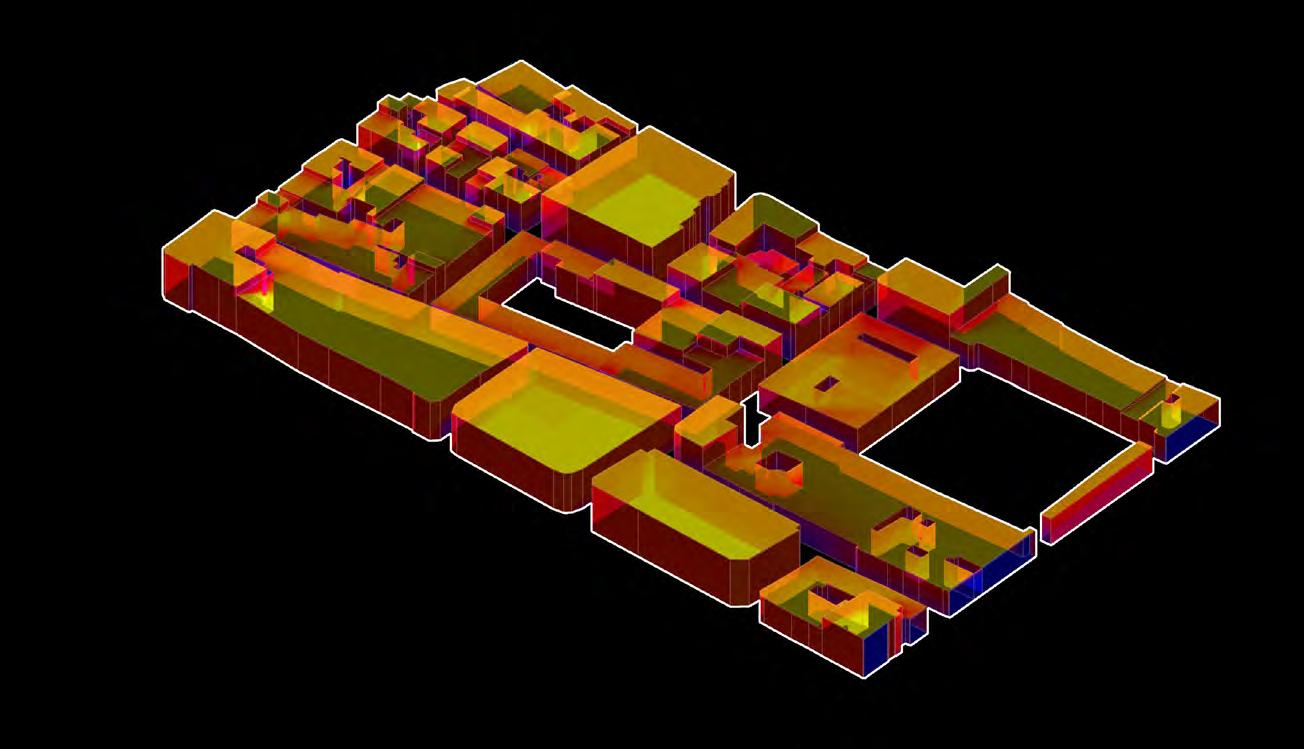
Fig.161. Analysis of the existing environment. Direct sun hours for 12 month period.
Fig.162. Analysis of the existing environment. Direct sun hours for 12 month period.
NETWORK ANALYSIS
Direct solar analysis was used to test and evaluate the effectiveness of each option for reducing heat emission in different areas. In the case of solar analysis, the morphology of the network should be such that the sunlight hours on the ground and building facades are lowered equally, therefore storing less solar radiation during the day and minimising the area’s heat island effect.
An annual direct solar analysis of the four options showed that options 2, 3 and 4 create more solar shading at ground level than option 1, with the difference in the size of these shaded areas being most noticeable in the courtyard located in the centre of the test region. It can be observed that the shaded areas created by the network of options 2, 3 and 4 are better able to mitigate the heat emission in the courtyard areas and create outdoor areas suitable for human activity. In addition, at the pedestrian level, all four options provide shading to the ground, but the difference in the shaded areas created by the four options is not significant (Fig.161-170).
From the analysis of daylight at the building surface level, it can be observed that options 2, 3 and 4 have a more evenly distributed effect on the roof of the building than option 1. Of the four options, options 2 and 3 have the largest shading area on the roof, while on the façade, options 3 and 4 are observed to be more effective in terms of its actual shading. In conclusion, the network pattern of option 3 creates the largest shading area, which is more effective in reducing the amount of heat absorbed by the building and also provides a more comfortable temperature range for humans.
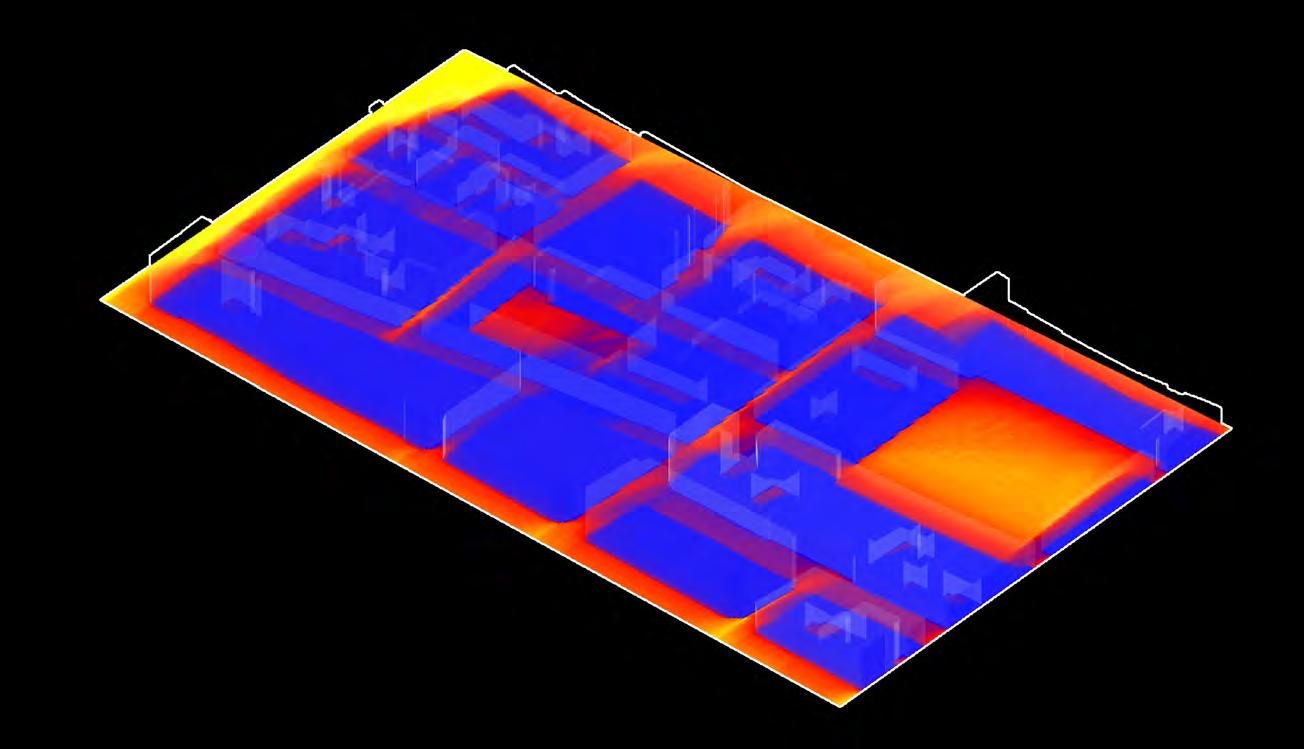

Fig.163.
Fig.164. Post_simulation analysis. Direct sun hours for 12 month period. Network Option 2
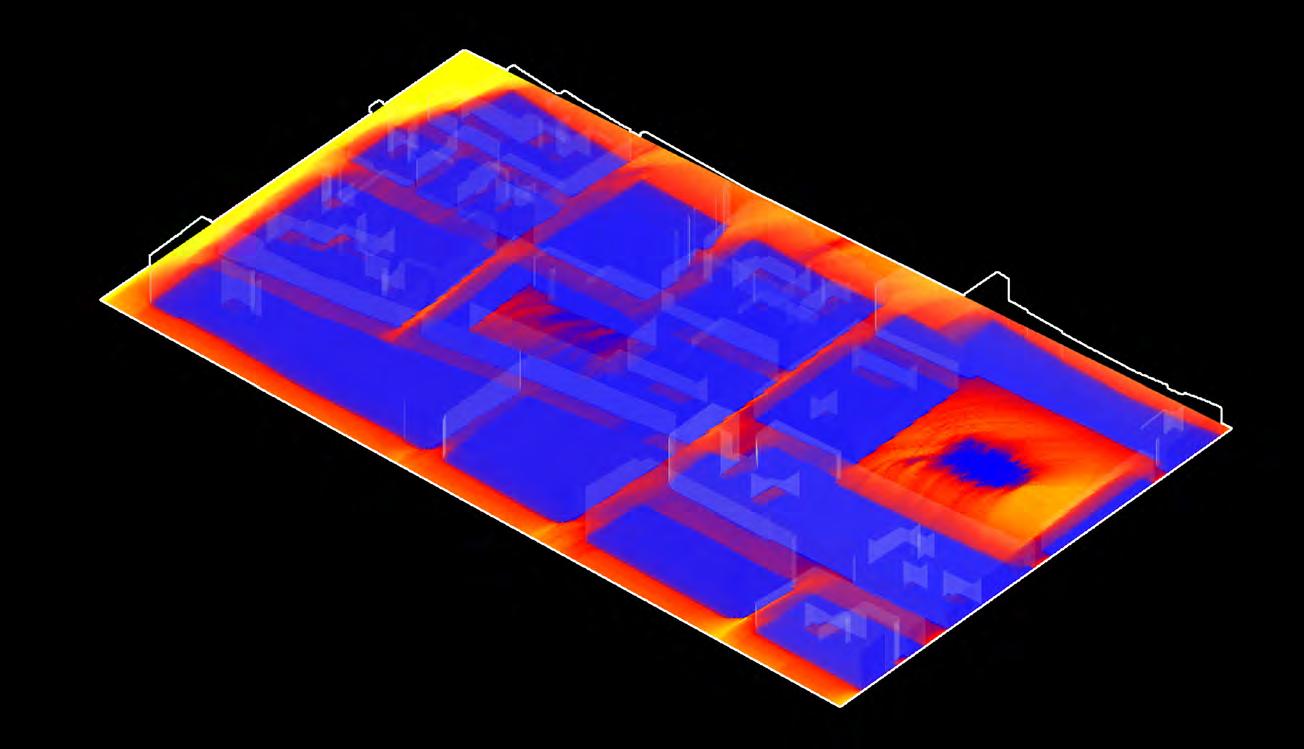

Fig.165. Post_simulation analysis. Direct sun hours for 12 month period. Network Option 3
Fig.166. Post_simulation analysis. Direct sun hours for 12 month period. Network Option 4
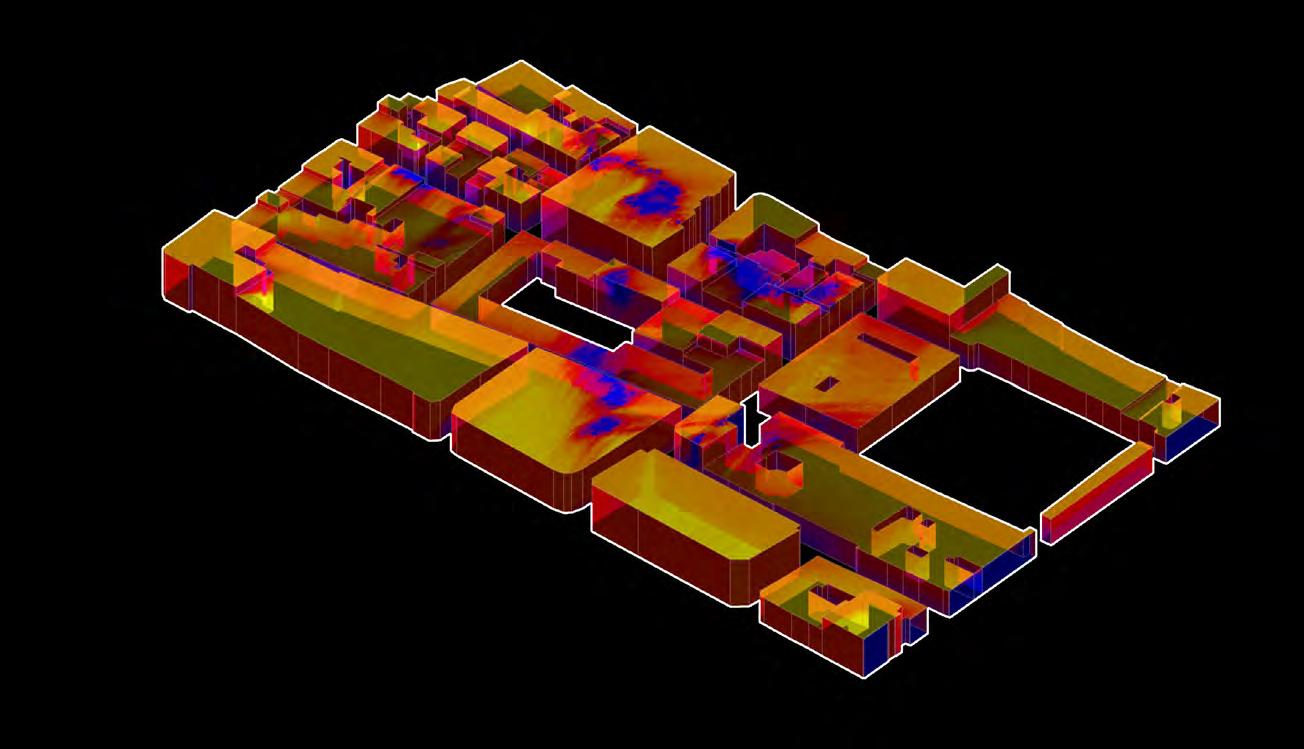
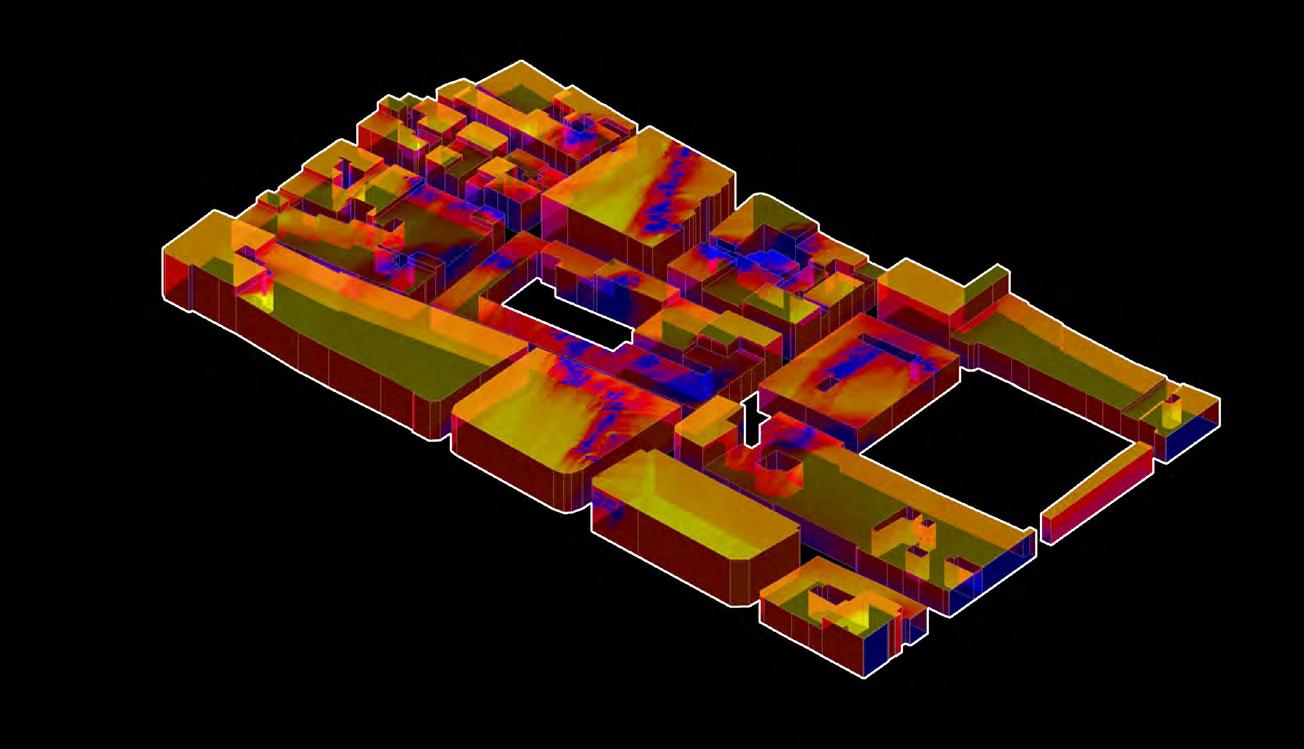
Fig.167. Post_simulation analysis. Direct sun hours for 12 month period. Network Option 1
Fig.168. Post_simulation analysis. Direct sun hours for 12 month period. Network Option 2

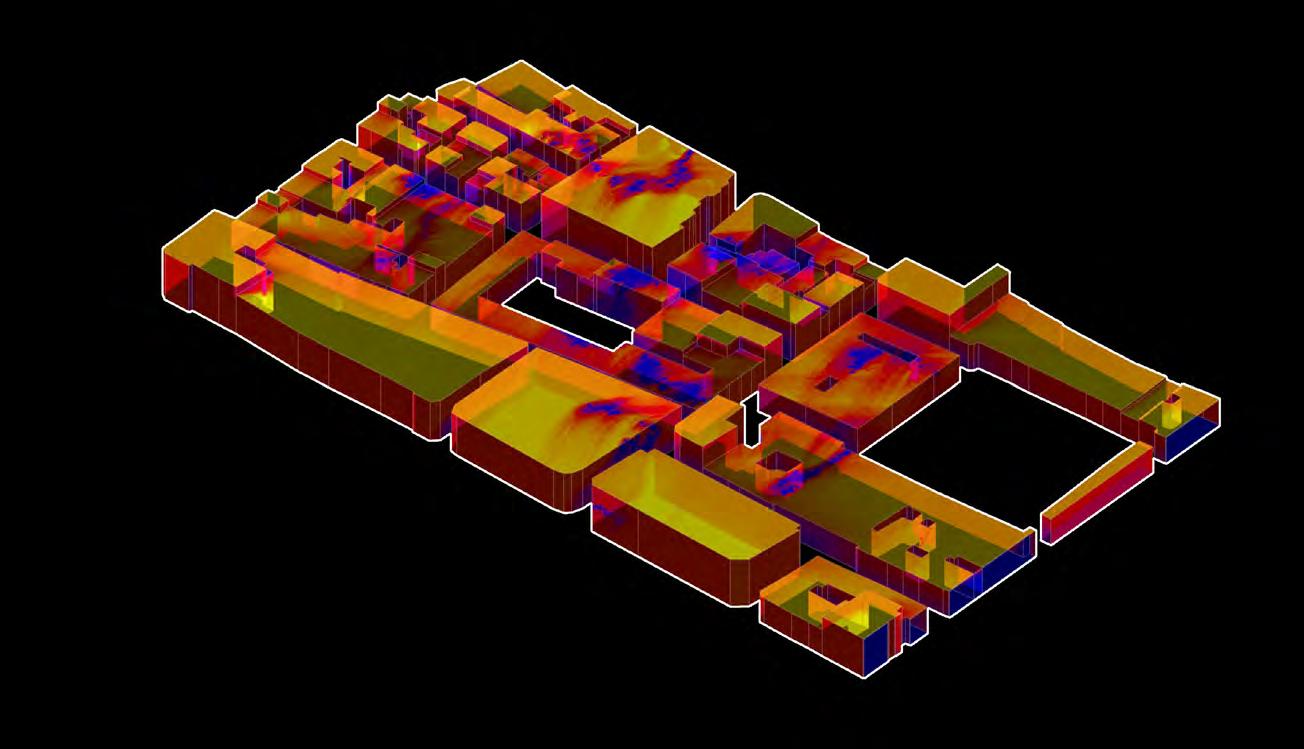
Fig.169. Post_simulation analysis. Direct sun hours for 12 month period. Network Option 3
Fig.170. Post_simulation analysis. Direct sun hours for 12 month period. Network Option 4
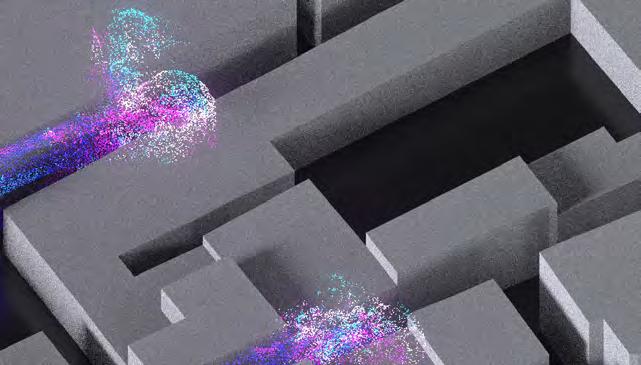

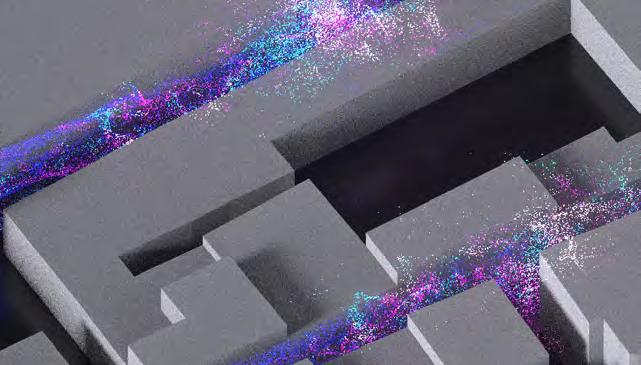
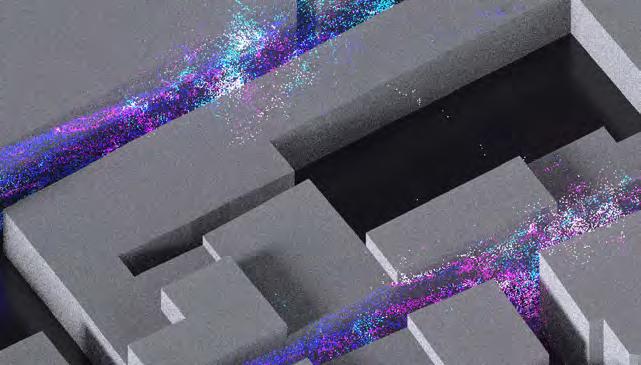
NETWORK ANALYSIS
Computational Fluid Dynamics (CFD) is implemented as a method to assess the performance of the generated network against the preexisting environmental conditions. (Fig.171) Given that the site ranges between non-existing to high wind velocities, the purpose is to simulate the placement of modules to reduce air current in higher velocity areas such that pollution from transport roads can be collected and decontaminated.
Option 1 (Fig.172)
Compared to the CFD simulation of the original site, the CFD simulation of option 1 reveals that the resulting network successfully blocks the wind path and reduces the wind speed at the street level in the test region. The network morphology divides the wind into two streams, one at the upper portion and one at the lower. In the lower human-scale portion, the wind speed was successfully slowed from its higher levels. Winds travelling through the area were slower than had there been no network implementation, confirming the efficiency of the network in reducing wind speed and trapping particles in the test area.
Option 2 (Fig.173)
In the CFD simulations for option 2, it is observed that the network distribution of option 2 better separated the wind into two strands compared to option 1, allowing the higher wind speeds to be located at a higher vertical level while allowing the human scale to remain unaffected by the high wind speeds, maintaining a lower wind speed level consistently. It was also observed that the overall number of particles tested in the area with the network implanted was significantly reduced after the passage of the wind compared to the streets in the same test area without the network present, demonstrating the effectiveness of this option in separating and reducing pollutants coming from the main traffic artery.
Option 3 (Fig.174)
As option 3 for the network is embedded in each street in the test region, it is noted the wind speed is significantly reduced in both streets compared to both options 1 and 2. As the streets at the bottom have more network distribution of agents, the wind speed reduction is more pronounced compared to the streets at the top and the particle flow through the streets is mitigated in a linear fashion, allowing for better dispersion of the test particles, such that the filtration modules in the high wind speed areas are not overloaded while modules at other locations in the network are able to capture the particles, thereby improving the overall filtration efficiency.
Option 4(Fig.175)
Option 4 CFD simulation reveals that, despite their identical network layouts, option 4 has more network structures at each street level, hence delivering exceptional wind mitigation and particle interception. Option 4 successfully divides the air ducts into two sections, maintaining the high wind speeds above the human scale and the low wind speeds with the human scale, so enhancing human comfort.
Fig.171. Analysis of the existing environment. Computational Fluids Dynamics simulation
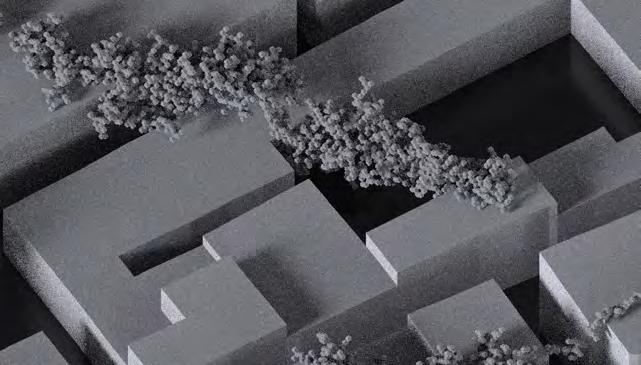
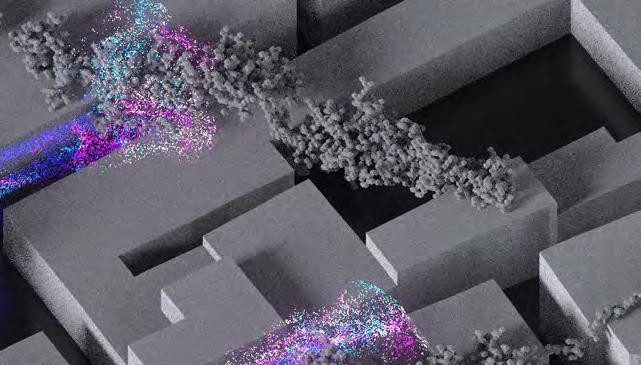
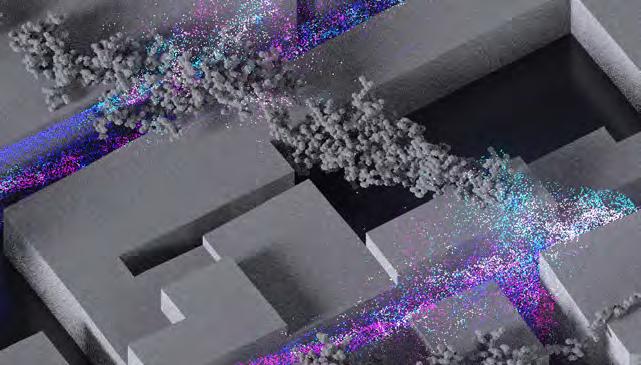
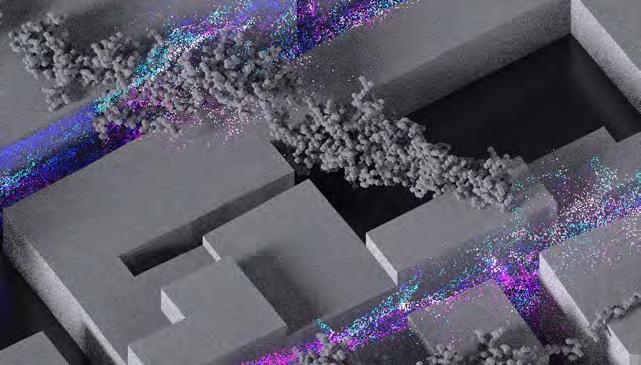
Fig.172. Network option 1. Computational Fluids Dynamics simulation
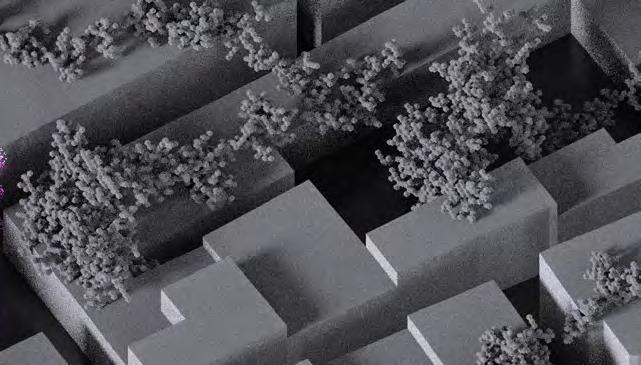
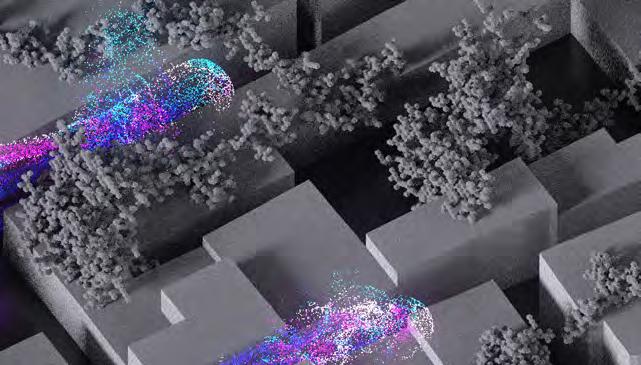
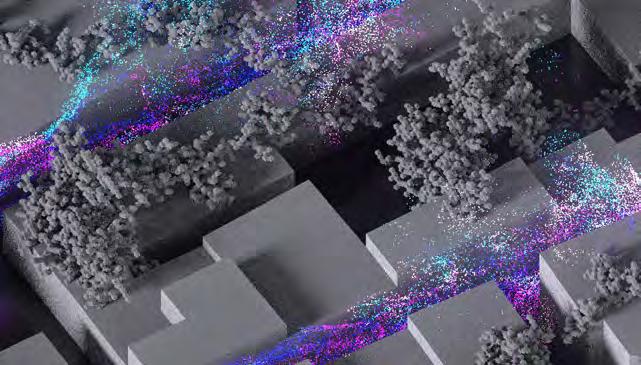
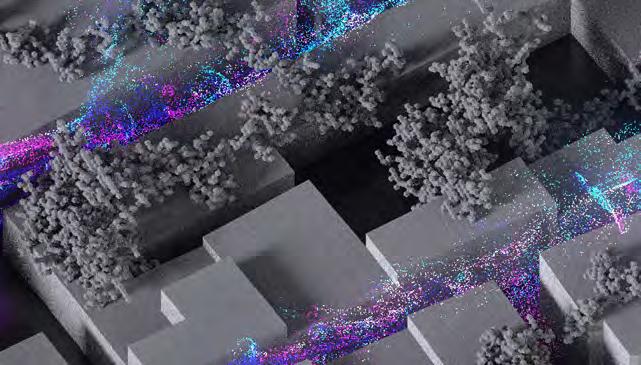
Fig.173. Network option 2. Computational Fluids Dynamics simulation
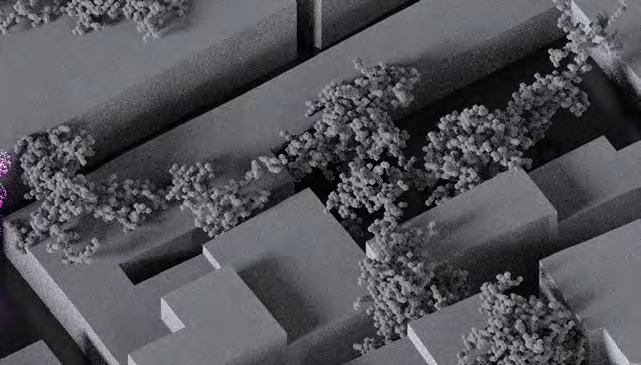
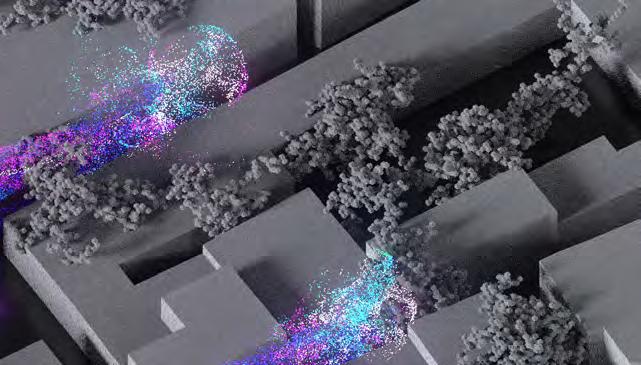
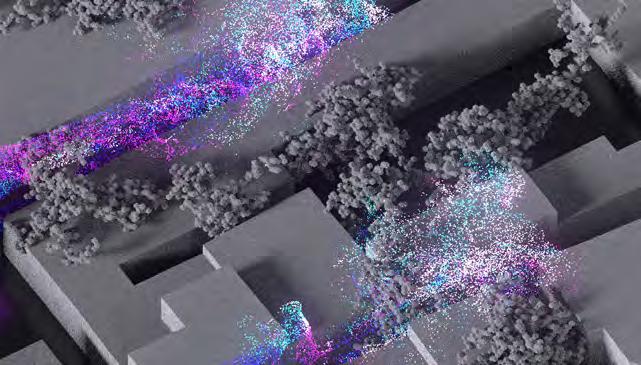
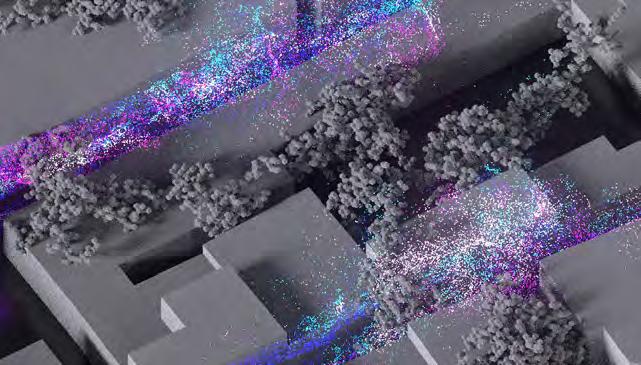
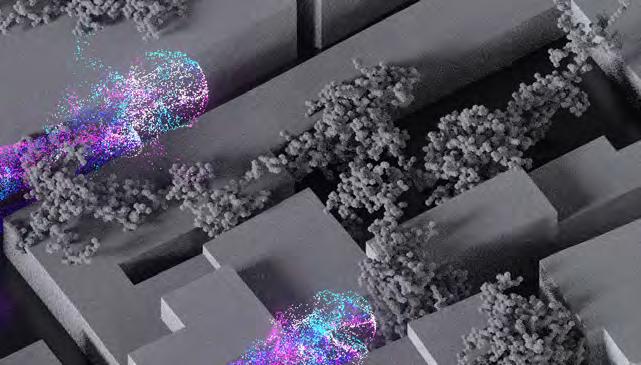
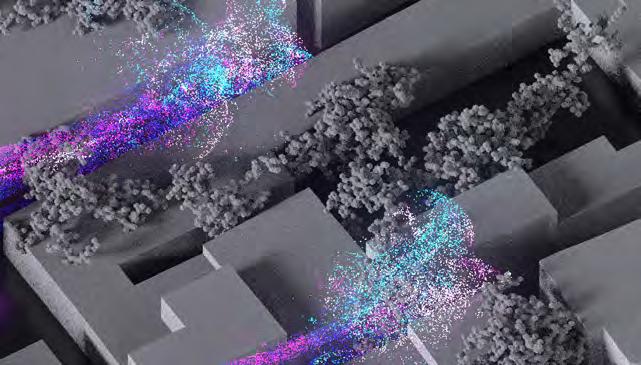
Fig.174. Network option 3. Computational Fluids Dynamics simulation
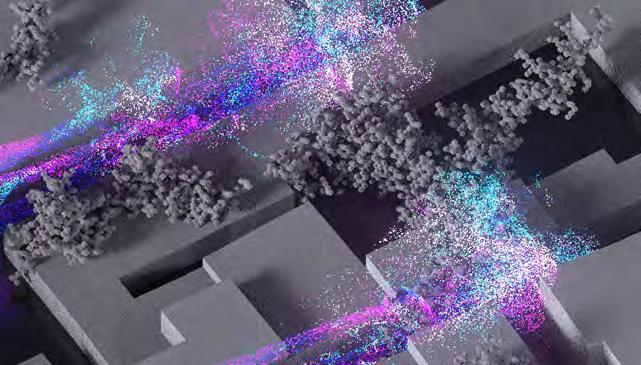
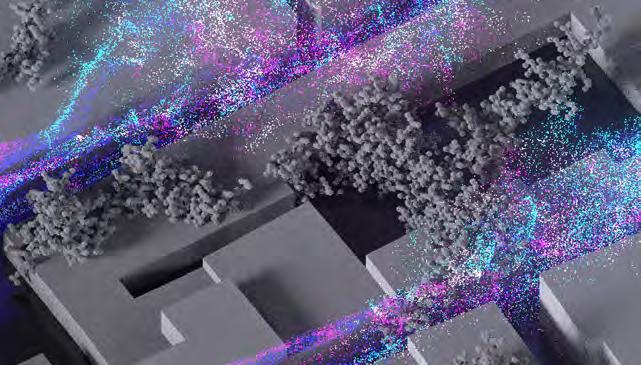
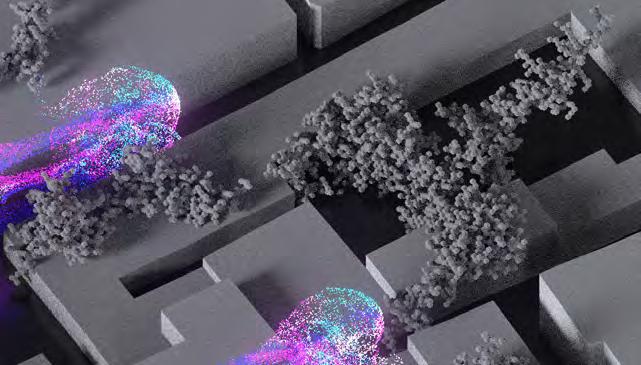
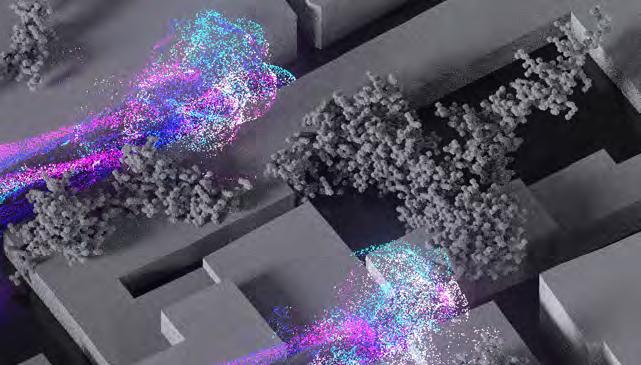
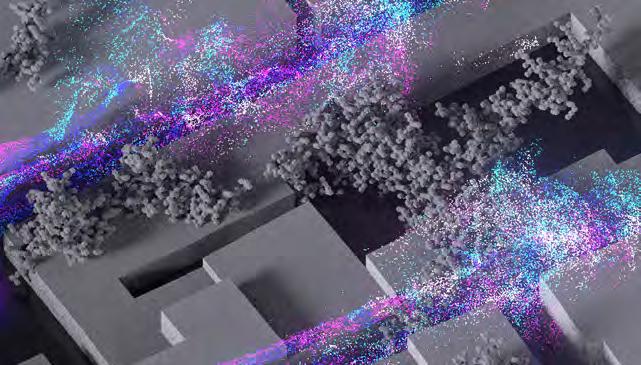
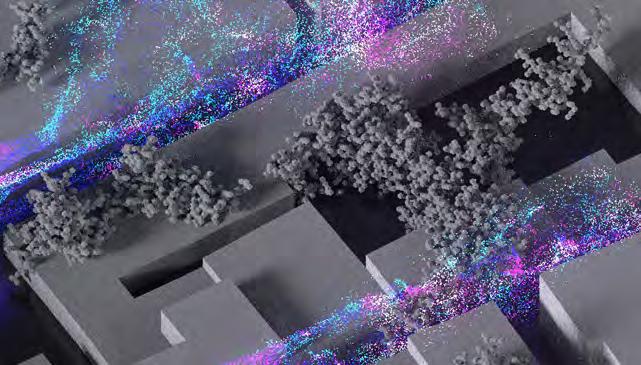
Fig.175. Network option 4. Computational Fluids Dynamics simulation
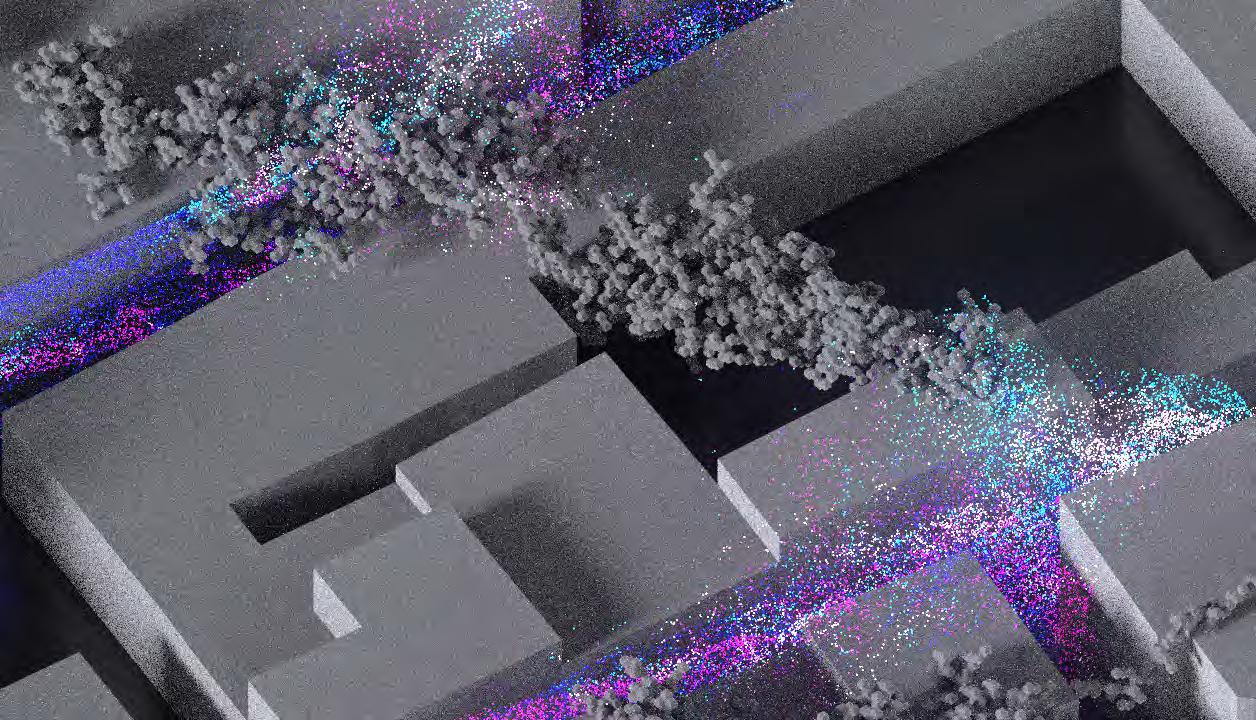
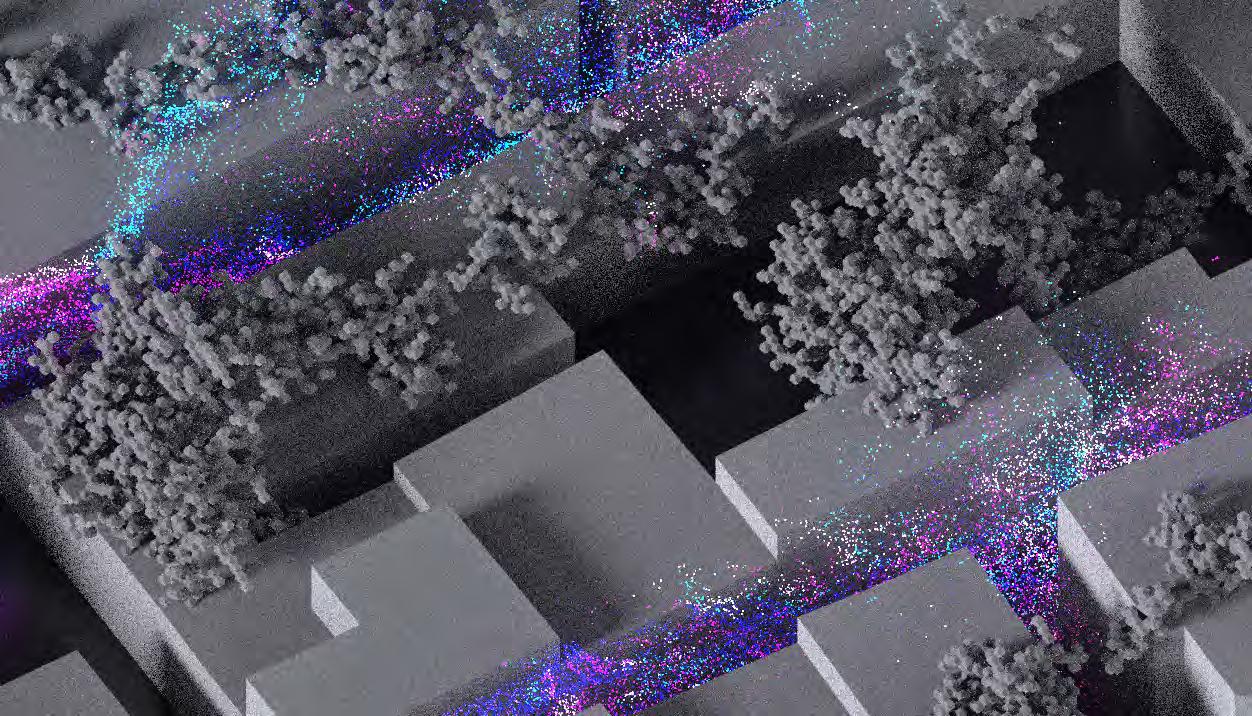
Fig.176. Post_simulation analysis. Network option 1. Computational Fluids Dynamics simulation
Fig.178. Post_simulation analysis. Network option 3. Computational Fluids Dynamics simulation
Fig.177. Post_simulation analysis. Network option 2. Computational Fluids Dynamics simulation
Fig.179. Post_simulation analysis. DNetwork option 4. Computational Fluids Dynamics simulation
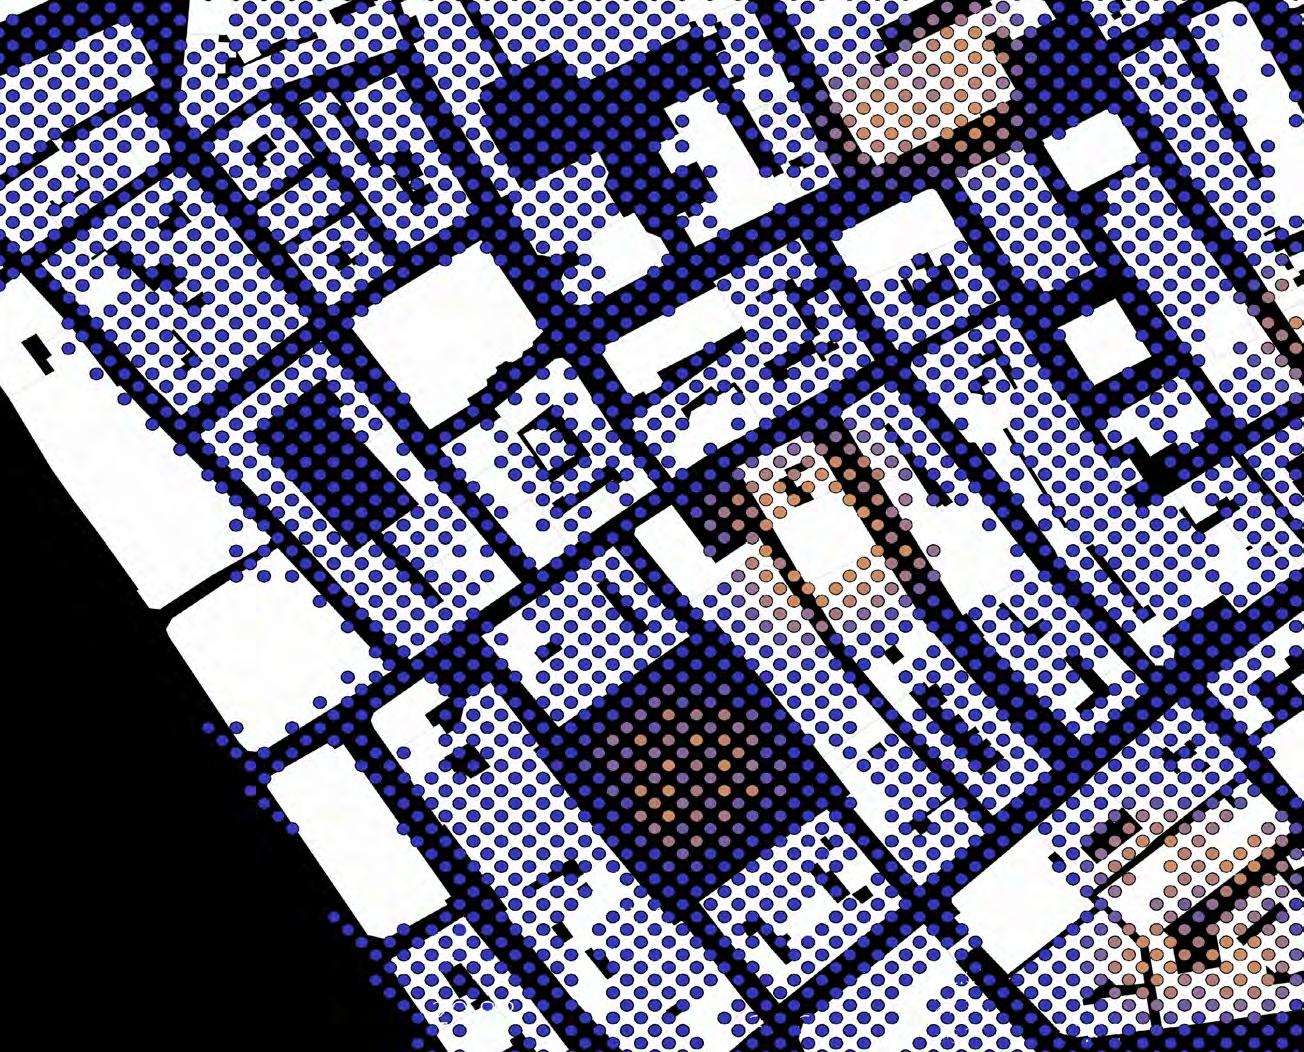
The results of the analysis of the green network connectivity of the test region and the region after the implementation of the four different clustering levels indicate that the green network connectivity factor of this region was 0.16 prior to the implementation of the network and increased by approximately 75% after the implementation of the designed network strategy, with a minimal value of 0.38. The highest clustering level offered the greatest enhancement in green network connectivity, and in this option (option 4), the green network connectivity increased to 0.5 times, following network deployment. After network installation, connectivity factor reaches a level of 0.5. In addition to this, when the clustering level drops, the value of green network connectedness factor increases steadily.
Fig.180. Green network connectivity level of the existing region
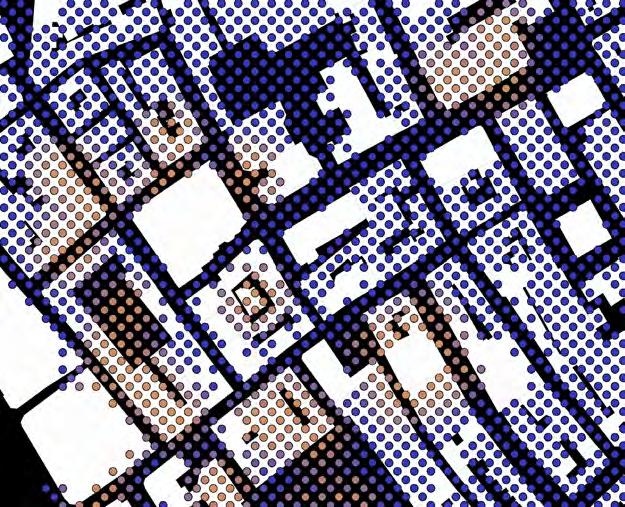
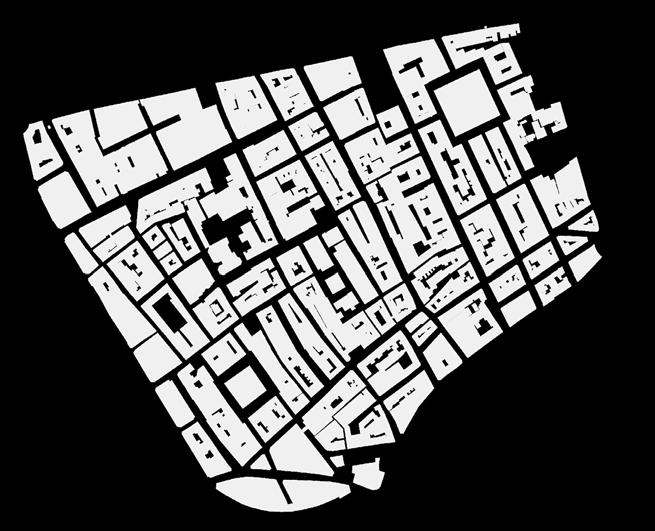
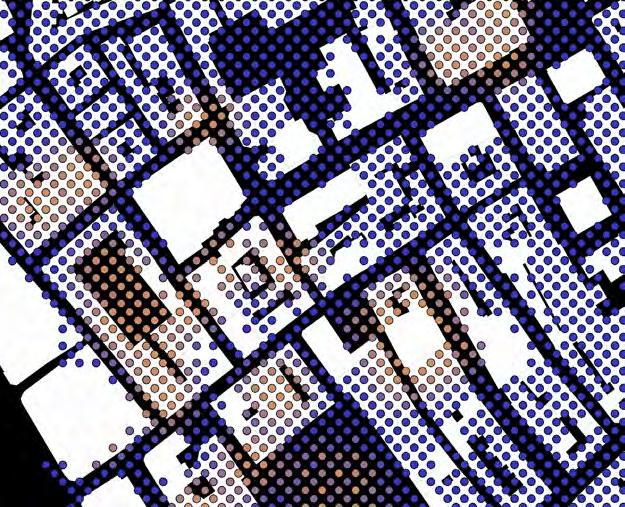
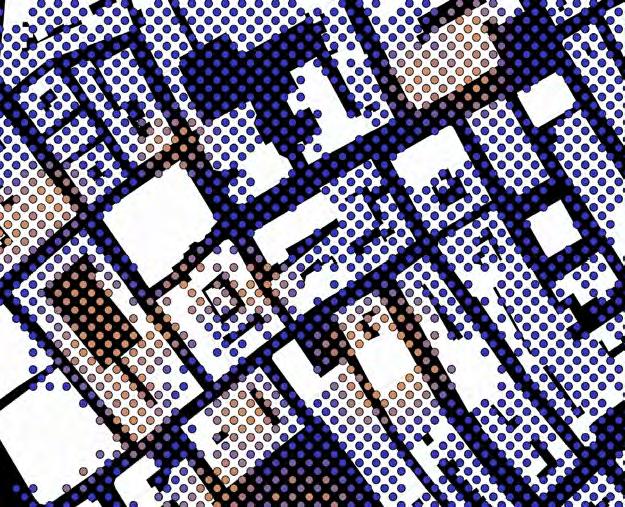
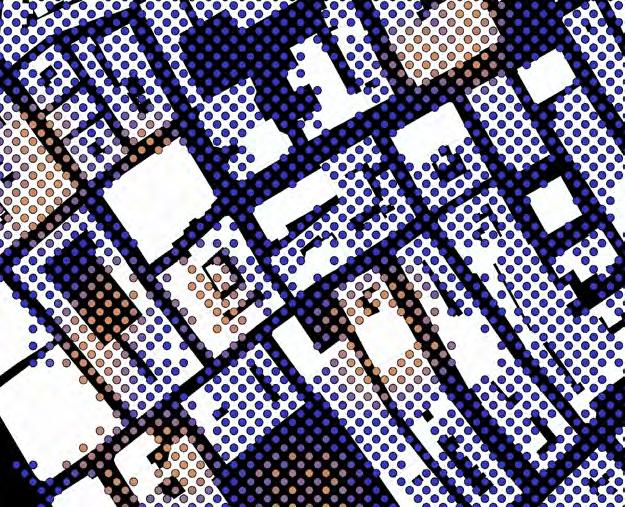
The 20 implementation areas option (Fig.160) was considered as the most successful one and should be further developed in the March stage of the research. The option 4 is strategically better, redirects wind flows increasing wind speed in needed areas. More than that, this option has the highest rate in decreasing the sun exposure not only on the ground, but also on facade surfaces.This alternative has the largest percentage of green tissue connectivity, according to the analysis of green connectivity, which was one of the main objectives of the project. Less dense clusters of modules and more evenly distributed functions are also produced by this network. However, the network cannot be considered as final as further adaptation is needed. Reconsideration of buildings programme, structural stability and interactions of different levels should be developed in next stages of the research.
Fig.181. Green network connectivity level after the implementation of option 1;
Fig.182. Green network connectivity level after the implementation of option 2;
Fig.183. Green network connectivity level after the implementation of option 3;
Fig.184. Green network connectivity level after the implementation of option 4;
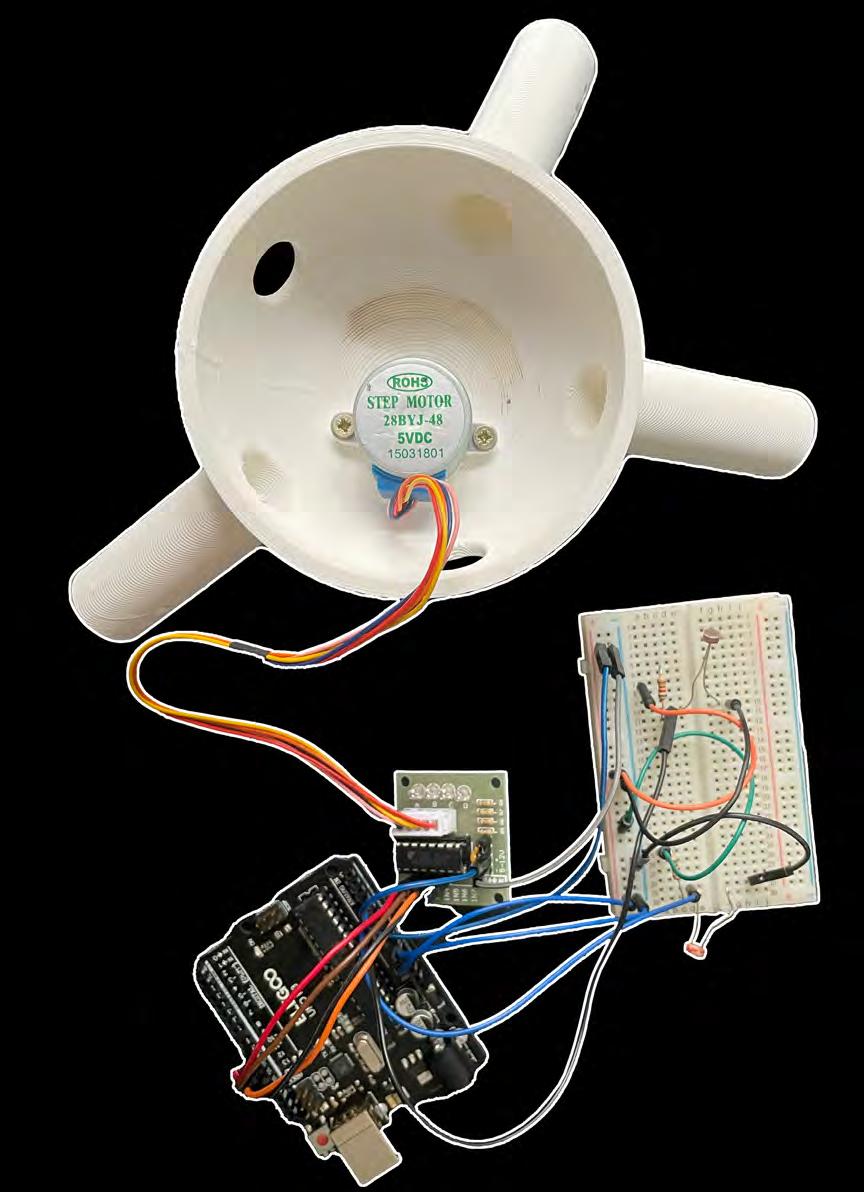
Through the process of rotation, the structure adapts itself for the most suitable spatial organisation according to the outer conditions be it the amount of sun, shadow or rain. To perform shading functions, the structure reorganises itself to better direct towards the sun to provide optimal shadowing. Vice versa, the moss-containing modules must turn against sunlight as moss grows in shadow. The model is a representation of the kinetic responsive behaviour of the structure, it has the ability to turn itself according to the signal received from the photo resistors. The Arduino microcontroller has been programmed to turn the motor according to the direction of the higher signal between two photoresistors directed in the opposite directions of one of the legs of the module, pointing the module toward the light source.
Fig.185. Kinetic prototype inner content
Physical fabrication and assembly of structural core of biobot
Photo
Photo
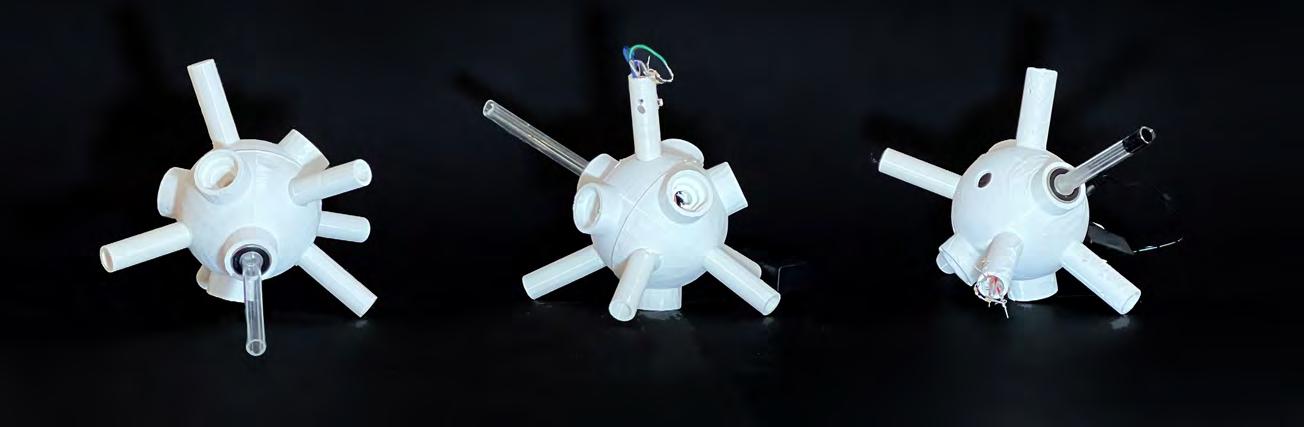
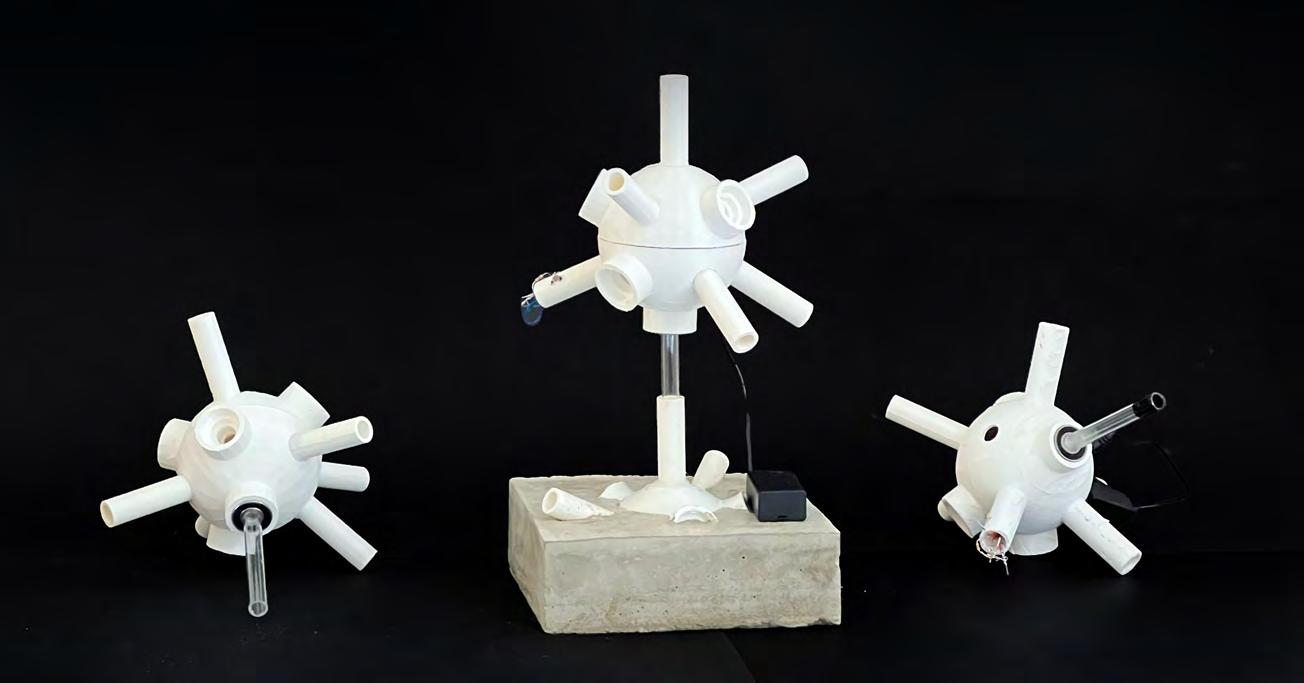
The electrical hardware is hosted inside the module and therefore the motor is turning not the transparent tube coming out of the module, but the module itself while the tube stays stable. This occurs because the tube is being held inside of the leg of the module with the bearing and the connection to the motor through an additional 3d printed tube attached to the motor and transparent structural tube. Therefore the motor is turning itself rather than the tube. This helps the modules to be autonomous in the rotation behaviour and react separately from each other, organising the swarm system logic, and working on local and global scales differently according to the environmental conditions and functions of the specific modules.
Fig.186. Images showing physically fabricated structural connectors between biobot modules
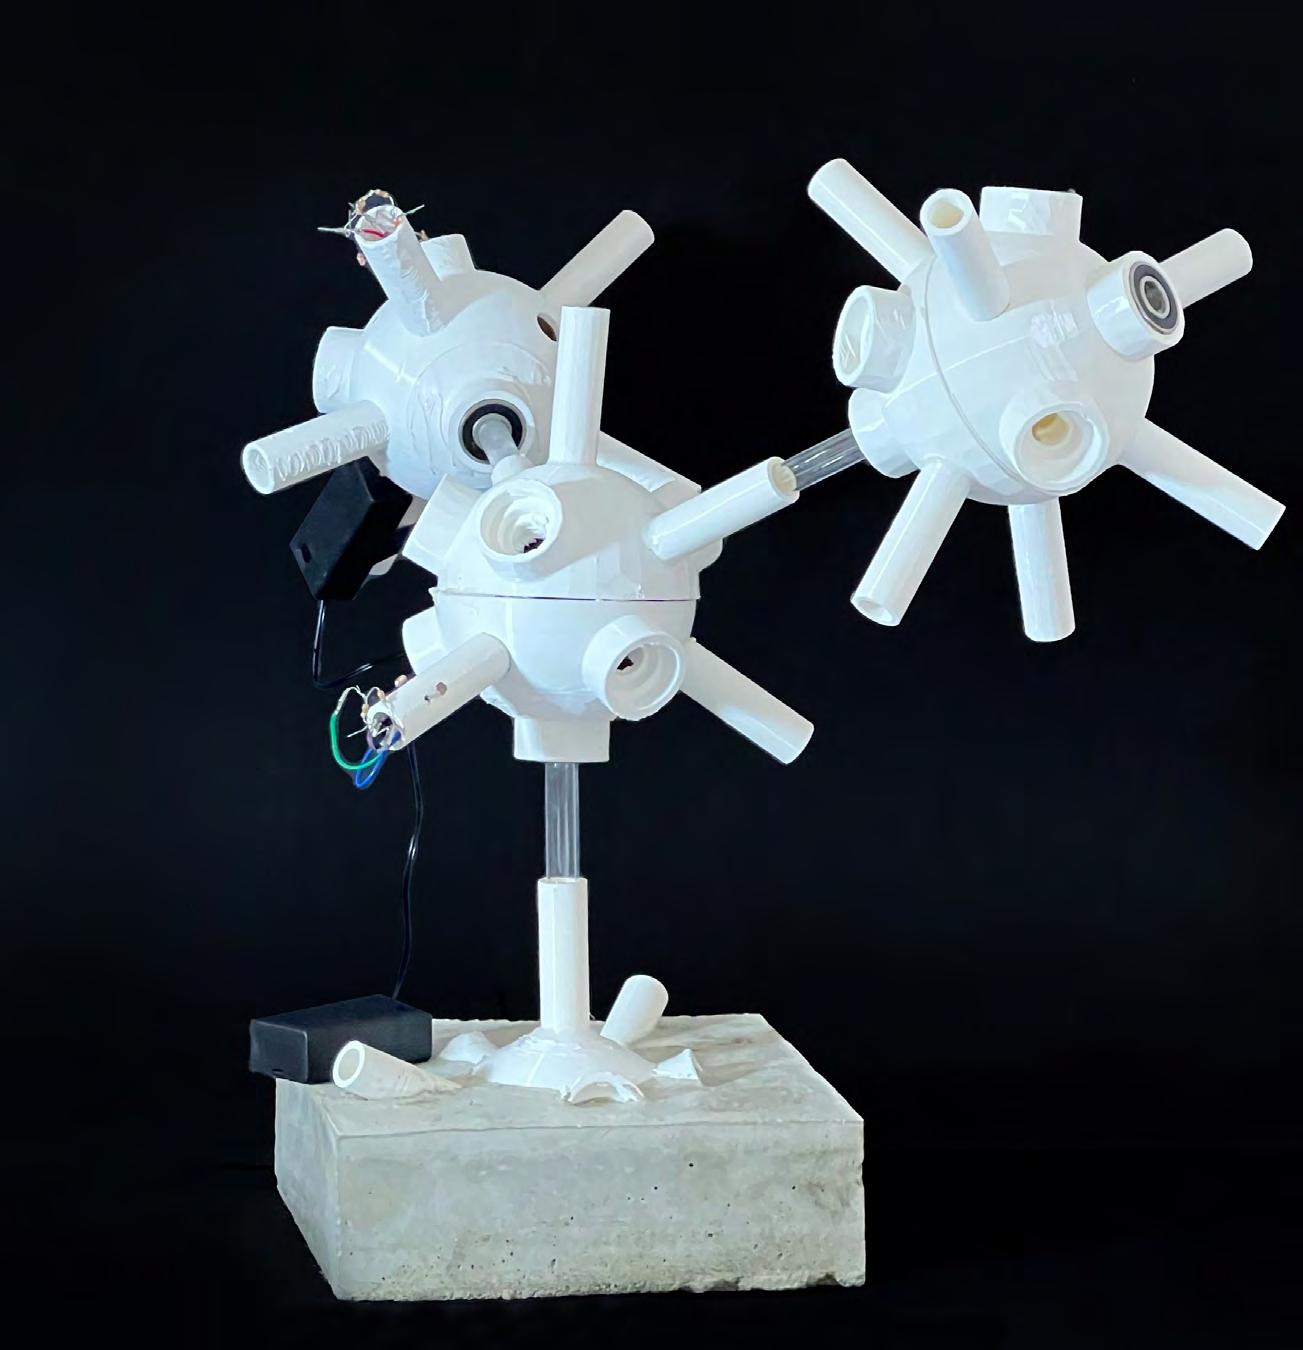
Fig.187. Physically fabricated working model of the core of biobot employing arduino and its tools
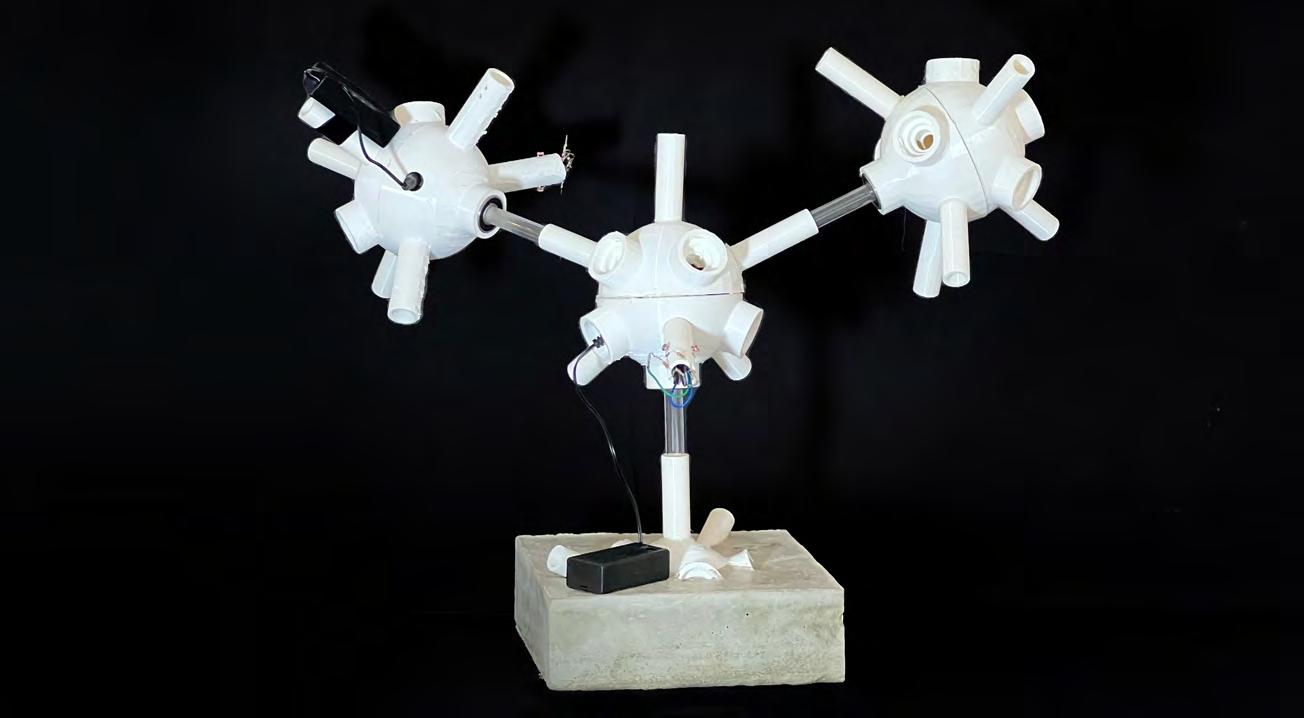
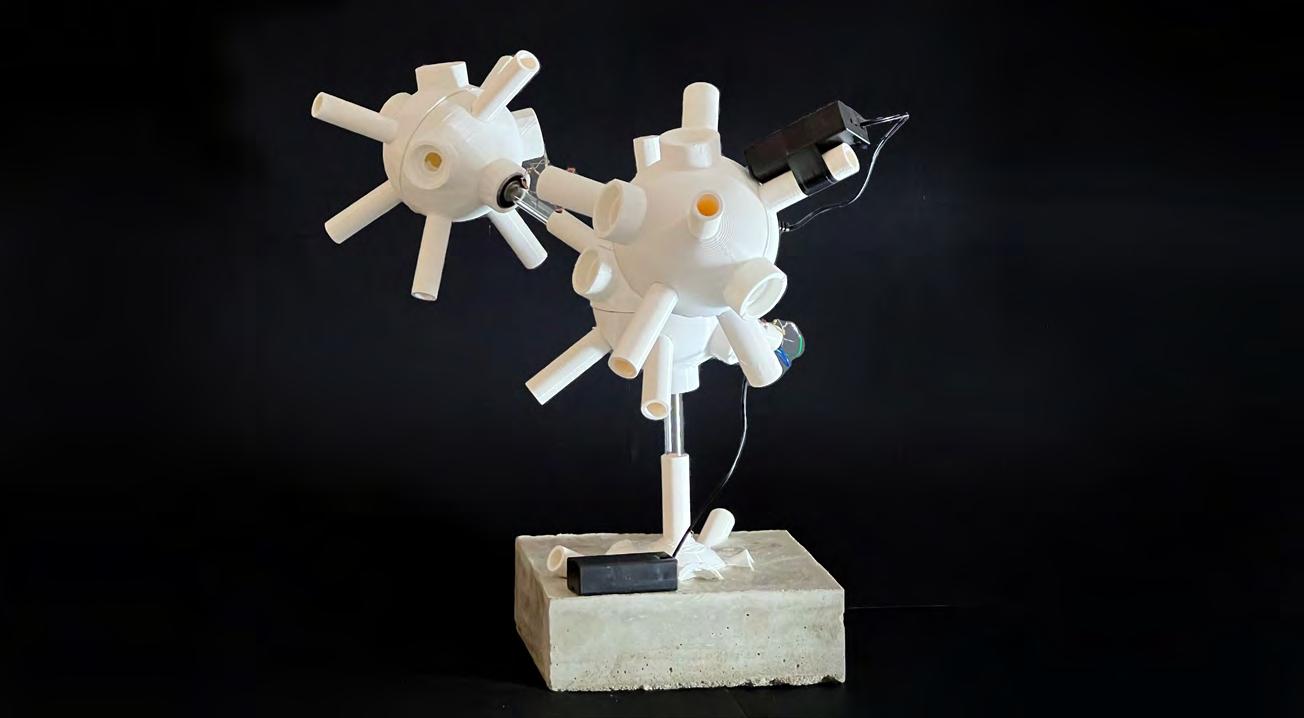
Fig.189. System response to the direct light
Fig.188. System response to the direct light
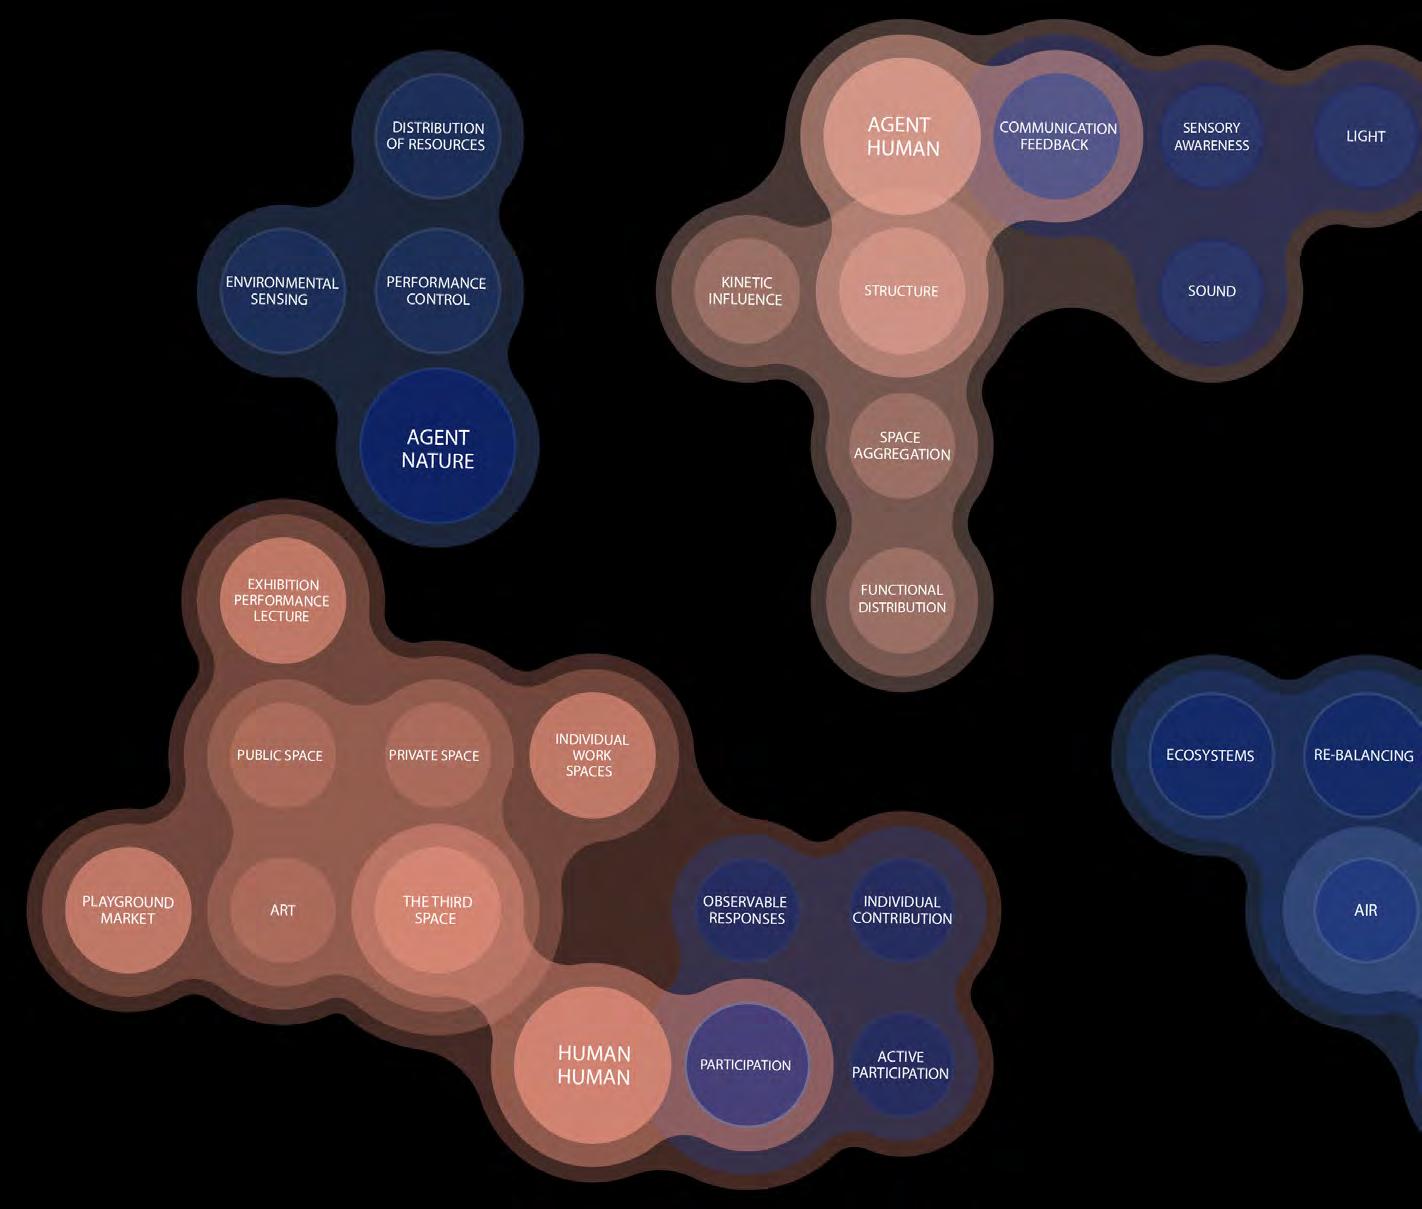
FEEDBACK LOOP TO THE ENVIRONMENT
“Spatial environments as ecologies of interaction serve as a stimulus for participation. Participatory models offer dynamic and intuitive relationships between the environment, observers and performers within the system. It is through this participatory model for interaction that one sees that architecture can serve as a host to enable scenario-based exchanges that amplify space as an interface for communication. This communication in principle can be human or non-human.” 116
The network system is designed to facilitate an interaction between both human and nonhuman species within the spatial environment domain. By integrating the position in the project that this interaction is a necessary condition for the system to adapt to fast changing circumstances such as weather conditions,
Fig. 190. Selected area to test the network generation principles;
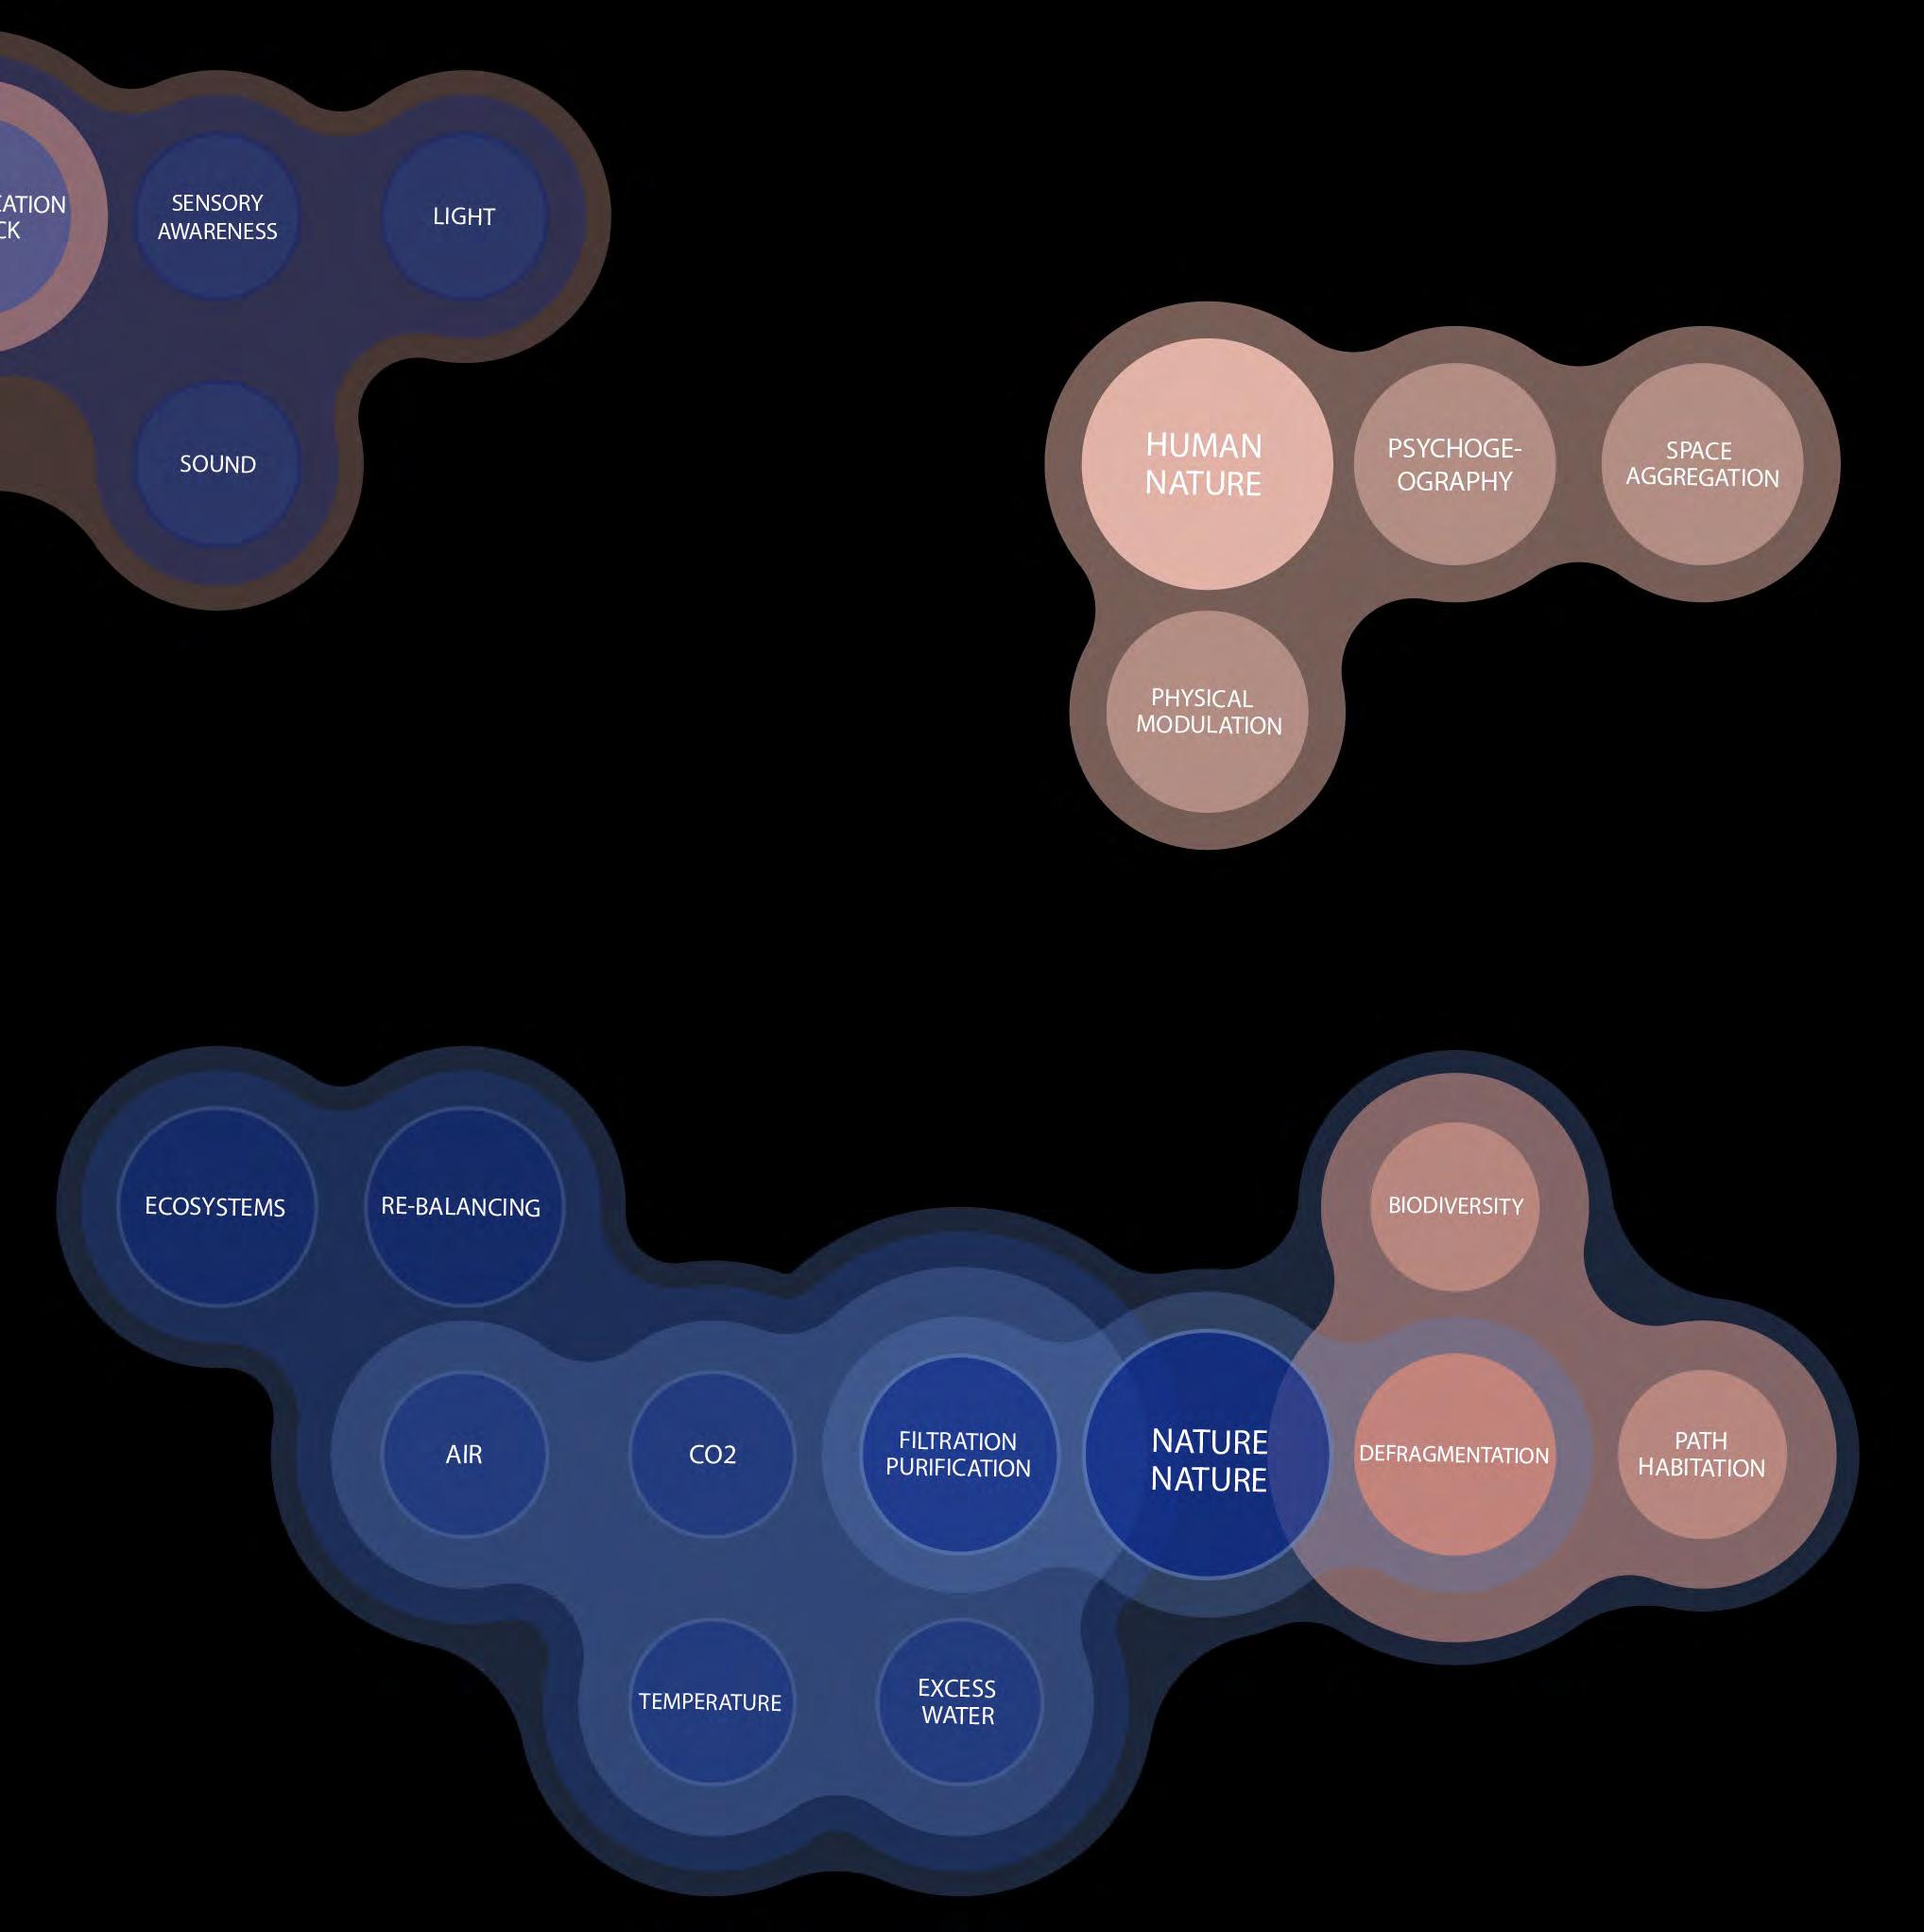
occupancy of the territory by people and their communication, it prevents the network from becoming static and fixed. Instead, it relies on the information of the context it is situated in to draw information from in order to monitor pollution levels and its rates of change as well as the environmental conditions in flux.
There is an existing parallel between the position of integrated feedback between participants and BioBot and second order cybernetics theory. The opportunity to integrate second order cybernetics can be beneficial in the way in which von Foerster, et al. have structured the ability of systems to self-observe themselves through serial input data in order to then ‘learn’ from earlier iterations.117
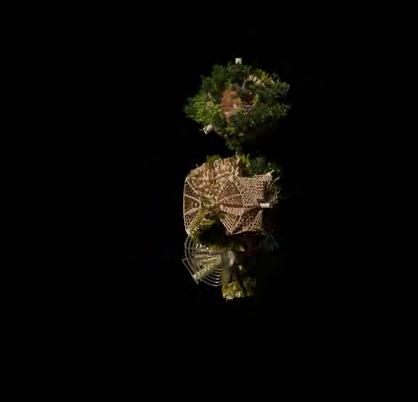
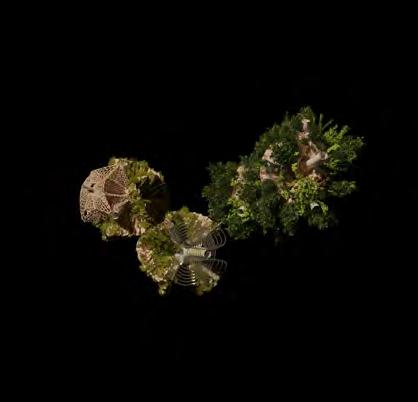
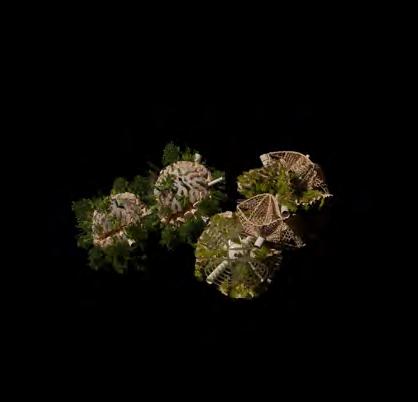
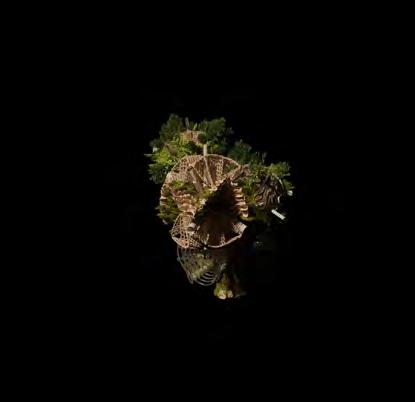
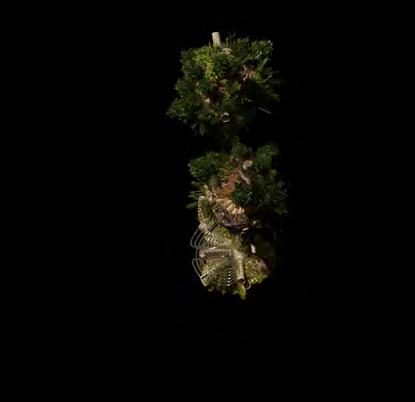
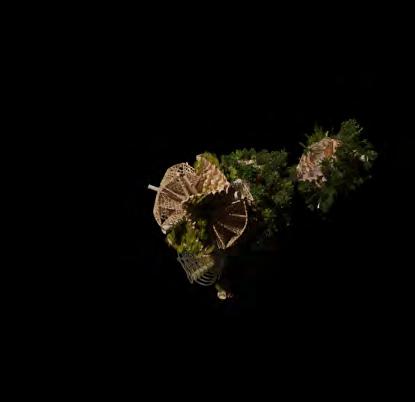
These ‘learn’ behaviours therefore structure the output in accordance. The adaptability of a system to benefit various locations while collecting information on environmental pollutants and shifting conditions is not dissimilar from a natural system in which evolution plays a role in determining the fittest, respectively. Moreover, while cybernetics has been described as having three levels of interaction: human to machine, human to human and machine to human, it would be appropriate to propose Nature as an interaction environment and responding system under the Bio-Bot research. Nature to human, nature to machine and nature to nature would consequently be up for research considerations.
Agent | Human | Nature Intersections
Human Machine frameworks examine the evolving dialogue between human and non-human agents
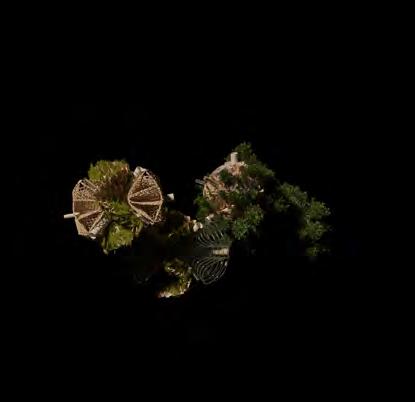
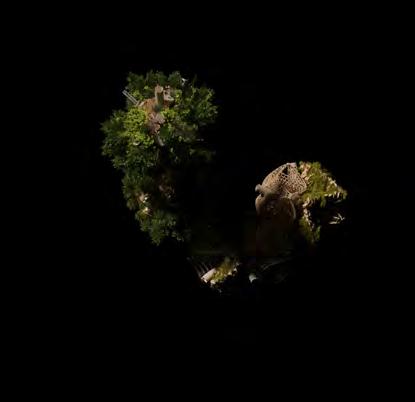
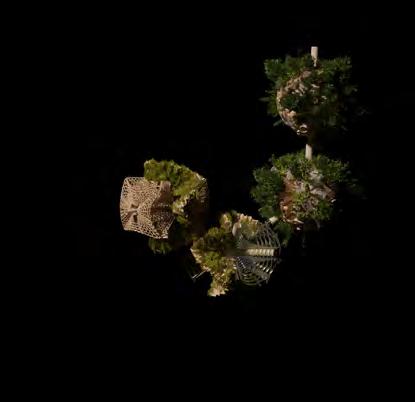
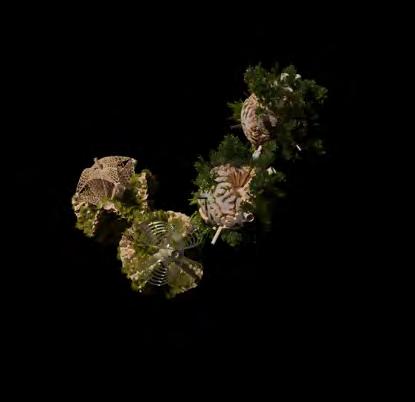
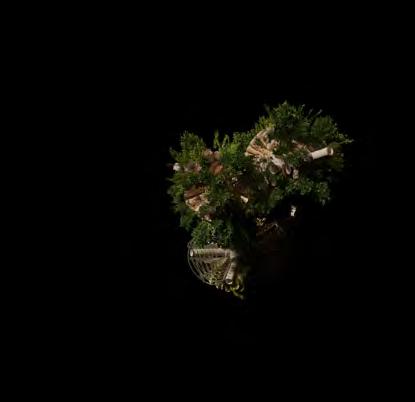
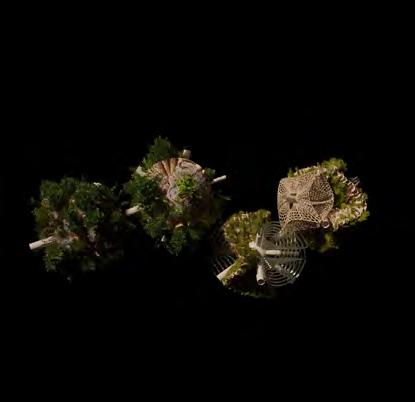
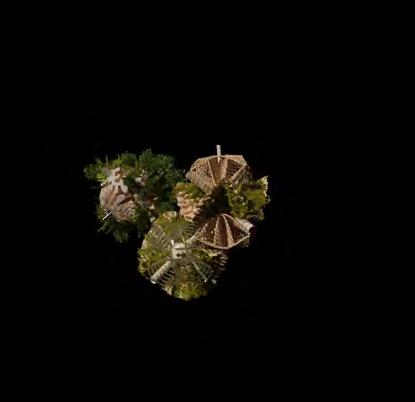
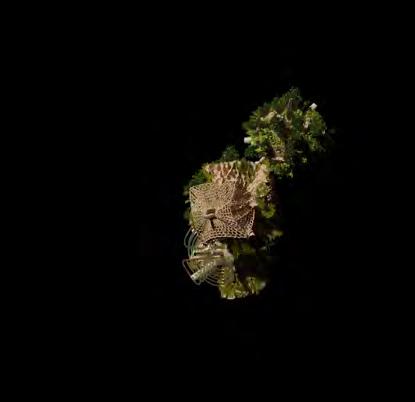
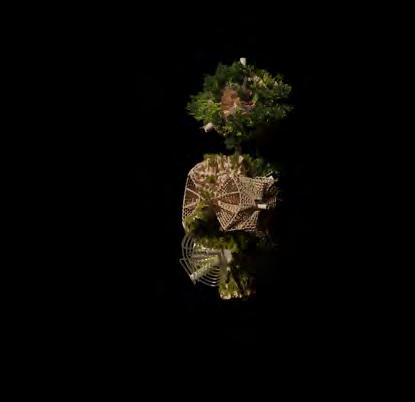
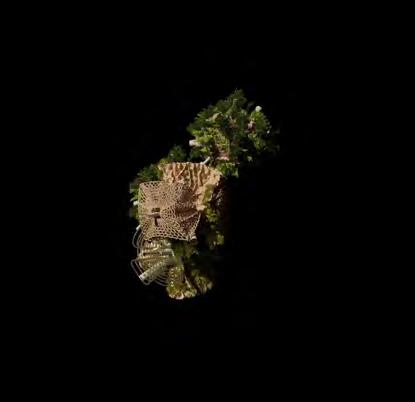
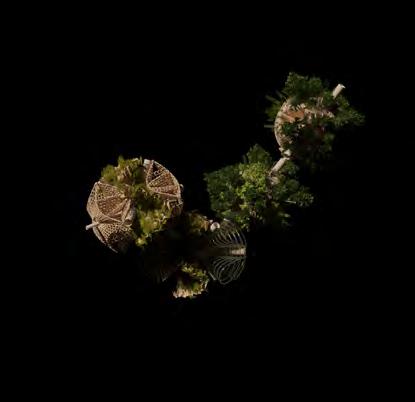
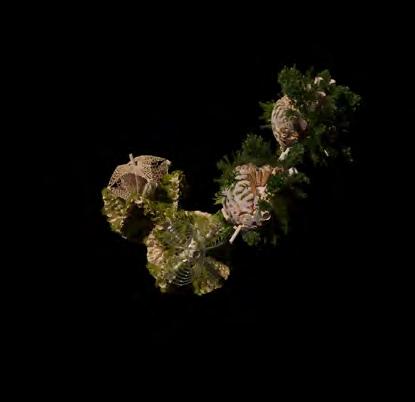
interacting within an environment. Interaction between human and non-human agents is understood as continuing an evolving discourse through cybernetic and behaviourist frameworks.118 To the extent of human to human interaction, the distribution of this network redefines existing spatial relationships and therefore a new way of arbitration. Conversational partnering can manifest in the form of dynamic and intuitive relationships between the environment, active observers and performers within the system. This form of interaction constructs a framework to explore space as a model of interfacing that shifts the tendencies of passive occupancy of space towards an active and evolving ecology of interacting objects.119 If in this scenario, a vernacular plant in the production module changes to a small agricultural crop, it affects the necessary level of human involvement needed to ensure its fruition. However, it cannot leave
Fig. 191. Views of aggregation changes based on kinetic response to environmental stimulus
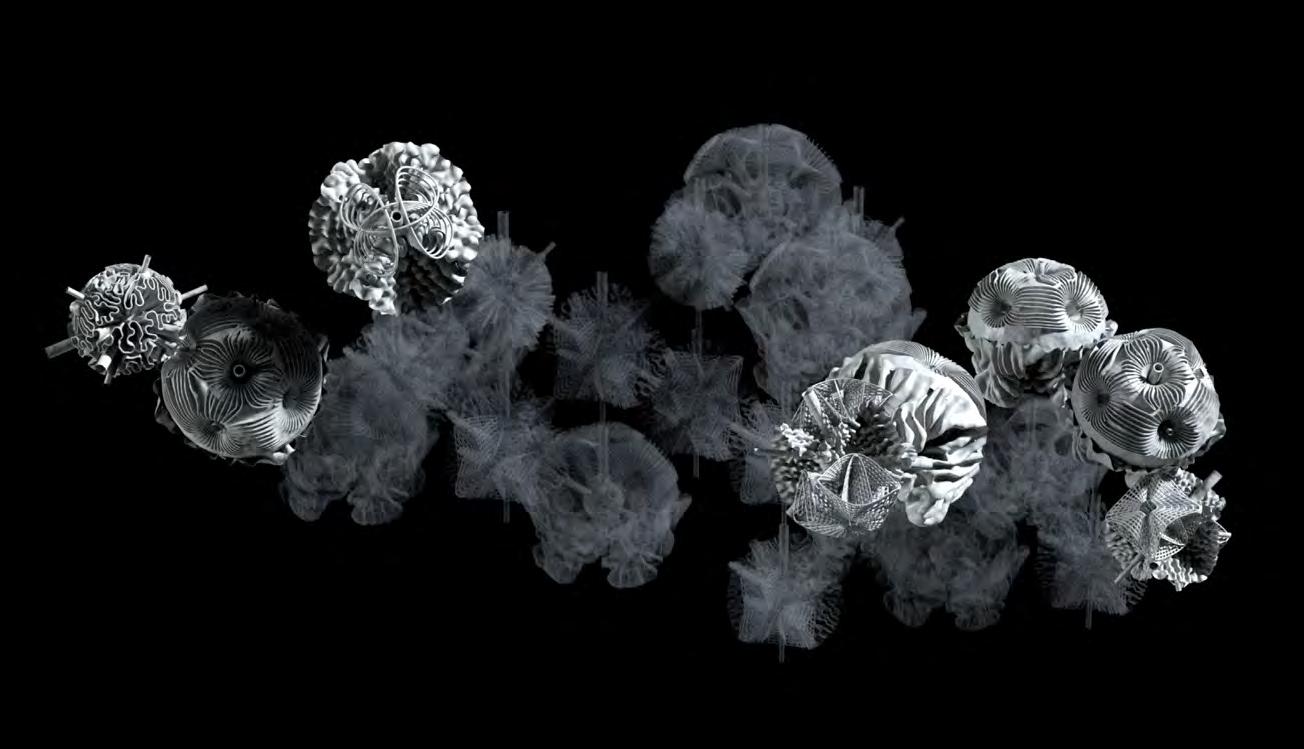
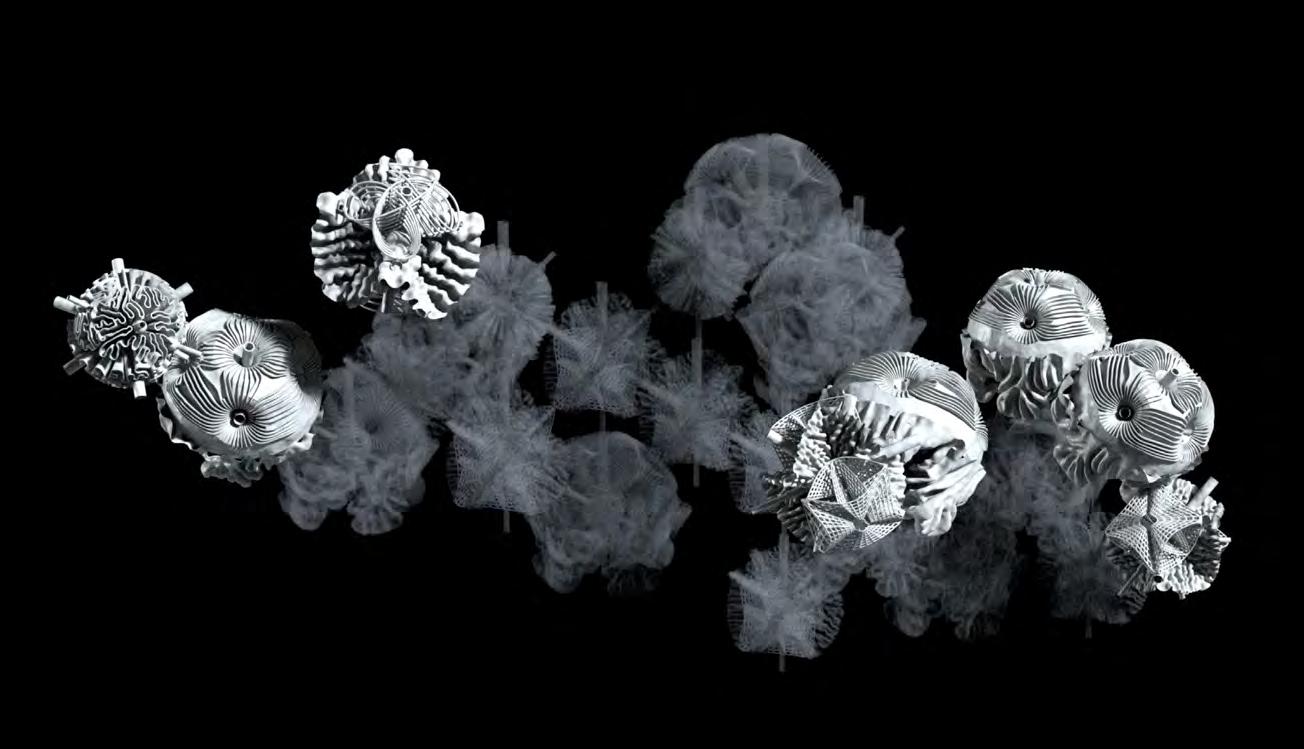
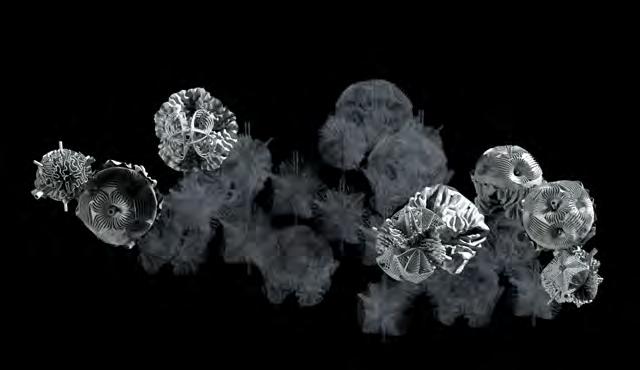
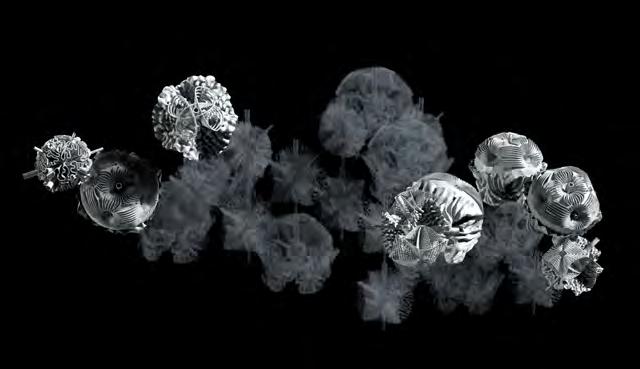
out the interaction one agent needs to have with another for the functional distributions in situ. In this way, the distribution refers always to real data extracted from analysis while the connections between modules is dictated by their performativity. Forthright, the nature to nature interaction in the project has been considered between the existing green landscape of Green Belt to its connection within Central London, whereas the secondary implication of interaction is the new relationship between existing and interjected nature. Therefore, nature to human takes on a different level of interaction in this context. While the primary focus of the network proposed is to create continuity to combat fragmented ecologies, it should be emphatically underlined that the reason for the ecological degradation is urbanisation brought on by humans. It should therefore be part of the ethos of the project to establish ethical responsibility for the deteriorated and limited truly ‘green’ spaces left in Central London.
By reconstructing fragmented green spaces within the existing context and testing the potential of this new system, it allows the project to be reconsidered from the lens of altering environmental dynamics in larger more varied contexts.
Fig. 192. Views of aggregation changes based on kinetic response to environmental stimulus
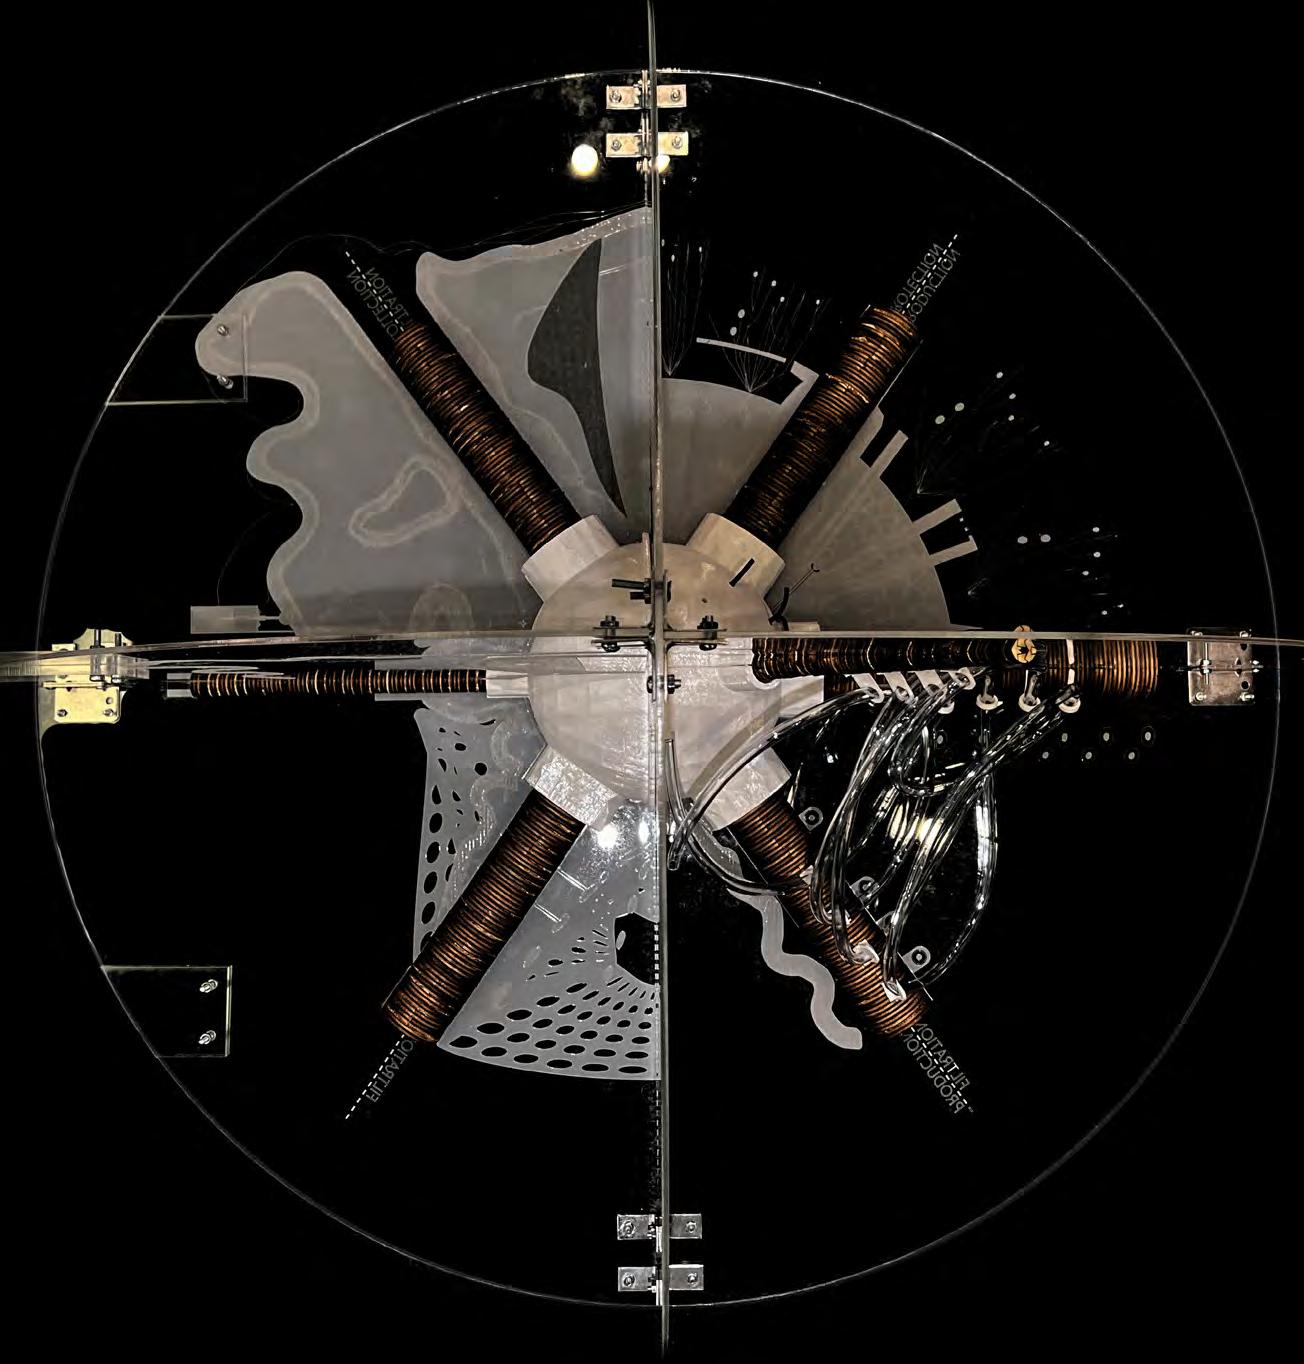
Fig. 193. Top view of physically fabricated working model of Biobot at 1 : 0.75 scale
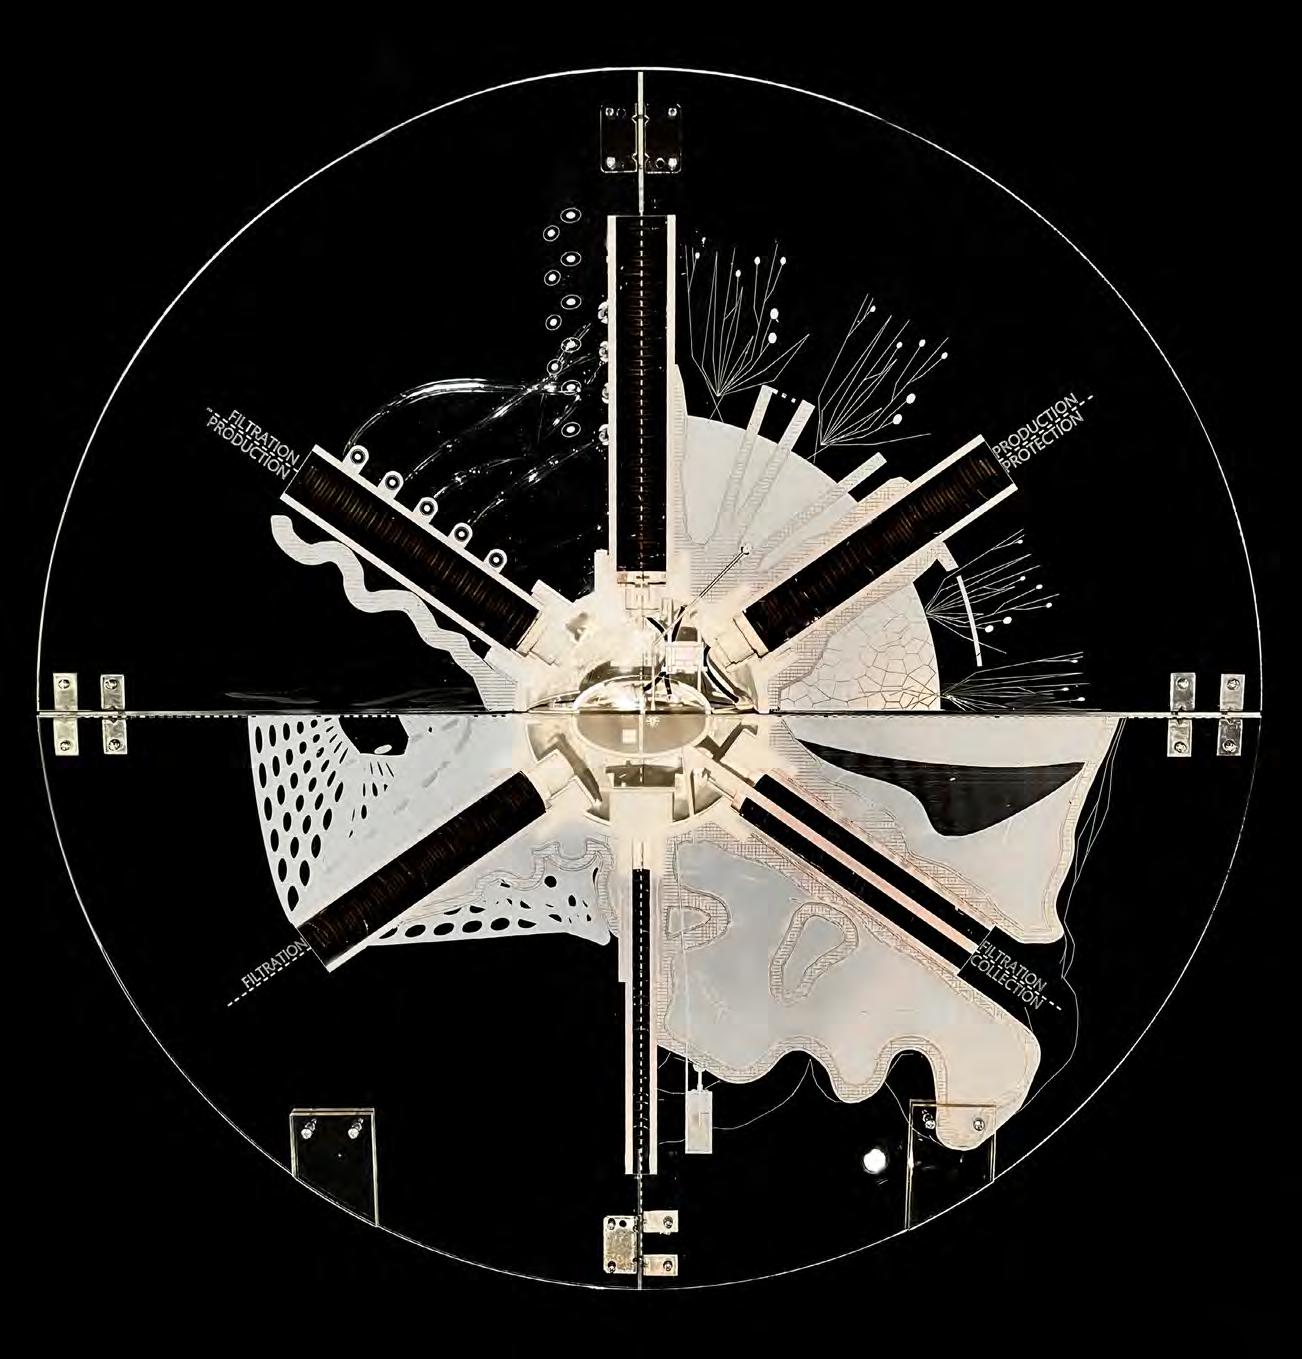
Fig. 194. Sectional view of physically fabricated working model of Biobot at 1 : 0.75 scale
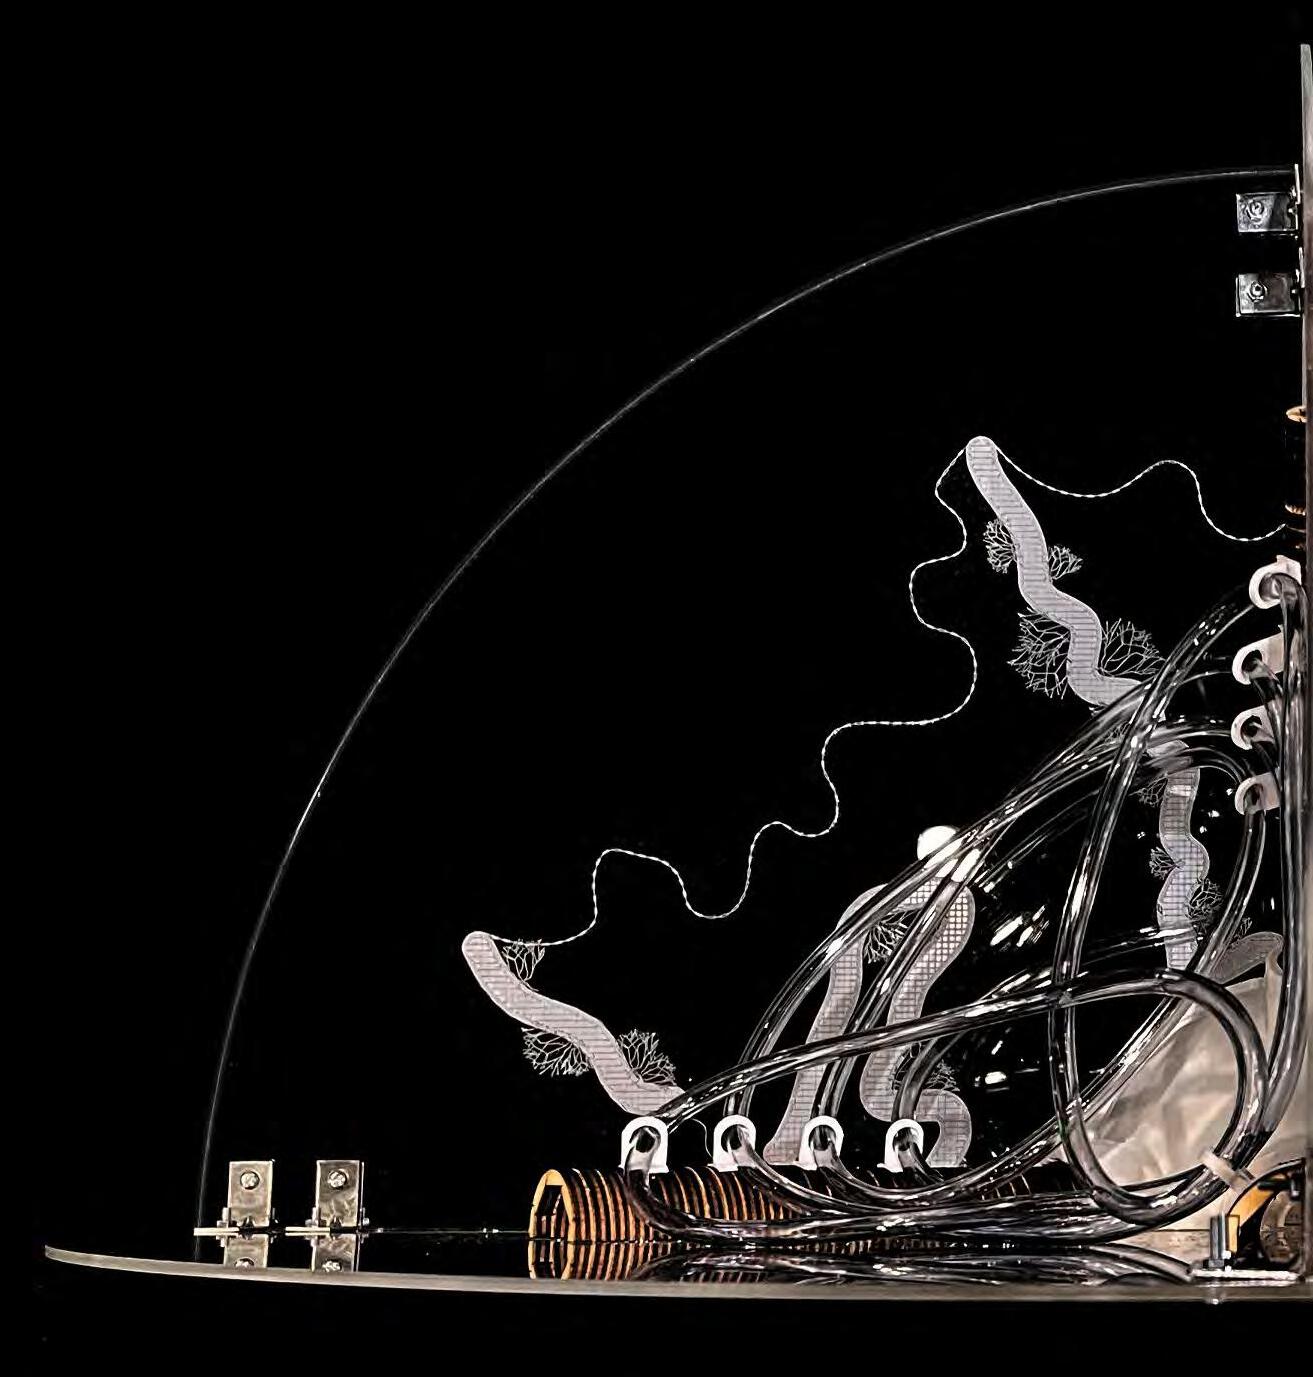
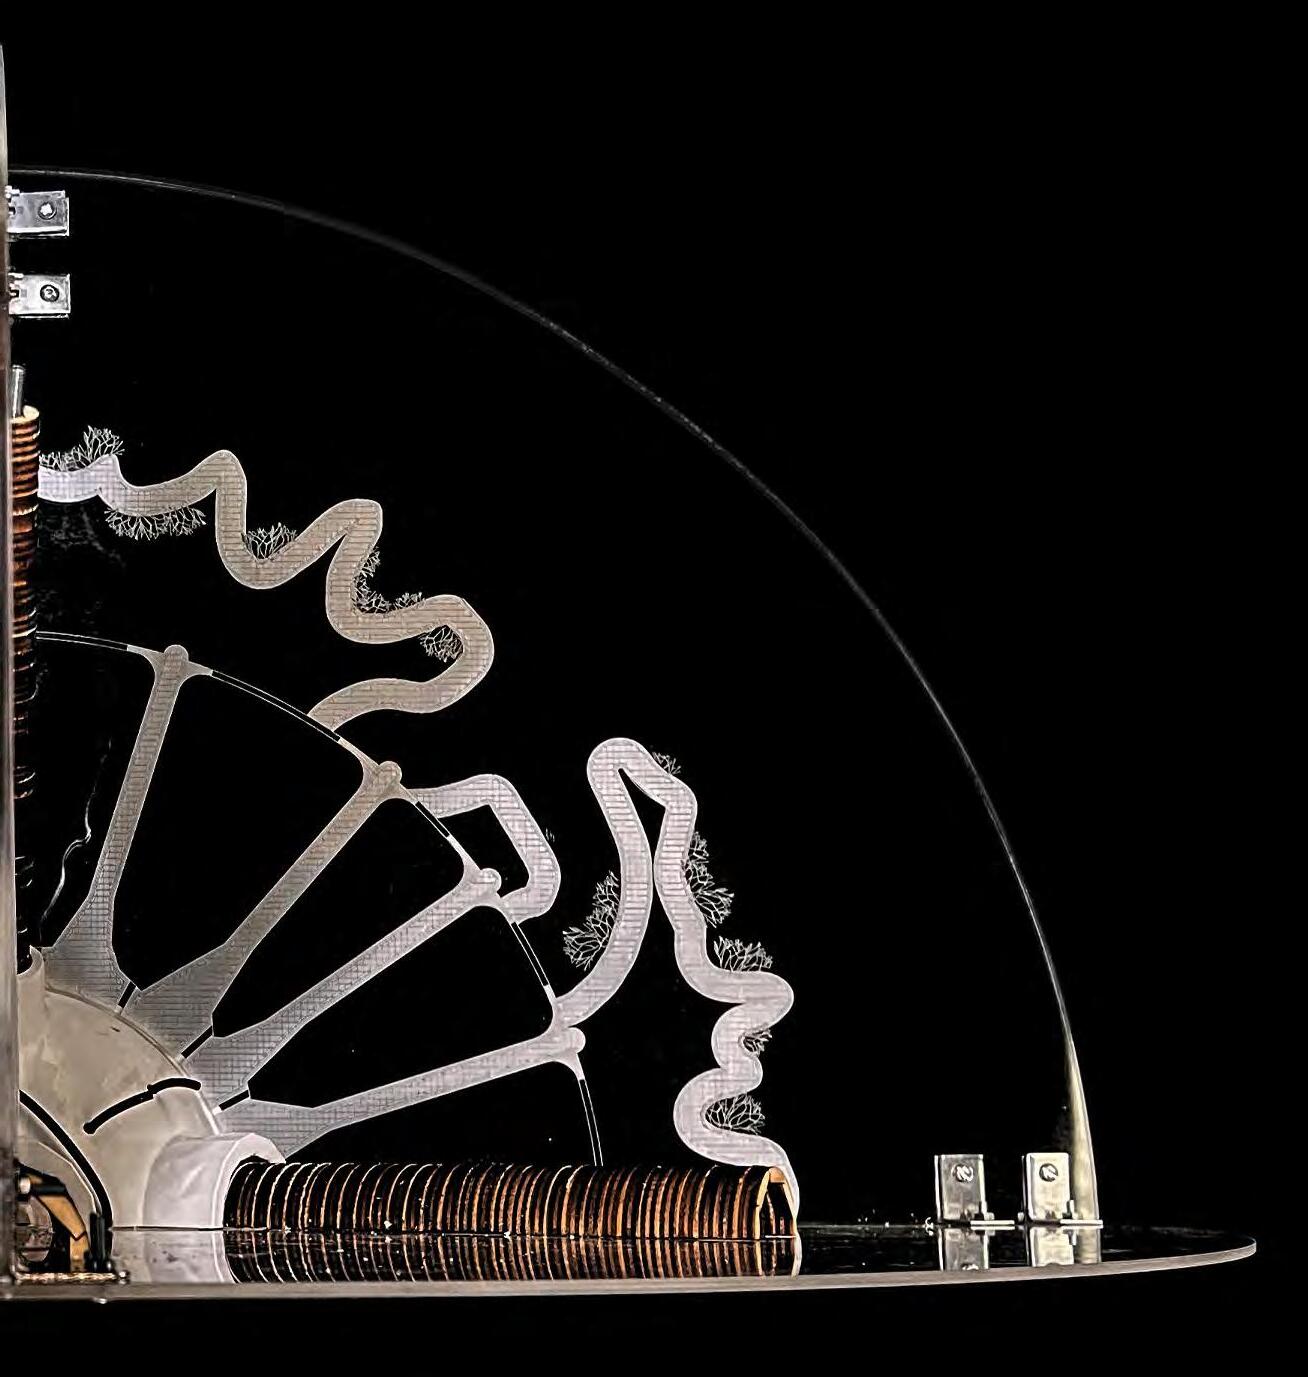
Fig. 195. Elevational view of physically fabricated working model of Biobot at 1 : 0.75 scale
COLLECTION_FILTRATION - 7
CO2 ADSORPTION - 8904 KG | YEAR

FILTRATION - 45
CO2 ADSORPTION - 17885 KG | YEAR
FILTRATION_PRODUCTION - 11
O2 PRODUCTION - 4 KG | YEAR
CO2 ABSORBTION - 6045 KG | YEAR
FILTRATION_PRODUCTION - 11
O2 PRODUCTION - 124381 KG | YEAR
CO2 ABSORBTION --124381 KG | YEAR

COLLECTION_FILTRATION - 7
CO2 ADSORPTION - 8904 KG | YEAR
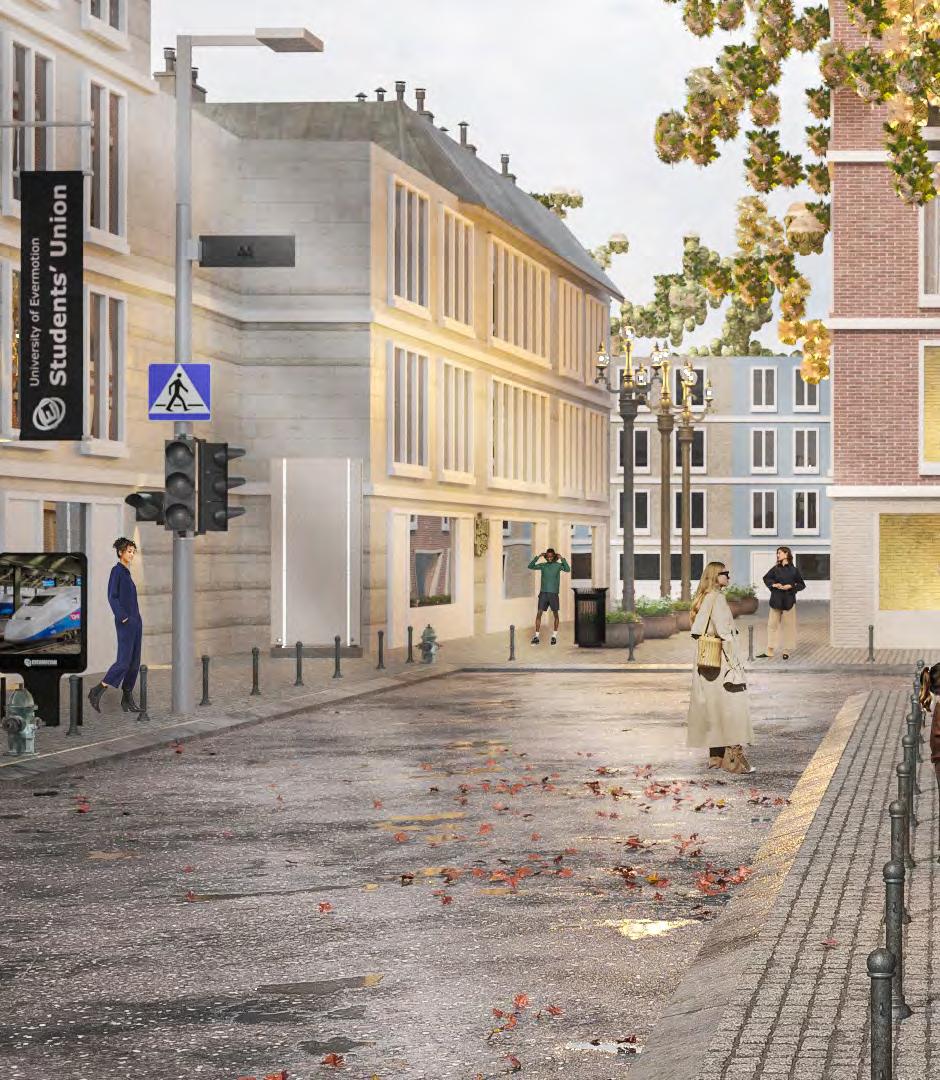
FILTRATION - 45
CO2 ADSORPTION - 17885 KG | YEAR
FILTRATION_PRODUCTION - 11
O2 PRODUCTION - 4 KG | YEAR
CO2 ABSORBTION - 6045 KG | YEAR
FILTRATION_PRODUCTION - 11
O2 PRODUCTION - 124381 KG | YEAR
CO2 ABSORBTION --124381 KG | YEAR
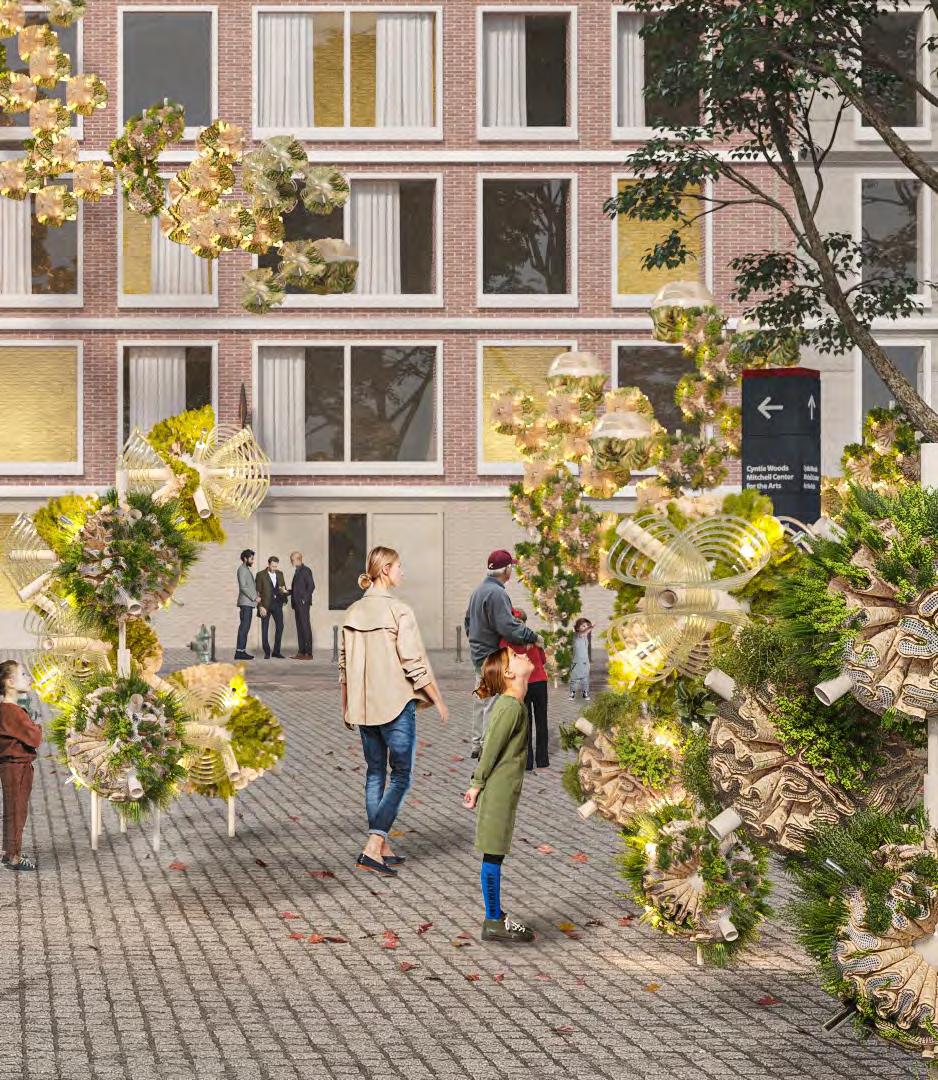


2 FACADE CONNECTIONS
1 MODULE ATTACHED
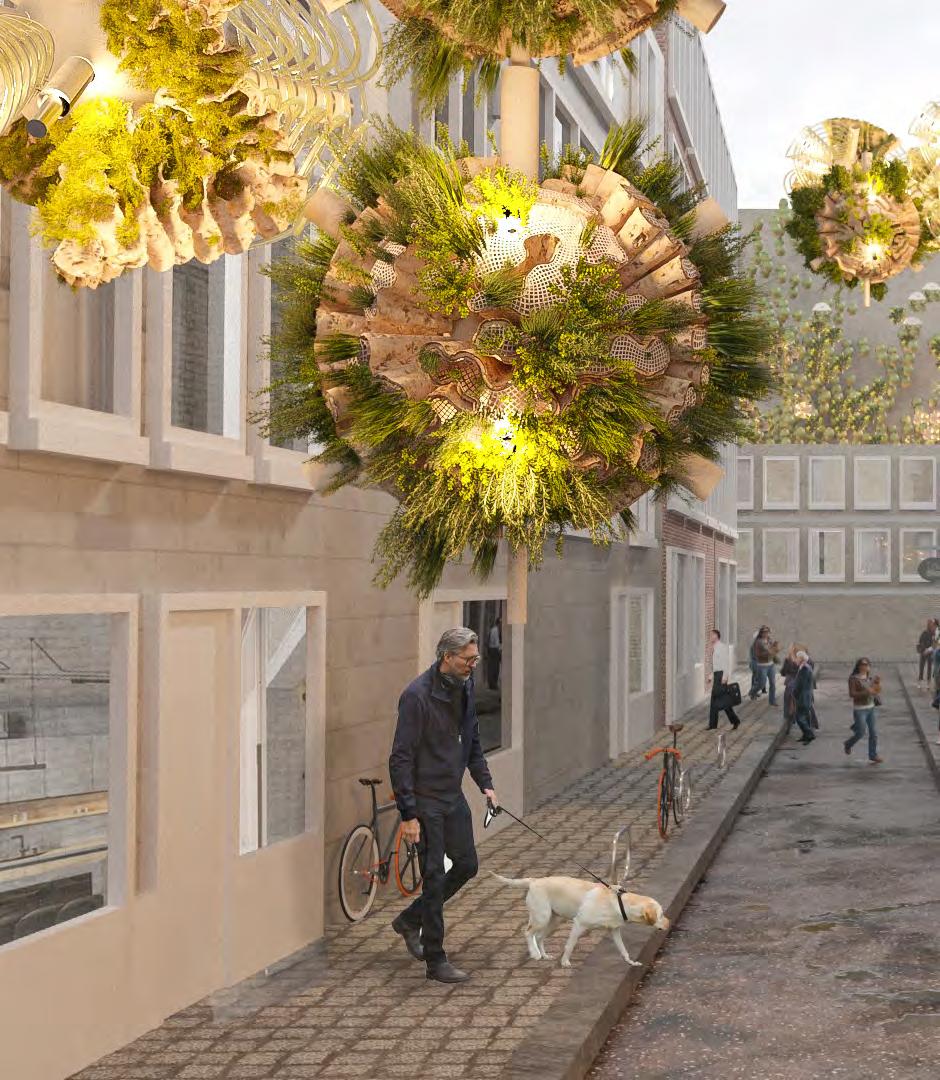
2 FACADE CONNECTIONS
1 MODULE ATTACHED
FILTRATION_PRODUCTION - 11
O2 PRODUCTION - 2KG | YEAR
CO2 ABSORBTION - 2659 KG | YEAR
PRODUCTION_PROTECTION - 19
O2 PRODUCTION - 319356 KG | YEAR
CO2 ABSORBTION - 319356 KG | YEAR
2 GROUND CONNECTIONS
7 MODULE ATTACHED
2 FACADE CONNECTIONS
9 MODULES ATTACHED
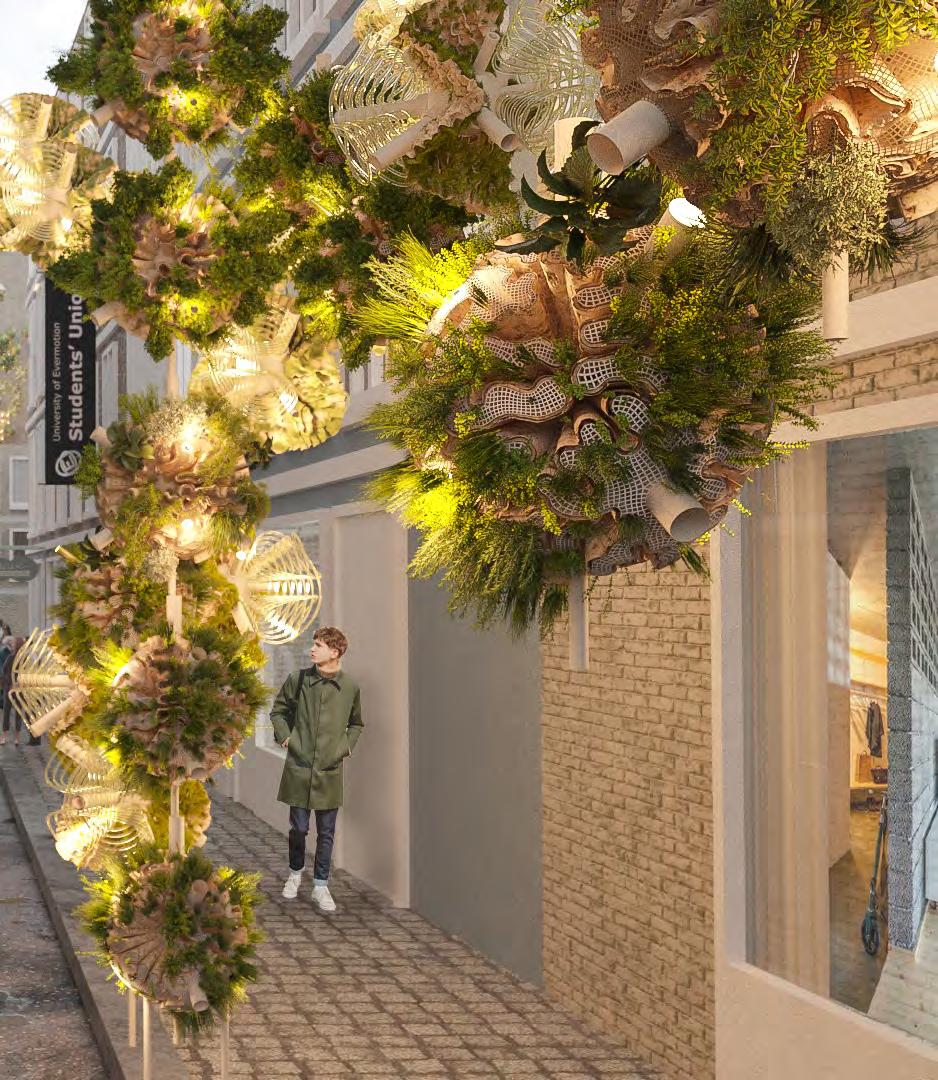
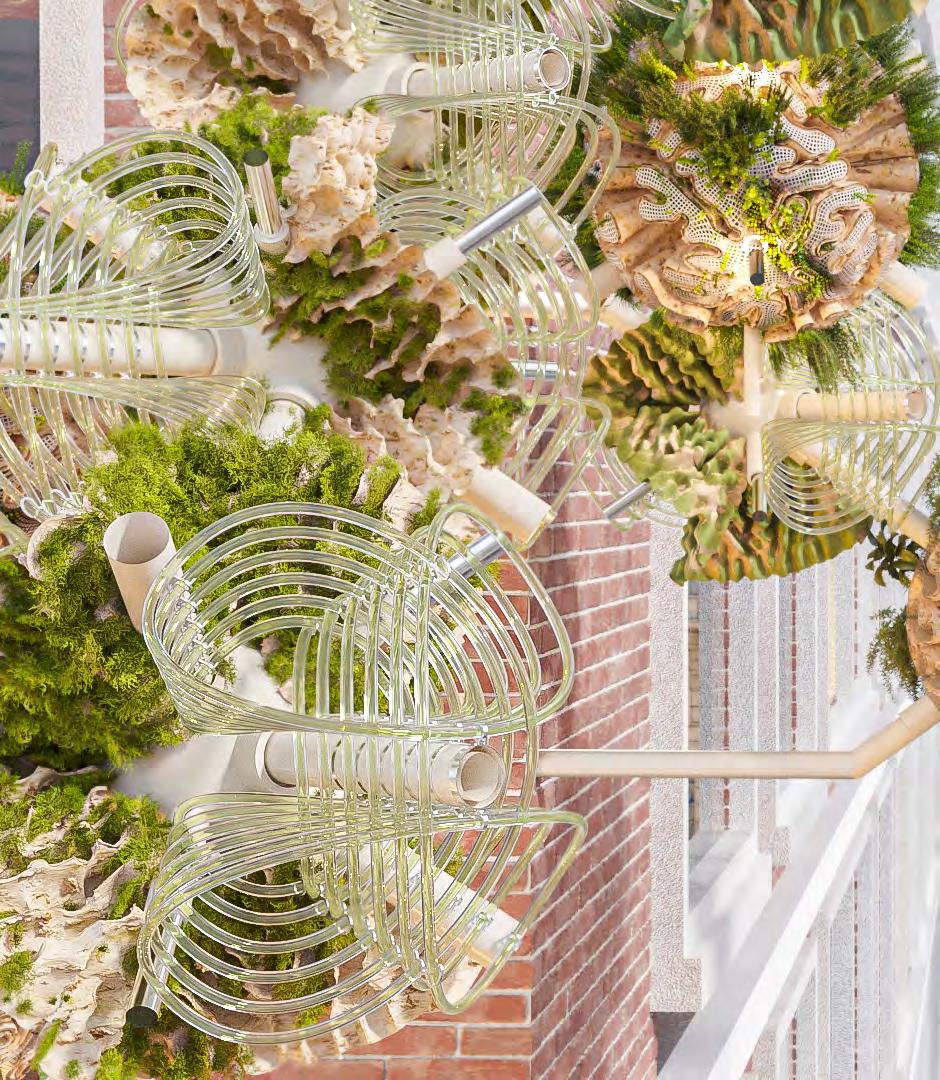
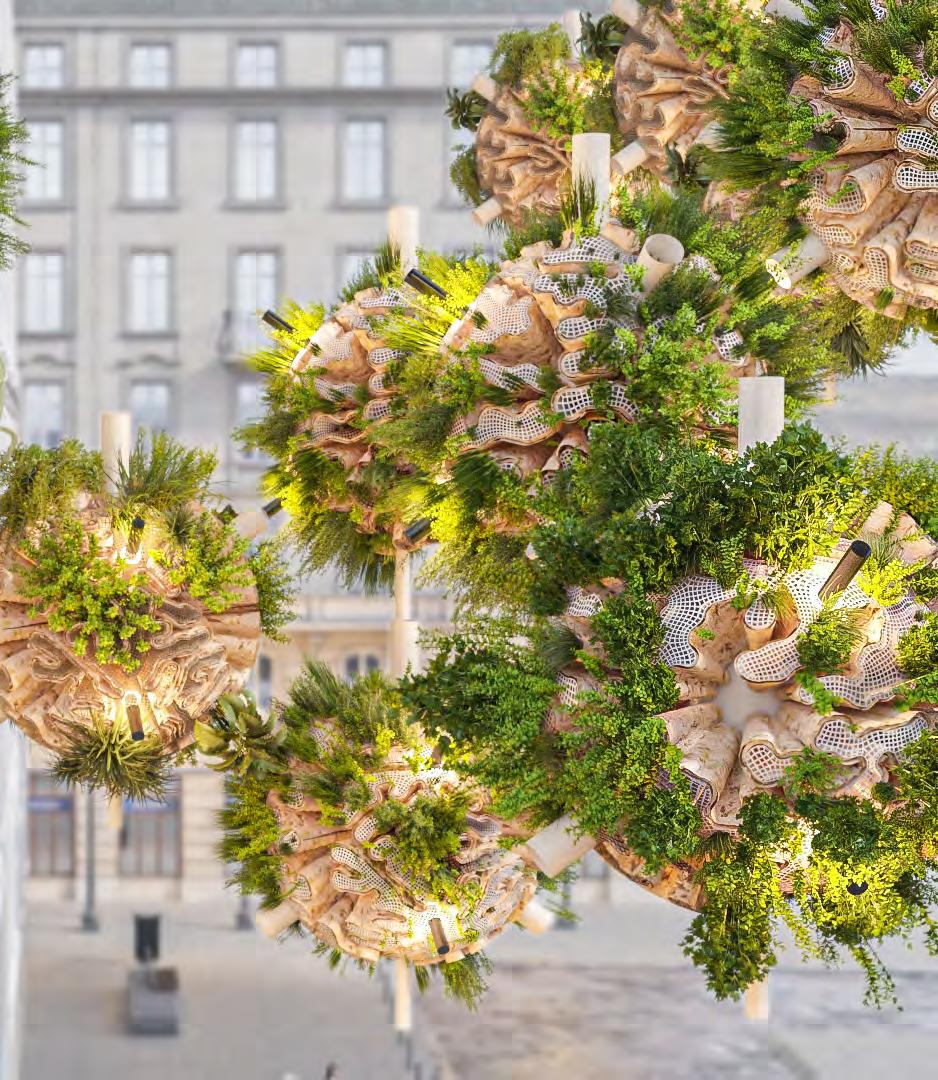
The developed networks create a series of public spaces in underused interstitial spaces as well as balance the environmental conditions of existing ones. Humidity, solar gain, shadow surfaces, temperature and wind speed are balanced by the system in order to improve local conditions and accelerate human activity.
Continuous green networks maintain the existing ecosystems, redefining the symbiotic synergy between human beings, living species and nature.
CONCLUSION
“We are heading towards climate collapse, led by systems and values that reward consumption and expansion, and thrive on inequality. But an alternative path is possible. There is not just one solution to the climate emergency, but multiple possible visions of a radically different world. A world that damaging systems have been disrupted”121 To reiterate, the design brief outlines the re-establishment of a resilient green network. Emerging from the most affected regions to rebalance the relationship between the current built environment and nature, the project re-links back to the existing Green Belt. Therefore, the aim of the project was to develop and implement a network system that would reconnect back isolated green patches, rebalancing the relationships of ecosystems within ecosystems. In so doing, it would create a feedback between the ecosystems of London and the ecosystems interjected by the network proposal. Therefore, the goal was to generate a series of modules in order to revive the lost green links to existing biodiversity, recreate safe habitats for species, aid carbon capture and decontamination of atmosphere and improve thermoregulation in dense urban environments. These functions were categorised into 4 distinct morphologies: Production_protection, Filtration_Production, Collection_Filtration and Filtration. Each module was optimised using a generative design approach according to the specificities of their function. Moreover, the optimised geometries were further detailed in order to to be contextually sensitive and specific to the larger connections of assembly.
Despite the fact that the developed network strategically solved the above mentioned problem (and proven in the quantifications of material performance to pollution extraction via tabulated date mentioned in Fig. XX), it posed a number of challenges which should be addressed in the further stage of the project development. First of all, the chosen strategy for the establishment of the areas of implementation should be reevaluated. Particularly, the clustering strategy should be analysed one more time in order to attach the implementation areas on the existing built environment. The current strategy identifies the central point of the cluster without comparing the location of points, which resulted in disassociated, ‘flying’ clusters of modules. The problem was addressed through the second stage of the DLA simulation, however, it would be more appropriate to reevaluate the process. In order to interject the network in other problematic regions, each first order clustered area should go through the same process which will reveal the exact number of starting areas and their parameters. Therefore, the approach is not universal; each area should go through all stages of the developed process in order to create a network which can be successfully implemented. This can drastically increase the time for the development of the project, as for the successful network the environmental model should be extremely detailed on all levels be it from the scale of an entire building or all the way down to a flower bed.
The next challenge is the adaptation of the system to the environmental conditions. Despite the developed kinetic joinery, the system has potential to respond to the environment and interact with users in a number of ways. First of all, the system may be able to influence the environmental parameters not only in a passive, but also in an active way by directly affecting the humidity and temperature of the environment. More than that, developed modules and their rotation are autonomous, which challenges the maintenance aspect and its structural resolution.
The next area of challenges is the aggregation of the network; some of the accumulated clusters are too dense, which restrict the rotation of the modules as well as their accessibility. Therefore the performance criteria of positionally locking modules can be used which would simultaneously affects the whole system and its maintenance ie. the positioning of solar exposure as it relates to biofuel production. Moreover, the conducted Finite Element analysis should be reiterated on the generated network in order to
CONCLUSION
remove or add modules in specific areas which can accelerate the performance of the system by identifying areas which are in need of rotational stability, and thereby accessibility.
On the local scale, developed functional cells should go though one more round of optimisation process as well. The developed morphologies are very challenging in terms of manufacturing as only the bearing structure is universal for all of them. Even though the structure remains the same, it has a different core inside that should be accessible for maintenance. Hence, structure should be able to disassemble what should be developed in the next stages of the research development. Proposed morphologies demand a high precision equipment for manufacturing as the process contains cnc milling, baking and robotic extrusion.
In terms of the newly developed material, foaming strategy in which yeast is involved can be unpredictable resulting in slight changes which can be a problem during the assembly process. Material robotic extrusion needs a few more iterations of experiments. There is an issue with the material attachment to the surface. As a structure contracts after the extrusion, after attachments, it should be easily detached in order to dry without cracks, but at the same time staying on the surface to dry in needed morphological form. The series of experiments needed to understand the level of contracting what will influence the strategy for extrusion. More than that an industrial air drying technique should be implemented as during the unequal drying process the structure can crack or completely change the form. Furthermore, between the development of the material composition and its proportions, to the production of the final prototype, it was observed that the sawdust mixture had begun to produce mould naturally. This was analogous with the growing of moss bio-tissue on the material bricks: there was an accelerated growth of mould which plateaued and equalised at the end of the submission. This is a direct relationship between moulding sawdust and the reciprocation of moss’ consumption rate of mould. The organic matter byproduct is therefore conducive to the energy needed to cultivate the biotissue. However, this stage needs further clarification in order to properly assess the rates of growth of living tissue against the decay of the biomaterial composite and whether if a disbalance occurs, it is possible that disintegration will occur.
Ultimately, in proposing a modular network system which infiltrates urban space, there is an inherent implication affecting the temporality of human occupancy. The level of ‘partnering’ needed for the maintenance of the network raises questions of whether privatisation or commodification should depend on proximity to the nearest commercial function? Or can participatory relationships be shared between all humans because the modules purify space for all occupants. While remaining open-ended, it raises an important larger point; is every new generation ethically responsible to clean up the messes of previous generations? And if that is to be true, can the accumulation of generational pollution be actively solved through this modulation? The project should improve the environment directly for human occupancy such that the project becomes more receptive for people rather than pedestrian nuisance. In this way, humans establish a connection to the modules and cannot foresee a future in which (at the most basic level) public spaces are no longer thermoregulated. In slight, the more beneficial a new system poses to humans, the more likely it is that an ethos of care-taking can be conditioned in people as a new learnt behaviour- especially because it is obvious there is no pathos in rising climate changes. Therefore, as the levels of pollution rise, it is possible that the methodologies of the project would need to be reevaluated, quantities of modules would need to drastically increased, bio-materials would possibly need to be entirely reconsidered as well as the spatial implications of waiting too long: elegiac silent forests and empty seas.122
ENDNOTES
110. “Diffusion Limited Aggregation,” MIT AI Laboratory, n.d., http://www.ai.mit.edu/projects/im/ broch/.
111. Halsey, “Diffusion-Limited Aggregation.”
112. N.M. Saville et al., “Bumblebee Movement in a Fragmented Agricultural Landscape,” Agriculture, Ecosystems & Environment 61, no. 2–3 (February 1997): 145–54, https://doi.org/10.1016/S01678809(96)01100-0.
113. Madzaki et al., “Carbon Dioxide Adsorption on Sawdust Biochar.”
114. Haoyang, “Algae-Based Carbon Sequestration.”
115. Halsey, “Diffusion-Limited Aggregation.”
116. Spyropoulos, “Constructing Participatory Environments: A Behavioural Model for Design.”
117. Bernard Scott, “Second-order Cybernetics: An Historical Introduction,” Kybernetes 33, no. 9/10 (October 1, 2004): 1365–78, https://doi.org/10.1108/03684920410556007.
118. Spyropoulos, “Constructing Participatory Environments: A Behavioural Model for Design.”
119. Spyropoulos.
120. Change, “Carbon Dioxide Concentration | NASA Global Climate Change.”
121. Caroline Till and Kate Franklin, Exhibition “Our Time on Earth” Barbican International Enterprises; Co-Produced by Musée de La Civilisation, Québec City, Canada, n.d., n.d.
122. Easterling, “Landscapes, Highways, and Houses in America.”
BIBLIOGRAPHY
“Air Pollution and the Effect on Our Health | London Councils.” Accessed September 16, 2022. https:// www.londoncouncils.gov.uk/node/33227.
“Albedo - an Overview | ScienceDirect Topics.” Accessed August 11, 2022. https://www.sciencedirect.com/ topics/engineering/albedo.
Al-Haj Ibrahim, Hassan. “Introductory Chapter: Pyrolysis.” In Recent Advances in Pyrolysis, edited by Hassan Al- Haj Ibrahim. IntechOpen, 2020. https://doi.org/10.5772/intechopen.90366.
Anguselvi, Vetrivel, Reginald Ebhin Masto, Ashis Mukherjee, and Pradeep Kumar Singh. CO2 Capture for Industries by Algae. Algae. IntechOpen, 2019. https://doi.org/10.5772/intechopen.81800.
Armstrong, Rachel. Soft Living Architecture; An Alternative View of Bio-Informed Practice. London: Bloomsbury Publishing Plc, 2018.
Asworth, James. “Bees, Butterflies and Moths ‘confused’ by Air Pollution,” January 24, 2022. https://www. nhm.ac.uk/discover/news/2022/january/bees-butterflies-and-moths-confused-by-air-pollution.html#:~:text=Air%20pollution%20obscures%20the%20sweet,by%20as%20much%20as%2031%25.
Barlow, Peter W. Differential Growth in Plants. Oxford, New York: Pergamon Press, 1989.
Bishop, Peter. “Repurposing the Green Belt in the 2st Century,” n.d., 185.
Bryce, Emma. “Global Study Reveals the Extent of Habitat Fragmentation.” Audubon, March 20, 2015. https://www.audubon.org/news/global-study-reveals-extent-habitat-fragmentation.
“Can a Moss Culture Really Clean Urban Air?,” November 22, 2017. https://www.greenhomegnome.com/ moss-clean-urban-air/.
Carlow, Vanessa Miriam, and Yeon Wha Hong. “London Green Belt: From a Landscape for Health to Metropolitan Infrastructure.” In Proceedings of 8th Conference of the International Forum on Urbanism (IFoU), 755–64. Incheon, Korea: MDPI, 2015. https://doi.org/10.3390/ifou-E003.
Change, NASA Global Climate. “Carbon Dioxide Concentration | NASA Global Climate Change.” Climate Change: Vital Signs of the Planet. Accessed July 20, 2022. https://climate.nasa.gov/vital-signs/carbon-dioxide.
Chowdhury, Zaira Zaman, Md. Ziaul Karim, Muhammad Aqeel Ashraf, and Khalisanni Khalid. “Influence of Carbonization Temperature on Physicochemical Properties of Biochar Derived from Slow Pyrolysis of Durian Wood (Durio Zibethinus) Sawdust.” BioResources 11, no. 2 (February 17, 2016): 3356–72. https:// doi.org/10.15376/biores.11.2.3356-3372.
GOV.UK. “Concentrations of Nitrogen Dioxide.” Accessed August 10, 2022. https://www.gov.uk/government/statistics/air-quality-statistics/ntrogen-dioxide.
BIBLIOGRAPHY
GOV.UK. “Concentrations of Particulate Matter (PM10 and PM2.5).” Accessed August 10, 2022. https://www.gov.uk/government/statistics/air-quality-statistics/concentrations-of-particulate-matter-pm10-and-pm25.
Cousins, Stephen. “Carbon-Eating Bio Curtains – the Answer to City Pollution?” RIBA, August 19, 2019. https://www.ribaj.com/products/carbon-capture-pollution-eating-algae-filled-curtains-bio-plastics-photosynthetica-ecologicstudio.
Cruz, Marcos, and Richard Beckett. “A Novel Approach towards Bio-Digital Materiality.” Bartlett School of Architecture; University College London, n.d., 20.
“Deep Green,” n.d. https://www.ecologicstudio.com/projects/deep-green-urbansphere-venice.
MIT AI Laboratory. “Diffusion Limited Aggregation,” n.d. http://www.ai.mit.edu/projects/im/broch/.
Easterling, Keller. “Landscapes, Highways, and Houses in America.” In Organisation Space, 25–34. Cambridge, Mass..: MIT Press, 1999.
Elledge, Jonn. “Loosen Britain’s Green Belt. It Is Stunting Our Young People.” The Guardian, September 22, 2017. https://www.theguardian.com/commentisfree/2017/sep/22/green-belt-housing-crisis-planning-policy.
“Embodied and Whole Life Carbon Assessment for Architects Sustainable Design.” Accessed September 16, 2022. https://www.architecture.com/knowledge-and-resources/resources-landing-page/ whole-life-carbon-assessment-for-architects.
Ewers, Robert M., and Cristina Banks-Leite. “Fragmentation Impairs the Microclimate Buffering Effect of Tropical Forests.” PLoS ONE 8, no. 3 (March 4, 2013): e58093. https://doi.org/10.1371/journal. pone.0058093.
“Experiencing Innovative Biomaterials for Buildings: Potentialities of Mosses | Elsevier Enhanced Reader.” Accessed July 18, 2022. https://doi.org/10.1016/j.buildenv.2020.106708.
Frazer, John. An Evolutionary Architecture. London: E.G. Bond Ltd, 1995.
“Green Belt under Threat from 200,000 New Houses.” The Times, January 28, 2019. https://www.thetimes. co.uk/article/green-belt-under-threat-from-200-000-new-houses-lxp7zkkdr.
Hahn, Jennifer. “Blast Studio 3D Prints Column from Mycelium to Make ‘Architecture That Could Feed People,’” Dezeen, January 18, 2022. https://www.dezeen.com/2022/01/18/blast-studio-tree-column-mycelium-design/#.
Halsey, Thomas C. “Diffusion-Limited Aggregation: A Model for Pattern Formation.” Physics Today 53, no. 11 (November 2000): 36–41. https://doi.org/10.1063/1.1333284.
BIBLIOGRAPHY
Haoyang, Cai. “Algae-Based Carbon Sequestration.” IOP Conference Series: Earth and Environmental Science 120 (March 1, 2018): 012011. https://doi.org/10.1088/1755-1315/120/1/012011.
Hebel, Dirk, and Felix Heisel, eds. Cultivated Building Materials: Industrialised Natural Resources for Architecture and Construction. Basel: Birkhäuser, 2017.
Holling, Crawford Stanley. “Resilience and Stability of Ecological Systems.” Annual Review of Ecology and Systematics, 1973, 1–23.
Hordern, Jane. “Carbon Capture Using Sawdust,” 2011. https://blogs.rsc.org/ee/2011/03/24/carbon-capture-using-sawdust/?doing_wp_cron=1658157492.9371159076690673828125.
Huang, Changjin, Zilu Wang, David Quinn, Subra Suresh, and K. Jimmy Hsia. “Differential Growth and Shape Formation in Plant Organs.” Proceedings of the National Academy of Sciences 115, no. 49 (December 4, 2018): 12359–64. https://doi.org/10.1073/pnas.1811296115.
IARC. “Wood Dust and Formaldehyde IARC Monographs on the Evaluation of Carcinogenic Risks to Humans Volume 62.” IARC Publications, 1995. https://publications.iarc.fr/80.
Jones, Jeff. “Characteristics of Pattern Formation and Evolution in Approximations of Physarum Transport Networks.” Artificial Life 16, no. 2 (April 2010): 127–53. https://doi.org/10.1162/artl.2010.16.2.16202.
Jorgensen, Anna, and Marian Tylecote. “Ambivalent Landscapes—Wilderness in the Urban Interstices.” Landscape Research 32, no. 4 (August 2007): 443–62. https://doi.org/10.1080/01426390701449802.
Junying Metal Manufacturing Co., Limited. “CNC Milling Guide – CNC Milling Advantages & Disadvantages, Application, Materials and Definition,” n.d. https://www.cnclathing.com/guide/cnc-milling-guide-cnc-milling-advantages-disadvantages-application-materials-and-definition.
Laboratory, By Alan Buis, NASA’s Jet Propulsion. “Milankovitch (Orbital) Cycles and Their Role in Earth’s Climate.” Climate Change: Vital Signs of the Planet. Accessed July 20, 2022. https://climate.nasa.gov/ news/2948/milankovitch-orbital-cycles-and-their-role-in-earths-climate.
“Landscape Fragmentation Pressure in Europe.” Accessed September 16, 2022. https://www.eea.europa. eu/ims/landscape-fragmentation-pressure-in-europe.
Laurén, Susanna, and Biolin Scientific. “Surface and Interfacial Tension,” n.d., 8.
Linke, Rebecca. “Additive Manufacturing, Explained.” MIT Management Sloan School, December 7, 2017. https://mitsloan.mit.edu/ideas-made-to-matter/additive-manufacturing-explained#:~:text=What%20 is%20additive%20manufacturing%3F,the%20final%20product%20is%20complete.
Liu, Dongjing, Weiguo Zhou, Xu Song, and Zumin Qiu. “Fractal Simulation of Flocculation Processes Using a Diffusion-Limited Aggregation Model.” Fractal and Fractional 1, no. 1 (November 18, 2017): 12. https:// doi.org/10.3390/fractalfract1010012.
BIBLIOGRAPHY
“London Air Pollution,” n.d. https://globalcleanair.org/data-to-action/london-uk/.
“London Air Quality Network » Annual Pollution Maps.” Accessed September 16, 2022. https://www.londonair.org.uk/london/asp/annualmaps.asp.
“London Air Quality Network Guide.” Accessed August 10, 2022. https://www.londonair.org.uk/londonair/ guide/WhatIsNO2.aspx.
“London Set To Lose 48,000 Acres Of Its Local Countryside | London Green Belt Council.” Accessed September 16, 2022. https://londongreenbeltcouncil.org.uk/london-set-to-lose-48000-acres-of-its-localcountryside/.
Lovera, Cristian Alejandro Silva. “THE INTERSTITIAL SPACES OF URBAN SPRAWL: THE PLANNING PROBLEMS AND PROSPECTS – THE CASE OF SANTIAGO DE CHILE.” University College London, The Bartlett School of Planning, September 2016, 332.
Madore, Jonathon. “How To Compost Sawdust.” Green Upside, n.d. https://greenupside.com/how-tocompost-sawdust/.
Madzaki, Hazimah, Wan Azlina Wan A.B. KarimGhani, NurZalikhaRebitanim, and AzilBahariAlias. “Carbon Dioxide Adsorption on Sawdust Biochar.” Procedia Engineering 148 (2016): 718–25. https://doi. org/10.1016/j.proeng.2016.06.591.
Mardianti, Ferriza Tri, Sukaton Sukaton, and Galih Sampoerno. “Benefit of Glycerine on Surface Hardness of Hybrid & Nanofill Resin Composite.” Conservative Dentistry Journal 11, no. 1 (June 30, 2021): 28. https://doi.org/10.20473/cdj.v11i1.2021.28-31.
McNaughtan Dugald. “Why Are Insects Important?” Wiltshire Wildlife Trust’s (WWT), 2022. https://www. wessexwater.co.uk/community/blog/why-are-insects-important#:~:text=breaking%20down%20and%20 decomposing%20organic,mammals%20consist%20of%20mainly%20insects.
Merleau-Ponty, Maurice. “Performative Acts and Gender Constitutions: An Essay in Phenomenology and Feminist Theory,” no. 4 (December 1988): 31–519.
“Minimising Carbon Footprint via Microalgae as a Biological Capture | Elsevier Enhanced Reader.” Accessed July 20, 2022. https://doi.org/10.1016/j.ccst.2021.100007.
“MosSkin: A Moss-Based Lightweight Building System | Elsevier Enhanced Reader.” Accessed July 18, 2022. https://doi.org/10.1016/j.buildenv.2022.109283.
OMAI. “A FIELD GUIDE TO PUBLIC SPACES Are We Making Inclusive Choices in the Design and Management of Public Spaces That Help Promote a Democratic Society?,” n.d.
“Online Atlas of the British and Irish Flora.” Accessed September 16, 2022. https://plantatlas.brc.ac.uk/. Orff, Kate. “Cohabit.” In Towards an Urban Ecology; Scape;, 81–138. The Monacelli Press, 2016.
BIBLIOGRAPHY
Pasquero, Claudia, and Marco Poletto. “Steam Cloud V2.0 by EcoLogicStudio,” 2008. https://www.ecologicstudio.com/projects/stemcloud-seville-art-and-architecture-biennale-2008.
Pettit, T., P. J. Irga, P. Abdo, and F. R. Torpy. “Do the Plants in Functional Green Walls Contribute to Their Ability to Filter Particulate Matter?” Building and Environment 125 (November 15, 2017): 299–307. https:// doi.org/10.1016/j.buildenv.2017.09.004.
Rajur, Vinay Sharanappa. “Modelling Diffusion Limited Aggregation,” 2015. https://doi.org/10.13140/ RG.2.1.4269.3283.
“Retrofitting-Soho-05-Main-Report-Chapter-2-P21-26-241208s.Pdf.” Accessed August 12, 2022. https:// www.westminster.ac.uk/sites/default/public-files/general-documents/Retrofitting-Soho-05-Main-Report-Chapter-2-p21-26-241208s.pdf.
Robert L. Horton, PhD, Ohio, State University Extension, Carol, Warkentien and Jeanne Gogolski, and EP&P LLC. “Bioplastic,” n.d. https://4-h.org/wp-content/uploads/2016/02/Agriculture-at-Work-Bioplastic.pdf.
Saville, N.M., W.E. Dramstad, G.L.A. Fry, and S.A. Corbet. “Bumblebee Movement in a Fragmented Agricultural Landscape.” Agriculture, Ecosystems & Environment 61, no. 2–3 (February 1997): 145–54. https://doi. org/10.1016/S0167-8809(96)01100-0.
Scott, Bernard. “Second-order Cybernetics: An Historical Introduction.” Kybernetes 33, no. 9/10 (October 1, 2004): 1365–78. https://doi.org/10.1108/03684920410556007.
Shepherd, Marshall. “Carbon, Climate Change, and Controversy.” Animal Frontiers 1 (July 1, 2011): 5–13. https://doi.org/10.2527/af.2011-0001.
Spyropoulos, Theodore. “Constructing Participatory Environments: A Behavioural Model for Design.” Thesis (Doctoral), UCL (University College London), 2017. https://discovery.ucl.ac.uk/id/eprint/1574512.
“The Sun’s Impact on the Earth,” December 4, 2019. https://public.wmo.int/en/sun%E2%80%99s-impact-earth.
Till, Caroline, and Kate Franklin. Exhibition “Our Time on Earth” Barbican International Enterprises; Co-Produced by Musée de La Civilisation, Québec City, Canada. n.d.
“Tiny Algae and the Political Theater of Planting One Trillion Trees.” Accessed July 20, 2022. https://parametric.press/issue-02/algae/.
“Toyo Ito Interviewed by Julian Rose.” Accessed May 11, 2022. https://www.artforum.com/print/201307/ toyo-ito-interviewed-by-julian-rose-42634.
Turton, Polly. “Urban Heat Risk Mapping and Visualisation in London,” n.d., 23.
Ulgiati, Sergio, and Amalia Zucaro. “Challenges in Urban Metabolism: Sustainability and Well-Being in
BIBLIOGRAPHY
Cities.” Frontiers in Sustainable Cities 1 (May 16, 2019): 1. https://doi.org/10.3389/frsc.2019.00001.
US EPA, OAR. “Basic Information about NO2.” Overviews and Factsheets, July 6, 2016. https://www.epa. gov/no2-pollution/basic-information-about-no2.
Vizzuality. “Greater London, England, United Kingdom Deforestation Rates & Statistics | GFW.” Accessed September 16, 2022. https://www.globalforestwatch.org/dashboards/country/GBR/1/36.
Wark Barry. “Bioplastic Tectonic,” 2021. https://www.barrywark.com/bioplastic.
Xie, Yufan. “Differential Growth Research.” U-V-N (blog), August 23, 2017. http://uvnlab.com/differential-growth-research-en/.
Yatim, Nurulshyha Md, and Nur Izzatul Afifah Azman. “Moss as Bio-Indicator for Air Quality Monitoring at Different Air Quality Environment.” International Journal of Engineering and Advanced Technology 10, no. 5 (June 30, 2021): 43–47. https://doi.org/10.35940/ijeat.E2579.0610521.
Zambrano, Luis. “The Consequences of Landscape Fragmentation on Socio-Ecological Patterns in a Rapidly Developing Urban Area: A Case Study of the National Autonomous University of Mexico.” Frontiers in Environmental Science 7 (2019): 13.
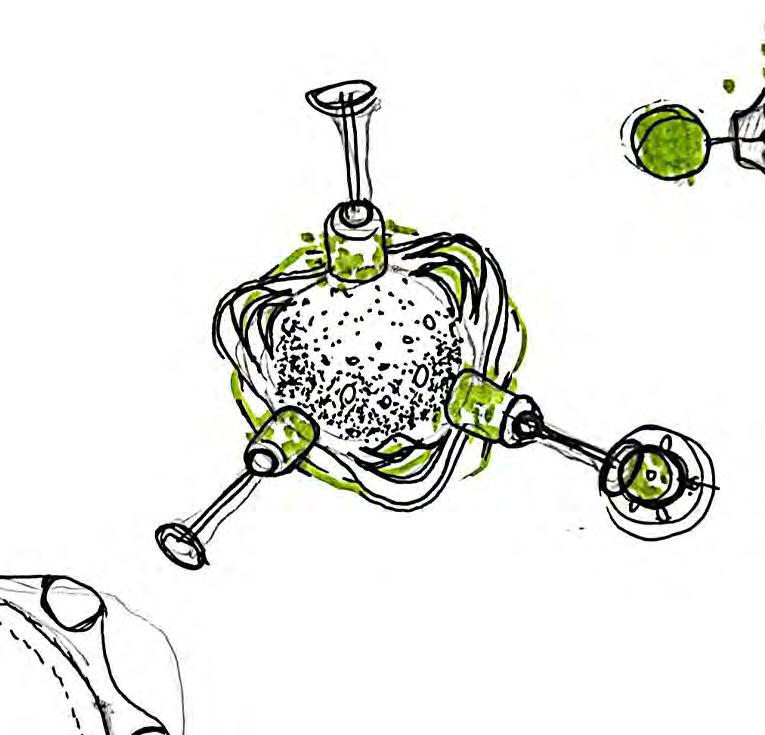
APENDIX
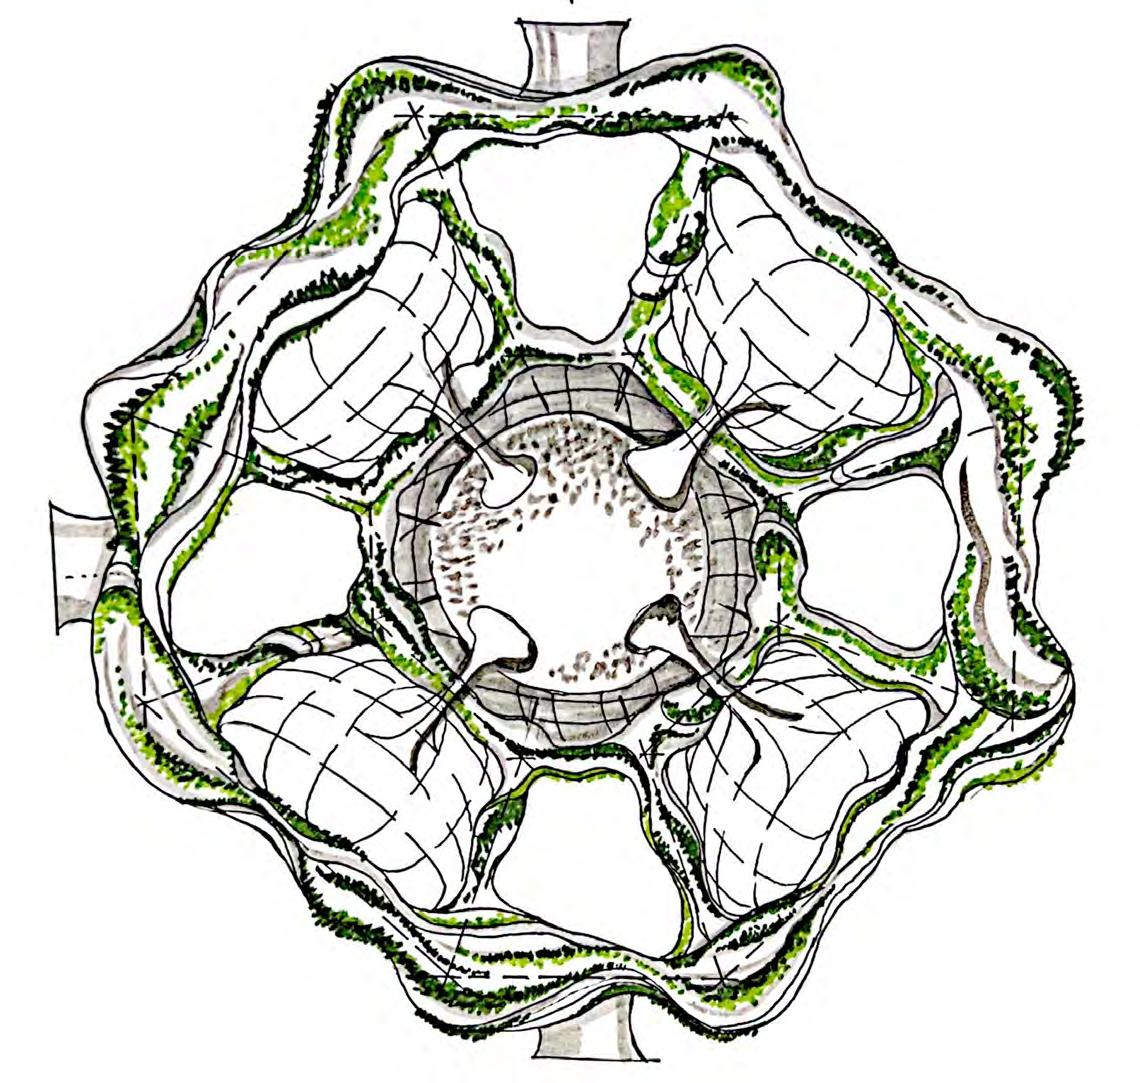
Fig. 196. Preliminary sketches of the BIO-BOT morphology
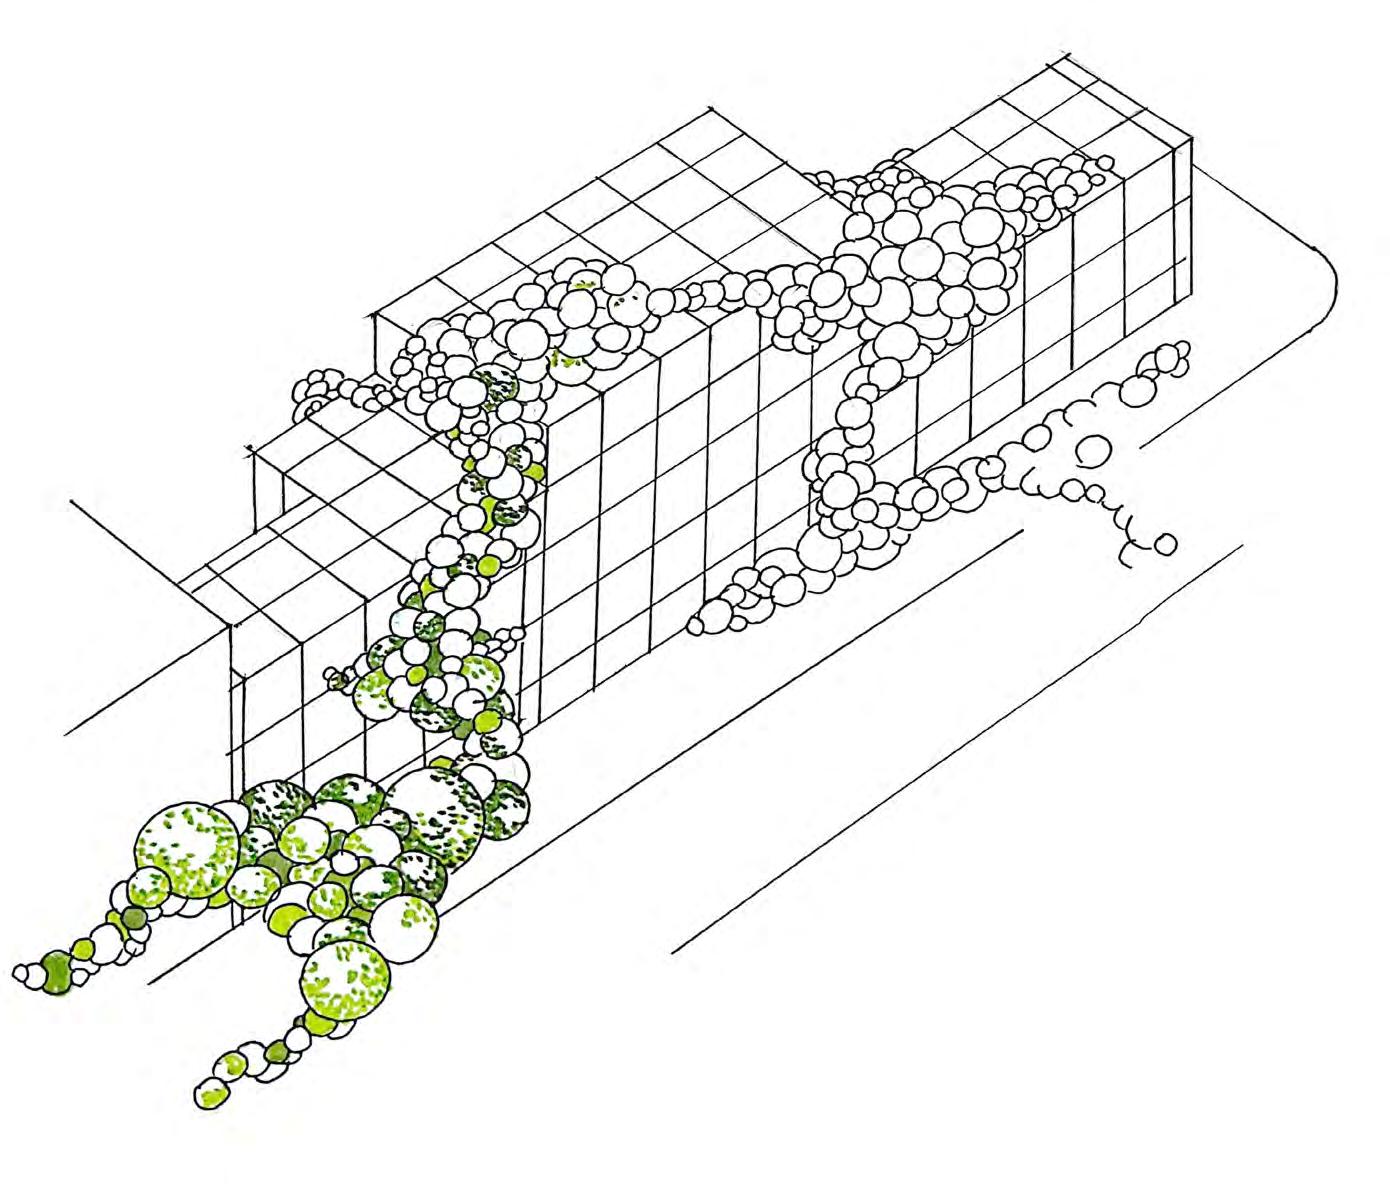
Fig. 197. Preliminary sketches of the network
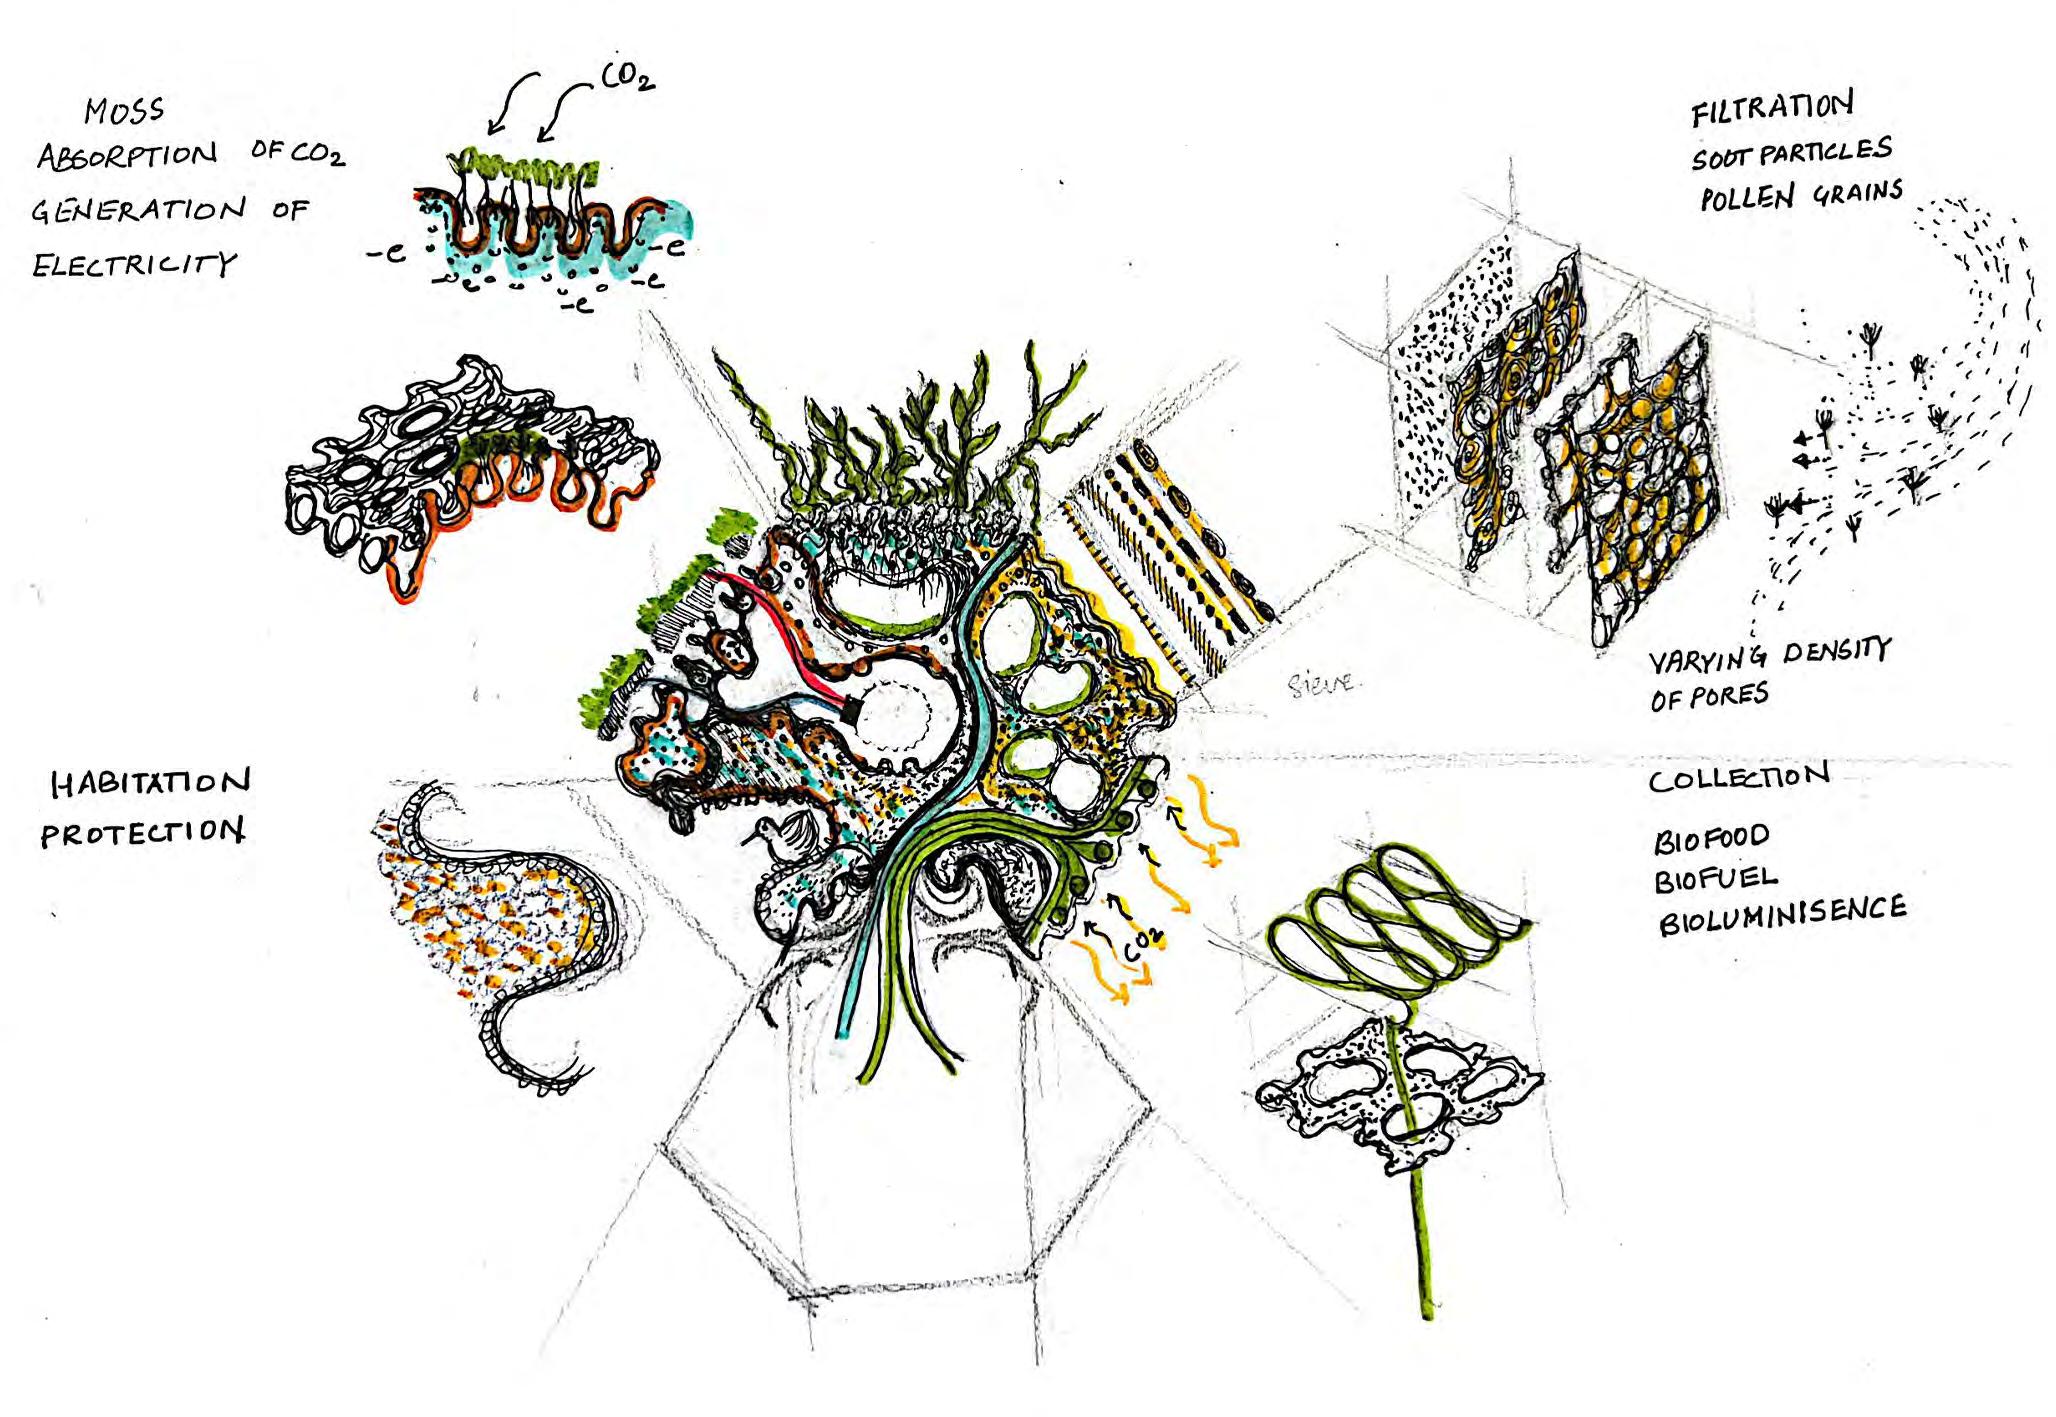
Fig. 198. Preliminary sketches of the BIO-BOT morphology
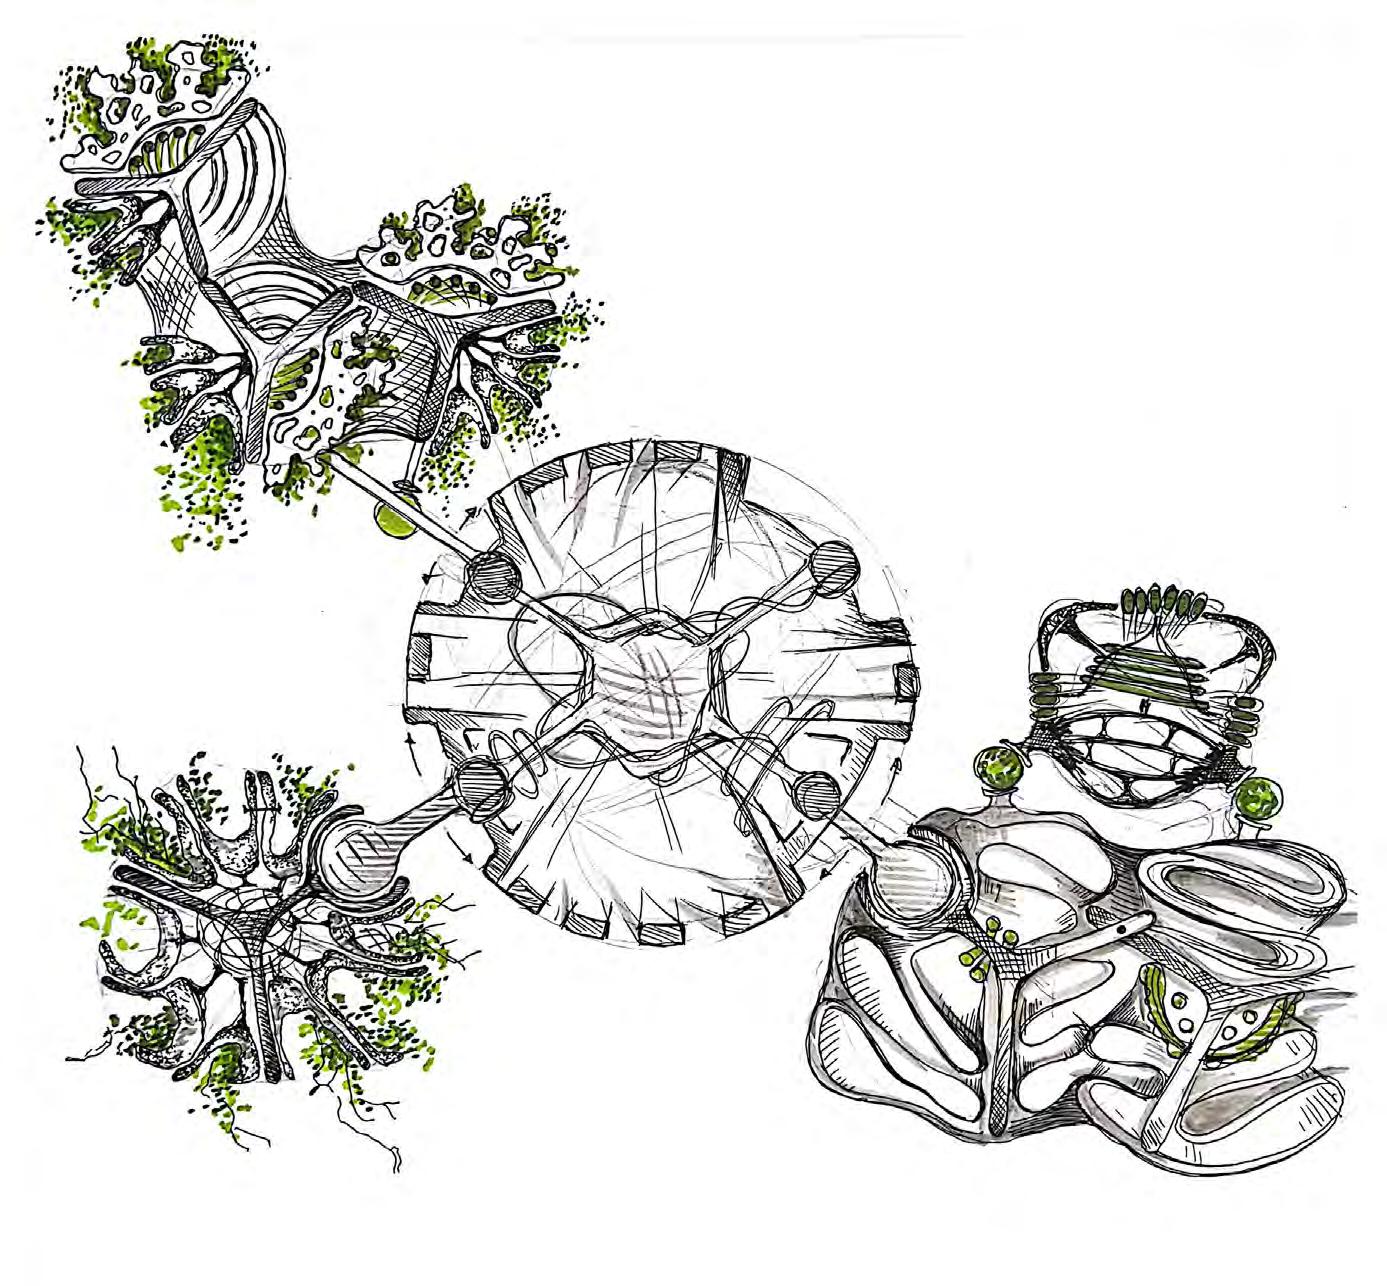
Fig. 199. Preliminary sketches of the BIO-BOT morphology
C# CODE OF THE NETWORK AGGREGATION

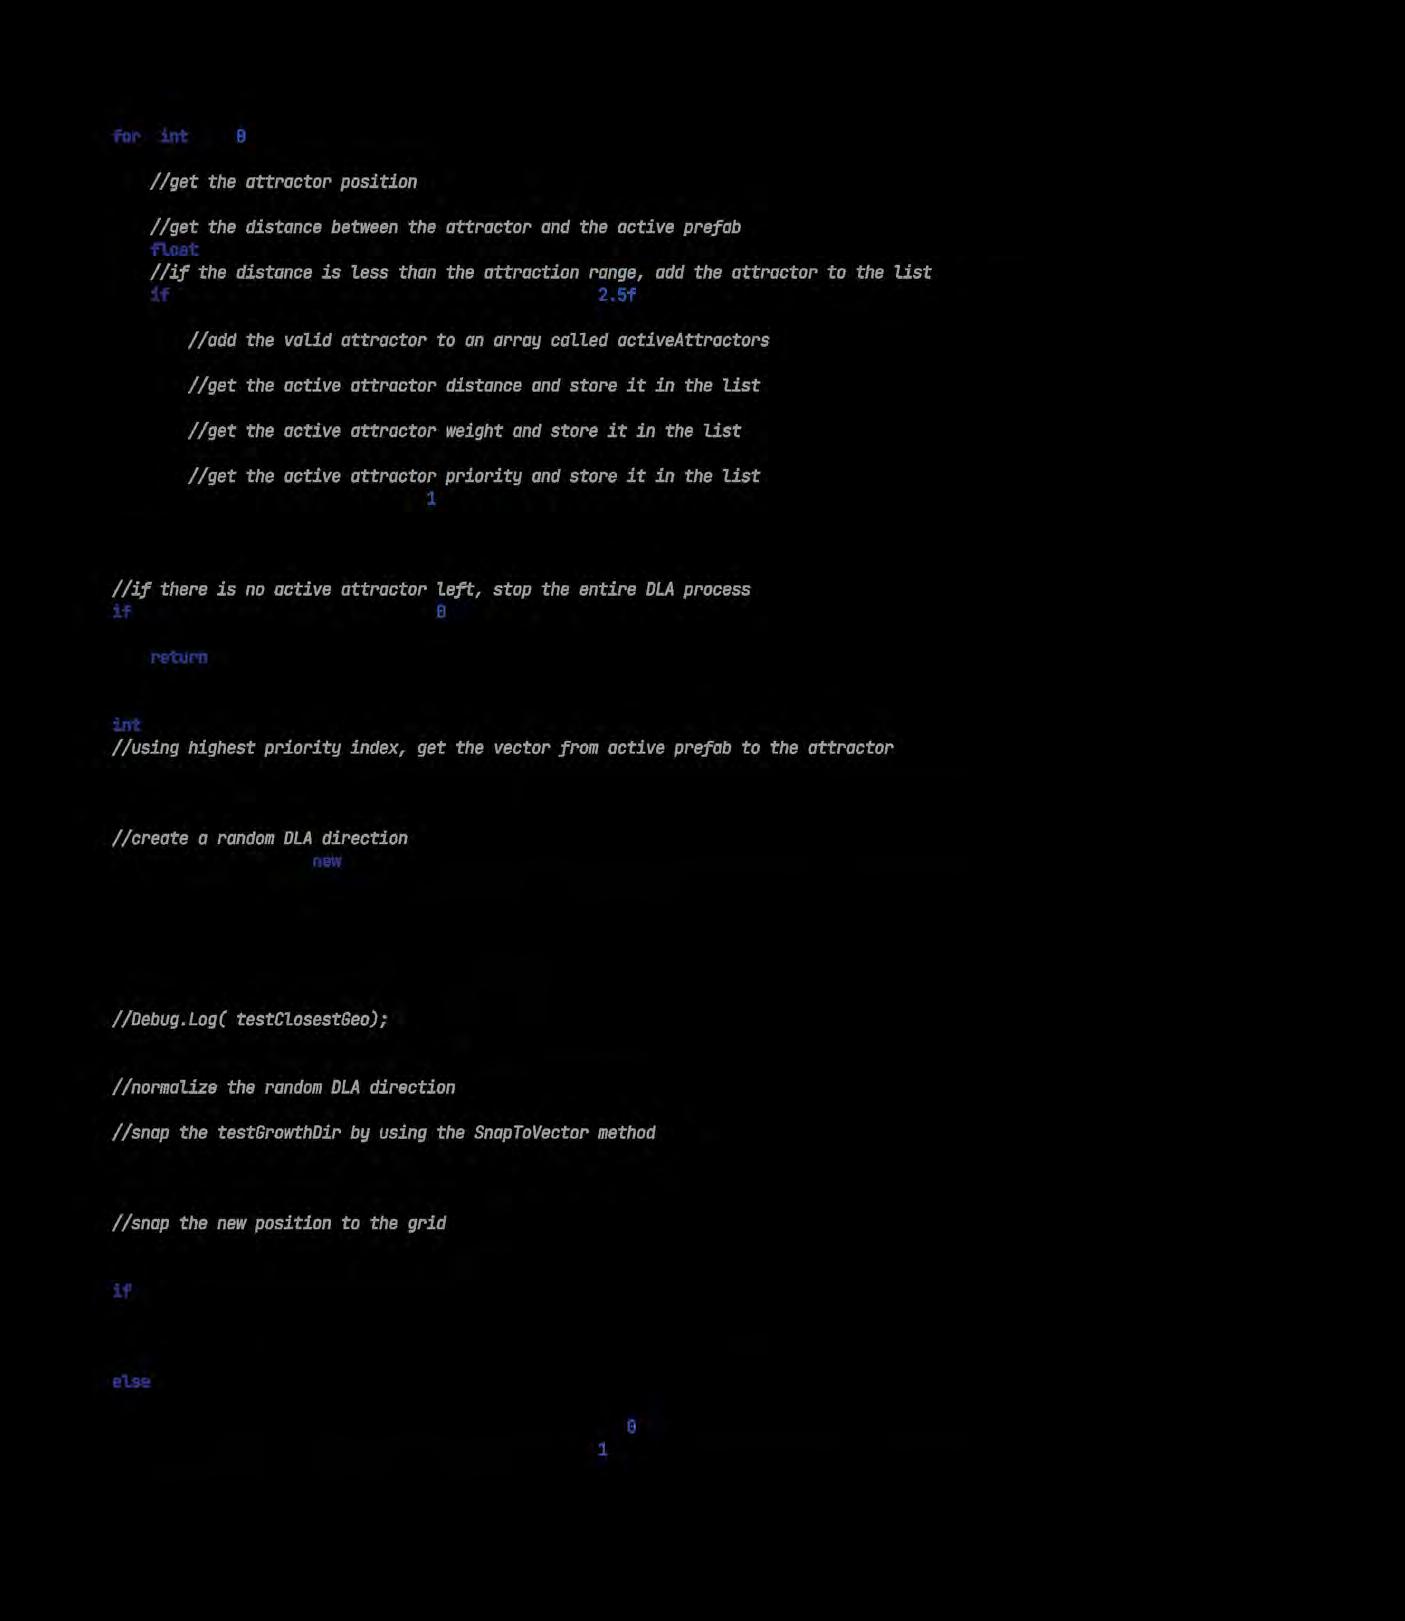
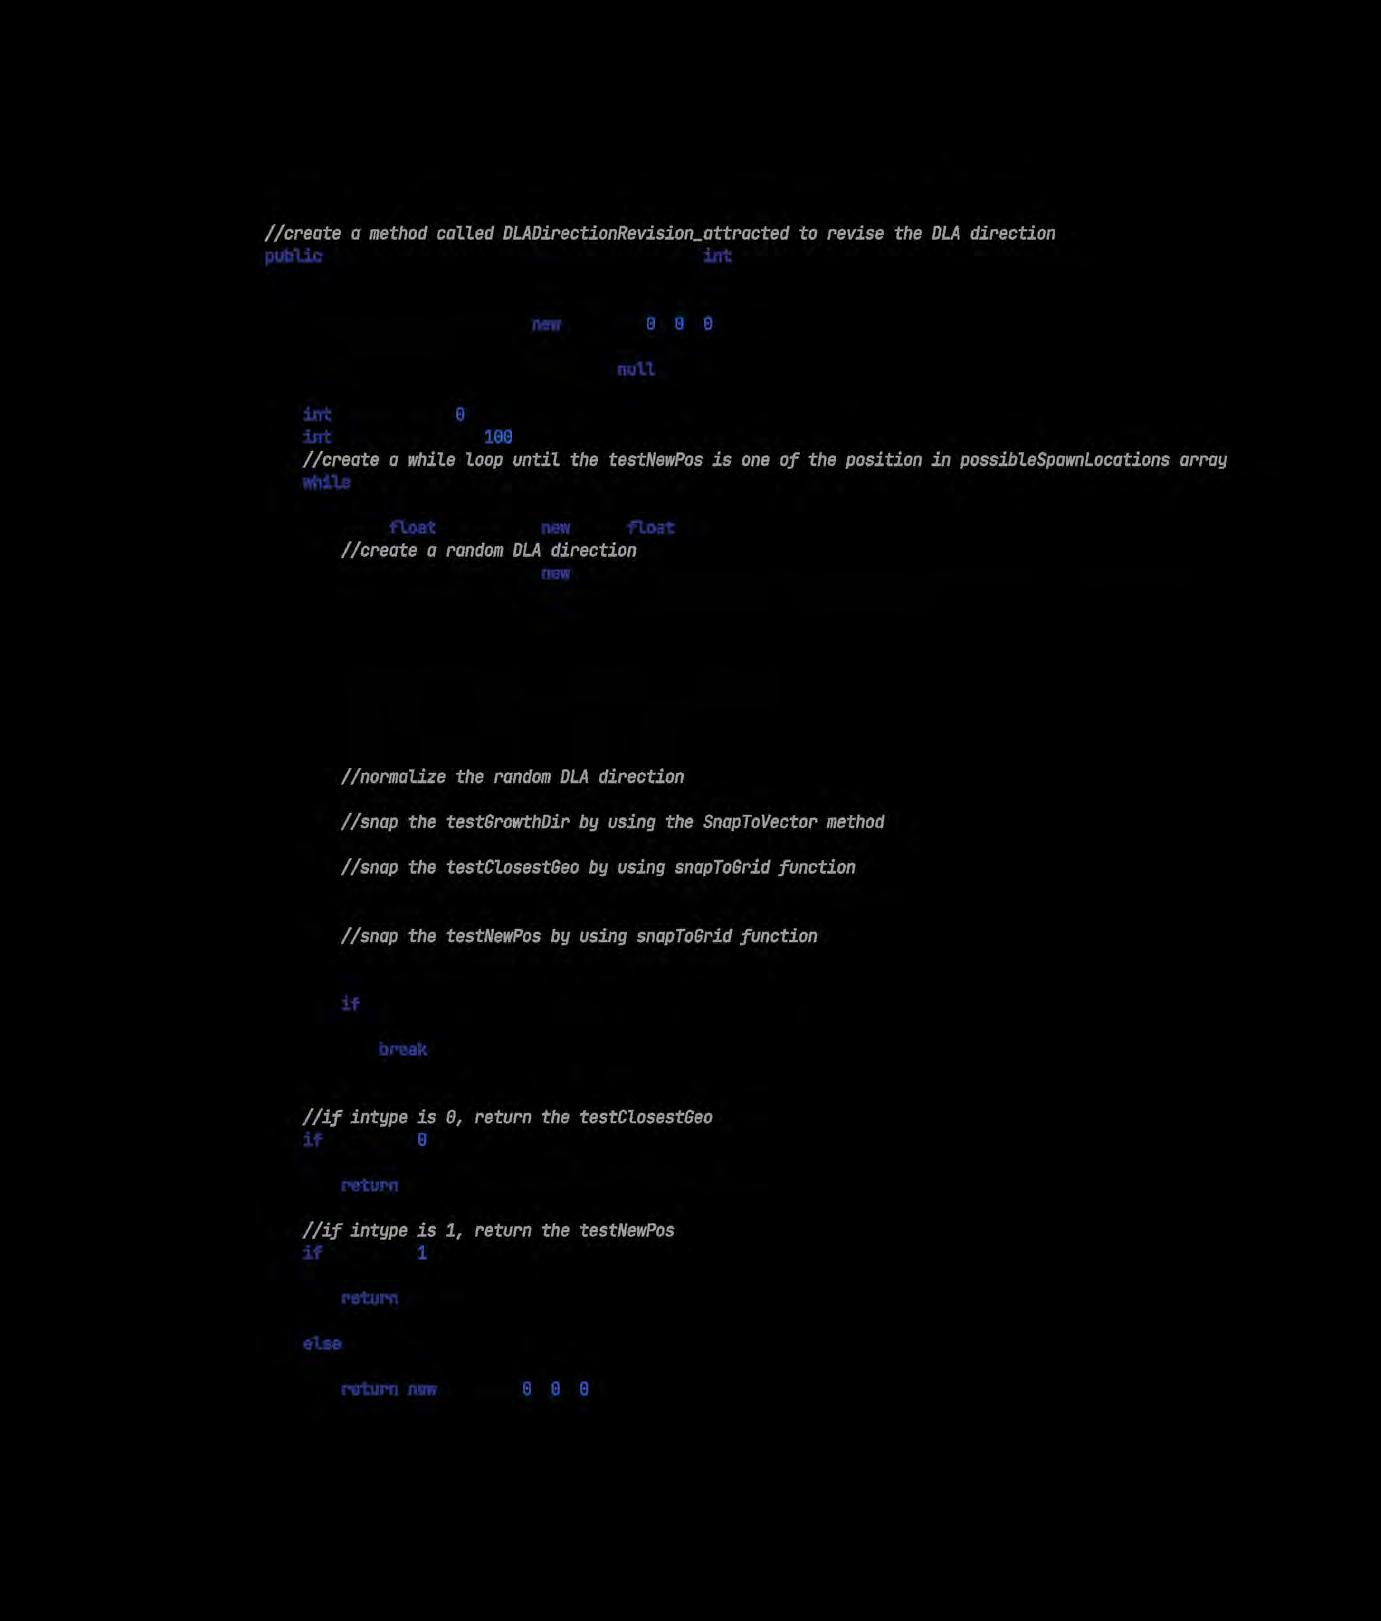


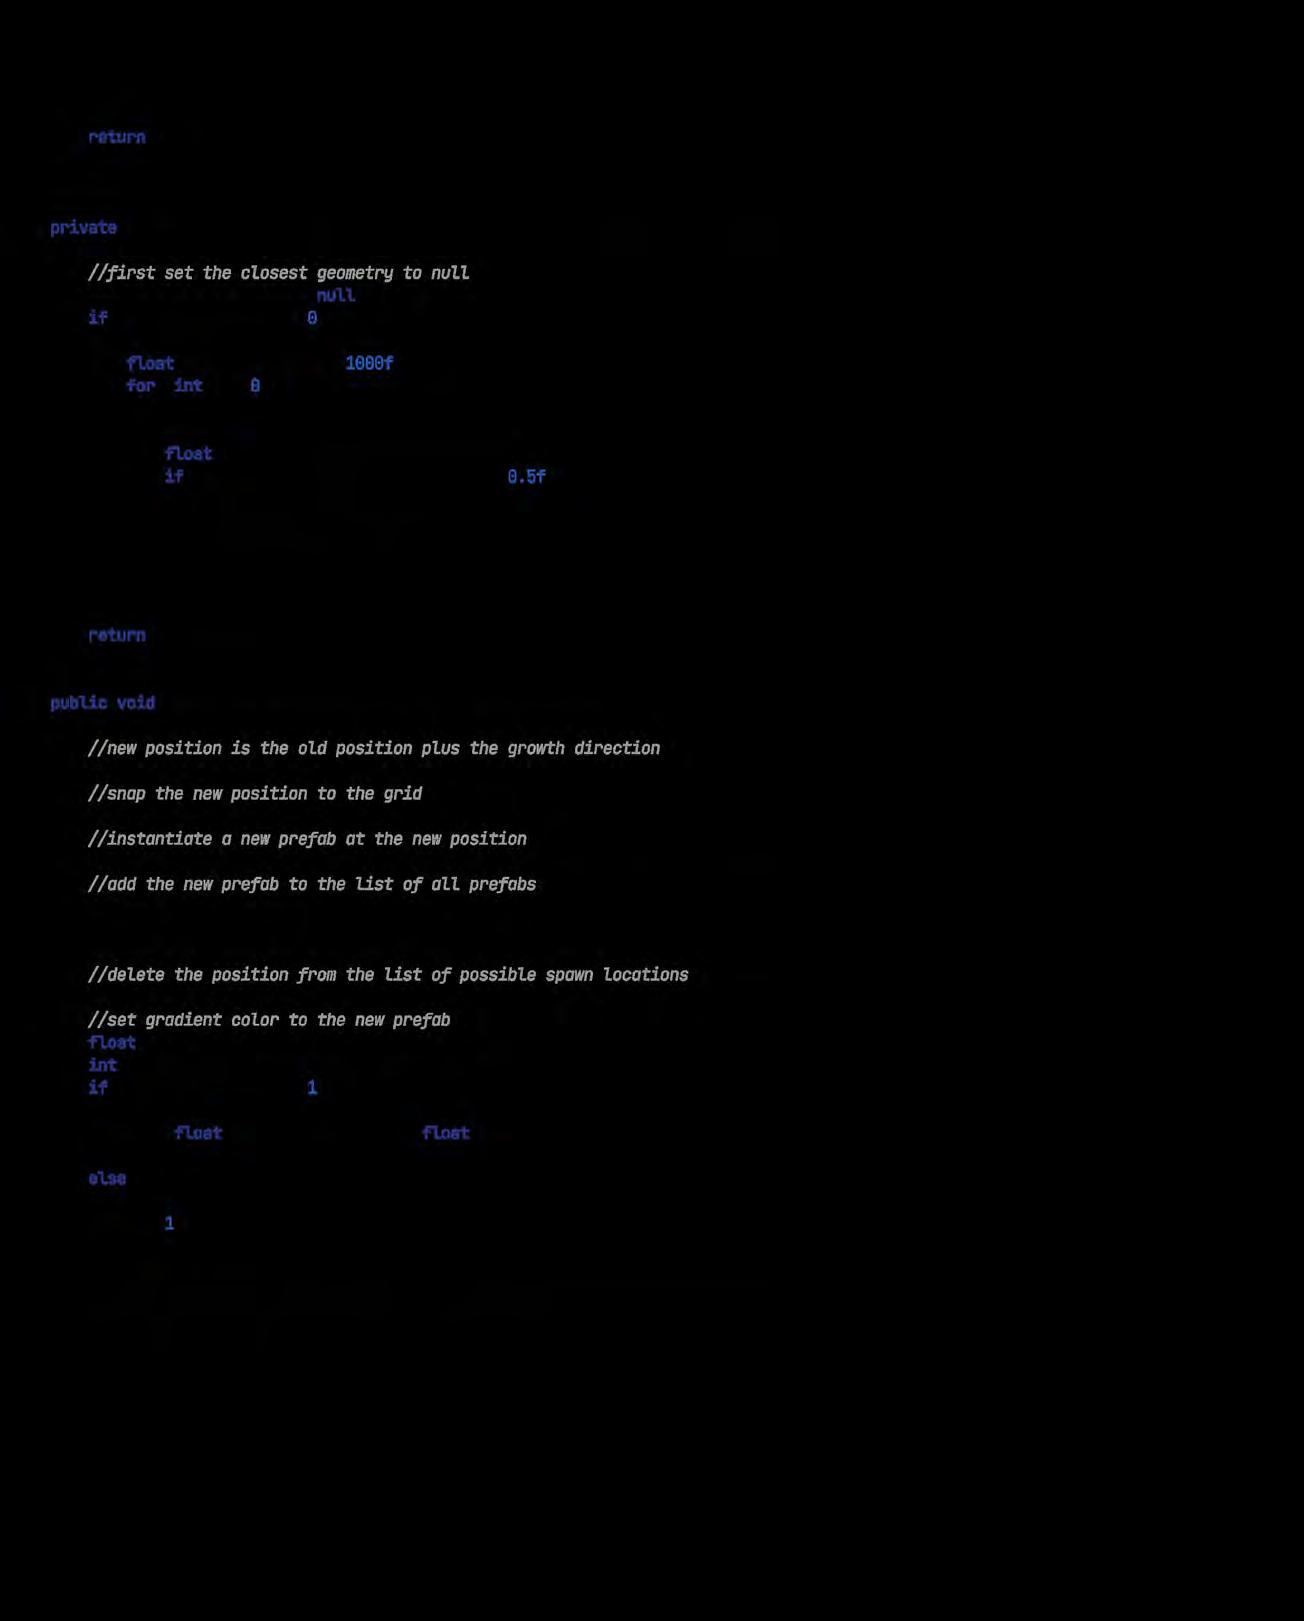
At the start of the application process for this postgraduate programme, The calculated atmospheric co2 count was 415 ppm. It is currently at 420 ppm, the highest recorded historical level, yet.120