Dublin unemployment rate fell rapidly in Q2 2015 as job creation accelerated.
Residential rents for Dublin Houses and apartments increased for a 9th consecutive quarter as supply shortages continued to affect the market.
Dublin house completions remained weak with just over 1,500 completions in the first half of 2015.
Passenger arrivals at Dublin Airport recorded strong growth in the first half of 2015 with over 6 million arrivals over the period (seasonally adjusted).
New cars licensed in Dublin for August 2015 are one fifth higher than for the same period in 2014.
Dublin’s population expanded by 2.4% (+ 27,300) in the year to April 2015 with over 1.3 million people now residing in the Dublin Region.
The Dublin MARKIT PMI
Dublin PMI data showed continued strong growth across the board in Q3 2015, with improved business confidence and greater workloads boosting employment.
Dublin KBC/ESRI
Consumer sentiment in Dublin weakened in Q3 2015 as consumers expressed caution around big-ticket purchases and the jobs market.
welcome to the q3 2015 issue of the dublin economic monitor
TheDublin Economic Monitor is a joint initiative on behalf of the four Dublin Local Authorities, co-ordinated by the City Council. The commissioning of the Monitor represents the further manifestation of the enhanced role of Local Authorities in the area of economic development and enterprise support, in line with the local government reform programme.
The Dublin City Region (4 Dublin local authorities combined) plays an increasingly important role in the economy of Ireland and it is important that its performance is properly tracked.
We believe that the Monitor will be of particular interest to all those living and doing business in Dublin or considering locating here.
We are delighted to work with DKM Economic Consultants who have been engaged to produce the Monitor, with KBC/ESRI to develop Dublin consumer sentiment data and with MARKIT to develop a Dublin Purchasing Managers’ Index (PMI). You can now sign up to our quarterly mailing list to ensure that you are notified of future releases of the monitor: http://j.mp/ DublinEconomicMonitor We hope you find the Monitor useful and welcome any feedback to info@leo. dublincity.ie. The next release will be published online on Thursday 28th January 2016.Interactive charts from the monitor are available on the Dublin dashboard www.dublindashboard.ie
Dublin City Council South Dublin County Council Fingal County Council Dún Laoghaire Rathdown County Council
Cover Image: Peter Kavanagh Photography
GLOBAL ECONOMY
Weaker global growth in the first half of 2015, and ongoing economic uncertainties have caused the IMF to lower its 2015 global growth forecast to 3.1%, from 3.3% in July and 3.5% in April. Advanced economies are forecast to drive global growth, due to low interest rates, falling energy prices and an easing of fiscal austerity in the Eurozone. However, low energy prices have hit the economies of energy exporters, notably Canada and Brazil. China meanwhile continues to experience stock market unrest, and its growth slowdown is impacting on regional economies including Australia. Global growth is expected to pick up in 2016 to 3.6%.
NATIONAL ECONOMY ECONOMY
The economic recovery in Ireland is going from strength to strength, reflected primarily in robust Exchequer returns and falling unemployment, with the results that growth forecasts are being revised upwards at every turn. The latest DKM Consensus forecast now points to growth of in excess of 5% this year (see table), with all elements of demand contributing to growth, in particular investment and private consumption.
As a result of the strong recent growth, Irish GDP and GNP have now recaptured all the ground lost in the crash (see chart), which is not to dismiss the lost output and excess unemployment suffered during the intervening years.
The US economy continues to perform strongly, and is now moreor-less at full employment. This points to a change in monetary policy with the expectation that interest rates will rise in the near future to head off inflationary pressures. However, fears regarding the impacts internationally and in emerging markets particularly – given the already strong dollar and the amount of global debt denominated in dollars - are leading to caution in this regard.
There are some parallels with the UK economy, which is also at or near full employment, and where the expectation is that interest rates will be raised in the near future. However, fiscal consolidation, already underway and expected to continue into 2016 and 2017 at least, along with the strength of Sterling, will likewise lead to caution with regard to interest rates.
Modest recovery is now being forecast for the Eurozone, as accommodative monetary policy and some easing of austerity are having a positive effect, and the recent instability recedes.
On balance, the external environment for Ireland remains positive, with a weak Euro and falling energy prices in particular benefiting the economy (see chart).
Further strong growth of 4% is expected next year, assisted by an expansionary boost from the Budget. Ireland has thus returned to its position as the strongest-growing economy in the EU. Unemployment meanwhile is expected to continue on its gradual but consistent downward path, reaching 9% by the end of this year and 8% by the end of 2016.
ACCOMMODATION PRESSURES AFFECTING DUBLIN ECONOMY?
Dublin continues to lead the national recovery, with a number of indicators for the capital's economy starting to approach peak levels.
Employment is growing steadily quarter by quarter. The city’s unemployment rate in Q2 was just above 8% - further improvements in the meantime are likely to have brought this below 8%. This is a positive sign as recovery in employment often lags improvements in other indicators after a major recession.
The pressure on the city’s real estate continues to intensify as the economy strengthens, new supply lags demand and the population grows strongly (see special article on page 9). City centre office rents accelerated (+7%) in Q3, even as those in the South Suburbs appear to have stabilised somewhat.
Dublin residential rents likewise continue their relentless progress back towards the peak, and house prices also appear to be growing again as housing completions in the Dublin region remain weak. Pressure is increasing to introduce some form of rent controls in the city, but international experience would urge caution with regard to such a policy prescription.
Public transport demand continues to grow strongly, with the number of trips up by 600,000 in the latest quarter (seasonally adjusted). The number of cars licenced in the city per month is likewise up strongly on a seasonally adjusted basis.
Dublin Airport continues to experience strong growth in volumes, with the latest observation breaking the previous record.
The recently published Infrastructure & Capital Investment Plan 2016 - 2021 features major infrastructure projects for Dublin, including a metro link from the city centre to the airport and Swords, to be operational by 2026/2027. As these are long term projects they will not have an impact on capacity for several years into the future. Likewise the plan includes support for the Social Housing Strategy 2020, but how much of this will impact Dublin and how much will involve actual new stock are unclear.
Dublin consumer sentiment captures some of the concerns regarding the economy. Austin Hughes, chief economist at KBC
Bank Ireland, comments on the latest survey:
“It seems that consumers in the capital are taking a cautious view of what is still an uncertain world. It is important to note the survey suggests that, on balance, Dublin consumers remain positive about the outlook for the economy, jobs and household incomes. Lately, however, worries about the global economy, the high profile closures of Clery’s and Boyer’s and pressure on living costs in areas such as rents and insurance may have made them more concerned about the uneven nature of the upturn.”
The performance of Dublin Business likewise is reflecting recent developments, as articulated in the latest Dublin PMI index. Commenting on this, Andrew Harker, senior economist at Markit stated:
“Dublin PMI data for the third quarter of 2015 signalled that the local economy continued to benefit from improving economic conditions. Although rates of growth in output and new business eased, the latest expansions were still substantial and therefore no cause for concern. Moreover, the labour market continued to strengthen as firms took on extra staff at an accelerated pace on the back of rising workloads and confidence regarding the near-term outlook. The Dublin private sector looks to be moving in line with the Irish economy as a whole at present, with the rest of Ireland also recording strong expansions in Q3.”
More detailed discussion of the Consumer Sentiment and PMI indices are contained on pages 11 and 12 of this issue of the Monitor.
DUBLIN ECONOMIC INDICATORS
dublin job creation drives lower unemployment
Dublin’s unemployment rate improved markedly in Q2 2015, dropping by 0.8 percentage points (pp) QoQ. The Capital’s unemployment rate was almost 5pp lower than its peak of 13% in Q3 2011, and was 1.5pp below the Q2 2015 national unemployment rate of 9.6%. Job creation has been a significant factor in this improvement, as 7,600 more people were employed in Dublin in Q2 2015 compared to the previous quarter. Strong growth forecasts for this year and next are expected to drive further recoveries in the Dublin and national labour markets.
construction sector expansion boosts employment
Employment growth in Dublin continued apace in Q2 2015. The strongest increase occurred in construction where employment rose by 22.6% YoY. This was supported by YoY expansions of 6.6% and 3.6% in the industrial and private sectors respectively. Public sector employment fell by 3.7% YoY, but the aggregate employment figure for Dublin rose by 2.5% YoY to reach 585,900 in the quarter.
Dublin National
dublin & national unemployment rate % (sa)
source:
DUBLIN ECONOMIC INDICATORS
services employment rises despite public sector decline
q2 ' 15
private sector services employment '000s 364.4 year on year change '000s +12.6 public sector services employment '000s 150.1 year on year change '000s -5.8 source: cso qnhs.
Robust annual growth of 6.5% and 3% in the respective sectors of Financial/ Insurance and Retail sectors respectively drove a seasonally adjusted YoY increase of 1.1% in the services sector employment of Dublin residents in Q2 2015. This expansion was in spite of employment declines in the public sector service areas of Education (-6.5%) and Health/Social Work (-3.5%) over the year. Retail maintained its position as the largest source of employment in the Capital, with almost 79,000 individuals working in the sector in the quarter.
property price growth persists, but at a slowing rate
source: cso. mortgage-financed transactions only.
The Residential Property Price Index for Dublin rose by a yearly rate of 8.2% in August 2015 to reach 85.8 (2005 = 100). This returned the Index to 2009 levels, but is a slower rate of YoY expansion than recorded in any of the past 24 months. Residential property prices outside of the Capital recorded a stronger YoY growth rate of 10.8% in August 2015, as the recovery in the rest of the country belatedly strengthens.
dublin rent increases outstrip the national average
source: prtb.
Rents for Dublin houses and apartments recorded a 9th consecutive quarter of growth in Q2 2015 as the market continued to struggle with a shortage of supply which has put upward pressure on rents. House and apartment rents stood at respective averages of €1,387 and €1,260 in the quarter, far in excess of the rest of Ireland averages of €695 and €660. Overall, Dublin rents are only 3.5% below the peak of €1,307 which occurred in Q4 2007.
source: prtb.
rents € per month
dublin house completions remain weak
jun ' 15
total house completions (sa) 214 year on year change -74
source: declg. seasonally adjusted by dkm.
Housing completions in Dublin fell for a third consecutive month in June 2015 as supply to the market remained very weak. Completions totalled 214 in seasonally adjusted terms in June, 25.7% below the same month in 2014. In the first six months of the year, 1,547 houses were completed in the Capital. This was on a par with the first half of 2014. Supply to the market is urgently needed as Dublin’s growing population (see page 9) has placed added pressure on the existing stock.
supply shortages continue to affect office rents
source: cbre.
Office rents in the City Centre experienced strong growth in Q3 2015 as prime office space around the Capital’s core remains in short supply. The rent index for the City Centre grew by 7% QoQ and was 19% higher when compared to Q3 2014. Despite strong growth in the South Suburbs in Q2 2015, office rents in the area remained stable in Q3 2015. Although flat in the quarter, rents were still 40.9% ahead of the same period in 2014.
dublin office vacancy rates at record lows
Overall office vacancy rates in Dublin declined by 2.8 percentage points YoY to reach 9.3% in Q3 2015, the lowest level since the series began in Q1 2006. High demand and weak supply in the prime office locations closest to Dublin City Centre have driven vacancy rates down in these areas, to just over 5%. Vacancy rates were highest in the Dublin Suburbs at 12.4% in Q3 2015 yet this is a record low for the Suburbs and signifies that demand is spreading out from the prime locations. q3 ' 15
dublin house completions (sa)
Max: 1,925
source: declg. seasonally adjusted by dkm.
source: cbre.
source: cbre. source: cbre.
dublin office rents index (2006 = 100)
growth in public transport trips gathers momentum
Source: NTA, seasonally adjusted by DKM.
Public transport trips reached 46.4 million in Q2 2015 (seasonally adjusted). This represents an increase of 1.2 million trips compared to Q2 2014. The data indicates that a strong recovery in public transport trips began in Q1 2013 and has gathered momentum since then.
record levels of arrivals at dublin airport
source: cso, seasonally adjusted by dkm.
Passenger arrivals at Dublin Airport continued on an upward trajectory in June 2015 with a record 1,053,075 arrivals in the month. This was a seasonally adjusted increase of 19% or 168,000 passengers YoY as improving economic conditions in Europe and the USA have supported tourism, supplemented by the attractiveness of the weakened Euro. Dublin Airport experienced exceptionally strong YoY growth in the first half of 2015, with a total of over 6 million passenger arrivals representing a 15.4% increase on the same period in 2014.
new cars licensed continue upward trend
The number of new cars licensed continued to increase following the launch of the 152 plates in July. In Dublin, new cars licensed reached 3,649 (seasonally adjusted) in August 2015 while in the Rest of Ireland the number reached 7,508 (seasonally adjusted). The increases correspond to growth of 19% and 32% respectively compared to the same period in 2014. The annual growth rate in new cars licensed in the Rest of Ireland surpassed that for Dublin for the first time since October 2014.
source: nta, seasonally adjusted by dkm.
source: cso, seasonally adjusted by dkm.
dublin airport arrivals '000s (sa)
LATEST ESTIMATES POINT TO STRONGLY GROWING POPULATION
Each year the CSO produces an Estimate of Population & Migration at regional level in Ireland. This is the most accurate estimate of Ireland’s population for the inter-censal years. The recent publication of the estimates to April 2015 gives an opportunity to examine Dublin’s population growth patterns in recent years.
During the boom years the number of people living in Ireland grew strongly, as a combination of natural increase and inward migration brought the population up to levels previously seen in the 1880s. The 2002 Census put the national population at 3.92 million; by 2011 it had reached 4.59 million, a cumulative increase of 17%.
However, the population of Dublin did not grow at the same pace as the rest of Ireland (see chart). The main reason appears to have been that significant numbers of people were ‘priced out’ of the Dublin residential market, and forced to find accommodation in the surrounding counties. The latter were both cheaper and less constrained in terms of delivering new housing supply. This consequence was a strong increase in inward commuting to the capital, which continues to this day.
1. population estimate, april 2015
On the face of it, these growth levels for Dublin are somewhat difficult to understand, given the previous pattern. A 5% rise in the population of under 15s is also unusual, given the much slower growth in the adult population. Further analysis indicates that:
• In Dublin, the strongest growth is in the 5-14 age group,
• The population of people in their 20s in both Dublin and the rest of the country fell, while
• The population of people in their 30s grew in Dublin but fell in the rest of Ireland.
This might point to internal migration of families rather than natural increase as the main driver of the growth in Dublin’s young population.
Another statistic worth bearing in mind is that Dublin’s labour force according to the Quarterly National Household Survey (QNHS) grew by only 0.5% in the year to April 2015. This might be considered comparable to the 15-64 age group, whose population grew by 1.5% in the same period.
2. age breakdown of population growth, april 2015
There is no sign that this pattern reversed during the crash – the population of the rest of Ireland continued to grow at a faster pace than did the population of Dublin. An interesting phenomenon has arisen in the last couple of years, however: while the population of the rest of Ireland stagnated, Dublin’s population has grown strongly, up 2.4% in the year to April 2015 (see Table 1).
Analysis of the age breakdown of growth reveals an even more remarkable development: the population of under 15s in Dublin grew by fully 5% in the year to April 2015, while it was almost unchanged in the rest of Ireland. Throughout Ireland, the population of over 65s also grew strongly, by over 3% (Table 2).
source: cso
It should be noted that these population statistics are estimates based largely on the QNHS, and are subject to review when the Census of Population is carried out. The next Census is due in April 2016, and the first results should be available around July of next year.
BENCHMARKS CAPTURE DUBLIN’S RESURGENCE
Internationally published benchmarks are a useful means of measuring a city’s performance relative to its peers, and recent indicators for Dublin have been capturing the city’s resurgence across a number of dimensions (see table below).
Dublin features strongly in the benchmarks focussed on FDI, reflecting a combination of economic recovery and growing investor confidence, and the underlying strength and competitiveness of Dublin’s economy.
Noteworthy is Dublin’s 3rd place in the FDI Intelligence European Cities & Regions of the Future index, while Ireland as a whole continues to lead the world in attracting highvalue foreign direct investment (FDI) projects. This is the fourth year that Ireland has been named as the top-ranking destination by quality and value of investments according to IBM’s 2015 Global Locations Trends report. Dublin rose to 7th place in the Europe’s
Biggest Startup Cities index. Likewise the 7th place in Savills Tech Cities ranking is also impressive. On the downside, the loss of the Web Summit from 2016 is undoubtedly a blow, but the likelihood of the Summit moving at some point was well-flagged, given the business model of its promoters.
The strong recovery in Dublin’s property market is captured in a number of indices, notably those reflecting market momentum, such as the PWC Emerging Trends in Real Estate Europe 2015 (2nd place) and the JLL Global City Momentum Index (14th).
Dublin Tourism also features. While the MasterCard 2015 Global Destination Cities Index indicates that Dublin is the 3rd biggest feeder city into London (the Dublin-London route is one of the busiest in the world), the World Travel Awards recently named the Guinness Storehouse as the top tourist attraction in Europe. The UK’s Post Office
Travel Money Report meanwhile indicated that Dublin is the cheapest of 17 European cities for cultural tourism. There are a number of other rankings where Ireland as a whole is performing well, and this is reflective in part of Dublin’s strength.
Notably, Ireland ranked 8th in the Global Innovation Index 2015, climbing three places from 11th in 2014. This index has become a widely used metric for assessing the state of innovation in various countries.
Likewise, Ireland has recently been ranked 24th in the World Economic Forum Index of Global Competitiveness, up one place from its 2014 ranking, and the country is now ranked 17th out of 175 countries on the annual Transparency International Index, consistently improving in recent years. As Ireland’s capital city and primary economic hub, these benchmarks are particularly relevant for Dublin.
dublin's latest international rankings
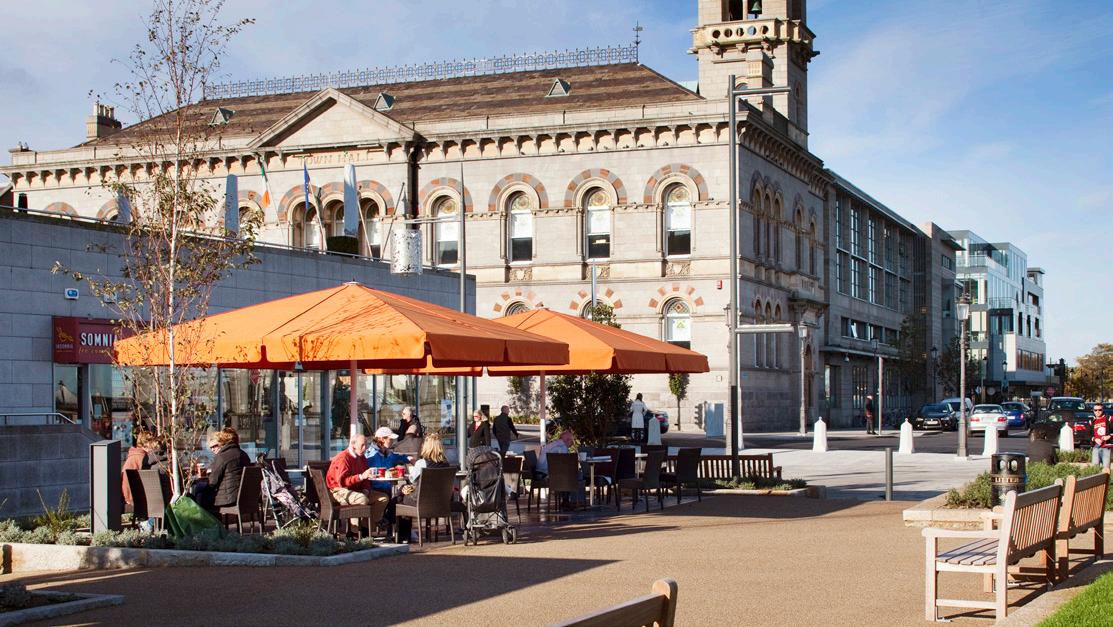
Dun laoghaire promenade
consumer sentiment index for dublin weakens slightly in q3
The Consumer Sentiment Index for Dublin weakened slightly in the third quarter of 2015 to 147.2 from 155.6 in the second quarter of the year. The weakening in Dublin sentiment was evident across most of the underlying questions. The decline in sentiment reflects a more cautious attitude by Dublin consumers. It was principally driven by a more negative assessment by consumers of the current environment for buying major household durables. In addition, consumers were more pessimistic in their views on prospects for the jobs market.
indices for dublin and rest of ireland diverge in q3
At an aggregate level the sentiment indices for Dublin and the rest of Ireland have diverged in the third quarter. This is primarily reflective of a variation in perceptions of current conditions. Outside Dublin the index of current conditions rose in quarter 3, 2015 as outside Dublin consumers had a positive view of their current household finances and the current buying climate for major household durables.
consumers adopting a more neutral view of outlook
Data for quarter 3, 2015 suggest that Dublin consumers also have a more negative perception of the future than they previously held, with the expectations index weakening by 6.5 points. This is in part due to Dublin consumers adopting a more neutral view of the outlook. Despite the decline in the overall expectations index, a third of Dublin consumers expect their household financial situation to improve over the next 12 months compared to 18 per cent that envisage a deterioration, the strongest reading in this element of the survey since the beginning of 2006.
The KBC/ESRI sentiment index is based on responses from consumers about general economic conditions and their household finances. A more detailed commentary is available at www.kbc.ie/Blog
Dublin National excl.
Dublin current conditions
Dublin expectationS
strong expansion rate in dublin business output
• The latest Dublin PMI reading pointed to another strong expansion in output during Q3 2015. This was despite the index dipping slightly to 60.4, from 61.7 in Q2. A reading above 50.0 signifies growth.
• Output also rose at a considerable pace across the rest of Ireland, with the rate of expansion slightly faster than in Dublin.
• Growth of manufacturing production in Dublin quickened marginally, while weaker rises were seen in the services and construction sectors.
new orders continue to rise sharply
• New orders continued to rise sharply in Dublin during the third quarter of the year.
• However, the rate of growth. A reading above 50.0 signifies growth eased to the slowest since Q1 2014.
• In contrast, the rest of Ireland saw a slight acceleration in the rate of expansion in new business, with the rise faster than recorded in Dublin.
increasing workloads drive employment growth
• Increasing workloads led companies in Dublin to increase their staffing levels during Q3. A reading above 50.0 signifies growth eased to the slowest since Q1 2014.
• The rate of job creation was substantial, and picked up from that seen in the previous quarter.
• The respective index for employment in Dublin was higher than that for the rest of Ireland for the fifteenth successive quarter.
about The Dublin Purchasing Managers’ Index® (PMI) series is produced by Markit Economics, an independent research company that produces highly-regarded surveys of business conditions in nations around the world www.markit.com
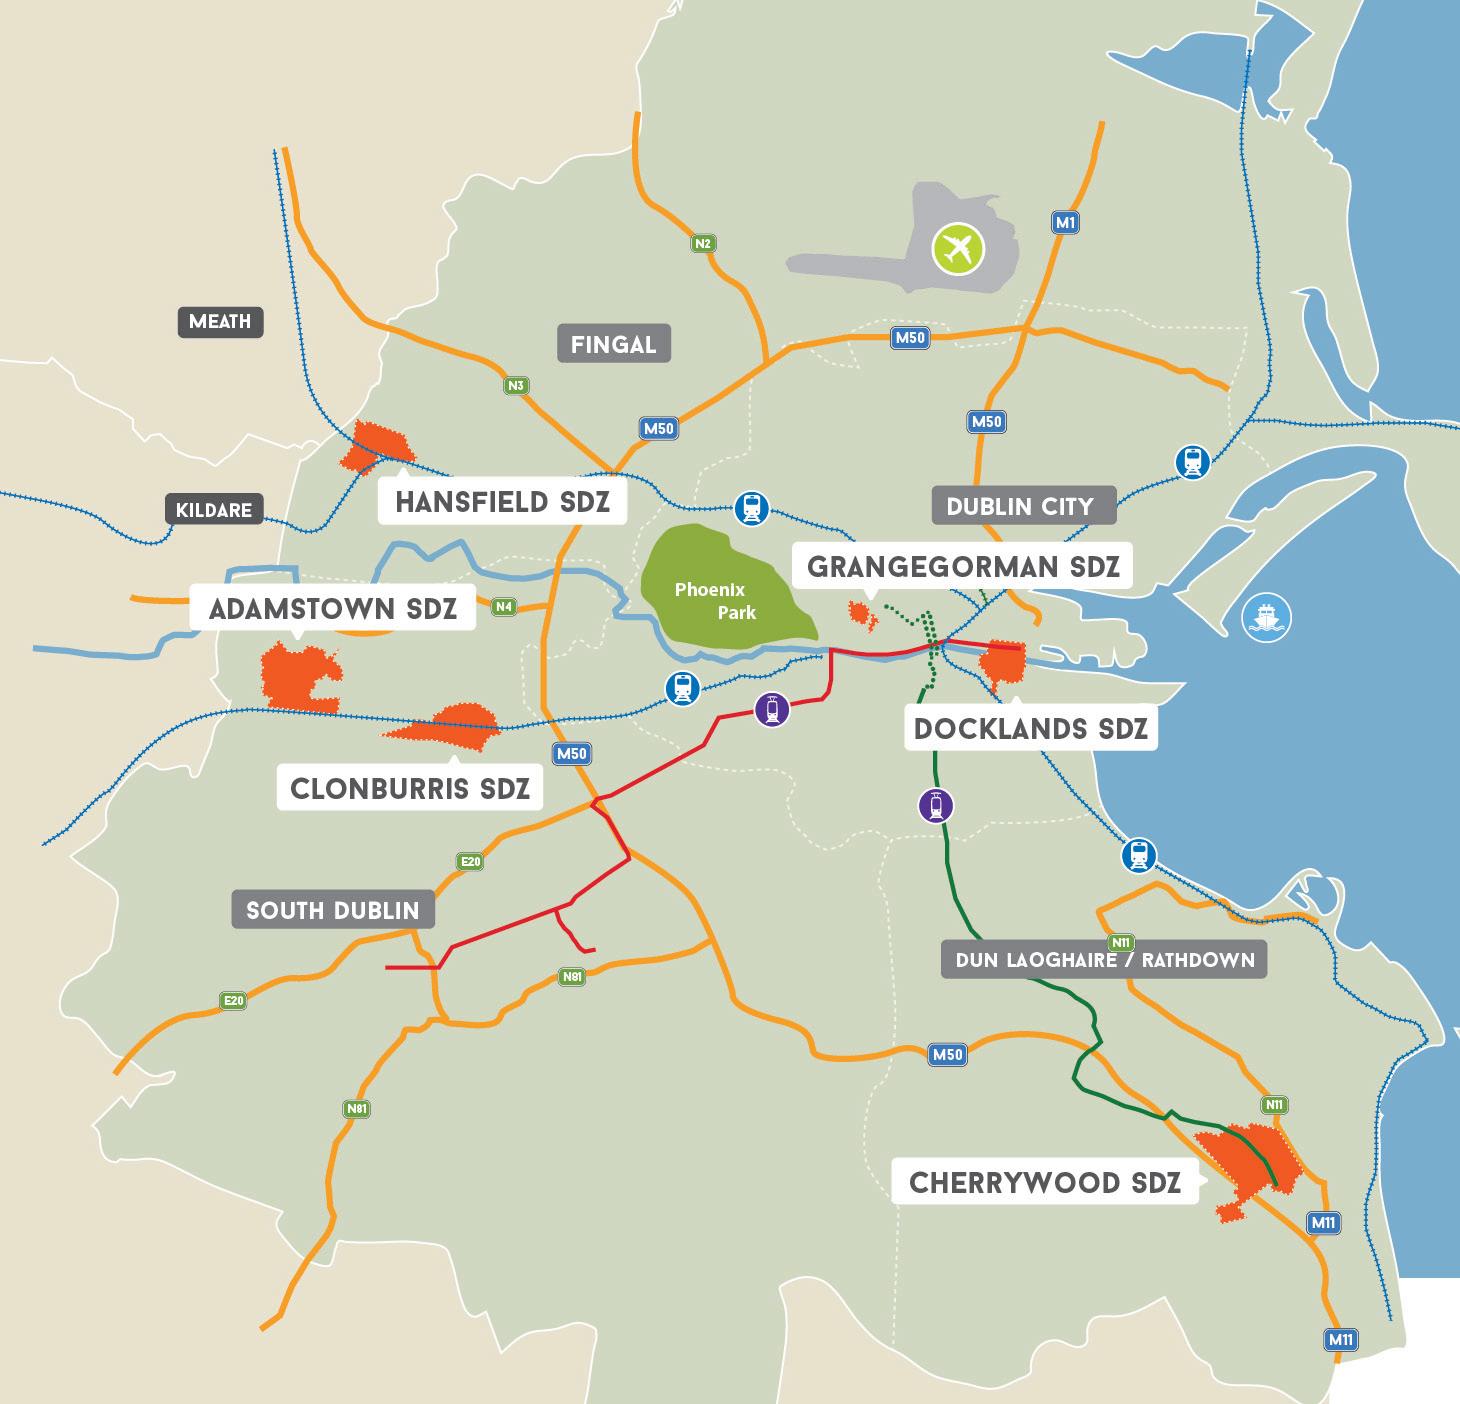
What is a Strategic Development Zone?
Strategic Development Zones (SDZs) were established in planning legislation in 2000. They enable Government to designate certain parcels of land for a fast track planning process, where the development of those lands is considered to be of strategic national importance.
A key purpose of SDZs as defined in the early 2000s was to enable the fast track delivery of new residential and non-residential development in locations of strategic importance in the Greater Dublin Area. The majority of the areas designated at that time were for sites located on major public transport corridors, which were expected to accommodate attractive sustainable new housing
on a significant scale.
In Dublin there are six SDZs. The first SDZ planning scheme was adopted in 2003 in Adamstown with other strategic locations subsequently designated across Dublin.
In recent years three further planning schemes have been adopted: Grangegorman in 2012 and Cherrywood and Dublin Docklands in 2014.
Each of these is expected to play a significant role in Dublin’s economic recovery in terms of generating employment and economic activity. This special supplement provides an overview of the key issues impacting SDZs and examines progress to date.
luas red line
luas green line
Luas Cross city Dart / commuter rail
strategic development zones
A catalyst for sustainable economic development but a number of factors are slowing progress
Strategic Development Zones (SDZ) were introduced in 2000 as a response to the strong demand for residential and non-residential development that was associated with the previous buoyant phase of Ireland’s economic cycle. Six SDZ Planning Schemes across Dublin City and County have been adopted since 2003 and as such they offer developers a holistic plan-led approach and a fast-track planning procedure for development and supporting infrastructure and facilities. These areas are considered by Government to be of economic and social importance to the State.
The key facts on each SDZ are provided in the following pages. SDZs are designed with the long term delivery of infrastructure and housing in mind, but it is fair to say that progress to date has been slower than expected, largely as a result of the property crash since 2008.
In this regard it is noteworthy that three of the schemes have been adopted since 2008, although significant infrastructure and facilities have already been put in place. Among the issues that have delayed progress to date is the fact that a number of the developers who own land in these schemes experienced financial difficulties during the
crash. That said, the fact that many of the related loans and property have ended up in NAMA and have resulted in land sales and changes in landownership has been a benefit to some of the schemes. The wider issue of access to finance is still problematic, while the delivery of a broad range of infrastructure to facilitate development across the SDZs is also a challenge that is currently being progressed by all stakeholders.
These SDZs have the capacity to become major catalysts for sustainable economic activity across the Dublin Region and beyond, by accommodating significant growth in population and employment. With all located on major public transport corridors, they can provide the much sought after sustainable development which is a core principle of government policy.
“The challenge must be to ensure that as the economy recovers, these SDZs are brought to the fore in the re-emerging development market and make the substantial contribution that was originally envisaged for them.”
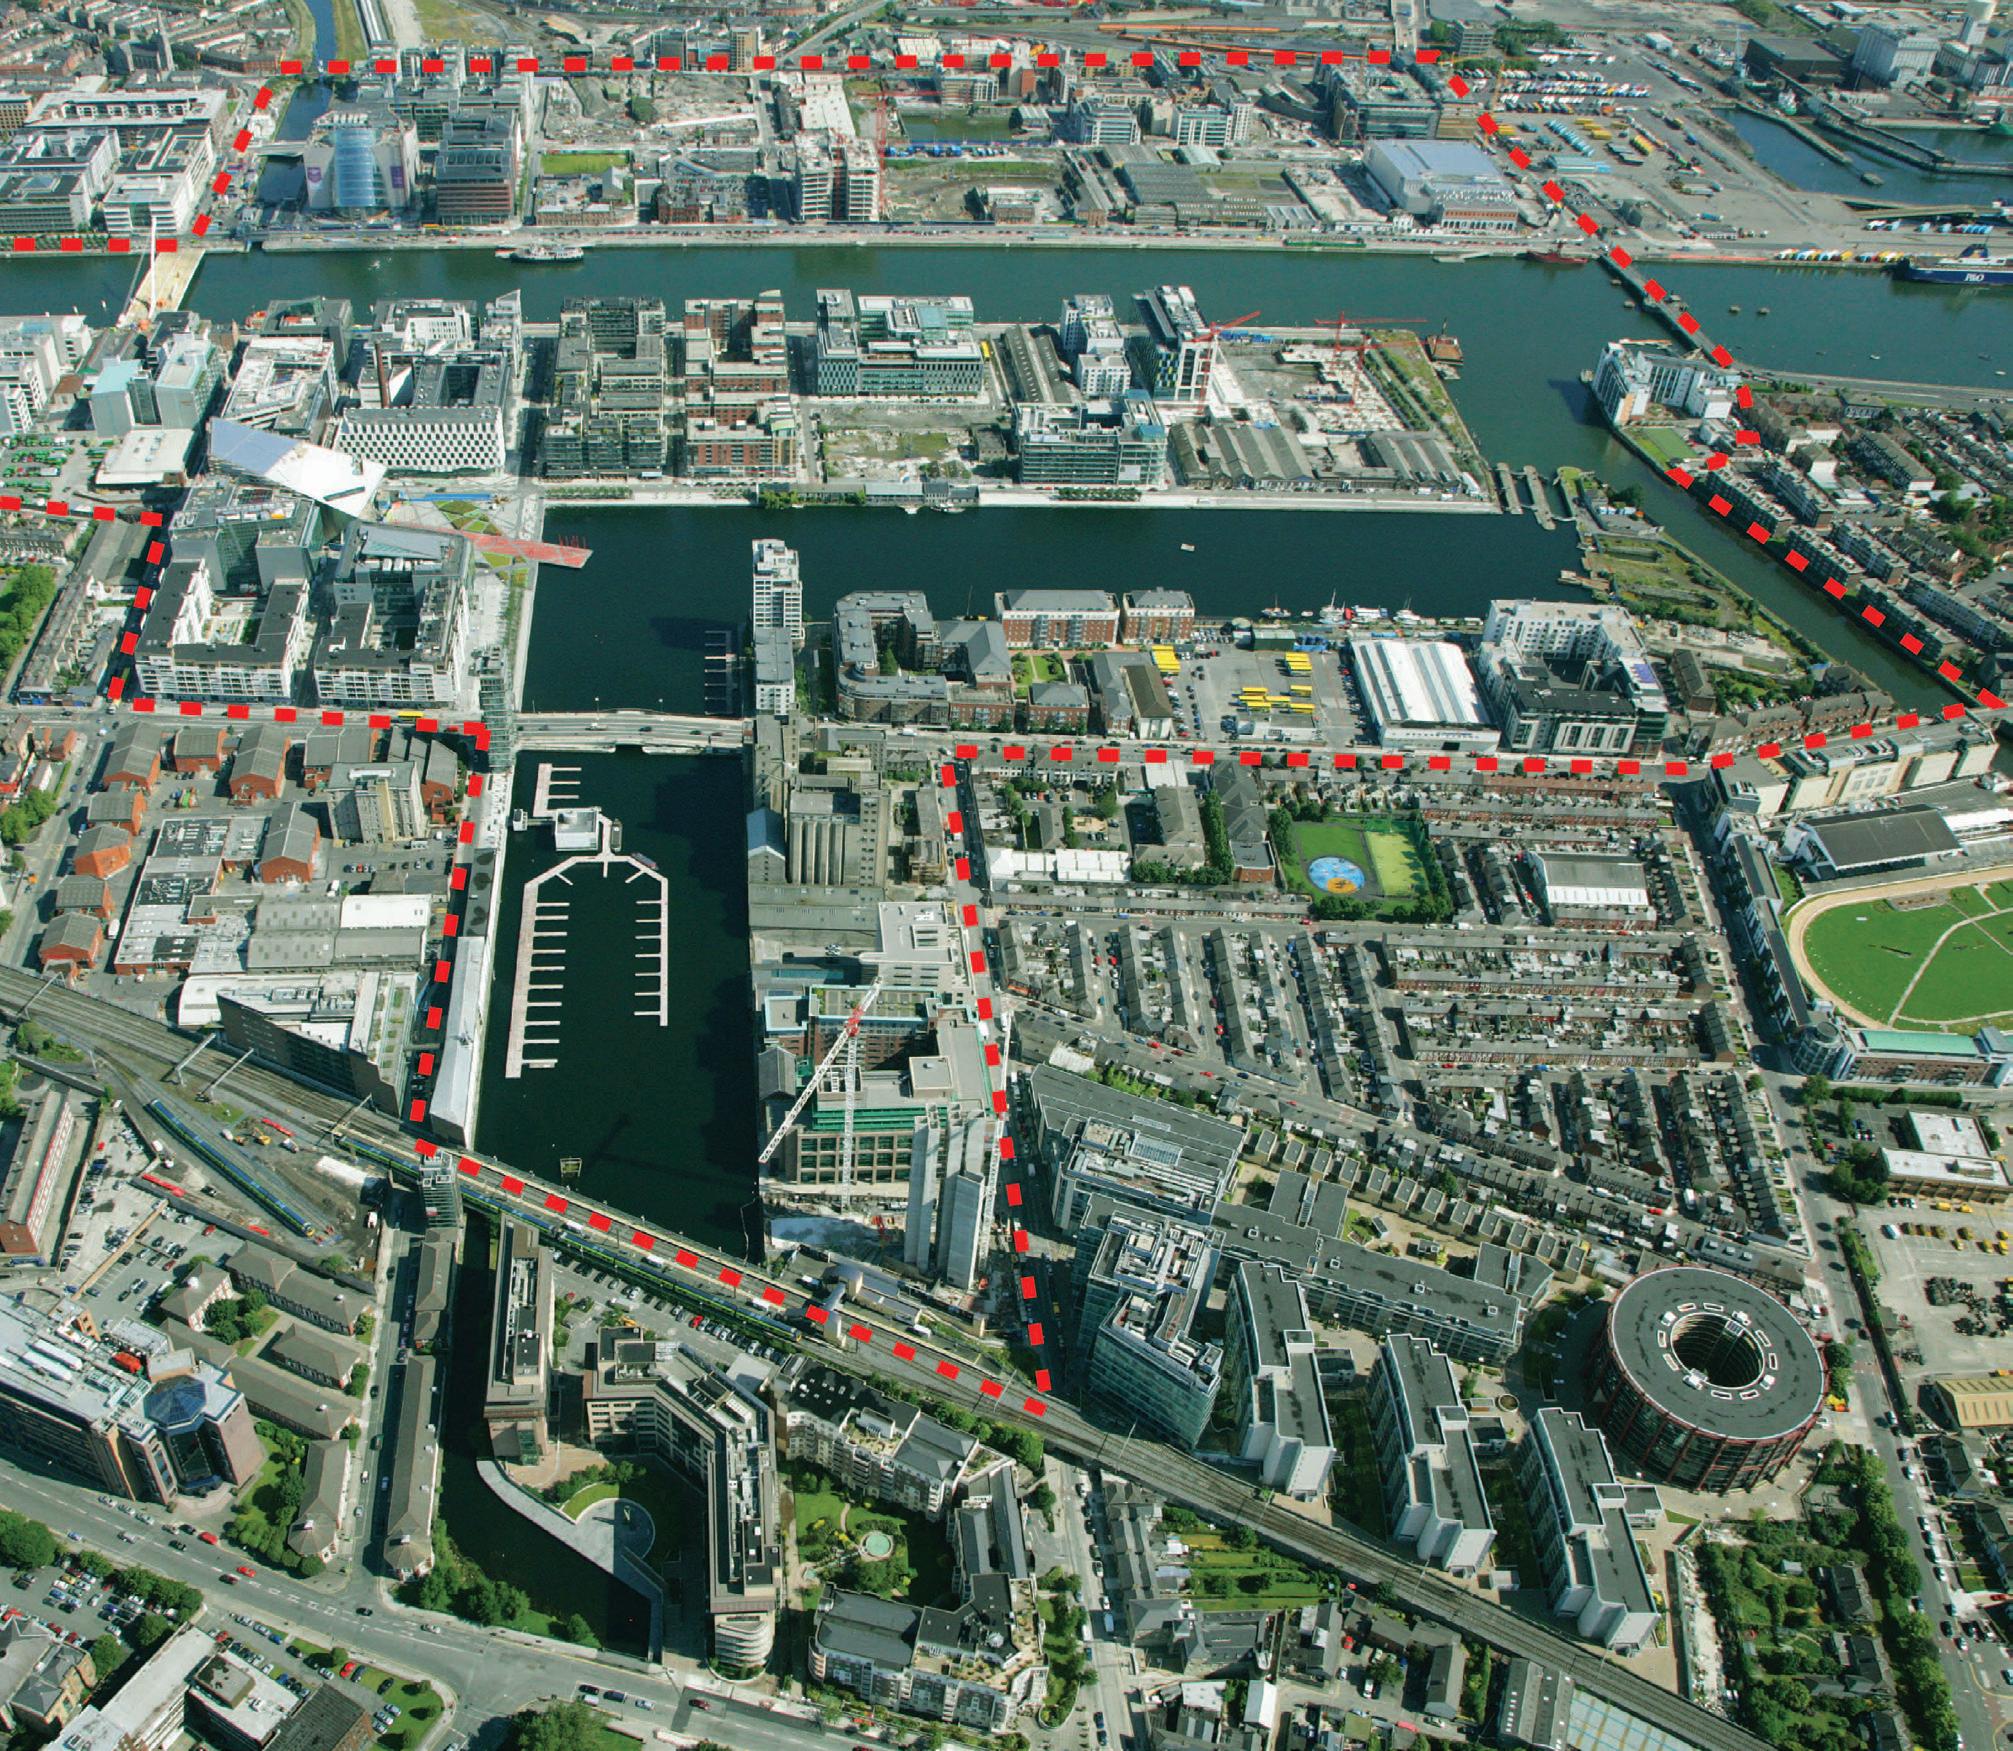
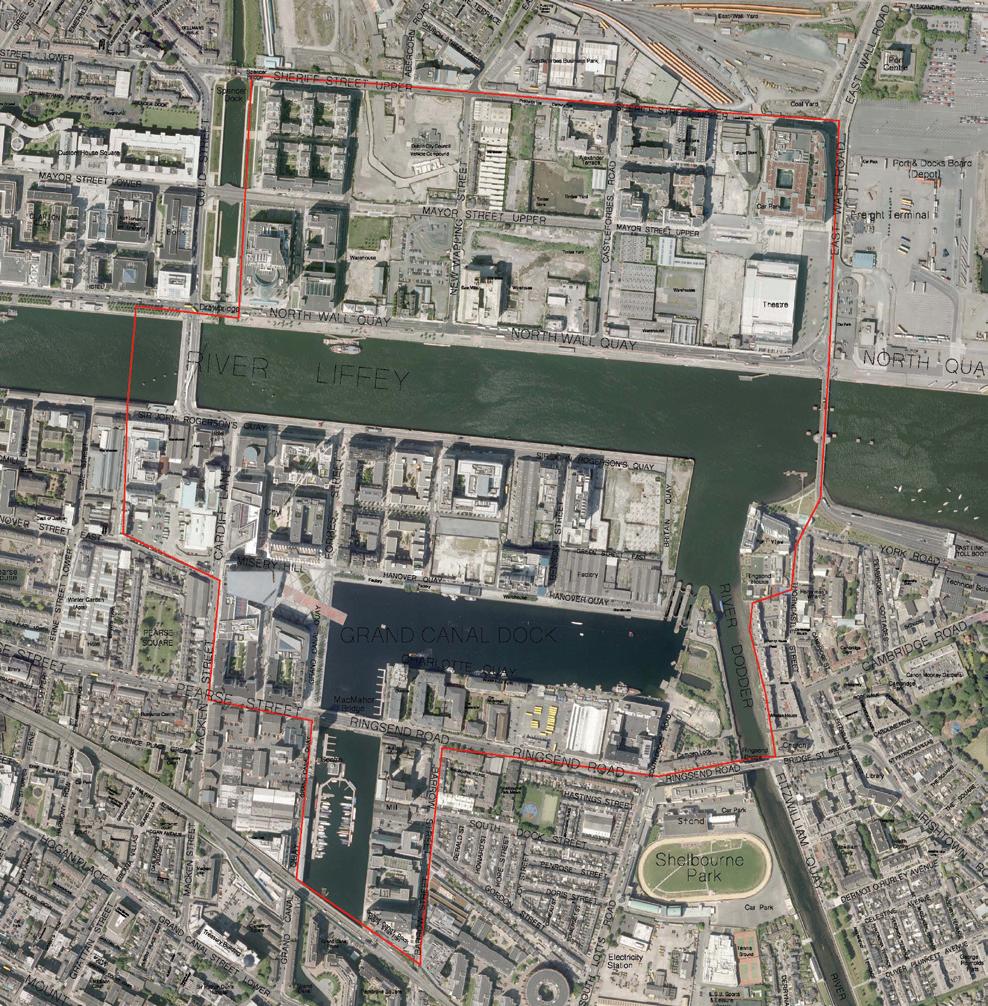
north lotts and grand canal dock (docklands)
SDZ OVERVIEW
AREA COVERED BY SDZ
TOTAL AREA WITHIN SDZ: 66 HA
AVAILABLE FOR DEVELOPMENT: 22 HA
POTENTIAL FOR NEW DEVELOPMENT
RESIDENTIAL UNITS: 2,600
COMMERCIAL RETAIL (SQ. M): 15,000 -20,000
COMMERCIAL/OFFICE (SQ. M) 305,000 -360,000
NEW PARKS (SQ. M): 13,000
ESTIMATED POPULATION ON COMPLETION: 5,800
ESTIMATED EMPLOYMENT ON COMPLETION: 23,000
DEIRDRE SCULLY, SENIOR PLANNER DUBLIN CITY COUNCIL DOCKLANDS OFFICE, CUSTOM HOUSE QUAY, DUBLIN 8. PHONE: +353 (1) 222 6073 | E-MAIL: DEIRDRE.SCULLY@DUBLINCITY.IE | WWW.DUBLINCITY.IE
progress to Date
The Docklands SDZ is perhaps the most privileged of all SDZs, given its strategic location in the Central Business District adjacent to the downtown commercial and financial centres. As an increasingly desirable area to live and work in and which is supported by improved public transport links, the Docklands area is attractive to both developers and commuters. The SDZ was approved by An Bord Pleanála (ABP) in May 2014. The scale and volume of applications received in the Docklands SDZ so far in 2015 is un-matched across the city. Over 50 per cent of the commercial development planned has been lodged and over 22 per cent of the residential development planned has been lodged as planning applications with Dublin City Council.
A lot of the development in the Dublin Docklands SDZ is taking place or planned on sites in which NAMA has a financial interest, comprising over 75 per cent of the total available development land within the 22ha area. The overall amount of office space planned is of the order of 353,000 sq. m out to 2025. Up to 2,600 residential units are also planned over a 7-10 year period. NAMA currently has interests in four operational projects in the Docklands SDZ which are expected to deliver at least 130,000 sq. m of commercial space over the next four to five years.
These are:
• The redevelopment of the Boland’s Mill site. Much of the development will be office accommodation but it will also include 42 two- and three-bedroom apartments, a cultural and exhibition space, in addition to retail and restaurant space. Demolition is currently underway with construction planned to commence in Q1/Q2 2016 with completion by end 2017.
• Project Wave in the North Wall is a 90,000 sq. m mixed office and residential development which is expected to commence in Q1 2016 and also includes more than 250 apartments. It will take approximately five years to reach completion.
• A separate fund, the South Docks Fund, has been created by a joint venture consortium between Oaktree, the Bennett Group and NAMA and is expected to deliver around 27,100 sq. m of office space and 158 residential units at 5 Hanover Quay and 76 Sir John Rogerson’s Quay. It will take 3 to 4 years to reach completion.
• A separate fund, the City Development Fund, formed by the same consortium, is delivering a further 4,645 sq. m of office space at 6-8 Hanover Quay.
The balance of office space will be delivered up to 2025 on the remaining 11 sites in the Docklands area.
DockCanal
Grand Canal Dock Station
STRATEGIC DEVELOPMENT ZONES
cherrywood sdz
SDZ OVERVIEW
AREA COVERED BY SDZ AREA AVAILABLE FOR DEVELOPMENT: 125 HA
POTENTIAL FOR NEW DEVELOPMENT
RESIDENTIAL UNITS: 7,700
RETAIL TOWN CENTRE (SQ. M): UP TO 40,900
VILLAGE CENTRES: 3 CENTRES (SQ.M): 2,275 – 6,060
HIGH INTENSITY EMPLOYMENT (SQ. M): 280,000
NEW PARKS: 30 HA
SCHOOLS: 4 PRIMARY AND 2 POST PRIMARY
ESTIMATED POPULATION ON COMPLETION: 21,000
ESTIMATED EMPLOYMENT ON COMPLETION: 20,300-25,800
MARY HENCHY, DIRECTOR OF PLANNING AND ENTERPRISE, DUN LAOGHAIRE RATHDOWN COUNTY COUNCIL, COUNTY HALL, MARINE ROAD, DUN LAOGHAIRE, COUNTY DUBLIN.
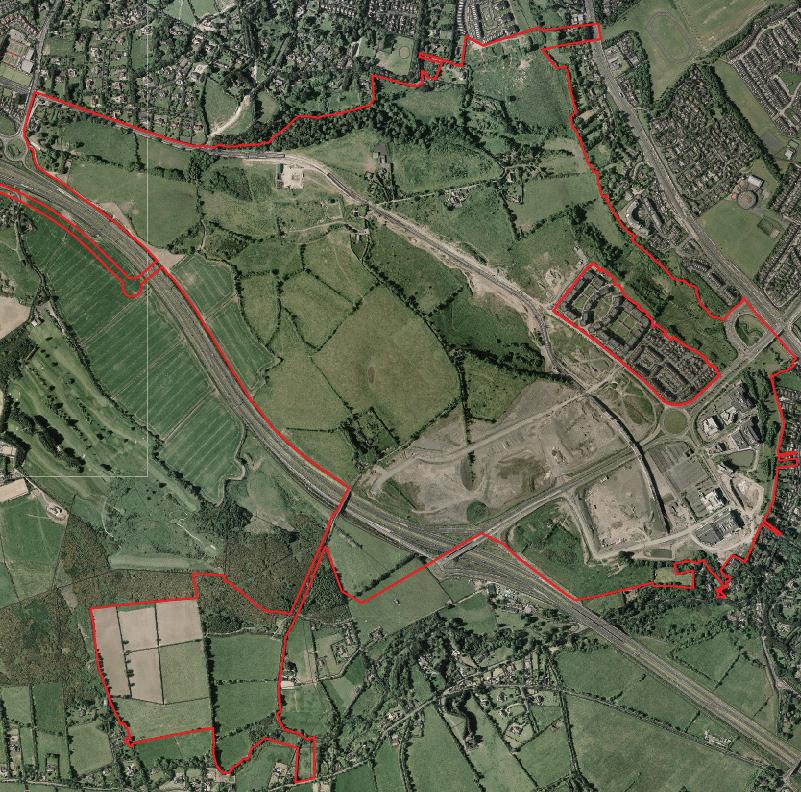
The Planning Scheme for the Cherrywood Strategic Development Zone (SDZ) was approved by An Bord Pleanála in 2014. The SDZ lands, approximately 360 hectares, are the largest undeveloped areas in the Dun Laoghaire-Rathdown County Council (DLRCoCo) area and one of the largest in the country. As the Development Agency for Cherrywood, DLRCoCo is working with the landowners to progress the design of major infrastructure required to serve the development. In terms of housing, the Cherrywood SDZ area is expected to provide 7,700 residential units in a new town centre and 3 new villages, a significant contribution to the residential development potential within the DLRCoCo area.
Cherrywood is strategically located between the M50 and the N11, with the last five Luas stops on the Green line running through it. As a designated large growth town within the Dublin Metropolitan Area, it
is expected to accommodate significant new investment in transport, in economic and commercial activity as well as in housing. In 2014 one of the world’s largest private real estate developers acquired the Cherrywood Business Park and a substantial landbank within Cherrywood, becoming the largest landholder within the SDZ. This developer is using its expertise and commitment to bring to the market the build-out of the new residential and commercial communities here.
Due to the range and scale of development planned for the area it is envisaged that the build-out horizon for Cherrywood may span several County Development Plan cycles. The first significant planning applications for road and parks infrastructure to facilitate this sustainable development are expected before the year end.
Brides Glen
Cherrywood
Wyattville Link Road
Laughanstown
Brennanstown
Carrickmines M50
adamstown sdz
SDZ OVERVIEW
AREA COVERED BY SDZ
AREA DESIGNATED: 223.5 HA
AVAILABLE FOR DEVELOPMENT: 213.9 HA
POTENTIAL FOR NEW DEVELOPMENT
RESIDENTIAL UNITS (AMENDED SCHEME 2014): 8,908 (MAX)
RESIDENTIAL UNITS COMPLETED: 1,384
RESIDENTIAL POPULATION ACCOMMODATED: 3,800
NON-RESIDENTIAL (SQ. M) 125,500
RETAIL (SQ. M) 24,175 (MAX)
PARKS: 30.05 HA
ESTIMATED POPULATION ON COMPLETION: 20,300-23,800
ANNE HYLAND, SENIOR EXECUTIVE PLANNER, SOUTH DUBLIN COUNTY COUNCIL, COUNTY HALL, TALLAGHT, DUBLIN 24 YNN5. PHONE: +353 (1) 414 9000 | AHYLAND@SDUBLINCOCO.IE | WWW.SDCC.IE
progress to Date
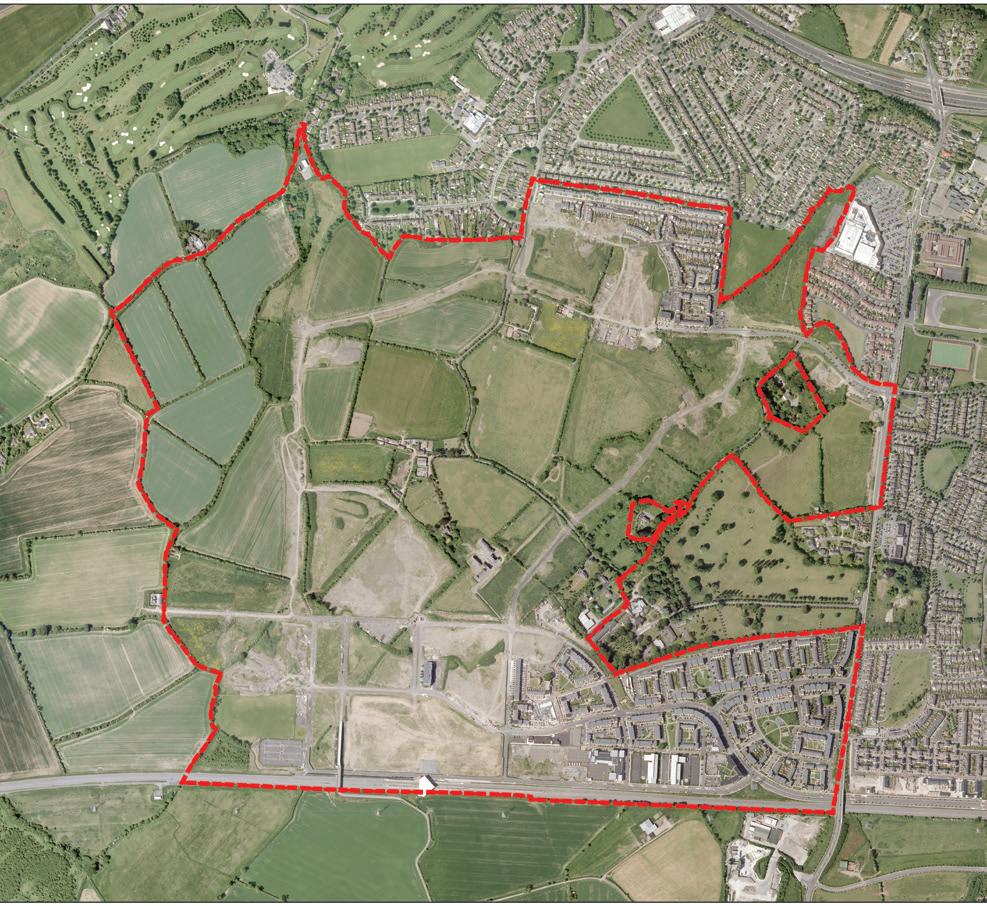
Adamstown was the first SDZ designated in 2001 with the Planning Scheme for the area adopted in 2003. Construction commenced in 2004 with the first occupants moving in in 2006. South Dublin County Council carried out a review of the scheme in 2013, following which an Amended Scheme was approved by An Bord Pleanála in 2014. The Amended Scheme lowered the maximum target for residential units from 10,150 to 8,908, of which 1,384 units have been delivered to date. Development so far has focused on the
clonburris sdz
SDZ OVERVIEW
AREA COVERED BY SDZ
TOTAL LAND WITHIN SDZ: 180 HA
AVAILABLE FOR DEVELOPMENT: 108 HA
LOCAL AREA PLAN: 85 HA
AVAILABLE FOR DEVELOPMENT: 37.67 HA
POTENTIAL FOR NEW DEVELOPMENT (SDZ)
RESIDENTIAL UNITS TARGET: 9,585-11,505
COMMUNITY FLOORSPACE (SQ. M): 36,270
RETAIL (SQ. M): 43,000-53,000
NON-RETAIL COMMERCIAL (SQ. M): 175,500
PARKS: 5-6 NEIGHBOURHOOD PARKS
Paddocks (north) and at Adamstown Square and Adamstown Castle (south). The following infrastructure has been delivered to date: New railway station, bus, taxi, cycle parking, 2km link road and busway, 300 space Park and Ride car park (temporary), 2 primary schools, 1 post-primary school, 65 place crèche, neighbourhood park, 2 playing pitches, local retail facilities, 110kv electrical transformer station, foul and surface water drainage network and pumping station.
ANNE HYLAND, SENIOR EXECUTIVE PLANNER, SOUTH DUBLIN COUNTY COUNCIL, COUNTY HALL, TALLAGHT, DUBLIN 24 YNN5. PHONE: +353 (1) 414 9000 | AHYLAND@SDUBLINCOCO.IE | WWW.SDCC.IE
progress to Date
The Clonburris SDZ was designated in July 2006 and was adopted by An Bord Pleanála in November 2008. A Local Area Plan relating to the adjoining lands was adopted simultaneously. A review of the Scheme is scheduled to commence over the coming months. According to South Dublin County Council there has been no substantive progress with respect to residential and commercial development other than the construction of two new railway stations on the upgraded Kildare suburban line with services running to Heuston Station. A canal side greenway cycle track and bridge have also been completed linking the Adamstown/Lucan area with the City Centre, adjoining the Clonburris SDZ/LAP lands. A new primary school has been completed and a large new post-primary school has commenced construction on the LAP lands.
Adamstown Station
Balgaddy
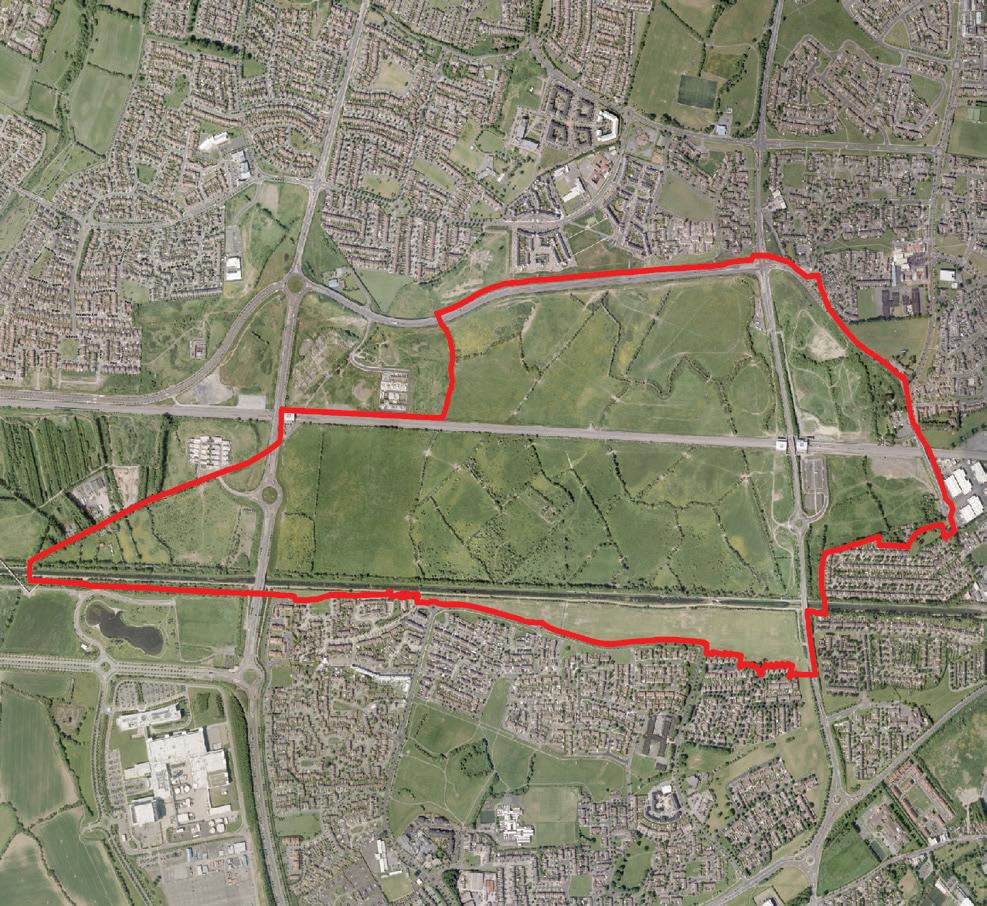
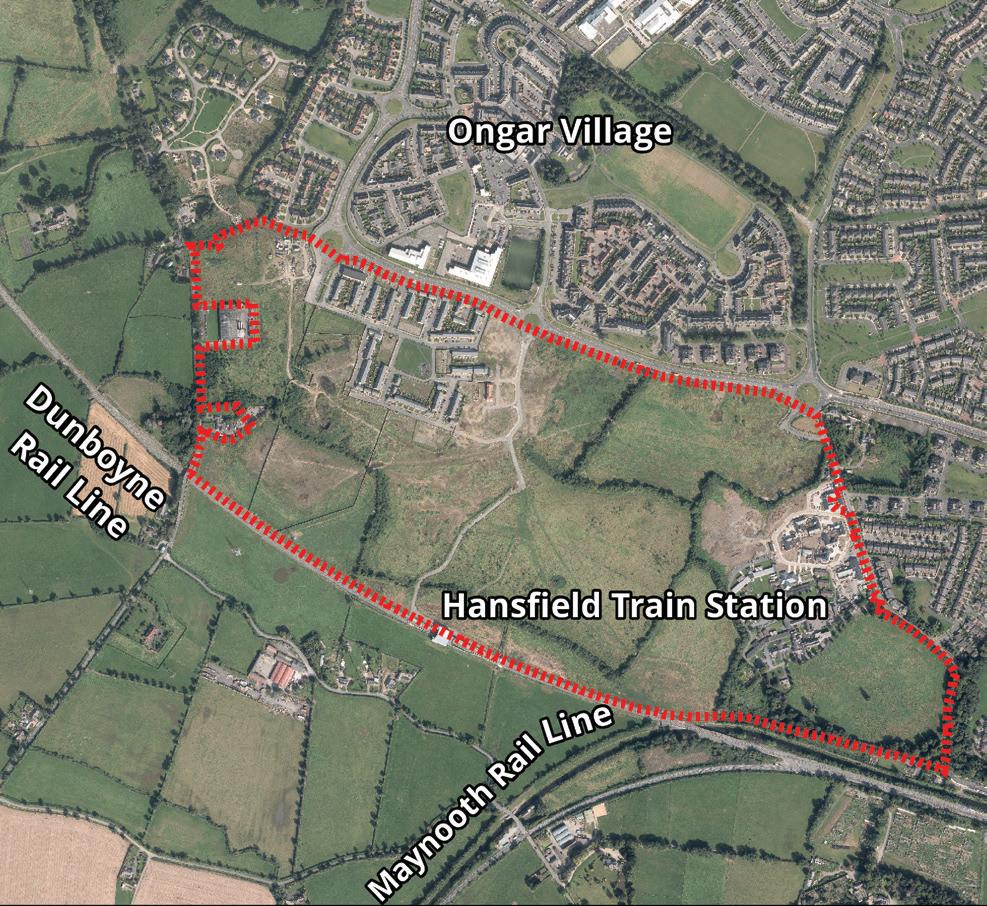
HANSFIELD SDZ
SDZ OVERVIEW
AREA COVERED BY SDZ
TOTAL LAND WITHIN SDZ: 80.7 HA
AVAILABLE FOR DEVELOPMENT: 68.5 HA
POTENTIAL FOR NEW DEVELOPMENT
RESIDENTIAL UNITS: 3,000
COMMERCIAL RETAIL (SQ. M): 950 - 2,200
COMMERCIAL SERVICES (SQ. M): 2,100
NEW PARKS: 2 HA
EDUCATION/COMMUNITY: 6.5 HA
ESTIMATED POPULATION ON COMPLETION: 7,500
PROJECTED EMPLOYMENT ON COMPLETION: 500
NICHOLAS O’KANE, SENIOR EXECUTIVE PLANNER, FINGAL COUNTY COUNCIL, GROVE ROAD, BLANCHARDSTOWN, DUBLIN 15. PHONE: +353 (1) 890 5000 | NICHOLAS.OKANE@FINGAL.IE | WWW.FINGAL.IE
progress to Date
The SDZ was approved by An Bord Pleanála in April 2006. 175 residential units are occupied (12 apartments and 163 houses). There are outstanding permissions for 961 residential units on the lands (373 apartments and 588 houses). The site is active with residential units under construction in the SDZ (Zones 1 & 3). A decision on 128 residential units is pending by Fingal County Council and 2 further significant planning applications are anticipated this autumn.
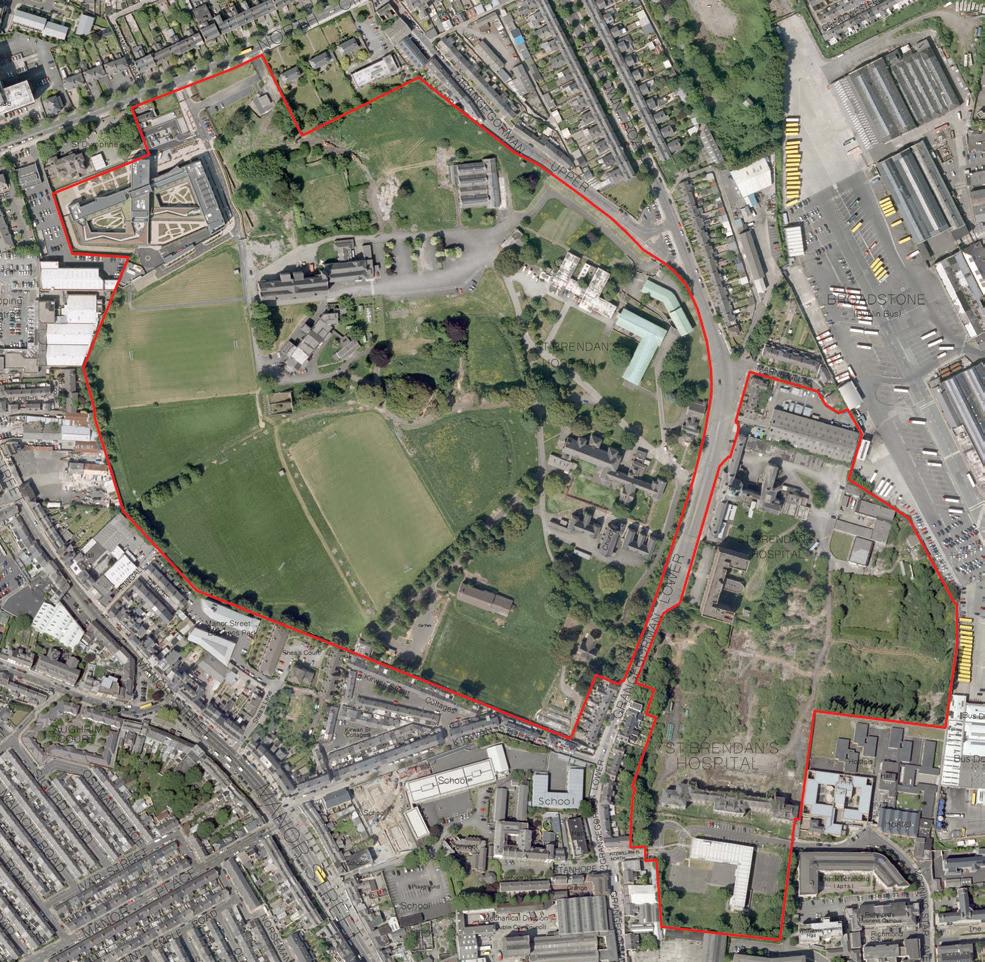
grangegorman sdz
SDZ OVERVIEW
AREA COVERED BY SDZ
TOTAL LAND WITHIN SDZ: 28.69HA
HSE: 27.71HA
DUBLIN CITY COUNCIL: 0.57HA
DIT: 0.41HA
POTENTIAL FOR NEW DEVELOPMENT
EDUCATION (SQ. M): 270,000
HEALTHCARE (SQ. M): 42,000
COMMUNITY (SQ. M): 8,000
OTHER MIXED USE (SQ. M): 60,000
ESTIMATED EMPLOYMENT ON COMPLETION: 8,000 TO 10,000
ESTIMATED POPULATION ON COMPLETION: 2,000 TO 2,500
EXPECTED COMPLETION: 2025
The following primary elements of the required infrastructure are in place:
1. Hansfield Railway Station operational
2. Primary School open
3. Post Primary School under construction (opening 2016)
There have been 23 successful planning decisions delivered under the Grangegorman SDZ Planning Scheme to date. The development includes a new amalgamated Urban Campus for the Dublin Institute of Technology (DIT). One of the most significant contracts was the Site Infrastructure and Public Realm project, now substantially complete. Adaptation of several protected structures to cater for the first 1,100 DIT students onsite was completed in August 2014. Following the completion
of a range of new sporting amenities the second stream of DIT students arrived in September 2015. Currently there are two construction projects onsite, the Greenway Hub and the new Grangegorman Primary Care Centre (completion mid-2016). The next phase will involve the construction of two major quads onsite, which are expected to bring 10,000 students to Grangegorman. Other active projects include the new primary school, a community nursing unit, and the academic hub.
Broadstone
N.RoadCircular
Manor Street
Prussia Street
dublin: economic scorecard q3 2015
Note: These “petrol gauge” charts present the performance of the particular indicator relative to a range of performances from most positive (green) to least positive (red). Each gauge presents the latest value compared to the peak value and the trough value over the last decade (except for public transport trips which cover the past 5 years).
property
Your First Stop Shop for Local Enterprise Development
Your LEO offers a first stop shop service to small businesses in Dublin. We help start-up and growing businesses with the wide range of supports we offer which include business advice, mentoring, training, business networking opportunities and financial assistance for certain types of business.