page 12
dublin

by juliet passmore economist, dublin city council
page
by david fitzsimons group chief executive
excelence


page 12
dublin
by juliet passmore economist, dublin city council
page
by david fitzsimons group chief executive
excelence
Dublin’s workforce increases to 696,200 (SA) in Q3 2018 with unemployment rate at 5.3% for the past three quarters.
Residential rents surpassed the €1,600 mark in Q3 2018, rising 9.5% YoY.
Residential property prices fell for the first time since April 2017. Dublin prices moderated further with YoY growth of 5%.
Public transport trips on the LUAS surpassed 10 million (SA) for the second consecutive quarter in Q3 2018, with a total of 55.1 million (SA) passenger trips across all four public transport types.
Housing completions in Dublin reached 5,152 (SA) in the first three quarters of 2018.
Office vacancies in Dublin suburbs (6.7%) and Dublin 2/4 (4.3%) have fallen to their lowest levels in over 10 years.
The Mastercard Dublin SpendingPulse shows consumer spending in the Dublin economy grew 5.8% (SA) YoY in Q4 2018. Tourism expenditure rose 15.8% (SA) with the UK market registering three consecutive quarters of YoY growth.
The Dublin MARKIT PMI
The Dublin private sector ended 2018 on a positive note, with strong sustained growth during Q4.
The Dublin Economic Monitor is a joint initiative on behalf of the four Dublin Local Authorities, and is designed to be of particular interest to those living and doing business in Dublin or considering locating here. It is produced by EYDKM Economic Advisory Services and IHS MARKIT deliver the Dublin Purchasing Managers' Index (PMI).
We also partner with Mastercard to use their SpendingPulse reports to better understand retail and tourism spending patterns. The SpendingPulse is derived from anonymised and aggregated card transaction data as well as other means of payments such as cash and cheques. This data helps the city develop new insights on the spending patterns of Dubliners and tourists, as well as comparing the
Capital's performance to the whole of Ireland (see centrefold supplement).
The special articles this quarter include one from David Fitzsimons, Group Chief Executive of Retail Excellence, exploring the impact of technology and customer experience on the future of retail in Ireland. The second article is written by Juliet Passmore, an Economist with Dublin City Council and focuses on the interesting results of the latest “Your Dublin Your Voice” consumer survey.
We hope you find the Monitor useful and welcome any feedback. You can sign up to our quarterly mailing list and access the Monitor resources online at www.dublineconomy.ie. The next release will be published online in May 2019.
This document provides general information on the Dublin economy. It is not intended to be used as a basis for any particular course of action or as a substitute for financial advice. The document is produced independently by EY-DKM Economic Advisory Services; the views and opinions expressed are those of the relevant author, and do not necessarily reflect the views of the Dublin Local Authorities. The Dublin Local Authorities disclaim all liability in connection with any action that may be taken in reliance of this document, and for any error, deficiency, flaw or omission contained in it.
The OECD’s most recent forecasts indicate that global growth in 2019 is expected to reach 3.5%. This is marginally lower than expected growth of 3.7% in 2018. In Mid-January the IMF revised its world economic growth forecasts downwards citing weakness in Europe and some emerging markets and failure to resolve trade tensions. The downgrade was the second in three months and was further exacerbated by greater than expected slowdown in China and the possibility of a no-deal Brexit. The new forecast indicate expected global growth of 3.5% in 2019 and 3.6% for 2020.
gdp forecast growth, 2019
OECD forecasts for the United States expect GDP growth to slow to 2.7% in 2019 and to 2.1% by 2020. United States fiscal policy took a stimulative approach in 2018 and is likely to continue in this manner for the first half of 2019.
Euro Area GDP growth is expected to decrease in 2019, to 1.8%, easing to 1.6% by 2020. The OECD forecasts indicate that Brexit is not a major risk for the Euro Area as a whole; however, countries with close trade links to the UK could be severely affected if the UK leaves the EU with no deal.
OECD forecasts for the UK indicate GDP growth of 1.4% in 2019, slowing further to 1.1% in 2020. These forecasts are based on the assumptions there will be a smooth exit of Britain from the European Union. A no-deal scenario is the greatest risk for UK growth with OECD analysis suggesting real GDP suffering a 2% loss over two years if no deal is reached between the UK and EU.
economies gdp growth forecasts source: oecd, november 2018.
Strong Irish GDP growth continued throughout 2018, reaching 4.9% YoY in Q3 2018, following 8.7% YoY growth in Q2. Modified Domestic Demand (MDD) negates the distortion issues with GDP by removing the effects of aircraft leasing and the import of intellectual property. Final MDD for Q3 2018 increased by 4.1% YoY. GNP increased at a rate of 3.1% in Q3 2018 YoY. Personal consumption increased by 2.9% YoY to Q3 2018, while capital investment increased by 43.4% - partially driven by increased imports by aircraft leasing companies.
The numbers in fulltime employment now stands at 1.8 million. The highest number since Q1 2008. Full time employment represents approximately 80% of employment. As employment continues to climb towards “full employment” the labour market may become more competitive amongst employers.
The first Quarterly Bulletin of 2019 published by the Central Bank of Ireland has outlined that a no-deal Brexit represents the worst-case scenario for ROI. In the event of a no-deal outcome there would be a 4 percentage point loss to economic growth in the first full year. This would translate to a 6 percentage point decrease in the level of ROI output over a 10 year period.
irish macroeconomic growth forecasts

Though other indicators showing early signs of stabilisation
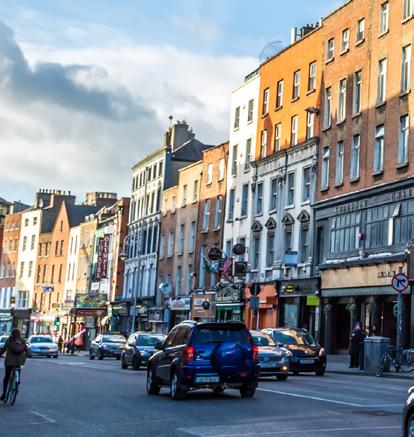
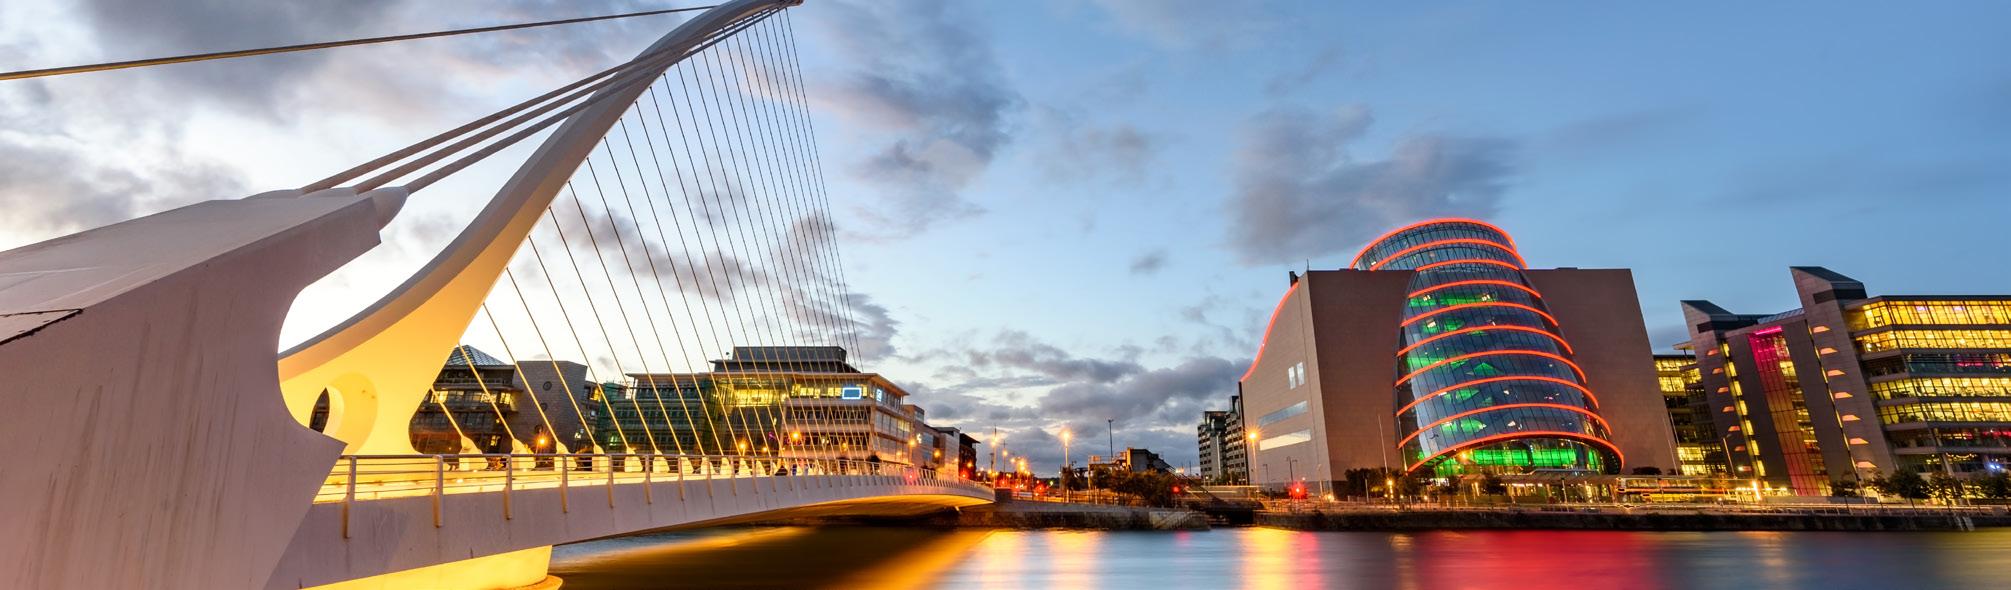
DUBLIN HAS UNDERGONE A PHENOMENAL TRANSFORMATION IN THE PAST 10 YEARS...
The Dublin landscape has undergone considerable changes since 2008. Literally speaking the number of cranes visible on the Dublin city skyline has more than trebled in three years with considerable levels of construction taking place across the entire city. Another significant change, that isn’t as obvious to the eye but equally impressive, is the transformation that has occurred in the Dublin workforce in the past 10 years.
Following a turbulent three year period during the depths of the crisis (Q3 2008 – Q3 2011) when Dublin’s workforce dropped by close to 100,000 people the recovery in the subsequent seven years has proved nothing short of remarkable. Since the beginning of 2012 an additional 150,000 have been added to the workforce with
With the market on the cusp of full employment a real concern for the local economy now is the availability of skills and talent.”
a total of 696,200 currently employed, as of Q3 2018 - the highest level since CSO records commenced in 1998.
"With the market on the cusp of full employment a real concern for the local economy now is the availability of skills and talent. Indeed the Dublin Chamber of Commerce recently published findings that indicate that attracting and retaining staff is a bigger concern amongst businesses in Dublin than even the threats presented by Brexit. "
Data produced by Irishjobs.ie on job vacancies, by county and sector, further highlight the challenges for employers and the opportunities for workers. Business confidence in the Dublin market remains strong with 19% growth YoY in Dublin vacancies. While the data suggest that business growth has not yet been hampered by labour shortages or, indeed, by the threats posed by Brexit there is a considerable risk that, in the short-term at least, labour shortages will constrain investment and growth.
Aside from the uncertainties associated with Brexit, housing continues to exert the greatest pressure on the National, and Dublin, economy. As data in this Monitor show, close to 5,000 homes were completed in Dublin in the first three quarters of 2018, with Dublin acting as the main driver of completions growth in Ireland.
In Q3 2018 alone, completions in Dublin accounted for 67% of all completions nationally and for every quarter since Q1 2016
the proportion of houses completed in Dublin has exceeded 50% of the national total. This may be linked to viability and affordability issues on the supply and demand sides of the market. Salary levels are higher in Dublin meaning that consumers may be in a stronger position to meet the mortgage requirements under the Central Bank lending rules. This in turn means that house building may be more viable for contractors in the Capital compared to regions beyond the Greater Dublin Area.
Although completions and commencements are relatively high in the Dublin region compared to levels nationally, levels remain far below what is required to meet demand in the market currently. This phenomenon may be feeding into the skills shortage observed in Dublin with high rents (in excess of €1,600 per month on average) acting as a barrier to employers attracting talent from overseas in particular.
In 2017 the American Chamber of Commerce identified the need for 32,600 new apartments in Dublin by 2022 in order to sustain new jobs in multinational companies and growth in inward investment. With commencements at their current level it will be a challenge meeting these targets in the next three years
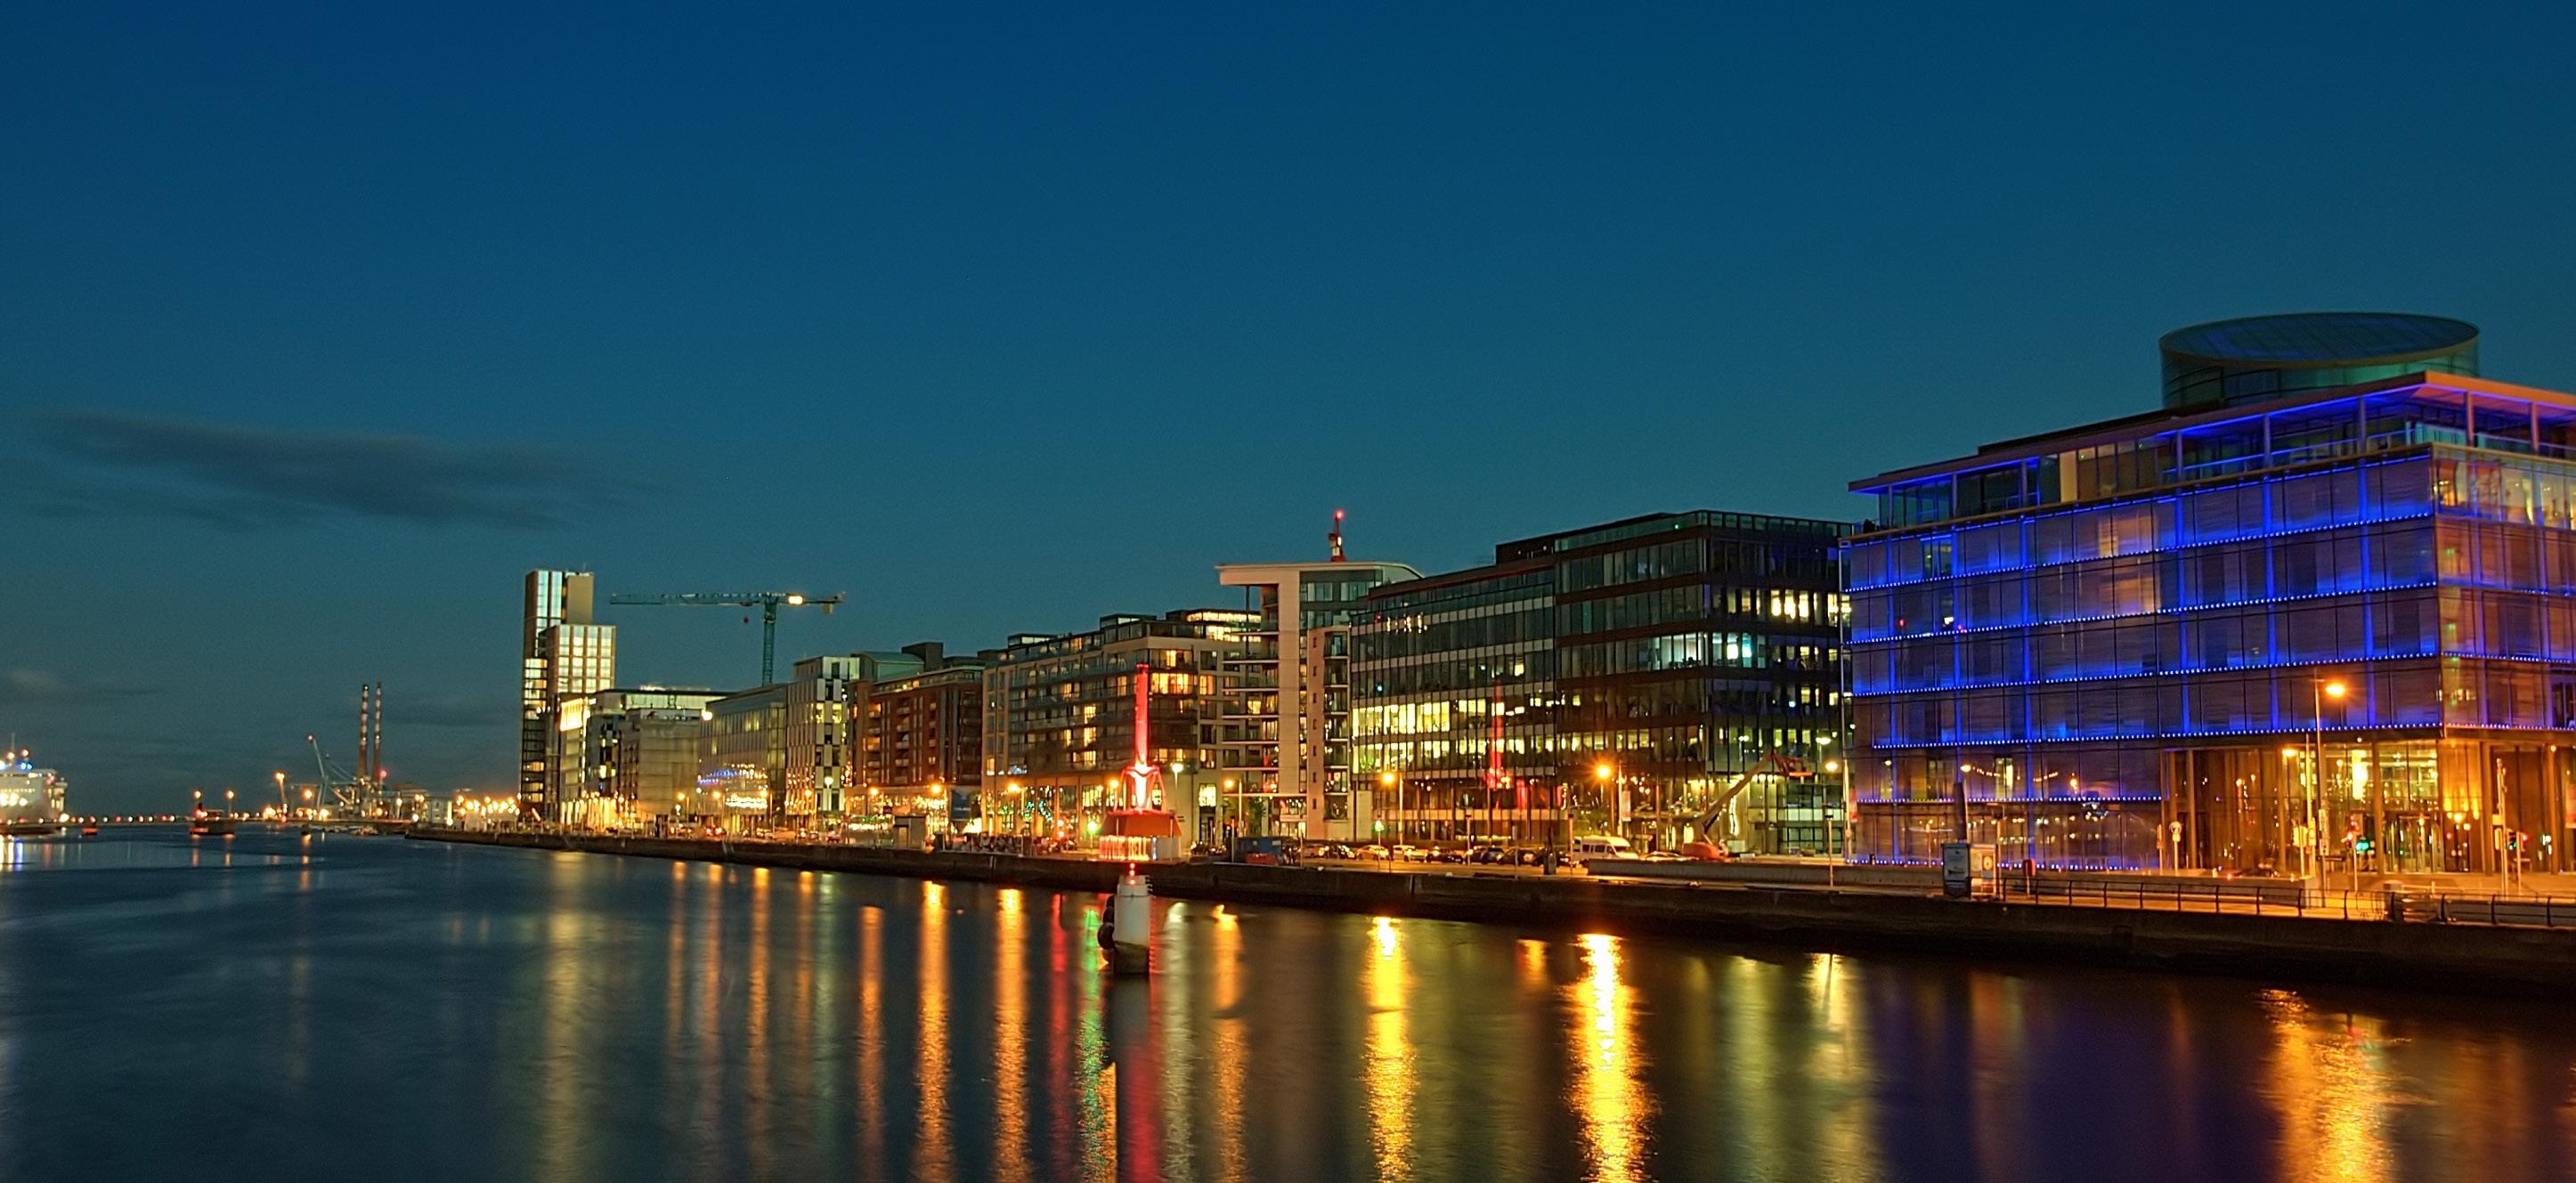
The outlook for Ireland is broadly positive and this is reflected in investments being made in the capital city. Salesforce, a US software company, recently announced a significant expansion of its Dublin operations which could see an additional 1,500 jobs created over the next five years in the Docklands.
Facebook announced major investment plans in Ireland (Dublin being the largest of four Irish offices) which will lead to 1,000 new jobs in 2019 across sales, engineering and marketing.
This is further confirmed by the results in the IHS Markit Purchasing Managers’ Index (PMI) which saw the Dublin private sector end 2018 on a positive note with strong sustained growth during Q4 2018 and staffing levels increase for the past 25 quarters. Andrew Harker, Associate Director at IHS Markit, notes:
“…with the widespread upturn in economic activity across the monitored sectors, the data suggest that the Dublin economy is in a good position as we enter 2019.”
Growth is not only being observed on the business side of the economy – consumers and tourists are also showing confidence in the Dublin market with the Mastercard SpendingPulse showing both retail and tourism spending in Dublin on a strong upward trend.
Commenting on the performance recorded in the SpendingPulse, Michael McNamara, Global Head of SpendingPulse Mastercard stated:
“Ireland and Dublin both produced solid retail sales growth at the end of 2018. Dublin recorded 5.8% YoY growth (SA) for the first time in Q4 2018…Both Dublin and the entire country recorded impressive growth in tourism spending…While the improvement in spending by Chinese tourists has been impressive, the consistent growth in spending from the US continues to power this important sector of both Dublin and Ireland's retail economy as we enter 2019.”
Brexit, of course, has been a source of concern for many Irish and Dublin businesses since mid-2016 and research from the

International Monetary Fund, the ESRI and Central Bank of Ireland has recently shown the possible negative impact on the Irish economy of a no-deal Brexit. Now, in the face of a potential disorderly separation between the UK and the EU businesses are looking at ways to insulate themselves from any potential fallout.
Dublin Port, which recorded its second consecutive quarter of negative YoY growth in Q4 2018, is preparing for the possibility of a no-deal Brexit. As an example of a company at the forefront of any Brexit “fallout” the Port is spending €30 million in preparation - €10 million on primary inspection posts and €20 million on secondary inspection posts for State agencies carrying out checks on goods requiring customs clearance.
ARE SHOWING EARLY SIGNS OF STABILISATION.
In spite of the concerns in the rental market, house prices were one of many indicators which are showing signs of “levelling off” in recent data. In November 2018 the Dublin Residential Property Price Index fell for the first time since April 2017. While the change is small and represents a monthly drop of less than 1%, a wider trend has emerged in terms of YoY growth rates which have been slowing since May 2018. This is only the second sustained period of falling growth rates in Dublin house prices since 2015 but whether or not it will lead to a levelling off of prices going forward remains to be seen.
Although passenger trips on the LUAS Cross City exceeded 10 million for the second consecutive quarter, overall passenger trips on the four Dublin transport modes declined marginally in Q3 2018. Similarly, passenger arrivals at Dublin airport have remained relatively stable since the step-change recorded in May 2018.
It is difficult to pin down a discernible trend at this stage, with only a limited number of observations across a number of indicators, and the unknown quantity of Brexit. However it does appear that certain sections of the Dublin economy are beginning to show signs of stabilisation after an extended period of recovery.
source: cso labour force survey (lfs). dublin seasonally adjusted by ey-dkm.
The competition for talent continues to heat up in Dublin, and nationally, as the market remains near full employment. Since Q3 2017 an additional 33,000 people were added to Dublin’s workforce, with 696,200 people employed in Dublin. The unemployment rate in Dublin has stood at 5.3% for the past three quarters and has fallen further nationally to 5.7%.
construction employment registers strong boost in q3 2018
Construction employment registered considerable growth of 20.6% in the 12 months to Q3 2018. YoY growth of this magnitude has not been recorded since Q4 2017 and comes on foot on annual growth of 6.1% recorded in Q2 2018. Across the entire Private Sector close to 7,000 net jobs were created between Q2 and Q3 2018. Employment in the Public Sector rose by 5.2% YoY in Q3 2018 with public administration accounting for almost all of this growth.
nov '
source: cso.
Property prices in Dublin have grown by 96.1% between February 2012 and November 2018. However, since April 2018 YoY growth in Dublin’s property prices has been declining, potentially reflecting an increase in housing supply, Central Bank rules and affordability issues. Nationally, a similar trend is also observed. While there appears to be signs of stabilisation in the market it is difficult to determine a trend on foot of one month’s observations.
dublin's yoy
q3 ' 18
source: rtb.
Average Dublin rents grew by 9.5% YoY in Q3 2018 to €1,620. This represents a €141 annual, and €25 (+1.6%) quarterly, increase in average rents. Private residential rents in Dublin have been increasing YoY for 30 consecutive quarters. Pressure continues to be felt outside of the Greater Dublin Area (GDA) with rents increasing by approximately 6.6% YoY for the past four quarters. Rents in the GDA grew by 6.5% YoY in Q3 and now stand at €1,149 on average.
over 5,000 completions in dublin in first nine months of 2018
' 18
In Q3 2018 1,947 (SA) new homes were added to the Dublin market, representing YoY growth of 22.8% and QoQ growth of 7.3%. Following three quarters of negative YoY growth, commencements registered double digit growth (23.6%) in Q3 and brings to 5,470 (non-SA) the number of homes commenced in the first nine months of 2018.
rent level for dublin office space remains unchanged
source: CBRE
Rent levels for office space in Dublin City Centre and Suburbs remain unchanged QoQ and YoY in Q4 2018. Prime office space in Dublin was priced at €700 per square metre at the end of Q4 2018. Office space accounted for 41% of total investment in the Irish market in 2018.
office vacancy in dublin 2/4 and suburbs at lowest rate since 2007
source: cbre.
Q4 2018 has seen vacancy rates in the Dublin suburbs decrease by 0.9 percentage points. Dublin’s suburban office vacancy rate now stands at 6.7%, the lowest level in over 10 years. Vacancies in the Dublin 2/4 area are also at their lowest rates in 10 years at 4.3%. According to CBRE, lettings to computer/technology companies accounted for 51% of overall office take-up in Dublin in 2018.
fifth consecutive quarter of growth in luas passenger trips
The LUAS has recorded its fifth quarter of consecutive growth with upwards of 10 million passenger trips per quarter. These figures represent a YoY increase of 10.6%. Total passenger trips across all four transport systems were down slightly in Q3 2018 (55.1 million) compared to Q2 2018 (55.5 million). In Q4 2018 passenger trips on Bus Éireann and Dublin Bus decreased by 4% and 0.7% respectively while Irish Rail (0.9%) and LUAS (0.7%) passenger numbers increased QoQ.

Total consumer spend in the Dublin economy grew by 5.8% (SA) YoY in the fourth quarter of 2018. Dublin continues to exceed the National level, which recorded a YoY increase of 4.7% (SA).
Both the Dublin and National series are maintaining strong upward trends YoY with the highest levels of consumer spending recorded in Q4 2018 since the series began in Q1 2014. On a quarterly basis data for Q4 2018 show Dublin growing by 1.4% QoQ (SA) and Nationally registering QoQ growth of 1.9% (SA). However, it is clear that both Dublin and Ireland are performing well.
“Ireland and Dublin both produced solid retail sales growth at the end of 2018. Dublin recorded 5.8% YoY growth (SA) for the first time in Q4 2018 while Ireland as a whole hit 4.7% YoY growth (SA). Spending on Entertainment picked up for a second consecutive quarter with growth of 12.5% (SA). Tourism spend in Dublin recorded strong growth of 15.8% YoY in Q4 2018. Keeping this momentum going will be a challenge in the first half of 2019.
METHODOLOGY
A macro-economic indicator, SpendingPulse™ reports on national and Dublin retail sales and is based on aggregate sales activity in the Mastercard payments network, coupled with estimates for all other payment forms, including cash and cheque. This information has been grossed up to present an estimate of the total retail sales of retail businesses in Ireland and Dublin to both residents and tourists. Data is seasonally adjusted but is not adjusted for inflation. Mastercard SpendingPulse™ does not represent Mastercard financial performance. SpendingPulse™ is provided by Mastercard Advisors, the professional services arm of Mastercard International Incorporated. See www.dublineconomy.ie for more info on methodology.
Non store Retailers including Electronic Shopping and Mail-Order Houses, Direct Selling Establishments.
RETAIL CATEGORY: DISCRETIONARY
In Q4 2018 Dublin Consumer Spending was positively influenced by growth in all four sectors covered in the Mastercard SpendingPulse. Growth was particularly strong in Entertainment sales, increasing 12.5% (SA) YoY. Spend on Entertainment Nationally was similarly strong at 9% YoY. Sales of household goods – which can be interpreted as a proxy for consumer confidence – grew by 8.5% YoY in Dublin and 4.5% (SA) Nationally. Q4 2018 saw eCommerce continue to grow with YoY figures for Dublin increasing by 3.6% (SA) and Nationally by 13.1% (SA).
RETAIL CATEGORY: NECESSITIES
DUBLIN
Discretionary Retail: Department Stores and Clothing Stores.
RETAIL CATEGORY: ENTERTAINMENT Hotels, restaurants and bars. IRELAND
DUBLIN
Grocery: all food and beverage stores.
RETAIL CATEGORY: HOUSEHOLD GOODS
furniture, electronics and hardware.
Growth in tourism expenditure in Dublin in Q4 2018 was largely driven by Chinese, German and US tourists. Total YoY growth of 15.8% (SA) was recorded in Dublin in Q4 2018, the largest annual increase since Q1 2016. Expenditure by Chinese tourists showed the strongest growth in Q4, increasing by 18.9% YoY and achieving its fourth consecutive quarter of double digit growth, following eight consecutive quarters of negative YoY growth.
This is likely linked to a recent drive by Tourism Ireland to increase Chinese tourists in Ireland as well as the introduction of nonstop direct flights from Beijing. Beijing-based Hainan Airlines have also announced a second direct route from Dublin to Chinese hi-tech hub Shenzhen will begin on 25 February 2019.
Expenditure by French (+16.7%) and US (+13.4%) tourists also showed strong growth. The UK tourism market is starting to show signs of recovery. Following four quarters of negative YoY growth in expenditure by UK tourists in Dublin has been positive, albeit relatively low, for the past three quarters. In Q4 2018, expenditure in this market grew by 3.2% YoY.
Nationally (incl. Dublin) YoY tourism spend was up 10.1% (SA) in Q4 2018, driven by strong growth in US (+16.1%), German (+14.3%) and Chinese (+10%) tourist expenditure. While all tourist segments increased YoY in Q4 2018, the growth in expenditure by French (+2.6%) and UK (+0.9%) tourists was much less pronounced than the other segments.
YOY CHANGE IN SPENDING IN DUBLIN
YOY CHANGE IN SPENDING IN IRELAND
YOY CHANGE IN SPENDING IN IRELAND
+16.7%
YOY CHANGE IN SPENDING IN DUBLIN
YOY CHANGE IN SPENDING IN DUBLIN YOY CHANGE IN SPENDING IN IRELAND
+6.8% YOY CHANGE IN SPENDING IN DUBLIN
YOY CHANGE IN SPENDING IN IRELAND
+18.9%
YOY CHANGE IN SPENDING IN DUBLIN
Since April 2018 the number of passengers arriving at Dublin Airport has remained relatively stable with little or no MoM growth in the five month period. This pattern is clearly evident in the graph. In September 1.3 million passengers arrived in Dublin, representing growth of 0.08% MoM. This stabilisation in the series comes on foot of a step change in the data earlier in the year, most likely a result of disruptions caused during Storm Emma in March.
thoughput at dublin port levels off in q4 2018
dublin port tonnage million tonnes (sa)
9.5 million tonnes of cargo was handled at Dublin Port in Q4 2018, an increase of 3% YoY. Exports have declined for the second consecutive quarter, falling by 1.7% in Q4. QoQ growth for imports has reached the lowest level in nine quarters (0.6%) though YoY imports continue on an upward trend. YoY exports have fallen by 0.01% while imports have increased by 4.6%.
dublin hotel average daily rates up 6.3% yoy in december 2018
dec ' 18
The supply of Dublin hotel accommodation continued on a broad upward trend in December 2018. The index for supply now stands at 107.9 points, up 4.4% YoY. The number of bednights available in the city increased by 4% YoY in December 2018. In the past 12 months just over 28,500 additional bednights have been added to the market. The Average Daily Rate (ADR) now stands at €146 and continues to increase with YoY growth of 6.3% recorded in December.
source: dublin port. seasonally adjusted by ey-dkm. note: this series has been re-calibrated since the last issue
dublin hotel average daily rates (sa)

The Dublin private sector ended 2018 on a positive note, with strong sustained growth during Q4. The Dublin PMI ticked up to 57.8 in Q4 2018 from 57.3 in Q3. The faster rise in economic activity in Dublin was counter to the slowdown in growth recorded across the Rest of Ireland. All three monitored sectors saw output increase sharply and more quickly than Q3. Growth was led by the construction sector, where the expansion was the fastest since Q2 2017.
New orders rose further during Q4, continuing the current sequence of expansion that began in Q4 2012. Mirroring the trend seen with output, the rate of new order growth was sharp and accelerated from Q3. The Rest of Ireland recorded a slower increase in new business than in the previous quarter, with growth in Dublin outpacing that seen elsewhere.
While growth of business activity picked up pace, the rate of job creation eased during Q4, with employment rising at the slowest pace in a year-and-a-half. Despite this, staffing levels have now increased in each of the past 25 quarters. The rate of job creation in Dublin was again faster than that seen across the Rest of Ireland at the end of the year, with employment growth also slowing outside the capital.

Internationally published benchmarks are a useful means of measuring a city’s performance relative to its peers, and recent indicators for Dublin confirm the city’s strong showing across a range of dimensions (see table below).
In December 2018, fDi Intelligence, in their global Cities of the Future report 2018/19, ranked Dublin as the most business friendly large city, on an FDI per capita basis. fDi Intelligence outlines that Dublin has established itself as an IT and technology hub with almost half of all investment in Dublin City in the past five years being tech based.
The PwC/Urban Land Institute Emerging Trends in Europe 2019 ranks real estate markets across European cities according to overall investment and development
prospects. Between 2018 and 2019 Dublin moved up four places from 7th to 3rd and now sits behind only Berlin (2nd) and Lisbon (1st). PwC/ULI interviews suggest global investors are less concerned by Brexit than their European counterparts.
The study points to the fact that 70% of Europe’s senior property professionals interviewed believe that the UK’s attractiveness to global professional will diminish after Britain officially leaves the EU.
Less positively, Dublin dropped 22 places from the Expat City Ranking 2017 and for 2018 Dublin ranked 72nd out of 72 major global cities in its finance and housing subsection. Dublin ranked 63rd for finance and 72nd for housing. The finance section asked two questions, how satisfied workers are
with their financial situation and if they felt their disposable income was enough to cover the costs of daily life. The housing section asked workers of it was easy for expats to find housing and also if they thought housing in their city was affordable. The Expat City Ranking, combined with Ireland falling 7 places to 21st on the IMD World Talent Ranking on developing, attracting and retaining highly skilled workers, signal both short and medium term labour market challenges for Ireland and Dublin.
Dublin ranks 15th out of 77 on UBS’ ranking of net average earning levels based on 15 professions. Using New York as a benchmark (Index = 100) Dublin achieves 82.5 index points, beating major European cities such as Berlin (79.0), London (76.0) and Amsterdam (64.2).

BY JULIET PASSMORE ECONOMIST, DUBLIN CITY COUNCIL
Are Dubliners becoming more a society of diners than drinkers? Results from the latest “Your Dublin Your Voice” suggests that we may be.
The survey, conducted on the run up to Christmas, confirms the City’s love of socialising with both restaurants (92%) and pubs (91%) scoring highly on the enjoyment scale. The former benefits from having a good range of high quality restaurants which has improved over the years, while the latter suffers somewhat from an image of poor value. This is reflected in the fact that 20% more people say they dine out frequently (at least once a month) than go to the pub.
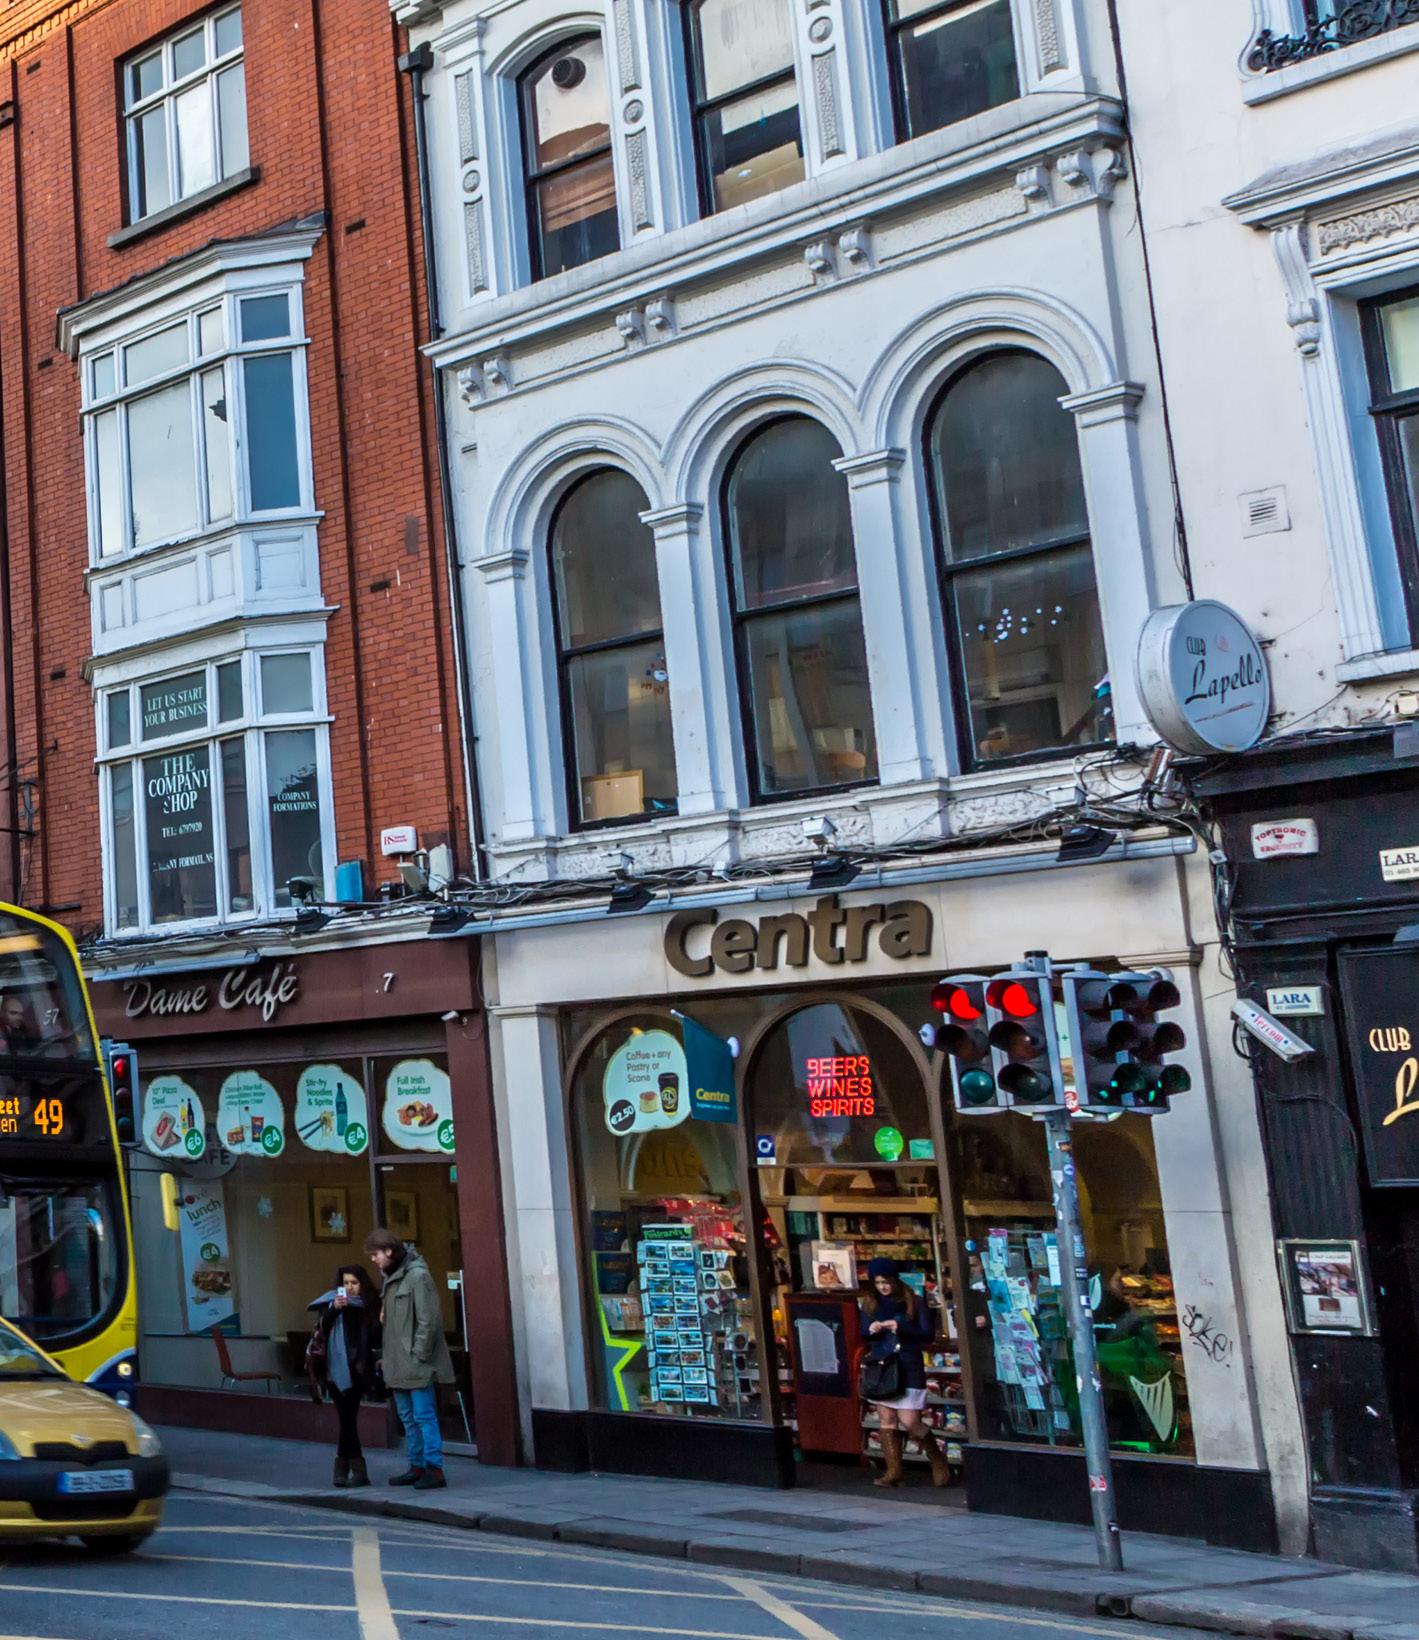
By far the most important factor influencing people’s choice of where to shop is the variety of stores (77%) with value (66%) the second most cited factor. Only 4% indicate that technology is a factor although this doubles amongst 18-24 years-olds. That said 81% pay by tapping while 35% use click and collect facilities, so shoppers are embracing technology more than they realise.
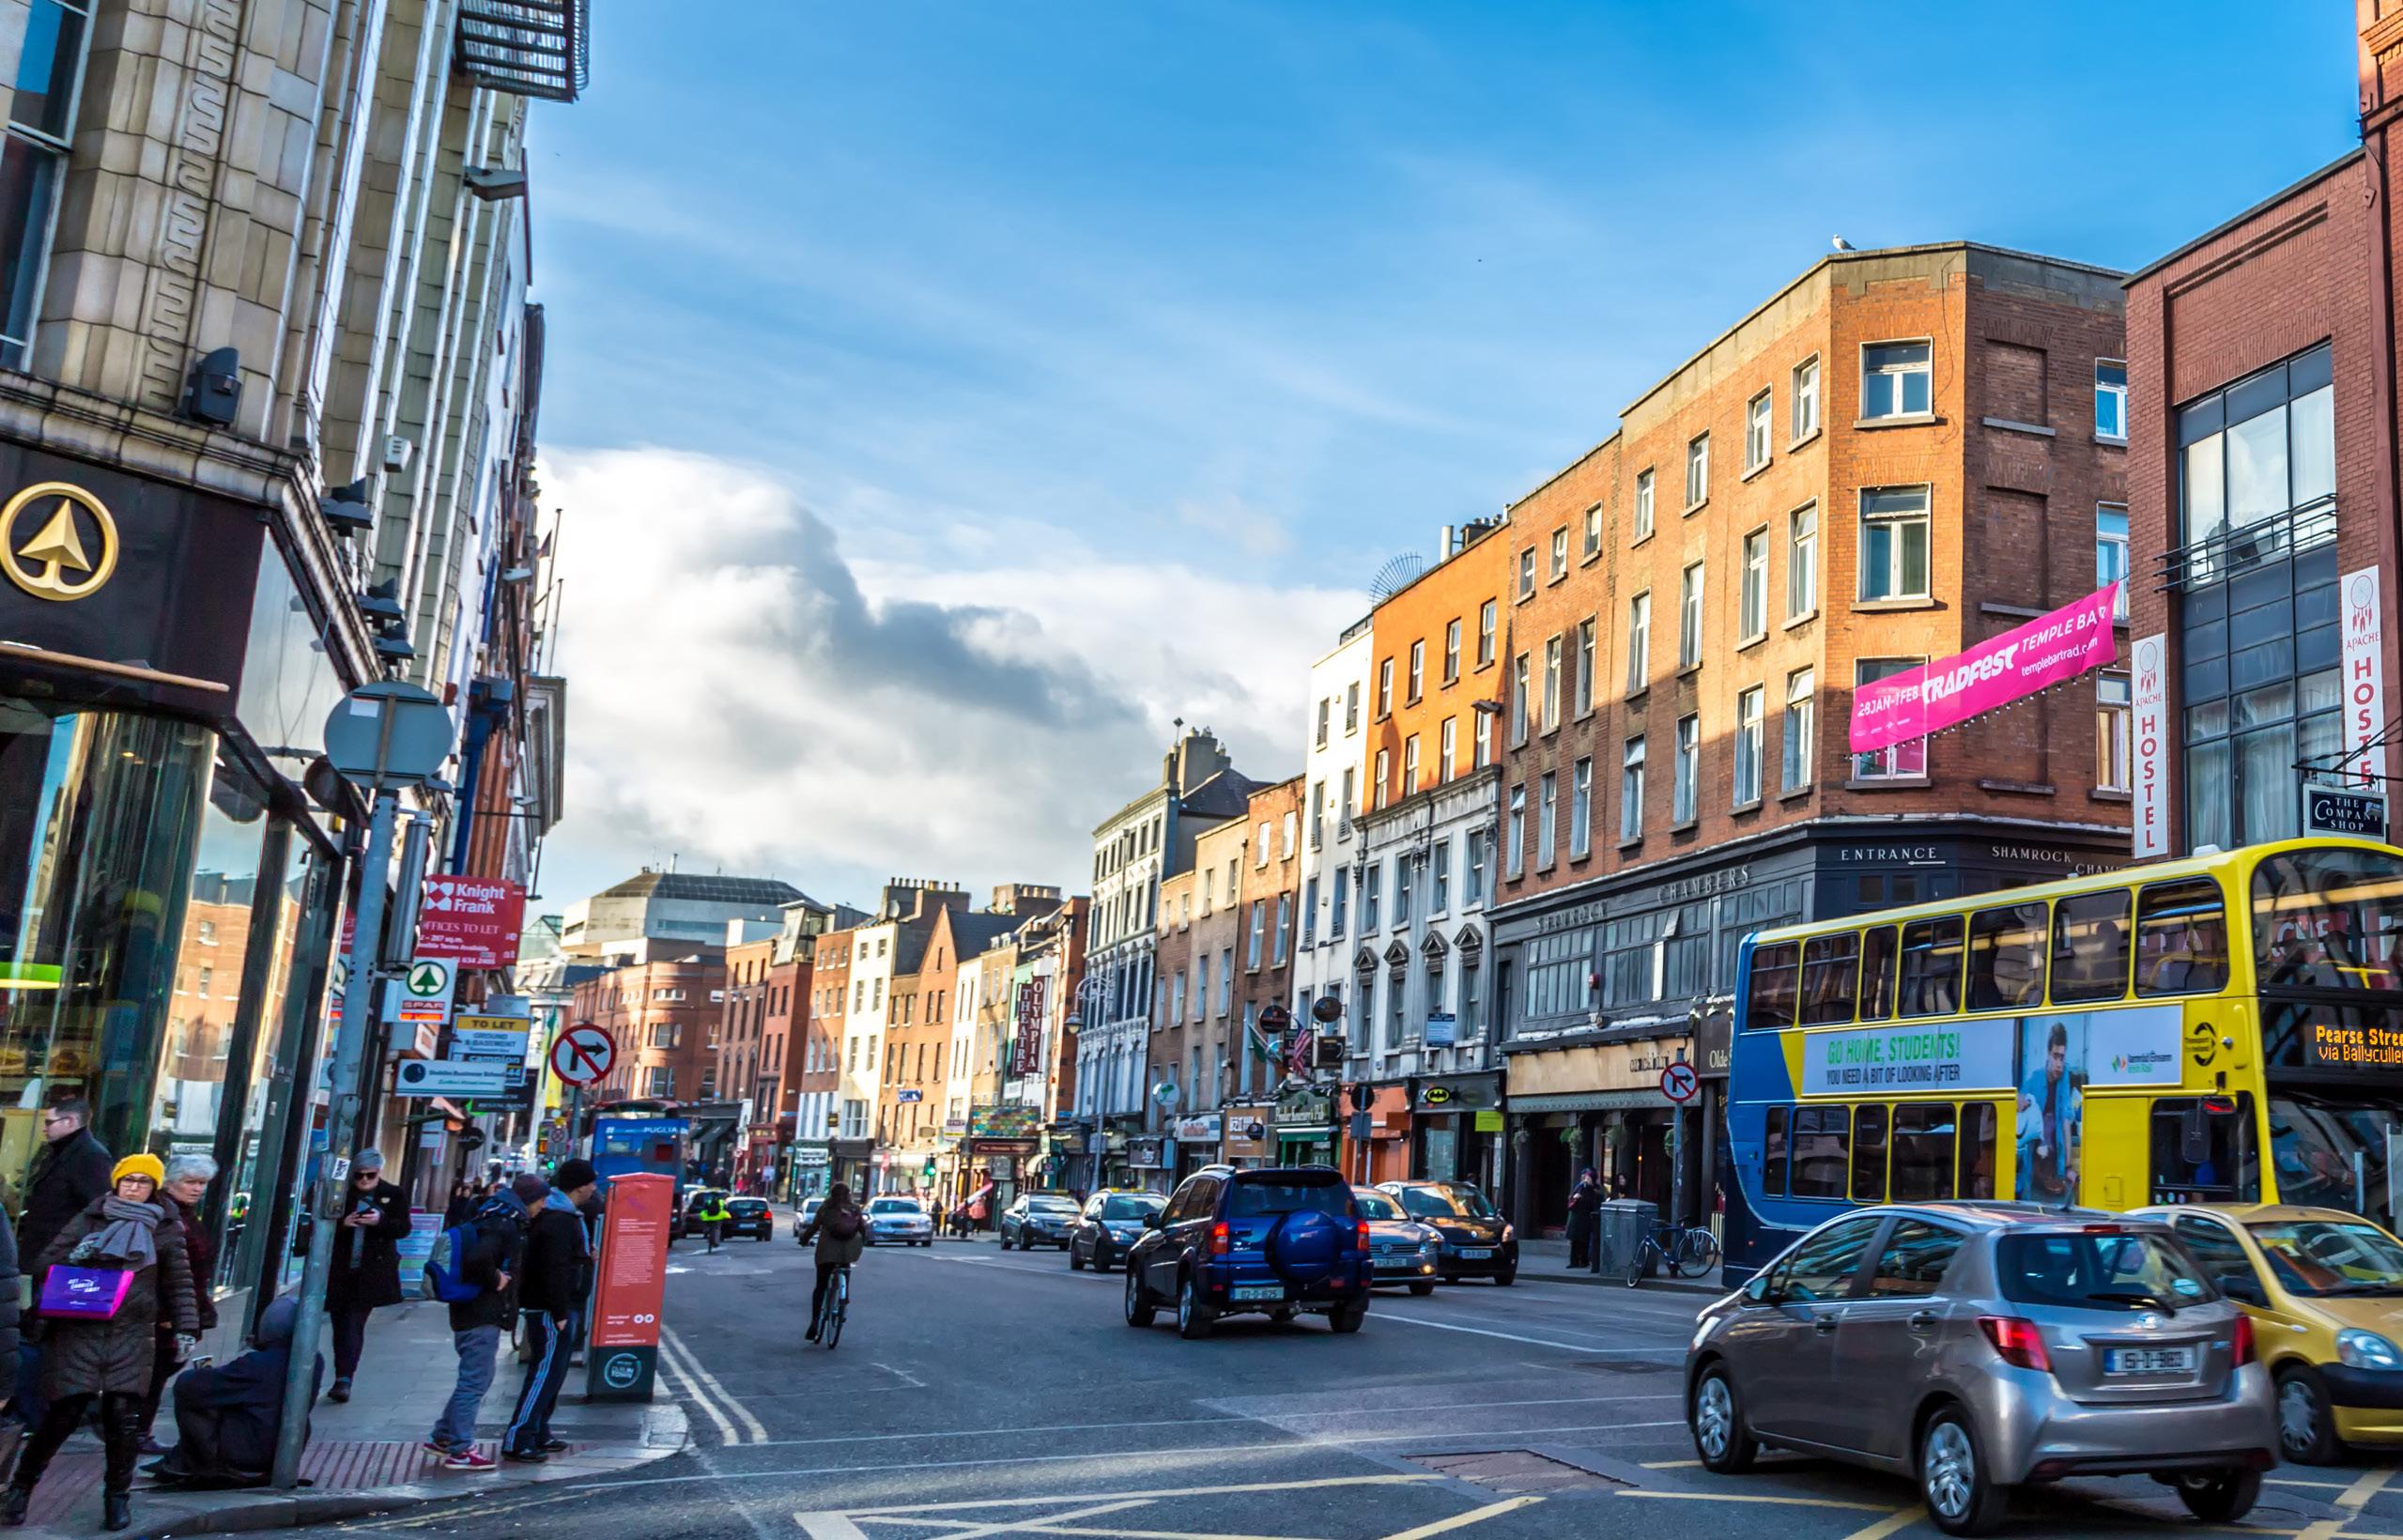
Grafton Street holds the most appeal of any area in Dublin with three quarters of those surveyed ranking it number 1. The George’s Street Vicinity (60%) showed strongly in second place, just ahead of Henry Street (57%). However, while George’s Street appeals to younger age groups, Henry Street’s appeal is skewed to the older demographic, reflecting the development of George’s Street as a social hub.
Spending trends suggest that consumers are feeling confident with approximately 30% of people indicating that they are spending more on shopping and eating out in the last year. This falls to 18% for the pub. Encouragingly, the majority of people are not anticipating any change in their spending in the next 12 months.
Public transport is vital with over half (53%) of all shoppers using it to access the City. Within this the bus is the most popular choice. The car lags behind at 24%. Indeed cars in general have lost ground since a similar survey in 2011 when parking issues topped suggestions for improving the shopping experience in Dublin. Now “more pedestrian friendly” is the top suggestion.
Overall, the survey showed that the impression of the City is positive with 89% agreeing that Dublin has a vibrant city centre. However, on the downside, while the majority still feel safe, some people are feeling less safe by day than in 2011 (from 76% to 72%). Interestingly, while only 40% feel safe in the city at night, this has not changed.
The online threat does not appear to have materialised substantially yet amongst the shoppers surveyed. On average 30% of respondents never buy books, electronics or fashion items online. Meanwhile only 10% indicated that they frequently bought groceries online compared to 30% in the UK . What has caught on is Research Online Buy Offline (ROBO) with 55% people embracing this behaviour, a trend that has been seen globally for some time with Google reporting an 80% rate in 2011.
There has been much discussion about the threat posed to traditional retail by technology. The relatively low online penetration rates in Dublin indicate that opportunities still exist. In addition, the survey shows that people still like to shop and socialise in areas which offer variety and value coupled with multiple dining options. This demand for “social shopping” will see innovative retailers thrive.
When it comes to shopping, there is widespread agreement that the City has a good selection of unique and independent retailers (70%) but loyalty to local shops is in decline, particularly amongst younger people.”

Originally launched in October 2010 the Your Dublin Your Voice is an initiative of Dublin City Council that gives Dubliners a unique opportunity to provide opinions and views on what they love, like and would be glad to see improved in the capital. Anyone can sign up to the opinion panel at http://bit.ly/ydyvreg and have their say on a range of issues that impact on the quality of life in Dublin, there are currently c.3,700 panellists. The survey tool provides an effective mechanism for local government to engage with the users of the City and potentially help to inform policy for the region.
SUGGESTED IMPROVEMENTS FOR DUBLIN 2011 VERSUS 2018

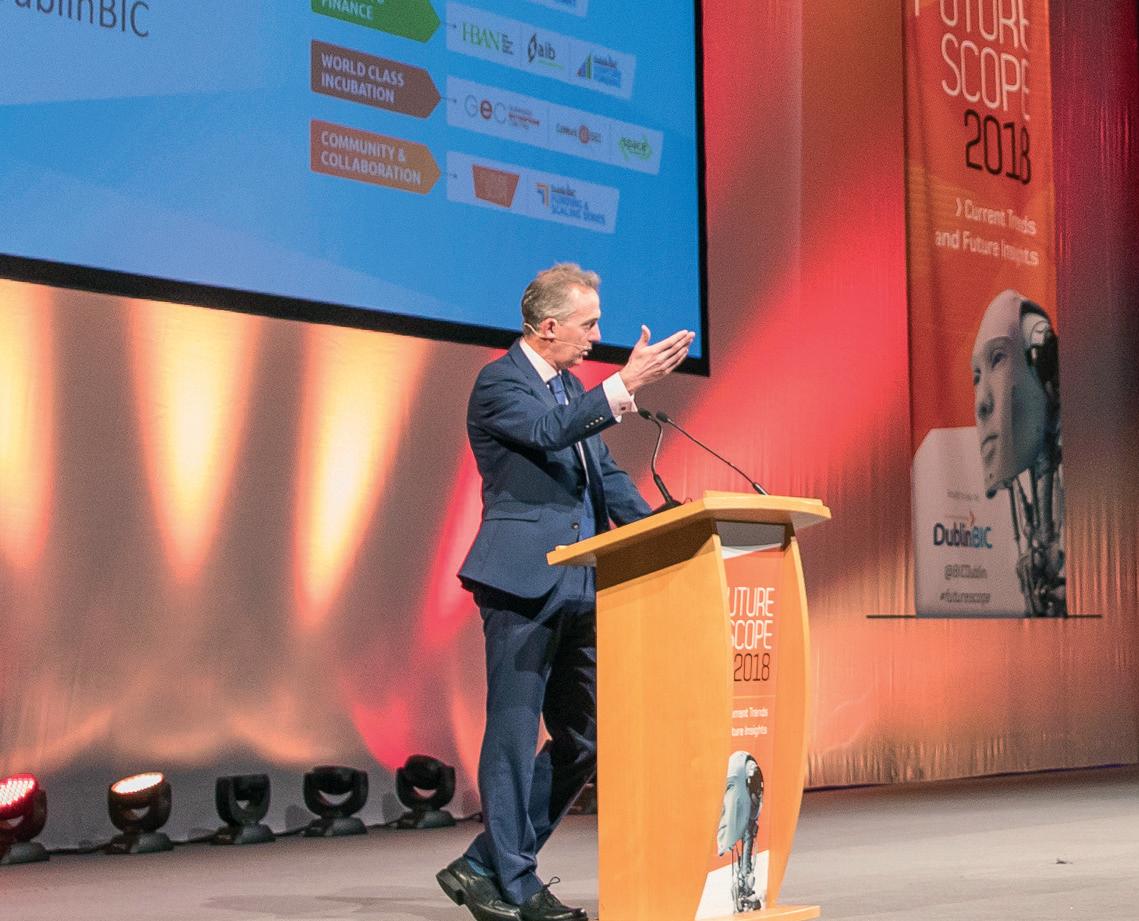
BY DAVID FITZSIMONS GROUP CHIEF EXECUTIVE RETAIL EXCELENCE

It is indisputable that retail globally is in a state of flux, but what are the key challenges facing the retail sector and how are they being addressed?
I recently attended a Global Retail Council in New York and across fifty countries worldwide the issues being identified are the same. Migration of spend online, taxation equity and the non-application of VAT and customs duty on internationally bought goods, the need to rethink bricks and mortar and the significant war for talent in retail.
Interpreting these issues for Ireland, some things remain very clear. Approximately €6 billion will be spent online by Irish citizens in 2019. Of this over 70% will leave the country to such websites as Amazon.co.uk. This might be seen as a challenge by many, and don’t get me wrong it is a challenge, that said, Irish retailers can also use online to internationalise and take on the world. Across Europe in 2019 €650 billion will be spend by EU citizens. Irish merchants need to become more ambitious in their sales strategy and endeavour to sell into international markets. Here to fore there has been no specific Governmental support provided to retailers. That changed in late 2018 when Enterprise Ireland announced a €1.25m fund for merchants with international online potential. We understand that this fund has been oversubscribed and that phase two funding is likely to be announced in March.
Retail sales were reported to be trading like for like down in Q4 2018, with VISA suggesting that ‘face to face’ shopping was back 4.5%. This is a concern for all towns and cities across the country. Without footfall, retail and hospitality operators will struggle. In that regard local Government and business stakeholders need to work together to stem the tide. We need to work on three pillars of successful town and city revival.
Approximately €6 billion will be spent online by Irish citizens in 2019. Of this over 70% will leave the country to such websites as Amazon.co.uk”
1 2
We need to do everything possible to deliver the very best retail and hospitality offer;
We need to deliver public realm standards that are impeccable. In that regard, we need to look at the standards that Kildare Village deliver and aim to achieve this standard and finally;
3
We need to improve our citizen engagement and give people great reasons to visit towns and cities. This might involve events and festivals which always have a hugely positive impact on footfall and spend.
Which brings us to Dublin City. I would suggest the outlook generally for Dublin is a positive one. The retail mix and footprint is world leading and Dublin remains a primary destination from a city break perspective. That said some issues exist. The primary issue is accommodation costs in the city and suburbs. We have many members who are reporting staff requests to leave the city and be transferred to other stores around the country. The reason? Accommodation costs.
Many cities around the world are embracing the consumer trend where people want midweek convenience and weekend experience. In that regard, Dublin City needs to be as accessible and frictionless as possible and also consider building meaningful weekend experiences. The city must also embrace the visitor opportunity. While more hotel bedrooms are in the pipeline, the city needs to work hard to capture as much visitor spend as possible. In that regard, Retail Excellence has been calling for the implementation of coach parking facilities in places such as Nassau Street. This would greatly increase the productivity of the street curb, stop long-term parking in the area and ensure that visitors are dropped off in the inner core of the city.
The future offers many challenges but should all stakeholders come together, manage the city as if it were Kildare Village or any other professionally managed retail scheme, I am sure the capital has a very bright and prosperous future.
Note: These "petrol gauge" charts present the performance of the particular indicator relative to a range of performances from most positive (green) to least positive (red). Each gauge presents the latest value compared to the peak value and the trough value over the last decade (except for public transport trips which cover the past 5 years and housing completions which cover the past 6 years). The Commercial Property gauges are red at the high and low extremes, in recognition of the undesirability of rents that


∂ Perspectives on emerging technologies and how they will shape our future world, providing crucial insights to ambitious businesses


COLLABORATION


INNOVATION


∂ Exploring collaboration opportunities within the broader technology and start-up ecosystems


∂ Access the most relevant global and Irish innovations from start-ups, research centres and corporates

ENTREPRENEURSHIP
ENTREPRENEURSHIP STAGE


∂ Highlighting opportunities, accessing finance, scaling internationally, investor panels and start-up pitches


Tickets include access to the four stages, breakout sessions, future tech showcase & networking lunch