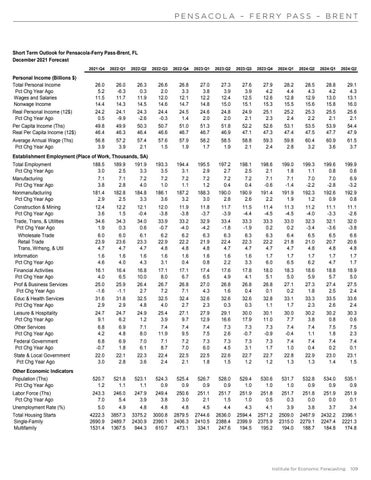
P ensacola – F err y P ass – B rent
Short Term Outlook for Pensacola-Ferry Pass-Brent, FL December 2021 Forecast 2021:Q4
2022:Q1
2022:Q2
2022:Q3
2022:Q4
2023:Q1
2023:Q2
2023:Q3
2023:Q4
2024:Q1
2024:Q2
2024:Q1
2024:Q2
Personal Income (Billions $) Total Personal Income Pct Chg Year Ago Wages and Salaries Nonwage Income
26.0 5.2 11.5 14.4
26.0 -6.3 11.7 14.3
26.3 0.3 11.9 14.5
26.6 2.0 12.0 14.6
26.8 3.3 12.1 14.7
27.0 3.8 12.2 14.8
27.3 3.9 12.4 15.0
27.6 3.9 12.5 15.1
27.9 4.2 12.6 15.3
28.2 4.4 12.8 15.5
28.5 4.3 12.9 15.6
28.8 4.2 13.0 15.8
29.1 4.3 13.1 16.0
Real Personal Income (12$) Pct Chg Year Ago
24.2 0.5
24.1 -9.9
24.3 -2.6
24.4 -0.3
24.5 1.4
24.6 2.0
24.8 2.0
24.9 2.1
25.1 2.3
25.2 2.4
25.3 2.2
25.5 2.1
25.6 2.1
Per Capita Income (Ths) Real Per Capita Income (12$)
49.8 46.4
49.9 46.3
50.3 46.4
50.7 46.6
51.0 46.7
51.3 46.7
51.8 46.9
52.2 47.1
52.6 47.3
53.1 47.4
53.5 47.5
53.9 47.7
54.4 47.9
Average Annual Wage (Ths) Pct Chg Year Ago
56.8 3.9
57.2 3.9
57.4 2.1
57.6 1.5
57.9 1.9
58.2 1.7
58.5 1.9
58.8 2.1
59.3 2.4
59.8 2.8
60.4 3.2
60.9 3.6
61.5 3.7
Establishment Employment (Place of Work, Thousands, SA) Total Employment Pct Chg Year Ago
188.5 3.0
189.9 2.5
191.9 3.3
193.3 3.5
194.4 3.1
195.5 2.9
197.2 2.7
198.1 2.5
198.6 2.1
199.0 1.8
199.3 1.1
199.6 0.8
199.9 0.6
Manufacturing Pct Chg Year Ago
7.1 3.8
7.1 2.8
7.2 4.0
7.2 1.0
7.2 1.1
7.2 1.2
7.2 0.4
7.2 0.4
7.1 -0.6
7.1 -1.4
7.0 -2.2
7.0 -2.8
6.9 -3.2
Nonmanufacturing Pct Chg Year Ago
181.4 2.9
182.8 2.5
184.8 3.3
186.1 3.6
187.2 3.2
188.3 3.0
190.0 2.8
190.9 2.6
191.4 2.2
191.9 1.9
192.3 1.2
192.6 0.9
192.9 0.8
Construction & Mining Pct Chg Year Ago
12.4 3.6
12.2 1.5
12.1 -0.4
12.0 -3.8
11.9 -3.8
11.8 -3.7
11.7 -3.9
11.5 -4.4
11.4 -4.5
11.3 -4.5
11.2 -4.0
11.1 -3.3
11.1 -2.6
Trade, Trans, & Utilities Pct Chg Year Ago
34.6 1.9
34.3 0.3
34.0 0.6
33.9 -0.7
33.2 -4.0
32.9 -4.2
33.4 -1.8
33.3 -1.9
33.3 0.2
33.0 0.2
32.3 -3.4
32.1 -3.6
32.0 -3.8
Wholesale Trade Retail Trade Trans, Wrhsng, & Util
6.0 23.9 4.7
6.0 23.6 4.7
6.1 23.3 4.7
6.2 22.9 4.8
6.2 22.2 4.8
6.3 21.9 4.8
6.3 22.4 4.7
6.3 22.3 4.7
6.3 22.2 4.7
6.4 21.8 4.7
6.5 21.0 4.8
6.5 20.7 4.8
6.6 20.6 4.8
Information Pct Chg Year Ago
1.6 4.6
1.6 4.0
1.6 4.3
1.6 3.1
1.6 0.4
1.6 0.8
1.6 2.2
1.6 3.3
1.7 6.0
1.7 6.5
1.7 6.2
1.7 4.7
1.7 1.7
Financial Activities Pct Chg Year Ago
16.1 4.0
16.4 6.5
16.8 10.0
17.1 8.0
17.1 6.7
17.4 6.5
17.6 4.9
17.8 4.1
18.0 5.1
18.3 5.0
18.6 5.9
18.8 5.7
18.9 5.0
Prof & Business Services Pct Chg Year Ago
25.0 -1.6
25.9 -1.1
26.4 2.7
26.7 7.2
26.8 7.1
27.0 4.3
26.8 1.6
26.8 0.4
26.8 0.1
27.1 0.2
27.3 1.8
27.4 2.5
27.5 2.4
Educ & Health Services Pct Chg Year Ago
31.6 2.9
31.8 2.9
32.5 4.8
32.5 4.0
32.4 2.7
32.6 2.3
32.6 0.3
32.6 0.3
32.8 1.1
33.1 1.7
33.3 2.3
33.5 2.6
33.6 2.4
Leisure & Hospitality Pct Chg Year Ago
24.7 9.1
24.7 6.2
24.9 1.2
25.4 3.9
27.1 9.7
27.9 12.9
29.1 16.6
30.0 17.9
30.1 11.0
30.0 7.7
30.2 3.8
30.2 0.8
30.3 0.6
6.8 4.2
6.9 4.8
7.1 8.0
7.4 11.9
7.4 9.5
7.4 7.5
7.3 2.6
7.3 -0.7
7.3 -0.9
7.4 -0.4
7.4 1.1
7.5 1.8
7.5 2.3
Federal Government Pct Chg Year Ago
6.8 -0.7
6.9 1.8
7.0 6.1
7.1 8.7
7.2 7.0
7.3 6.0
7.3 4.5
7.3 3.1
7.3 1.7
7.4 1.0
7.4 0.4
7.4 0.2
7.4 0.1
State & Local Government Pct Chg Year Ago
22.0 3.0
22.1 2.8
22.3 3.6
22.4 2.4
22.5 2.1
22.5 1.8
22.6 1.5
22.7 1.2
22.7 1.2
22.8 1.3
22.9 1.3
23.0 1.4
23.1 1.5
Population (Ths) Pct Chg Year Ago
520.7 1.2
521.8 1.1
523.1 1.1
524.3 0.9
525.4 0.9
526.7 0.9
528.0 0.9
529.4 1.0
530.6 1.0
531.7 1.0
532.8 0.9
534.0 0.9
535.1 0.9
Labor Force (Ths) Pct Chg Year Ago
243.3 7.0
246.0 5.4
247.9 3.9
249.4 3.8
250.6 3.0
251.1 2.1
251.7 1.5
251.9 1.0
251.8 0.5
251.7 0.3
251.8 0.0
251.9 0.0
251.9 0.1
Other Services Pct Chg Year Ago
Other Economic Indicators
Unemployment Rate (%) Total Housing Starts Single-Family Multifamily
5.0
4.9
4.8
4.8
4.8
4.5
4.4
4.3
4.1
3.9
3.8
3.7
3.4
4222.3 2690.9 1531.4
3857.3 2489.7 1367.5
3375.2 2430.9 944.3
3000.8 2390.1 610.7
2879.5 2406.3 473.1
2744.6 2410.5 334.1
2636.0 2388.4 247.6
2594.4 2399.9 194.5
2571.2 2375.9 195.2
2509.0 2315.0 194.0
2467.9 2279.1 188.7
2432.2 2247.4 184.8
2396.1 2221.3 174.8
Institute for Economic Forecasting
109