Master Plan, CRA/SOC
Town of Southington, CT
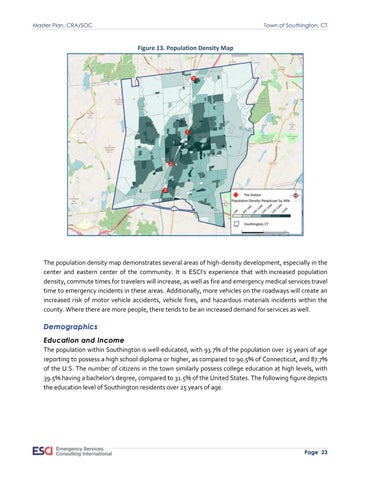
Figure 13. Population Density Map
The population density map demonstrates several areas of high-density development, especially in the center and eastern center of the community. It is ESCI’s experience that with increased population density, commute times for travelers will increase, as well as fire and emergency medical services travel time to emergency incidents in these areas. Additionally, more vehicles on the roadways will create an increased risk of motor vehicle accidents, vehicle fires, and hazardous materials incidents within the county. Where there are more people, there tends to be an increased demand for services as well.
Demographics Education and Income The population within Southington is well-educated, with 93.7% of the population over 25 years of age reporting to possess a high school diploma or higher, as compared to 90.5% of Connecticut, and 87.7% of the U.S. The number of citizens in the town similarly possess college education at high levels, with 39.5% having a bachelor’s degree, compared to 31.5% of the United States. The following figure depicts the education level of Southington residents over 25 years of age.
Page 23