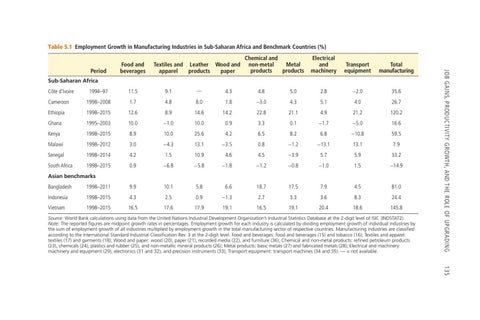
Table 5.1 Employment Growth in Manufacturing Industries in Sub-Saharan Africa and Benchmark Countries (%) Textiles and Leather Wood and apparel products paper
Chemical and non-metal Metal products products
Electrical and machinery
Transport equipment
Total manufacturing
Sub-Saharan Africa 1994–97
11.5
9.1
—
4.3
4.8
5.0
2.8
−2.0
35.6
Cameroon
1998–2008
1.7
4.8
8.0
1.8
−3.0
4.3
5.1
4.0
26.7
Ethiopia
1998–2015
12.6
8.9
14.6
14.2
22.8
21.1
4.9
21.2
120.2
Ghana
1995–2003
10.0
−1.0
10.0
0.9
3.3
0.1
−1.7
−5.0
16.6
Kenya
1998–2015
8.9
10.0
25.6
4.2
6.5
8.2
6.8
−10.8
59.5
Côte d’Ivoire
Malawi
1998–2012
3.0
−4.3
13.1
−3.5
0.8
−1.2
−13.1
13.1
7.9
Senegal
1998–2014
4.2
1.5
10.9
4.6
4.5
−3.9
5.7
5.9
33.2
South Africa
1998–2015
0.9
−6.8
−5.8
−1.8
−1.2
−0.8
−1.0
1.5
−14.9
9.9
10.1
5.8
6.6
18.7
17.5
7.9
4.5
81.0
Asian benchmarks Bangladesh
1998–2011
Indonesia
1998–2015
4.3
2.5
0.9
−1.3
2.7
3.3
3.6
8.3
24.4
Vietnam
1998–2015
16.5
17.6
17.9
19.1
16.5
19.1
20.4
18.6
145.8
Source: World Bank calculations using data from the United Nations Industrial Development Organization’s Industrial Statistics Database at the 2-digit level of ISIC (INDSTAT2). Note: The reported figures are midpoint growth rates in percentages. Employment growth for each industry is calculated by dividing employment growth of individual industries by the sum of employment growth of all industries multiplied by employment growth in the total manufacturing sector of respective countries. Manufacturing industries are classified according to the International Standard Industrial Classification Rev. 3 at the 2‐digit level: Food and beverages: food and beverages (15) and tobacco (16); Textiles and apparel: textiles (17) and garments (18); Wood and paper: wood (20), paper (21), recorded media (22), and furniture (36); Chemical and non-metal products: refined petroleum products (23), chemicals (24), plastics and rubber (25), and non-metallic mineral products (26); Metal products: basic metals (27) and fabricated metals (28); Electrical and machinery: machinery and equipment (29), electronics (31 and 32), and precision instruments (33); Transport equipment: transport machines (34 and 35). — = not available.
JOB GAINS, PRODUCTIVITY GROWTH, AND THE ROLE OF UPGRADING 135
Period
Food and beverages