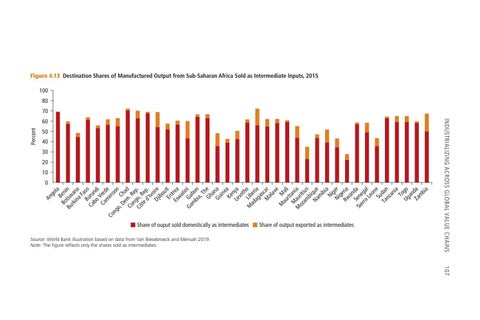
Figure 4.13 Destination Shares of Manufactured Output from Sub-Saharan Africa Sold as Intermediate Inputs, 2015 100 80 70 Percent
50 40 30 20 10
An
go l Be a Bo ni t Bu sw n rk an ina a Fa B so Ca uru bo nd i Ca Verd m e er Co oo ng n o, De Cha m Co . R d n e Cô go, p. te Re d' p. Ivo Dj ire ibo u Er ti itr Es ea wa ti Ga Ga ni m bo bia n ,T h Gh e an Gu a ine Ke a n Le ya so th M Lib o ad er ag ia as M car ala wi M M au al ri i M tani M aur a oz it am ius bi Na que m ibi a Ni g Ni er ge Rw ria an d Sie Sene a rra ga Le l on Su e Ta dan nz an ia To g Ug o an Za da m bia
0
Share of ouput sold domestically as intermediates Source: World Bank illustration based on data from Van Biesebroeck and Mensah 2019. Note: The figure reflects only the shares sold as intermediates.
Share of output exported as intermediates
Industrializing across Global Value Chains 107
60