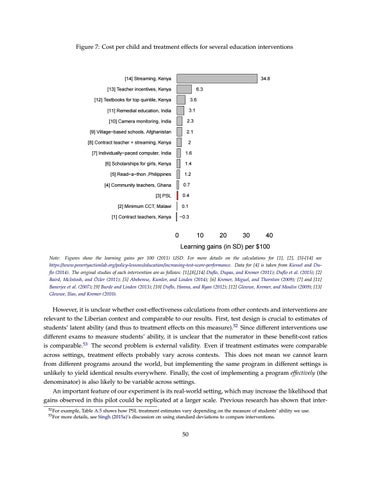
Figure 7: Cost per child and treatment effects for several education interventions
34.8
[14] Streaming, Kenya 6.3
[13] Teacher incentives, Kenya [12] Textbooks for top quintile, Kenya
3.6
[11] Remedial education, India
3.1
[10] Camera monitoring, India
2.3
[9] Village−based schools, Afghanistan
2.1
[8] Contract teacher + streaming, Kenya
2
[7] Individually−paced computer, India
1.6
[6] Scholarships for girls, Kenya
1.4
[5] Read−a−thon ,Philippines
1.2
[4] Community teachers, Ghana
0.7
[3] PSL
0.4
[2] Minimum CCT, Malawi
0.1
[1] Contract teachers, Kenya
−0.3
0
10
20
30
40
Learning gains (in SD) per $100 Note: Figures show the learning gains per 100 (2011) USD. For more details on the calculations for [1], [2], [5]-[14] see https://www.povertyactionlab.org/policy-lessons/education/increasing-test-score-performance. Data for [4] is taken from Kiessel and Duflo (2014). The original studies of each intervention are as follows: [1],[8],[14] Duflo, Dupas, and Kremer (2011); Duflo et al. (2015); [2] Baird, McIntosh, and Özler (2011); [5] Abeberese, Kumler, and Linden (2014); [6] Kremer, Miguel, and Thornton (2009); [7] and [11] Banerjee et al. (2007); [9] Burde and Linden (2013); [10] Duflo, Hanna, and Ryan (2012); [12] Glewwe, Kremer, and Moulin (2009); [13] Glewwe, Ilias, and Kremer (2010).
However, it is unclear whether cost-effectiveness calculations from other contexts and interventions are relevant to the Liberian context and comparable to our results. First, test design is crucial to estimates of students’ latent ability (and thus to treatment effects on this measure).52 Since different interventions use different exams to measure students’ ability, it is unclear that the numerator in these benefit-cost ratios is comparable.53 The second problem is external validity. Even if treatment estimates were comparable across settings, treatment effects probably vary across contexts. This does not mean we cannot learn from different programs around the world, but implementing the same program in different settings is unlikely to yield identical results everywhere. Finally, the cost of implementing a program effectively (the denominator) is also likely to be variable across settings. An important feature of our experiment is its real-world setting, which may increase the likelihood that gains observed in this pilot could be replicated at a larger scale. Previous research has shown that inter52 For 53 For
example, Table A.5 shows how PSL treatment estimates vary depending on the measure of students’ ability we use. more details, see Singh (2015a)’s discussion on using standard deviations to compare interventions.
50
