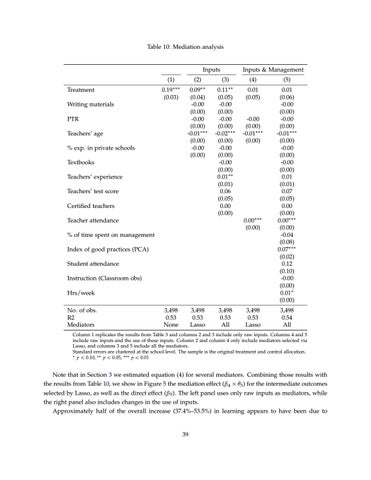
Table 10: Mediation analysis
Inputs Treatment
Inputs & Management
(1)
(2)
(3)
(4)
(5)
0.19∗∗∗
0.09∗∗
0.11∗∗
(0.03)
(0.04) -0.00 (0.00) -0.00 (0.00) -0.01∗∗∗ (0.00) -0.00 (0.00)
(0.05) -0.00 (0.00) -0.00 (0.00) -0.02∗∗∗ (0.00) -0.00 (0.00) -0.00 (0.00) 0.01∗∗ (0.01) 0.06 (0.05) 0.00 (0.00)
0.01 (0.05)
0.01 (0.06) -0.00 (0.00) -0.00 (0.00) -0.01∗∗∗ (0.00) -0.00 (0.00) -0.00 (0.00) 0.01 (0.01) 0.07 (0.05) 0.00 (0.00) 0.00∗∗∗ (0.00) -0.04 (0.08) 0.07∗∗∗ (0.02) 0.12 (0.10) -0.00 (0.00) 0.01∗ (0.00)
Writing materials PTR Teachers’ age % exp. in private schools Textbooks Teachers’ experience Teachers’ test score Certified teachers Teacher attendance
-0.00 (0.00) -0.01∗∗∗ (0.00)
0.00∗∗∗ (0.00)
% of time spent on management Index of good practices (PCA) Student attendance Instruction (Classroom obs) Hrs/week No. of obs. R2 Mediators
3,498 0.53 None
3,498 0.53 Lasso
3,498 0.53 All
3,498 0.53 Lasso
3,498 0.54 All
Column 1 replicates the results from Table 3 and columns 2 and 3 include only raw inputs. Columns 4 and 5 include raw inputs and the use of these inputs. Column 2 and column 4 only include mediators selected via Lasso, and columns 3 and 5 include all the mediators. Standard errors are clustered at the school level. The sample is the original treatment and control allocation. ∗ p < 0.10, ∗∗ p < 0.05, ∗∗∗ p < 0.01
Note that in Section 3 we estimated equation (4) for several mediators. Combining those results with the results from Table 10, we show in Figure 5 the mediation effect (β 4 × θ5 ) for the intermediate outcomes selected by Lasso, as well as the direct effect (β 5 ). The left panel uses only raw inputs as mediators, while the right panel also includes changes in the use of inputs. Approximately half of the overall increase (37.4%–53.5%) in learning appears to have been due to
39