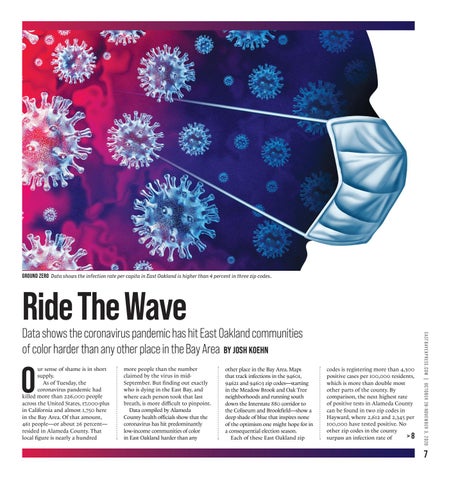
GROUND ZERO Data shows the infection rate per capita in East Oakland is higher than 4 percent in three zip codes.
Ride The Wave O
ur sense of shame is in short supply. As of Tuesday, the coronavirus pandemic had killed more than 226,000 people across the United States, 17,000-plus in California and almost 1,750 here in the Bay Area. Of that amount, 461 people—or about 26 percent— resided in Alameda County. That local figure is nearly a hundred
more people than the number claimed by the virus in midSeptember. But finding out exactly who is dying in the East Bay, and where each person took that last breath, is more difficult to pinpoint. Data compiled by Alameda County health officials show that the coronavirus has hit predominantly low-income communities of color in East Oakland harder than any
other place in the Bay Area. Maps that track infections in the 94601, 94621 and 94603 zip codes—starting in the Meadow Brook and Oak Tree neighborhoods and running south down the Interstate 880 corridor to the Coliseum and Brookfield—show a deep shade of blue that inspires none of the optimism one might hope for in a consequential election season. Each of these East Oakland zip
codes is registering more than 4,300 positive cases per 100,000 residents, which is more than double most other parts of the county. By comparison, the next highest rate of positive tests in Alameda County can be found in two zip codes in Hayward, where 2,612 and 2,345 per 100,000 have tested positive. No other zip codes in the county >8 surpass an infection rate of
E A S T B AY E X P R E S S . C O M | O C T O B E R 2 8 - N O V E M B E R 3 , 2 0 2 0
Data shows the coronavirus pandemic has hit East Oakland communities of color harder than any other place in the Bay Area BY JOSH KOEHN
7


