OmniTrans Bus Stop Safety Improvement Plan

Page 210

Bus Stop Safety Improvement Plan

5.6 Implementation Framework Omnitrans serves numerous cities and unincorporated areas where transit routes routinely cross jurisdictional boundaries. Addressing personal safety is the primary goal of this plan, coordinating planning and implementing projects between local jurisdictions and Omnitrans is necessary for improving bus stop conditions and accessibility. Several cities in the Omnitrans service area have completed or have ongoing active transportation planning efforts for improving bicycle and pedestrian safety as well as first and last mile planning. Coordination between these agencies, Omnitrans and regional agencies such as SBCTA is needed to create a seamless and consistent framework for reducing bicycle and pedestrian related collisions and encouraging transit use. While bus stop amenities are under the purview of Omnitrans, the surrounding infrastructure is the responsibility of the local jurisdiction. Efforts should continue to be made to improve the overall bicycle and pedestrian network that encourages people of all ages and abilities to access public transit. From an infrastructure perspective, the Existing Conditions chapter analyzed collision data from the nine Census Tract study areas to find trends and high-collision rate corridors where infrastructure improvements can be made. Eighty-one percent of reported bicycle related collisions occurred on roadways that did not have designated bike lanes with the primary cause being bicyclists riding on the wrong side of the road. All the pedestrian related collisions occurred along high speed and high-volume roadways where there are long blocks with limited crossing locations. Limited safe crossing locations in conjunction with pedestrian desire lines to reach destinations can lead to unsafe crossings and more crashes. In general, pedestrian non-compliance increases with relative detour, as well as delay at intersections. Delays exceeding 40 seconds at signalized crosswalks and 20 seconds at unsignalized or yield-controlled crosswalks can cause risk-taking behavior and increase crashes. There are numerous strategies to assist people walking. Countdown signals and shorter cycle lengths can help to increase compliance, and may be paired with other strategies. Shorter cycle lengths also tend to increase motorist safety due to increasing 198

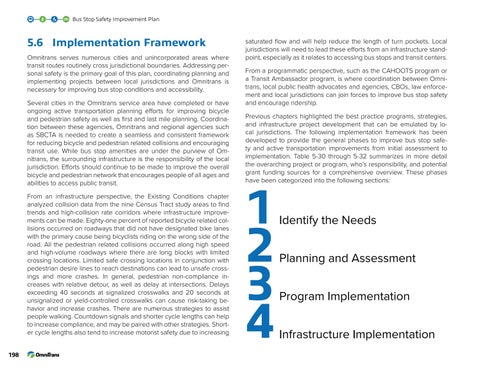
saturated flow and will help reduce the length of turn pockets. Local jurisdictions will need to lead these efforts from an infrastructure standpoint, especially as it relates to accessing bus stops and transit centers. From a programmatic perspective, such as the CAHOOTS program or a Transit Ambassador program, is where coordination between Omnitrans, local public health advocates and agencies, CBOs, law enforcement and local jurisdictions can join forces to improve bus stop safety and encourage ridership. Previous chapters highlighted the best practice programs, strategies, and infrastructure project development that can be emulated by local jurisdictions. The following implementation framework has been developed to provide the general phases to improve bus stop safety and active transportation improvements from initial assessment to implementation. Table 5-30 through 5-32 summarizes in more detail the overarching project or program, who’s responsibility, and potential grant funding sources for a comprehensive overview. These phases have been categorized into the following sections:

1 2 3 4

Identify the Needs Planning and Assessment Program Implementation Infrastructure Implementation

Turn static files into dynamic content formats.

Create a flipbook

Articles inside

Implementation

1min
pages 215-217

Table 5-32: Implementation Chart - Program Implementation Table 5-33: Implementation Chart - Infrastructure

3min
pages 213-214

Table 5-29: Census Tract 9 Bus Stop Improvements

2min
page 208

Table 5-30: Implementation Chart - Identify the Needs Table 5-31: Implementation Chart - Planning and

1min
page 211

5.6 Implementation Framework

2min
page 210

Assessment

1min
page 212

Table 5-28: Census Tract 9 Bicycle Improvements

1min
page 206

Figure 5-26: Census Tract 9 Pedestrian Recommendations

1min
page 205

Table 5-27: Census Tract 9 Pedestrian Improvements

1min
page 204

Figure 5-25: Census Tract 8 Bus Stop Recommendations

1min
page 203

Table 5-24: Census Tract 8 Pedestrian Improvements

1min
page 198

Table 5-26: Census Tract 8 Bus Stop Improvements

2min
page 202

Table 5-23: Census Tract 7 Bus Stop Improvements

2min
page 196

Table 5-25: Census Tract 8 Bicycle Improvements

1min
page 200

Figure 5-20: Census Tract 7 Pedestrian Recommendations

1min
page 193

Table 5-22: Census Tract 7 Bicycle Improvements

1min
page 194

Table 5-21: Census Tract 7 Pedestrian Improvements

1min
page 192

Table 5-20: Census Tract 6 Bus Stop Improvements

2min
page 190

Table 5-19: Census Tract 6 Bicycle Improvements

1min
page 188

Figure 5-17: Census Tract 6 Pedestrian Recommendations

1min
page 187

Table 5-18: Census Tract 6 Pedestrian Improvements

1min
page 186

Figure 5-16: Census Tract 5 Bus Stop Recommendations

1min
page 185

Figure 5-15: Census Tract 5 Bicycle Recommendations

1min
page 183

Table 5-17: Census Tract 5 Bus Stop Improvements

1min
page 184

Table 5-16: Census Tract 5 Bicycle Improvements

1min
page 182

Figure 5-14: Census Tract 5 Pedestrian Recommendations

1min
page 181

Table 5-15: Census Tract 5 Pedestrian Improvements

2min
page 180

Table 5-13: Census Tract 4 Bicycle Improvements

1min
page 176

Table 5-14: Census Tract 4 Bus Stop Improvements

2min
page 178

Figure 5-11: Census Tract 4 Pedestrian Recommendations

1min
page 175

Table 5-11: Census Tract 3 Bus Stop Improvements

1min
page 172

Table 5-12: Census Tract 4 Pedestrian Improvements

1min
page 174

Figure 5-8: Census Tract 3 Pedestrian Recommendations

1min
page 169

Table 5-9: Census Tract 3 Pedestrian Improvements

1min
page 168

Figure 5-7: Census Tract 2 Bus Stop Recommendations

1min
page 167

Table 5-8: Census Tract 2 Bus Stop Improvements

1min
page 166

Figure 5-4: Census Tract 1 Bus Stop Recommendations

1min
page 161

Figure 5-5: Census Tract 2 Pedestrian Recommendations

1min
page 163

Table 5-7: Census Tract 2 Bicycle Improvements

1min
page 164

Table 5-6: Census Tract 2 Pedestrian Improvements

1min
page 162

Table 5-5: Census Tract 1 Bus Stop Improvements

1min
page 160

4.6 Personal Safety Best Practices

33min
pages 127-143

Table 5-4: Census Tract 1 Bicycle Improvements

1min
page 158

5.3 Prioritization Analysis

8min
pages 149-151

Table 5-3: Census Tract 1 Pedestrian Improvements

1min
page 156

Guidelines

2min
page 144

5.4 Prioritized Bus Stop Access Project Types

2min
page 152

Figure 5-2: Census Tract 1 Pedestrian Recommendations

1min
page 157

Figure 4-6: Fatalities per Billion Passenger Miles Traveled 21

3min
pages 125-126

Figure 4-5: Median Treatment to Discourage Unsafe Pedestrian Midblock Crossing21

4min
pages 123-124

4.5 Best Practices Research

4min
pages 118-119

Figure 4-4: Strategy to Reduce Crime and Reduce Fear that Reduces Transit Ridership15

6min
pages 120-122

4.4 Traffic Calming

2min
pages 116-117

Crime 6

15min
pages 106-113

4.2 Bicycle and Pedestrian Solutions

5min
pages 104-105

4.1 Barriers and Solutions Overview

3min
pages 102-103

Figure 3-3: Virtual Audit Interactive Map

1min
page 92

3.9 Results from Outreach Events

7min
pages 96-101

2.7 Policy and Planning Context

19min
pages 76-87

3.4 Stakeholder Interviews and Outreach Events

4min
page 90

Figure 3-2: Omnitrans Virtual Audit Bus Stops Tour

1min
page 91

Figure 2-29: Census Tracts 6-9 Existing Bicycle Facilities

2min
pages 73-74

Figure 2-26: Census Tract 5 Existing Bicycle Facilities

2min
pages 67-68

Figure 2-27: Census Tract 5 Existing Pedestrian Facilities

1min
pages 69-70

Figure 2-23: Census Tract 4 Existing Bicycle Facilities

2min
pages 61-62

Figure 2-20: Census Tract 3 Existing Bicycle Facilities

2min
pages 55-56

Figure 2-24: Census Tract 4 Existing Pedestrian Facilities

1min
pages 63-64

Figure 2-21: Census Tract 3 Existing Pedestrian Facilities

1min
pages 57-58

Figure 2-18: Census Tract 2 Existing Pedestrian Facilities

1min
pages 51-52

Figure 2-17: Census Tract 2 Existing Bicycle Facilities

1min
pages 49-50

Figure 2-15: Census Tract 1 Existing Pedestrian Facilities

1min
pages 45-46

1.3 Omnitrans’ Ridership Characteristics

1min
pages 15-16

2.4 Bicycle Facilities

1min
page 36

Figure 2-16: Census Tract 2 Land Uses

1min
pages 47-48

Figure 2-1: Omnitrans’ Service Area

2min
pages 19-20

Figure 2-14: Census Tract 1 Existing Bicycle Facilities

2min
pages 43-44

Table 2-4: Collision Analysis per Census Tract16 Table 4-1: How Transit Improvements Can Reduce Urban

1min
page 25

2.3 Land Use

1min
page 32
Issuu converts static files into: digital portfolios, online yearbooks, online catalogs, digital photo albums and more. Sign up and create your flipbook.
OmniTrans Bus Stop Safety Improvement Plan by KTUA - Issuu