OmniTrans Bus Stop Safety Improvement Plan

Page 204

Bus Stop Safety Improvement Plan

Census Tract 9

Highland Avenue at Eucalyptus Drive

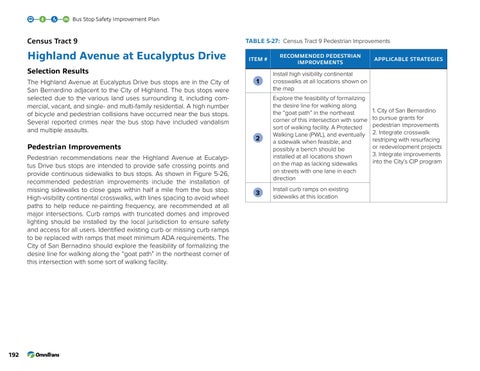
Table 5-27: Census Tract 9 Pedestrian Improvements ITEM #

RECOMMENDED PEDESTRIAN IMPROVEMENTS

1

Install high visibility continental crosswalks at all locations shown on the map

2

Explore the feasibility of formalizing the desire line for walking along the “goat path” in the northeast corner of this intersection with some sort of walking facility. A Protected Walking Lane (PWL), and eventually a sidewalk when feasible, and possibly a bench should be installed at all locations shown on the map as lacking sidewalks on streets with one lane in each direction

3

Install curb ramps on existing sidewalks at this location

Selection Results The Highland Avenue at Eucalyptus Drive bus stops are in the City of San Bernardino adjacent to the City of Highland. The bus stops were selected due to the various land uses surrounding it, including commercial, vacant, and single- and multi-family residential. A high number of bicycle and pedestrian collisions have occurred near the bus stops. Several reported crimes near the bus stop have included vandalism and multiple assaults.

Pedestrian Improvements Pedestrian recommendations near the Highland Avenue at Eucalyptus Drive bus stops are intended to provide safe crossing points and provide continuous sidewalks to bus stops. As shown in Figure 5-26, recommended pedestrian improvements include the installation of missing sidewalks to close gaps within half a mile from the bus stop. High-visibility continental crosswalks, with lines spacing to avoid wheel paths to help reduce re-painting frequency, are recommended at all major intersections. Curb ramps with truncated domes and improved lighting should be installed by the local jurisdiction to ensure safety and access for all users. Identified existing curb or missing curb ramps to be replaced with ramps that meet minimum ADA requirements. The City of San Bernadino should explore the feasibility of formalizing the desire line for walking along the “goat path” in the northeast corner of this intersection with some sort of walking facility.

192

APPLICABLE STRATEGIES

1. City of San Bernardino to pursue grants for pedestrian improvements 2. Integrate crosswalk restriping with resurfacing or redevelopment projects 3. Integrate improvements into the City’s CIP program


Turn static files into dynamic content formats.

Create a flipbook

Articles inside

Implementation

1min
pages 215-217

Table 5-32: Implementation Chart - Program Implementation Table 5-33: Implementation Chart - Infrastructure

3min
pages 213-214

Table 5-29: Census Tract 9 Bus Stop Improvements

2min
page 208

Table 5-30: Implementation Chart - Identify the Needs Table 5-31: Implementation Chart - Planning and

1min
page 211

5.6 Implementation Framework

2min
page 210

Assessment

1min
page 212

Table 5-28: Census Tract 9 Bicycle Improvements

1min
page 206

Figure 5-26: Census Tract 9 Pedestrian Recommendations

1min
page 205

Table 5-27: Census Tract 9 Pedestrian Improvements

1min
page 204

Figure 5-25: Census Tract 8 Bus Stop Recommendations

1min
page 203

Table 5-24: Census Tract 8 Pedestrian Improvements

1min
page 198

Table 5-26: Census Tract 8 Bus Stop Improvements

2min
page 202

Table 5-23: Census Tract 7 Bus Stop Improvements

2min
page 196

Table 5-25: Census Tract 8 Bicycle Improvements

1min
page 200

Figure 5-20: Census Tract 7 Pedestrian Recommendations

1min
page 193

Table 5-22: Census Tract 7 Bicycle Improvements

1min
page 194

Table 5-21: Census Tract 7 Pedestrian Improvements

1min
page 192

Table 5-20: Census Tract 6 Bus Stop Improvements

2min
page 190

Table 5-19: Census Tract 6 Bicycle Improvements

1min
page 188

Figure 5-17: Census Tract 6 Pedestrian Recommendations

1min
page 187

Table 5-18: Census Tract 6 Pedestrian Improvements

1min
page 186

Figure 5-16: Census Tract 5 Bus Stop Recommendations

1min
page 185

Figure 5-15: Census Tract 5 Bicycle Recommendations

1min
page 183

Table 5-17: Census Tract 5 Bus Stop Improvements

1min
page 184

Table 5-16: Census Tract 5 Bicycle Improvements

1min
page 182

Figure 5-14: Census Tract 5 Pedestrian Recommendations

1min
page 181

Table 5-15: Census Tract 5 Pedestrian Improvements

2min
page 180

Table 5-13: Census Tract 4 Bicycle Improvements

1min
page 176

Table 5-14: Census Tract 4 Bus Stop Improvements

2min
page 178

Figure 5-11: Census Tract 4 Pedestrian Recommendations

1min
page 175

Table 5-11: Census Tract 3 Bus Stop Improvements

1min
page 172

Table 5-12: Census Tract 4 Pedestrian Improvements

1min
page 174

Figure 5-8: Census Tract 3 Pedestrian Recommendations

1min
page 169

Table 5-9: Census Tract 3 Pedestrian Improvements

1min
page 168

Figure 5-7: Census Tract 2 Bus Stop Recommendations

1min
page 167

Table 5-8: Census Tract 2 Bus Stop Improvements

1min
page 166

Figure 5-4: Census Tract 1 Bus Stop Recommendations

1min
page 161

Figure 5-5: Census Tract 2 Pedestrian Recommendations

1min
page 163

Table 5-7: Census Tract 2 Bicycle Improvements

1min
page 164

Table 5-6: Census Tract 2 Pedestrian Improvements

1min
page 162

Table 5-5: Census Tract 1 Bus Stop Improvements

1min
page 160

4.6 Personal Safety Best Practices

33min
pages 127-143

Table 5-4: Census Tract 1 Bicycle Improvements

1min
page 158

5.3 Prioritization Analysis

8min
pages 149-151

Table 5-3: Census Tract 1 Pedestrian Improvements

1min
page 156

Guidelines

2min
page 144

5.4 Prioritized Bus Stop Access Project Types

2min
page 152

Figure 5-2: Census Tract 1 Pedestrian Recommendations

1min
page 157

Figure 4-6: Fatalities per Billion Passenger Miles Traveled 21

3min
pages 125-126

Figure 4-5: Median Treatment to Discourage Unsafe Pedestrian Midblock Crossing21

4min
pages 123-124

4.5 Best Practices Research

4min
pages 118-119

Figure 4-4: Strategy to Reduce Crime and Reduce Fear that Reduces Transit Ridership15

6min
pages 120-122

4.4 Traffic Calming

2min
pages 116-117

Crime 6

15min
pages 106-113

4.2 Bicycle and Pedestrian Solutions

5min
pages 104-105

4.1 Barriers and Solutions Overview

3min
pages 102-103

Figure 3-3: Virtual Audit Interactive Map

1min
page 92

3.9 Results from Outreach Events

7min
pages 96-101

2.7 Policy and Planning Context

19min
pages 76-87

3.4 Stakeholder Interviews and Outreach Events

4min
page 90

Figure 3-2: Omnitrans Virtual Audit Bus Stops Tour

1min
page 91

Figure 2-29: Census Tracts 6-9 Existing Bicycle Facilities

2min
pages 73-74

Figure 2-26: Census Tract 5 Existing Bicycle Facilities

2min
pages 67-68

Figure 2-27: Census Tract 5 Existing Pedestrian Facilities

1min
pages 69-70

Figure 2-23: Census Tract 4 Existing Bicycle Facilities

2min
pages 61-62

Figure 2-20: Census Tract 3 Existing Bicycle Facilities

2min
pages 55-56

Figure 2-24: Census Tract 4 Existing Pedestrian Facilities

1min
pages 63-64

Figure 2-21: Census Tract 3 Existing Pedestrian Facilities

1min
pages 57-58

Figure 2-18: Census Tract 2 Existing Pedestrian Facilities

1min
pages 51-52

Figure 2-17: Census Tract 2 Existing Bicycle Facilities

1min
pages 49-50

Figure 2-15: Census Tract 1 Existing Pedestrian Facilities

1min
pages 45-46

1.3 Omnitrans’ Ridership Characteristics

1min
pages 15-16

2.4 Bicycle Facilities

1min
page 36

Figure 2-16: Census Tract 2 Land Uses

1min
pages 47-48

Figure 2-1: Omnitrans’ Service Area

2min
pages 19-20

Figure 2-14: Census Tract 1 Existing Bicycle Facilities

2min
pages 43-44

Table 2-4: Collision Analysis per Census Tract16 Table 4-1: How Transit Improvements Can Reduce Urban

1min
page 25

2.3 Land Use

1min
page 32
Issuu converts static files into: digital portfolios, online yearbooks, online catalogs, digital photo albums and more. Sign up and create your flipbook.