OmniTrans Bus Stop Safety Improvement Plan

Page 156

Bus Stop Safety Improvement Plan

Census Tract 1

Fontana Transit Center

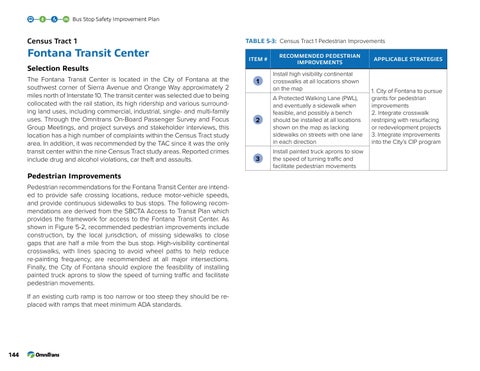
Table 5-3: Census Tract 1 Pedestrian Improvements ITEM #

Selection Results The Fontana Transit Center is located in the City of Fontana at the southwest corner of Sierra Avenue and Orange Way approximately 2 miles north of Interstate 10. The transit center was selected due to being collocated with the rail station, its high ridership and various surrounding land uses, including commercial, industrial, single- and multi-family uses. Through the Omnitrans On-Board Passenger Survey and Focus Group Meetings, and project surveys and stakeholder interviews, this location has a high number of complaints within the Census Tract study area. In addition, it was recommended by the TAC since it was the only transit center within the nine Census Tract study areas. Reported crimes include drug and alcohol violations, car theft and assaults.

Pedestrian Improvements Pedestrian recommendations for the Fontana Transit Center are intended to provide safe crossing locations, reduce motor-vehicle speeds, and provide continuous sidewalks to bus stops. The following recommendations are derived from the SBCTA Access to Transit Plan which provides the framework for access to the Fontana Transit Center. As shown in Figure 5-2, recommended pedestrian improvements include construction, by the local jurisdiction, of missing sidewalks to close gaps that are half a mile from the bus stop. High-visibility continental crosswalks, with lines spacing to avoid wheel paths to help reduce re-painting frequency, are recommended at all major intersections. Finally, the City of Fontana should explore the feasibility of installing painted truck aprons to slow the speed of turning traffic and facilitate pedestrian movements. If an existing curb ramp is too narrow or too steep they should be replaced with ramps that meet minimum ADA standards.

144

RECOMMENDED PEDESTRIAN IMPROVEMENTS

1

Install high visibility continental crosswalks at all locations shown on the map

2

A Protected Walking Lane (PWL), and eventually a sidewalk when feasible, and possibly a bench should be installed at all locations shown on the map as lacking sidewalks on streets with one lane in each direction

3

Install painted truck aprons to slow the speed of turning traffic and facilitate pedestrian movements

APPLICABLE STRATEGIES

1. City of Fontana to pursue grants for pedestrian improvements 2. Integrate crosswalk restriping with resurfacing or redevelopment projects 3. Integrate improvements into the City’s CIP program


Turn static files into dynamic content formats.

Create a flipbook

Articles inside

Implementation

1min
pages 215-217

Table 5-32: Implementation Chart - Program Implementation Table 5-33: Implementation Chart - Infrastructure

3min
pages 213-214

Table 5-29: Census Tract 9 Bus Stop Improvements

2min
page 208

Table 5-30: Implementation Chart - Identify the Needs Table 5-31: Implementation Chart - Planning and

1min
page 211

5.6 Implementation Framework

2min
page 210

Assessment

1min
page 212

Table 5-28: Census Tract 9 Bicycle Improvements

1min
page 206

Figure 5-26: Census Tract 9 Pedestrian Recommendations

1min
page 205

Table 5-27: Census Tract 9 Pedestrian Improvements

1min
page 204

Figure 5-25: Census Tract 8 Bus Stop Recommendations

1min
page 203

Table 5-24: Census Tract 8 Pedestrian Improvements

1min
page 198

Table 5-26: Census Tract 8 Bus Stop Improvements

2min
page 202

Table 5-23: Census Tract 7 Bus Stop Improvements

2min
page 196

Table 5-25: Census Tract 8 Bicycle Improvements

1min
page 200

Figure 5-20: Census Tract 7 Pedestrian Recommendations

1min
page 193

Table 5-22: Census Tract 7 Bicycle Improvements

1min
page 194

Table 5-21: Census Tract 7 Pedestrian Improvements

1min
page 192

Table 5-20: Census Tract 6 Bus Stop Improvements

2min
page 190

Table 5-19: Census Tract 6 Bicycle Improvements

1min
page 188

Figure 5-17: Census Tract 6 Pedestrian Recommendations

1min
page 187

Table 5-18: Census Tract 6 Pedestrian Improvements

1min
page 186

Figure 5-16: Census Tract 5 Bus Stop Recommendations

1min
page 185

Figure 5-15: Census Tract 5 Bicycle Recommendations

1min
page 183

Table 5-17: Census Tract 5 Bus Stop Improvements

1min
page 184

Table 5-16: Census Tract 5 Bicycle Improvements

1min
page 182

Figure 5-14: Census Tract 5 Pedestrian Recommendations

1min
page 181

Table 5-15: Census Tract 5 Pedestrian Improvements

2min
page 180

Table 5-13: Census Tract 4 Bicycle Improvements

1min
page 176

Table 5-14: Census Tract 4 Bus Stop Improvements

2min
page 178

Figure 5-11: Census Tract 4 Pedestrian Recommendations

1min
page 175

Table 5-11: Census Tract 3 Bus Stop Improvements

1min
page 172

Table 5-12: Census Tract 4 Pedestrian Improvements

1min
page 174

Figure 5-8: Census Tract 3 Pedestrian Recommendations

1min
page 169

Table 5-9: Census Tract 3 Pedestrian Improvements

1min
page 168

Figure 5-7: Census Tract 2 Bus Stop Recommendations

1min
page 167

Table 5-8: Census Tract 2 Bus Stop Improvements

1min
page 166

Figure 5-4: Census Tract 1 Bus Stop Recommendations

1min
page 161

Figure 5-5: Census Tract 2 Pedestrian Recommendations

1min
page 163

Table 5-7: Census Tract 2 Bicycle Improvements

1min
page 164

Table 5-6: Census Tract 2 Pedestrian Improvements

1min
page 162

Table 5-5: Census Tract 1 Bus Stop Improvements

1min
page 160

4.6 Personal Safety Best Practices

33min
pages 127-143

Table 5-4: Census Tract 1 Bicycle Improvements

1min
page 158

5.3 Prioritization Analysis

8min
pages 149-151

Table 5-3: Census Tract 1 Pedestrian Improvements

1min
page 156

Guidelines

2min
page 144

5.4 Prioritized Bus Stop Access Project Types

2min
page 152

Figure 5-2: Census Tract 1 Pedestrian Recommendations

1min
page 157

Figure 4-6: Fatalities per Billion Passenger Miles Traveled 21

3min
pages 125-126

Figure 4-5: Median Treatment to Discourage Unsafe Pedestrian Midblock Crossing21

4min
pages 123-124

4.5 Best Practices Research

4min
pages 118-119

Figure 4-4: Strategy to Reduce Crime and Reduce Fear that Reduces Transit Ridership15

6min
pages 120-122

4.4 Traffic Calming

2min
pages 116-117

Crime 6

15min
pages 106-113

4.2 Bicycle and Pedestrian Solutions

5min
pages 104-105

4.1 Barriers and Solutions Overview

3min
pages 102-103

Figure 3-3: Virtual Audit Interactive Map

1min
page 92

3.9 Results from Outreach Events

7min
pages 96-101

2.7 Policy and Planning Context

19min
pages 76-87

3.4 Stakeholder Interviews and Outreach Events

4min
page 90

Figure 3-2: Omnitrans Virtual Audit Bus Stops Tour

1min
page 91

Figure 2-29: Census Tracts 6-9 Existing Bicycle Facilities

2min
pages 73-74

Figure 2-26: Census Tract 5 Existing Bicycle Facilities

2min
pages 67-68

Figure 2-27: Census Tract 5 Existing Pedestrian Facilities

1min
pages 69-70

Figure 2-23: Census Tract 4 Existing Bicycle Facilities

2min
pages 61-62

Figure 2-20: Census Tract 3 Existing Bicycle Facilities

2min
pages 55-56

Figure 2-24: Census Tract 4 Existing Pedestrian Facilities

1min
pages 63-64

Figure 2-21: Census Tract 3 Existing Pedestrian Facilities

1min
pages 57-58

Figure 2-18: Census Tract 2 Existing Pedestrian Facilities

1min
pages 51-52

Figure 2-17: Census Tract 2 Existing Bicycle Facilities

1min
pages 49-50

Figure 2-15: Census Tract 1 Existing Pedestrian Facilities

1min
pages 45-46

1.3 Omnitrans’ Ridership Characteristics

1min
pages 15-16

2.4 Bicycle Facilities

1min
page 36

Figure 2-16: Census Tract 2 Land Uses

1min
pages 47-48

Figure 2-1: Omnitrans’ Service Area

2min
pages 19-20

Figure 2-14: Census Tract 1 Existing Bicycle Facilities

2min
pages 43-44

Table 2-4: Collision Analysis per Census Tract16 Table 4-1: How Transit Improvements Can Reduce Urban

1min
page 25

2.3 Land Use

1min
page 32
Issuu converts static files into: digital portfolios, online yearbooks, online catalogs, digital photo albums and more. Sign up and create your flipbook.
OmniTrans Bus Stop Safety Improvement Plan by KTUA - Issuu