OmniTrans Bus Stop Safety Improvement Plan

Page 15

Introduction

01

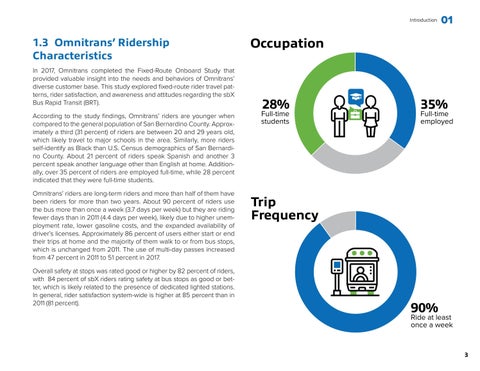
1.3 Omnitrans’ Ridership Characteristics In 2017, Omnitrans completed the Fixed-Route Onboard Study that provided valuable insight into the needs and behaviors of Omnitrans’ diverse customer base. This study explored fixed-route rider travel patterns, rider satisfaction, and awareness and attitudes regarding the sbX Bus Rapid Transit (BRT). According to the study findings, Omnitrans’ riders are younger when compared to the general population of San Bernardino County. Approximately a third (31 percent) of riders are between 20 and 29 years old, which likely travel to major schools in the area. Similarly, more riders self-identify as Black than U.S. Census demographics of San Bernardino County. About 21 percent of riders speak Spanish and another 3 percent speak another language other than English at home. Additionally, over 35 percent of riders are employed full-time, while 28 percent indicated that they were full-time students. Omnitrans’ riders are long-term riders and more than half of them have been riders for more than two years. About 90 percent of riders use the bus more than once a week (3.7 days per week) but they are riding fewer days than in 2011 (4.4 days per week), likely due to higher unemployment rate, lower gasoline costs, and the expanded availability of driver’s licenses. Approximately 86 percent of users either start or end their trips at home and the majority of them walk to or from bus stops, which is unchanged from 2011. The use of multi-day passes increased from 47 percent in 2011 to 51 percent in 2017. Overall safety at stops was rated good or higher by 82 percent of riders, with 84 percent of sbX riders rating safety at bus stops as good or better, which is likely related to the presence of dedicated lighted stations. In general, rider satisfaction system-wide is higher at 85 percent than in 2011 (81 percent).

3


Turn static files into dynamic content formats.

Create a flipbook

Articles inside

Implementation

1min
pages 215-217

Table 5-32: Implementation Chart - Program Implementation Table 5-33: Implementation Chart - Infrastructure

3min
pages 213-214

Table 5-29: Census Tract 9 Bus Stop Improvements

2min
page 208

Table 5-30: Implementation Chart - Identify the Needs Table 5-31: Implementation Chart - Planning and

1min
page 211

5.6 Implementation Framework

2min
page 210

Assessment

1min
page 212

Table 5-28: Census Tract 9 Bicycle Improvements

1min
page 206

Figure 5-26: Census Tract 9 Pedestrian Recommendations

1min
page 205

Table 5-27: Census Tract 9 Pedestrian Improvements

1min
page 204

Figure 5-25: Census Tract 8 Bus Stop Recommendations

1min
page 203

Table 5-24: Census Tract 8 Pedestrian Improvements

1min
page 198

Table 5-26: Census Tract 8 Bus Stop Improvements

2min
page 202

Table 5-23: Census Tract 7 Bus Stop Improvements

2min
page 196

Table 5-25: Census Tract 8 Bicycle Improvements

1min
page 200

Figure 5-20: Census Tract 7 Pedestrian Recommendations

1min
page 193

Table 5-22: Census Tract 7 Bicycle Improvements

1min
page 194

Table 5-21: Census Tract 7 Pedestrian Improvements

1min
page 192

Table 5-20: Census Tract 6 Bus Stop Improvements

2min
page 190

Table 5-19: Census Tract 6 Bicycle Improvements

1min
page 188

Figure 5-17: Census Tract 6 Pedestrian Recommendations

1min
page 187

Table 5-18: Census Tract 6 Pedestrian Improvements

1min
page 186

Figure 5-16: Census Tract 5 Bus Stop Recommendations

1min
page 185

Figure 5-15: Census Tract 5 Bicycle Recommendations

1min
page 183

Table 5-17: Census Tract 5 Bus Stop Improvements

1min
page 184

Table 5-16: Census Tract 5 Bicycle Improvements

1min
page 182

Figure 5-14: Census Tract 5 Pedestrian Recommendations

1min
page 181

Table 5-15: Census Tract 5 Pedestrian Improvements

2min
page 180

Table 5-13: Census Tract 4 Bicycle Improvements

1min
page 176

Table 5-14: Census Tract 4 Bus Stop Improvements

2min
page 178

Figure 5-11: Census Tract 4 Pedestrian Recommendations

1min
page 175

Table 5-11: Census Tract 3 Bus Stop Improvements

1min
page 172

Table 5-12: Census Tract 4 Pedestrian Improvements

1min
page 174

Figure 5-8: Census Tract 3 Pedestrian Recommendations

1min
page 169

Table 5-9: Census Tract 3 Pedestrian Improvements

1min
page 168

Figure 5-7: Census Tract 2 Bus Stop Recommendations

1min
page 167

Table 5-8: Census Tract 2 Bus Stop Improvements

1min
page 166

Figure 5-4: Census Tract 1 Bus Stop Recommendations

1min
page 161

Figure 5-5: Census Tract 2 Pedestrian Recommendations

1min
page 163

Table 5-7: Census Tract 2 Bicycle Improvements

1min
page 164

Table 5-6: Census Tract 2 Pedestrian Improvements

1min
page 162

Table 5-5: Census Tract 1 Bus Stop Improvements

1min
page 160

4.6 Personal Safety Best Practices

33min
pages 127-143

Table 5-4: Census Tract 1 Bicycle Improvements

1min
page 158

5.3 Prioritization Analysis

8min
pages 149-151

Table 5-3: Census Tract 1 Pedestrian Improvements

1min
page 156

Guidelines

2min
page 144

5.4 Prioritized Bus Stop Access Project Types

2min
page 152

Figure 5-2: Census Tract 1 Pedestrian Recommendations

1min
page 157

Figure 4-6: Fatalities per Billion Passenger Miles Traveled 21

3min
pages 125-126

Figure 4-5: Median Treatment to Discourage Unsafe Pedestrian Midblock Crossing21

4min
pages 123-124

4.5 Best Practices Research

4min
pages 118-119

Figure 4-4: Strategy to Reduce Crime and Reduce Fear that Reduces Transit Ridership15

6min
pages 120-122

4.4 Traffic Calming

2min
pages 116-117

Crime 6

15min
pages 106-113

4.2 Bicycle and Pedestrian Solutions

5min
pages 104-105

4.1 Barriers and Solutions Overview

3min
pages 102-103

Figure 3-3: Virtual Audit Interactive Map

1min
page 92

3.9 Results from Outreach Events

7min
pages 96-101

2.7 Policy and Planning Context

19min
pages 76-87

3.4 Stakeholder Interviews and Outreach Events

4min
page 90

Figure 3-2: Omnitrans Virtual Audit Bus Stops Tour

1min
page 91

Figure 2-29: Census Tracts 6-9 Existing Bicycle Facilities

2min
pages 73-74

Figure 2-26: Census Tract 5 Existing Bicycle Facilities

2min
pages 67-68

Figure 2-27: Census Tract 5 Existing Pedestrian Facilities

1min
pages 69-70

Figure 2-23: Census Tract 4 Existing Bicycle Facilities

2min
pages 61-62

Figure 2-20: Census Tract 3 Existing Bicycle Facilities

2min
pages 55-56

Figure 2-24: Census Tract 4 Existing Pedestrian Facilities

1min
pages 63-64

Figure 2-21: Census Tract 3 Existing Pedestrian Facilities

1min
pages 57-58

Figure 2-18: Census Tract 2 Existing Pedestrian Facilities

1min
pages 51-52

Figure 2-17: Census Tract 2 Existing Bicycle Facilities

1min
pages 49-50

Figure 2-15: Census Tract 1 Existing Pedestrian Facilities

1min
pages 45-46

1.3 Omnitrans’ Ridership Characteristics

1min
pages 15-16

2.4 Bicycle Facilities

1min
page 36

Figure 2-16: Census Tract 2 Land Uses

1min
pages 47-48

Figure 2-1: Omnitrans’ Service Area

2min
pages 19-20

Figure 2-14: Census Tract 1 Existing Bicycle Facilities

2min
pages 43-44

Table 2-4: Collision Analysis per Census Tract16 Table 4-1: How Transit Improvements Can Reduce Urban

1min
page 25

2.3 Land Use

1min
page 32
Issuu converts static files into: digital portfolios, online yearbooks, online catalogs, digital photo albums and more. Sign up and create your flipbook.