OmniTrans Bus Stop Safety Improvement Plan

Page 120

Bus Stop Safety Improvement Plan

Development and redevelopment projects by local jurisdictions within the walkshed of a bus stop should also be reviewed for opportunities to rebuild damaged sidewalks or construct new ones where gaps exist, to provide more direct pedestrian networks, or improve the safety and environment of the overall pedestrian experience.13 In some cases, residents have opposed specific transit services, such as new lines and stations in their neighborhood, due to fears that improving low-income people’s access will increase crime rates.15 Several before-and-after studies indicate that new transit services do not generally increase total crime rates.15 They may attract more people and business activity which may increase local crimes, but crimes per transit passenger, total regional crime, and risks to individuals rarely increase.15

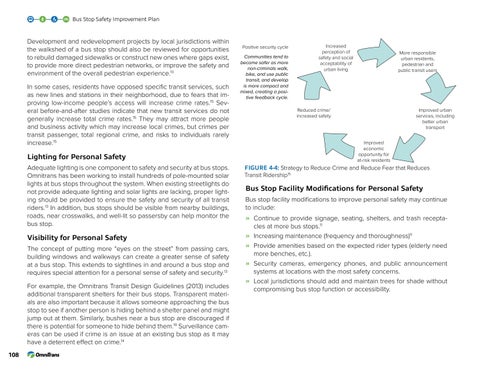
Positive security cycle Communities tend to become safer as more non-criminals walk, bike, and use public transit, and develop is more compact and mixed, creating a positive feedback cycle.

Visibility for Personal Safety The concept of putting more “eyes on the street” from passing cars, building windows and walkways can create a greater sense of safety at a bus stop. This extends to sightlines in and around a bus stop and requires special attention for a personal sense of safety and security.13 For example, the Omnitrans Transit Design Guidelines (2013) includes additional transparent shelters for their bus stops. Transparent materials are also important because it allows someone approaching the bus stop to see if another person is hiding behind a shelter panel and might jump out at them. Similarly, bushes near a bus stop are discouraged if there is potential for someone to hide behind them.19 Surveillance cameras can be used if crime is an issue at an existing bus stop as it may have a deterrent effect on crime.14 108

More responsible urban residents, pedestrian and public transit users

Reduced crime/ increased safety

Improved urban services, including better urban transport Improved economic opportunity for at-risk residents

Lighting for Personal Safety Adequate lighting is one component to safety and security at bus stops. Omnitrans has been working to install hundreds of pole-mounted solar lights at bus stops throughout the system. When existing streetlights do not provide adequate lighting and solar lights are lacking, proper lighting should be provided to ensure the safety and security of all transit riders.13 In addition, bus stops should be visible from nearby buildings, roads, near crosswalks, and well-lit so passersby can help monitor the bus stop.

Increased perception of safety and social acceptability of urban living

FIGURE 4-4: Strategy to Reduce Crime and Reduce Fear that Reduces Transit Ridership15

Bus Stop Facility Modifications for Personal Safety Bus stop facility modifications to improve personal safety may continue to include:

» Continue to provide signage, seating, shelters, and trash recepta» » » »

cles at more bus stops.11 Increasing maintenance (frequency and thoroughness)11 Provide amenities based on the expected rider types (elderly need more benches, etc.). Security cameras, emergency phones, and public announcement systems at locations with the most safety concerns. Local jurisdictions should add and maintain trees for shade without compromising bus stop function or accessibility.

Turn static files into dynamic content formats.

Create a flipbook

Articles inside

Implementation

1min
pages 215-217

Table 5-32: Implementation Chart - Program Implementation Table 5-33: Implementation Chart - Infrastructure

3min
pages 213-214

Table 5-29: Census Tract 9 Bus Stop Improvements

2min
page 208

Table 5-30: Implementation Chart - Identify the Needs Table 5-31: Implementation Chart - Planning and

1min
page 211

5.6 Implementation Framework

2min
page 210

Assessment

1min
page 212

Table 5-28: Census Tract 9 Bicycle Improvements

1min
page 206

Figure 5-26: Census Tract 9 Pedestrian Recommendations

1min
page 205

Table 5-27: Census Tract 9 Pedestrian Improvements

1min
page 204

Figure 5-25: Census Tract 8 Bus Stop Recommendations

1min
page 203

Table 5-24: Census Tract 8 Pedestrian Improvements

1min
page 198

Table 5-26: Census Tract 8 Bus Stop Improvements

2min
page 202

Table 5-23: Census Tract 7 Bus Stop Improvements

2min
page 196

Table 5-25: Census Tract 8 Bicycle Improvements

1min
page 200

Figure 5-20: Census Tract 7 Pedestrian Recommendations

1min
page 193

Table 5-22: Census Tract 7 Bicycle Improvements

1min
page 194

Table 5-21: Census Tract 7 Pedestrian Improvements

1min
page 192

Table 5-20: Census Tract 6 Bus Stop Improvements

2min
page 190

Table 5-19: Census Tract 6 Bicycle Improvements

1min
page 188

Figure 5-17: Census Tract 6 Pedestrian Recommendations

1min
page 187

Table 5-18: Census Tract 6 Pedestrian Improvements

1min
page 186

Figure 5-16: Census Tract 5 Bus Stop Recommendations

1min
page 185

Figure 5-15: Census Tract 5 Bicycle Recommendations

1min
page 183

Table 5-17: Census Tract 5 Bus Stop Improvements

1min
page 184

Table 5-16: Census Tract 5 Bicycle Improvements

1min
page 182

Figure 5-14: Census Tract 5 Pedestrian Recommendations

1min
page 181

Table 5-15: Census Tract 5 Pedestrian Improvements

2min
page 180

Table 5-13: Census Tract 4 Bicycle Improvements

1min
page 176

Table 5-14: Census Tract 4 Bus Stop Improvements

2min
page 178

Figure 5-11: Census Tract 4 Pedestrian Recommendations

1min
page 175

Table 5-11: Census Tract 3 Bus Stop Improvements

1min
page 172

Table 5-12: Census Tract 4 Pedestrian Improvements

1min
page 174

Figure 5-8: Census Tract 3 Pedestrian Recommendations

1min
page 169

Table 5-9: Census Tract 3 Pedestrian Improvements

1min
page 168

Figure 5-7: Census Tract 2 Bus Stop Recommendations

1min
page 167

Table 5-8: Census Tract 2 Bus Stop Improvements

1min
page 166

Figure 5-4: Census Tract 1 Bus Stop Recommendations

1min
page 161

Figure 5-5: Census Tract 2 Pedestrian Recommendations

1min
page 163

Table 5-7: Census Tract 2 Bicycle Improvements

1min
page 164

Table 5-6: Census Tract 2 Pedestrian Improvements

1min
page 162

Table 5-5: Census Tract 1 Bus Stop Improvements

1min
page 160

4.6 Personal Safety Best Practices

33min
pages 127-143

Table 5-4: Census Tract 1 Bicycle Improvements

1min
page 158

5.3 Prioritization Analysis

8min
pages 149-151

Table 5-3: Census Tract 1 Pedestrian Improvements

1min
page 156

Guidelines

2min
page 144

5.4 Prioritized Bus Stop Access Project Types

2min
page 152

Figure 5-2: Census Tract 1 Pedestrian Recommendations

1min
page 157

Figure 4-6: Fatalities per Billion Passenger Miles Traveled 21

3min
pages 125-126

Figure 4-5: Median Treatment to Discourage Unsafe Pedestrian Midblock Crossing21

4min
pages 123-124

4.5 Best Practices Research

4min
pages 118-119

Figure 4-4: Strategy to Reduce Crime and Reduce Fear that Reduces Transit Ridership15

6min
pages 120-122

4.4 Traffic Calming

2min
pages 116-117

Crime 6

15min
pages 106-113

4.2 Bicycle and Pedestrian Solutions

5min
pages 104-105

4.1 Barriers and Solutions Overview

3min
pages 102-103

Figure 3-3: Virtual Audit Interactive Map

1min
page 92

3.9 Results from Outreach Events

7min
pages 96-101

2.7 Policy and Planning Context

19min
pages 76-87

3.4 Stakeholder Interviews and Outreach Events

4min
page 90

Figure 3-2: Omnitrans Virtual Audit Bus Stops Tour

1min
page 91

Figure 2-29: Census Tracts 6-9 Existing Bicycle Facilities

2min
pages 73-74

Figure 2-26: Census Tract 5 Existing Bicycle Facilities

2min
pages 67-68

Figure 2-27: Census Tract 5 Existing Pedestrian Facilities

1min
pages 69-70

Figure 2-23: Census Tract 4 Existing Bicycle Facilities

2min
pages 61-62

Figure 2-20: Census Tract 3 Existing Bicycle Facilities

2min
pages 55-56

Figure 2-24: Census Tract 4 Existing Pedestrian Facilities

1min
pages 63-64

Figure 2-21: Census Tract 3 Existing Pedestrian Facilities

1min
pages 57-58

Figure 2-18: Census Tract 2 Existing Pedestrian Facilities

1min
pages 51-52

Figure 2-17: Census Tract 2 Existing Bicycle Facilities

1min
pages 49-50

Figure 2-15: Census Tract 1 Existing Pedestrian Facilities

1min
pages 45-46

1.3 Omnitrans’ Ridership Characteristics

1min
pages 15-16

2.4 Bicycle Facilities

1min
page 36

Figure 2-16: Census Tract 2 Land Uses

1min
pages 47-48

Figure 2-1: Omnitrans’ Service Area

2min
pages 19-20

Figure 2-14: Census Tract 1 Existing Bicycle Facilities

2min
pages 43-44

Table 2-4: Collision Analysis per Census Tract16 Table 4-1: How Transit Improvements Can Reduce Urban

1min
page 25

2.3 Land Use

1min
page 32
Issuu converts static files into: digital portfolios, online yearbooks, online catalogs, digital photo albums and more. Sign up and create your flipbook.
OmniTrans Bus Stop Safety Improvement Plan by KTUA - Issuu