OmniTrans Bus Stop Safety Improvement Plan

Page 116

Bus Stop Safety Improvement Plan

4.4 Traffic Calming In addition to the pedestrian and bicycle solutions mentioned in the previous sections, certain traffic calming techniques can also be implemented to increase the accessibility for pedestrians and bicyclists to transit stops. Aside from increasing accessibility, traffic calming increases safety for pedestrians and cyclists, as well as safety for motorists. Traffic calming involves changes in street alignment, installation of challenges, and other physical measures to reduce traffic speeds and/ or cut-through motor vehicle traffic volumes. The intent of traffic calming is to alter driver behavior and to improve street safety, livability, and other public purposes. Other techniques consist of operational measures such as police enforcement and speed displays. The following examples provided are traffic calming measures that may be applied by cities throughout Omnitrans’ service area.

Roundabouts/Traffic Circles A roundabout is a circular intersection with yield control at its entry that allows a driver to proceed at controlled speeds in a counterclockwise direction around a central island. Roundabouts are designed to maximize motorized and non-motorized traffic through their innovative design that includes reconfigured sidewalks, bikeway bypasses, high-visibility crosswalks, pedestrian flashing beacons, and other traffic measures. Roundabouts are typically implemented on collector or arterial roadways and may require additional right-of-way.
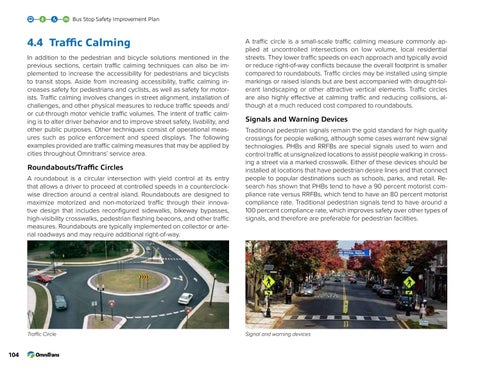
Traffic Circle

104

A traffic circle is a small-scale traffic calming measure commonly applied at uncontrolled intersections on low volume, local residential streets. They lower traffic speeds on each approach and typically avoid or reduce right-of-way conflicts because the overall footprint is smaller compared to roundabouts. Traffic circles may be installed using simple markings or raised islands but are best accompanied with drought-tolerant landscaping or other attractive vertical elements. Traffic circles are also highly effective at calming traffic and reducing collisions, although at a much reduced cost compared to roundabouts.

Signals and Warning Devices Traditional pedestrian signals remain the gold standard for high quality crossings for people walking, although some cases warrant new signal technologies. PHBs and RRFBs are special signals used to warn and control traffic at unsignalized locations to assist people walking in crossing a street via a marked crosswalk. Either of these devices should be installed at locations that have pedestrian desire lines and that connect people to popular destinations such as schools, parks, and retail. Research has shown that PHBs tend to have a 90 percent motorist compliance rate versus RRFBs, which tend to have an 80 percent motorist compliance rate. Traditional pedestrian signals tend to have around a 100 percent compliance rate, which improves safety over other types of signals, and therefore are preferable for pedestrian facilities.

Signal and warning devices


Turn static files into dynamic content formats.

Create a flipbook

Articles inside

Implementation

1min
pages 215-217

Table 5-32: Implementation Chart - Program Implementation Table 5-33: Implementation Chart - Infrastructure

3min
pages 213-214

Table 5-29: Census Tract 9 Bus Stop Improvements

2min
page 208

Table 5-30: Implementation Chart - Identify the Needs Table 5-31: Implementation Chart - Planning and

1min
page 211

5.6 Implementation Framework

2min
page 210

Assessment

1min
page 212

Table 5-28: Census Tract 9 Bicycle Improvements

1min
page 206

Figure 5-26: Census Tract 9 Pedestrian Recommendations

1min
page 205

Table 5-27: Census Tract 9 Pedestrian Improvements

1min
page 204

Figure 5-25: Census Tract 8 Bus Stop Recommendations

1min
page 203

Table 5-24: Census Tract 8 Pedestrian Improvements

1min
page 198

Table 5-26: Census Tract 8 Bus Stop Improvements

2min
page 202

Table 5-23: Census Tract 7 Bus Stop Improvements

2min
page 196

Table 5-25: Census Tract 8 Bicycle Improvements

1min
page 200

Figure 5-20: Census Tract 7 Pedestrian Recommendations

1min
page 193

Table 5-22: Census Tract 7 Bicycle Improvements

1min
page 194

Table 5-21: Census Tract 7 Pedestrian Improvements

1min
page 192

Table 5-20: Census Tract 6 Bus Stop Improvements

2min
page 190

Table 5-19: Census Tract 6 Bicycle Improvements

1min
page 188

Figure 5-17: Census Tract 6 Pedestrian Recommendations

1min
page 187

Table 5-18: Census Tract 6 Pedestrian Improvements

1min
page 186

Figure 5-16: Census Tract 5 Bus Stop Recommendations

1min
page 185

Figure 5-15: Census Tract 5 Bicycle Recommendations

1min
page 183

Table 5-17: Census Tract 5 Bus Stop Improvements

1min
page 184

Table 5-16: Census Tract 5 Bicycle Improvements

1min
page 182

Figure 5-14: Census Tract 5 Pedestrian Recommendations

1min
page 181

Table 5-15: Census Tract 5 Pedestrian Improvements

2min
page 180

Table 5-13: Census Tract 4 Bicycle Improvements

1min
page 176

Table 5-14: Census Tract 4 Bus Stop Improvements

2min
page 178

Figure 5-11: Census Tract 4 Pedestrian Recommendations

1min
page 175

Table 5-11: Census Tract 3 Bus Stop Improvements

1min
page 172

Table 5-12: Census Tract 4 Pedestrian Improvements

1min
page 174

Figure 5-8: Census Tract 3 Pedestrian Recommendations

1min
page 169

Table 5-9: Census Tract 3 Pedestrian Improvements

1min
page 168

Figure 5-7: Census Tract 2 Bus Stop Recommendations

1min
page 167

Table 5-8: Census Tract 2 Bus Stop Improvements

1min
page 166

Figure 5-4: Census Tract 1 Bus Stop Recommendations

1min
page 161

Figure 5-5: Census Tract 2 Pedestrian Recommendations

1min
page 163

Table 5-7: Census Tract 2 Bicycle Improvements

1min
page 164

Table 5-6: Census Tract 2 Pedestrian Improvements

1min
page 162

Table 5-5: Census Tract 1 Bus Stop Improvements

1min
page 160

4.6 Personal Safety Best Practices

33min
pages 127-143

Table 5-4: Census Tract 1 Bicycle Improvements

1min
page 158

5.3 Prioritization Analysis

8min
pages 149-151

Table 5-3: Census Tract 1 Pedestrian Improvements

1min
page 156

Guidelines

2min
page 144

5.4 Prioritized Bus Stop Access Project Types

2min
page 152

Figure 5-2: Census Tract 1 Pedestrian Recommendations

1min
page 157

Figure 4-6: Fatalities per Billion Passenger Miles Traveled 21

3min
pages 125-126

Figure 4-5: Median Treatment to Discourage Unsafe Pedestrian Midblock Crossing21

4min
pages 123-124

4.5 Best Practices Research

4min
pages 118-119

Figure 4-4: Strategy to Reduce Crime and Reduce Fear that Reduces Transit Ridership15

6min
pages 120-122

4.4 Traffic Calming

2min
pages 116-117

Crime 6

15min
pages 106-113

4.2 Bicycle and Pedestrian Solutions

5min
pages 104-105

4.1 Barriers and Solutions Overview

3min
pages 102-103

Figure 3-3: Virtual Audit Interactive Map

1min
page 92

3.9 Results from Outreach Events

7min
pages 96-101

2.7 Policy and Planning Context

19min
pages 76-87

3.4 Stakeholder Interviews and Outreach Events

4min
page 90

Figure 3-2: Omnitrans Virtual Audit Bus Stops Tour

1min
page 91

Figure 2-29: Census Tracts 6-9 Existing Bicycle Facilities

2min
pages 73-74

Figure 2-26: Census Tract 5 Existing Bicycle Facilities

2min
pages 67-68

Figure 2-27: Census Tract 5 Existing Pedestrian Facilities

1min
pages 69-70

Figure 2-23: Census Tract 4 Existing Bicycle Facilities

2min
pages 61-62

Figure 2-20: Census Tract 3 Existing Bicycle Facilities

2min
pages 55-56

Figure 2-24: Census Tract 4 Existing Pedestrian Facilities

1min
pages 63-64

Figure 2-21: Census Tract 3 Existing Pedestrian Facilities

1min
pages 57-58

Figure 2-18: Census Tract 2 Existing Pedestrian Facilities

1min
pages 51-52

Figure 2-17: Census Tract 2 Existing Bicycle Facilities

1min
pages 49-50

Figure 2-15: Census Tract 1 Existing Pedestrian Facilities

1min
pages 45-46

1.3 Omnitrans’ Ridership Characteristics

1min
pages 15-16

2.4 Bicycle Facilities

1min
page 36

Figure 2-16: Census Tract 2 Land Uses

1min
pages 47-48

Figure 2-1: Omnitrans’ Service Area

2min
pages 19-20

Figure 2-14: Census Tract 1 Existing Bicycle Facilities

2min
pages 43-44

Table 2-4: Collision Analysis per Census Tract16 Table 4-1: How Transit Improvements Can Reduce Urban

1min
page 25

2.3 Land Use

1min
page 32
Issuu converts static files into: digital portfolios, online yearbooks, online catalogs, digital photo albums and more. Sign up and create your flipbook.
OmniTrans Bus Stop Safety Improvement Plan by KTUA - Issuu