OmniTrans Bus Stop Safety Improvement Plan

Page 104

Bus Stop Safety Improvement Plan

4.2 Bicycle and Pedestrian Solutions While not universally applied, in general, travel for people walking in urban areas has long tended to be accommodated with features like sidewalks, crosswalks, dedicated signals, and curb extensions. The suggested pedestrian treatments in this section address a wide variety of issues identified within Omnitrans’ service area to enhance connectivity, safety, and access to transit stops. Pedestrian improvements help to ensure equitable multi-modal transportation because they serve populations that may not be able to afford a bicycle or likely to ride a bicycle, and instead rely on transit and walking. Newer innovations like pedestrian scrambles, modified signal timing, flashing beacons, and other pedestrian improvements are described in this chapter in addition to standard pedestrian treatments. An increased focus on providing safer, less stressful bicycle travel has occurred more recently across the United States, with significant transformation in the state of practice for bicycle travel over the last decade. Much of this may be attributed to bicycling’s changing role in the overall transportation system. No longer viewed as an “alternative” mode, it is increasingly considered as legitimate transportation that should be actively promoted as a means of achieving community environmental, social, and economic goals. While connectivity and convenience remain essential bicycle travel quality indicators, recent research indicates the increased acceptance and practice of daily bicycling will require “low-stress” bicycle routes, which are typically understood to be those that provide bicyclists with separation from high volume and high-speed vehicular traffic and mixing cyclists with traffic only on low volume, low speed roadways. The bicycle improvements in this chapter ensure more convenient, more comfortable, and safer access to and from transit stops.

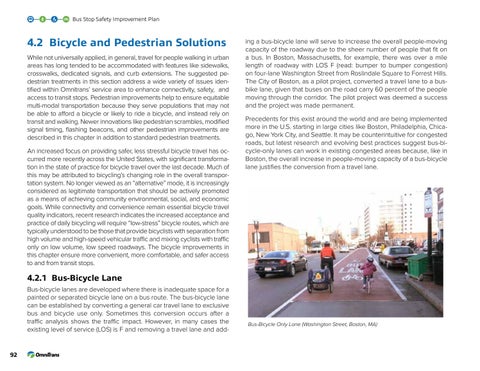
ing a bus-bicycle lane will serve to increase the overall people-moving capacity of the roadway due to the sheer number of people that fit on a bus. In Boston, Massachusetts, for example, there was over a mile length of roadway with LOS F (read: bumper to bumper congestion) on four-lane Washington Street from Roslindale Square to Forrest Hills. The City of Boston, as a pilot project, converted a travel lane to a busbike lane, given that buses on the road carry 60 percent of the people moving through the corridor. The pilot project was deemed a success and the project was made permanent. Precedents for this exist around the world and are being implemented more in the U.S. starting in large cities like Boston, Philadelphia, Chicago, New York City, and Seattle. It may be counterintuitive for congested roads, but latest research and evolving best practices suggest bus-bicycle-only lanes can work in existing congested areas because, like in Boston, the overall increase in people-moving capacity of a bus-bicycle lane justifies the conversion from a travel lane.

4.2.1 Bus-Bicycle Lane Bus-bicycle lanes are developed where there is inadequate space for a painted or separated bicycle lane on a bus route. The bus-bicycle lane can be established by converting a general car travel lane to exclusive bus and bicycle use only. Sometimes this conversion occurs after a traffic analysis shows the traffic impact. However, in many cases the existing level of service (LOS) is F and removing a travel lane and add-

92

Bus-Bicycle Only Lane (Washington Street, Boston, MA)


Turn static files into dynamic content formats.

Create a flipbook

Articles inside

Implementation

1min
pages 215-217

Table 5-32: Implementation Chart - Program Implementation Table 5-33: Implementation Chart - Infrastructure

3min
pages 213-214

Table 5-29: Census Tract 9 Bus Stop Improvements

2min
page 208

Table 5-30: Implementation Chart - Identify the Needs Table 5-31: Implementation Chart - Planning and

1min
page 211

5.6 Implementation Framework

2min
page 210

Assessment

1min
page 212

Table 5-28: Census Tract 9 Bicycle Improvements

1min
page 206

Figure 5-26: Census Tract 9 Pedestrian Recommendations

1min
page 205

Table 5-27: Census Tract 9 Pedestrian Improvements

1min
page 204

Figure 5-25: Census Tract 8 Bus Stop Recommendations

1min
page 203

Table 5-24: Census Tract 8 Pedestrian Improvements

1min
page 198

Table 5-26: Census Tract 8 Bus Stop Improvements

2min
page 202

Table 5-23: Census Tract 7 Bus Stop Improvements

2min
page 196

Table 5-25: Census Tract 8 Bicycle Improvements

1min
page 200

Figure 5-20: Census Tract 7 Pedestrian Recommendations

1min
page 193

Table 5-22: Census Tract 7 Bicycle Improvements

1min
page 194

Table 5-21: Census Tract 7 Pedestrian Improvements

1min
page 192

Table 5-20: Census Tract 6 Bus Stop Improvements

2min
page 190

Table 5-19: Census Tract 6 Bicycle Improvements

1min
page 188

Figure 5-17: Census Tract 6 Pedestrian Recommendations

1min
page 187

Table 5-18: Census Tract 6 Pedestrian Improvements

1min
page 186

Figure 5-16: Census Tract 5 Bus Stop Recommendations

1min
page 185

Figure 5-15: Census Tract 5 Bicycle Recommendations

1min
page 183

Table 5-17: Census Tract 5 Bus Stop Improvements

1min
page 184

Table 5-16: Census Tract 5 Bicycle Improvements

1min
page 182

Figure 5-14: Census Tract 5 Pedestrian Recommendations

1min
page 181

Table 5-15: Census Tract 5 Pedestrian Improvements

2min
page 180

Table 5-13: Census Tract 4 Bicycle Improvements

1min
page 176

Table 5-14: Census Tract 4 Bus Stop Improvements

2min
page 178

Figure 5-11: Census Tract 4 Pedestrian Recommendations

1min
page 175

Table 5-11: Census Tract 3 Bus Stop Improvements

1min
page 172

Table 5-12: Census Tract 4 Pedestrian Improvements

1min
page 174

Figure 5-8: Census Tract 3 Pedestrian Recommendations

1min
page 169

Table 5-9: Census Tract 3 Pedestrian Improvements

1min
page 168

Figure 5-7: Census Tract 2 Bus Stop Recommendations

1min
page 167

Table 5-8: Census Tract 2 Bus Stop Improvements

1min
page 166

Figure 5-4: Census Tract 1 Bus Stop Recommendations

1min
page 161

Figure 5-5: Census Tract 2 Pedestrian Recommendations

1min
page 163

Table 5-7: Census Tract 2 Bicycle Improvements

1min
page 164

Table 5-6: Census Tract 2 Pedestrian Improvements

1min
page 162

Table 5-5: Census Tract 1 Bus Stop Improvements

1min
page 160

4.6 Personal Safety Best Practices

33min
pages 127-143

Table 5-4: Census Tract 1 Bicycle Improvements

1min
page 158

5.3 Prioritization Analysis

8min
pages 149-151

Table 5-3: Census Tract 1 Pedestrian Improvements

1min
page 156

Guidelines

2min
page 144

5.4 Prioritized Bus Stop Access Project Types

2min
page 152

Figure 5-2: Census Tract 1 Pedestrian Recommendations

1min
page 157

Figure 4-6: Fatalities per Billion Passenger Miles Traveled 21

3min
pages 125-126

Figure 4-5: Median Treatment to Discourage Unsafe Pedestrian Midblock Crossing21

4min
pages 123-124

4.5 Best Practices Research

4min
pages 118-119

Figure 4-4: Strategy to Reduce Crime and Reduce Fear that Reduces Transit Ridership15

6min
pages 120-122

4.4 Traffic Calming

2min
pages 116-117

Crime 6

15min
pages 106-113

4.2 Bicycle and Pedestrian Solutions

5min
pages 104-105

4.1 Barriers and Solutions Overview

3min
pages 102-103

Figure 3-3: Virtual Audit Interactive Map

1min
page 92

3.9 Results from Outreach Events

7min
pages 96-101

2.7 Policy and Planning Context

19min
pages 76-87

3.4 Stakeholder Interviews and Outreach Events

4min
page 90

Figure 3-2: Omnitrans Virtual Audit Bus Stops Tour

1min
page 91

Figure 2-29: Census Tracts 6-9 Existing Bicycle Facilities

2min
pages 73-74

Figure 2-26: Census Tract 5 Existing Bicycle Facilities

2min
pages 67-68

Figure 2-27: Census Tract 5 Existing Pedestrian Facilities

1min
pages 69-70

Figure 2-23: Census Tract 4 Existing Bicycle Facilities

2min
pages 61-62

Figure 2-20: Census Tract 3 Existing Bicycle Facilities

2min
pages 55-56

Figure 2-24: Census Tract 4 Existing Pedestrian Facilities

1min
pages 63-64

Figure 2-21: Census Tract 3 Existing Pedestrian Facilities

1min
pages 57-58

Figure 2-18: Census Tract 2 Existing Pedestrian Facilities

1min
pages 51-52

Figure 2-17: Census Tract 2 Existing Bicycle Facilities

1min
pages 49-50

Figure 2-15: Census Tract 1 Existing Pedestrian Facilities

1min
pages 45-46

1.3 Omnitrans’ Ridership Characteristics

1min
pages 15-16

2.4 Bicycle Facilities

1min
page 36

Figure 2-16: Census Tract 2 Land Uses

1min
pages 47-48

Figure 2-1: Omnitrans’ Service Area

2min
pages 19-20

Figure 2-14: Census Tract 1 Existing Bicycle Facilities

2min
pages 43-44

Table 2-4: Collision Analysis per Census Tract16 Table 4-1: How Transit Improvements Can Reduce Urban

1min
page 25

2.3 Land Use

1min
page 32
Issuu converts static files into: digital portfolios, online yearbooks, online catalogs, digital photo albums and more. Sign up and create your flipbook.