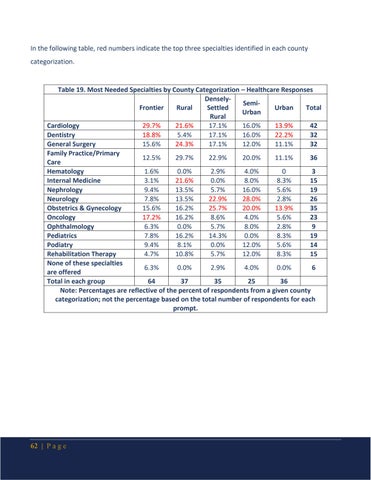
In the following table, red numbers indicate the top three specialties identified in each county categorization.
Table 19. Most Needed Specialties by County Categorization – Healthcare Responses DenselySemiFrontier Rural Settled Urban Total Urban Rural Cardiology 29.7% 21.6% 17.1% 16.0% 13.9% 42 Dentistry 18.8% 5.4% 17.1% 16.0% 22.2% 32 General Surgery 15.6% 24.3% 17.1% 12.0% 11.1% 32 Family Practice/Primary 12.5% 29.7% 22.9% 20.0% 11.1% 36 Care Hematology 1.6% 0.0% 2.9% 4.0% 0 3 Internal Medicine 3.1% 21.6% 0.0% 8.0% 8.3% 15 Nephrology 9.4% 13.5% 5.7% 16.0% 5.6% 19 Neurology 7.8% 13.5% 22.9% 28.0% 2.8% 26 Obstetrics & Gynecology 15.6% 16.2% 25.7% 20.0% 13.9% 35 Oncology 17.2% 16.2% 8.6% 4.0% 5.6% 23 Ophthalmology 6.3% 0.0% 5.7% 8.0% 2.8% 9 Pediatrics 7.8% 16.2% 14.3% 0.0% 8.3% 19 Podiatry 9.4% 8.1% 0.0% 12.0% 5.6% 14 Rehabilitation Therapy 4.7% 10.8% 5.7% 12.0% 8.3% 15 None of these specialties 6.3% 0.0% 2.9% 4.0% 0.0% 6 are offered Total in each group 64 37 35 25 36 Note: Percentages are reflective of the percent of respondents from a given county categorization; not the percentage based on the total number of respondents for each prompt.
62 | P a g e