5 minute read
International Journal for Research in Applied Science & Engineering Technology (IJRASET)


ISSN: 2321-9653; IC Value: 45.98; SJ Impact Factor: 7.538
Advertisement
Volume 11 Issue III Mar 2023- Available at www.ijraset.com
Author Title
1 Krishna Pal Sharma, ShivamKumar Singh, Ankur Choudhary, Himanshu Goel
2 Muhammad Husaini, Amgad Muneer, Shakirah Mohd Taib
3 Soudeh Javadi, Paras M Kathuria, Nisha S Gowda, Talha Ali Khan
4 Tamara zuvela, Sara Lazarevic, Sofia Djordjevic, Marko Arsenovic
5 Chandra Sekhar, M Padmaja, Aditya, Biswajit Sarangi,
6 A.Rana, R.Kachchhi, J. Baradia, V. Shelke
7 T. Awoke, M. Rout, L. Mohanty, S. C. Satapathy
“Price Prediction of Bitcoin using Social media activities and past trends”
“Crypto currency price prediction using LSTM with Twitter sentiment analysis”
“Bitcoin price prediction using LSTM”
“Crypto currency price prediction using Deep Learning”
Methodology
Analysis of informative trends in social groups, media and extract information to improve prediction accuracy of crypto currency price fluctuations.
Sentiment analysis of twitter used for listing the earlier price fluctuated data and added to LSTM predicted price inorder to forecast future prices.
Model was implemented using last year data to train and test the data set because of fluctuations of price and resulted with acceptable accuracy using the LSTM with Recurrent neural network.
It relied on LSTM to predict value for next N Daysbased on previous days value and then a trained model recieves values for backward and predicts Future desired day and they developed a Front end page application.
2022
2022
2022
2022
“Prediction of Crypto currency using LSTM and XG BOOST”
XG Boost Algorithm used to predict prices of crypto currency better and found a better mean value deviation error tyan LSTM
“Stock Market Prediction Using Deep Learning” while implementing a highly accurate LSTM model, have conducted their research on a large scale, thus making their methodology a bit complex.
“Bitcoin Price Prediction and Analysis Using Deep Learning Models”
8 Q. Guo, S. Lei, Q. Ye, Z. Fang “MRC-LSTM: A Hybrid Approach of Multi-scale Residual CNN and LSTM to Predict Bitcoin Price”
9 Akshay Bhat, Neha Mangla, Ganesh Avarbratha, Narayana Bhat
They have considered basic deep learning models like GRU and LSTM. However, their research lacks further investigation to enhance the model accuracy by considering different parameters.
Used a hybrid method consisting of multi-scale residual blocks and an LSTM network to predict Bitcoin price. Although, their work does not include comprehensive metrics which measure the investor’s attention to more timely detection of bitcoin market volatility, therefore resulting in a less accurate prediction.
“Bitcoin Price Prediction Using Machine Learning” Compared four different price prediction models: Recurrent Neural Networks (RNN), Logistic Regression, Support Vector Machine, and Auto Regressive Integrated Moving Average (ARIMA). Their major findings are that- ARIMA performs poorly for predictions extending beyond the next day. Their RNN model can accurately predict price fluctuations for up to six days. And the logistic regression model can give accurate results only if a separable hyperplane exists.
They obtained highly accurate results on implementing their prediction Gated Recurrent Unit (GRU) model. However, their prototype has a large time complexity. Thus, complicating the expected results in this ever-changing environment. Additionally, the selected features aren’t enough to predict the Bitcoin prices; as various factors like social media, policies, and laws that each country announces to deal with digital currency
2022
2021
2021
2021
2019
2018
ISSN: 2321-9653; IC Value: 45.98; SJ Impact Factor: 7.538
Volume 11 Issue III Mar 2023- Available at www.ijraset.com
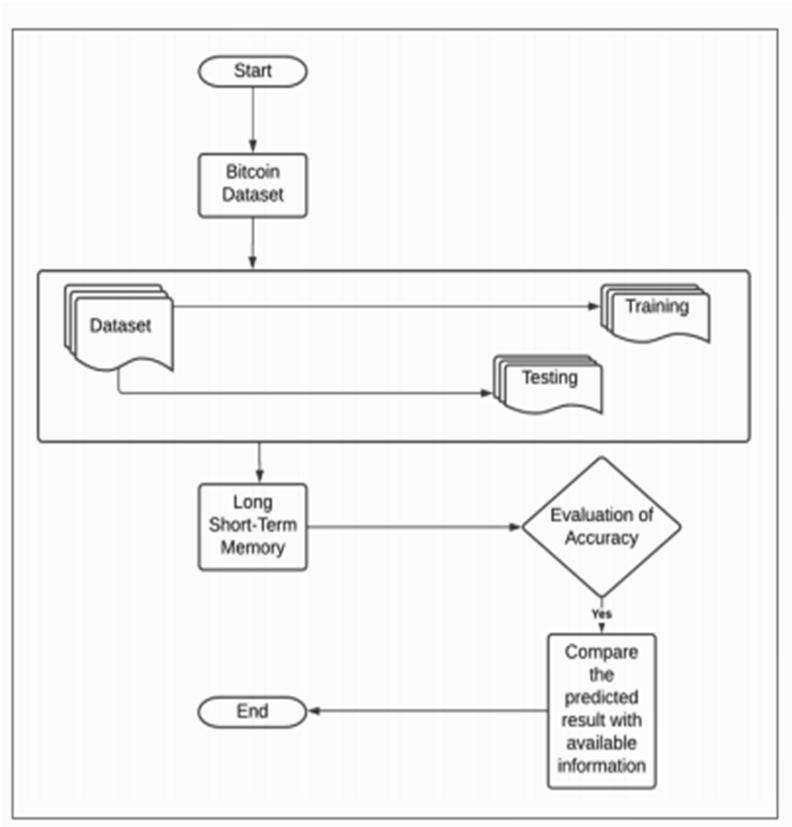
III. PROPOSED METHODOLOGY
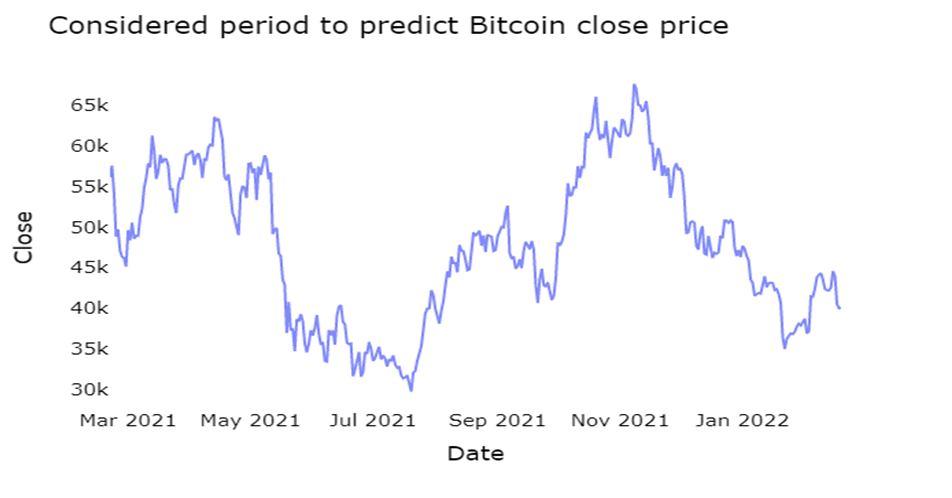
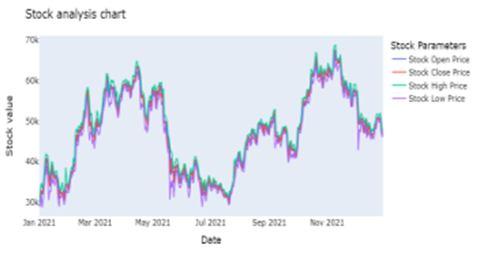
Firstly, we collect the data set from the online source: Yahoo finance. The data set represents the Bitcoin price in United States Dollars (USD). The dataset includes all the information about bitcoin prices from 23rd October, 2014 to 5th January, 2022

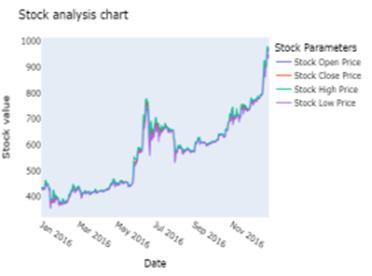
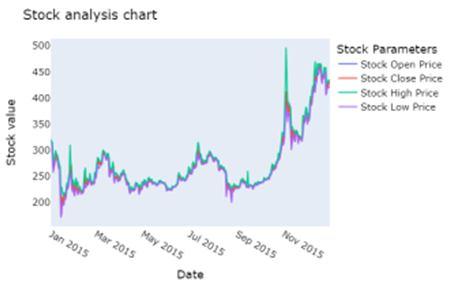
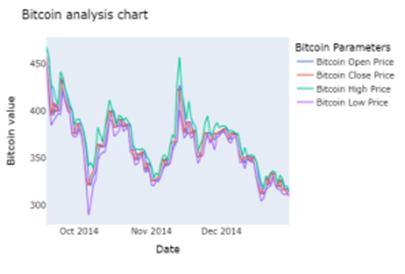
The second step involves filtering and cleaning the data set. This involves removing all the incomplete data from the rows. It also involves filtering out unnecessary features present in the data collected. For our model, we will only use the columns labelled : Date, Price, Open, High, and Low, as shown in Table below :
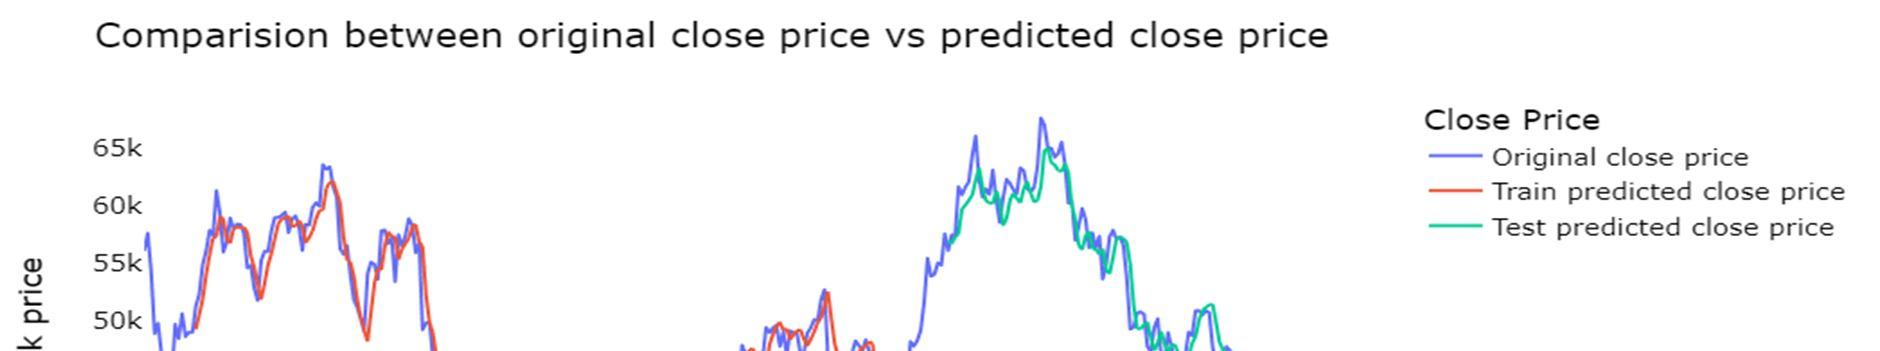
The next step is training, followed by testing the dataset. We train our model, using the algorithm and the features taken into account to assist our model, to predict the future price of the crypto currency. Moving on to the testing part, we test the data to measure the accuracy of the algorithm that our model is using to predict the price of the Bitcoin. Finally after the processes of training with the help of the data set features and testing, we evaluate the accuracy of our model. We compare the predicted price of the crypto currency, at a given time period with the real world Bitcoin price at that particular period of time, and evaluate the accuracy and efficiency of our model
IV. IMPLEMENTATION
1) Lag Plots : After the dataset has been filtered and cleaned, we need to generate a lag plot of the time series data. A lag in a time series data defines how much a data point is falling behind in time from another data point. Lag plots are put into use to analyse and find out whether the time series data follows any pattern
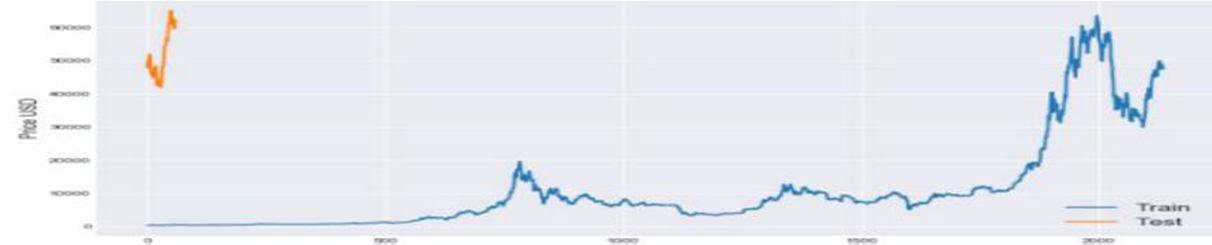
2) Train-Test Split : Now, the next step that is needed to be performed is train_x0002_test split. For our model, we will be considering sixty numbers of data samples for implementing the testing, and the rest of the re-sampled data as the training sample.
ISSN: 2321-9653; IC Value: 45.98; SJ Impact Factor: 7.538
Volume 11 Issue III Mar 2023- Available at www.ijraset.com
3) Scaling : we are going to scale the data, as we need the training and the test set to be scaled. One important point that needs to be mentioned is that the scaling should be performed after the train-test split has been performed, because scaling before the train-test split would introduce data leakage from the test set to the training set.
4) Data Generator : We frame our model, using a “lookback” period to take a window of the last five days of data to predict the data of the current day. A new function is defined, which will split the input sequence into windows of data appropriate for fitting a LSTM model.
5) Restructuring Input into a shape of 3D Tensor : For LSTM, we have to reshape the input data into the shape of a three dimensional Tensor of samples, timesteps, and features. Samples are the amount of data points that we are having.Thus, timesteps is equivalent to the number of time steps we are to be running our RNN. Finally, features include the amount of features in every timestep.
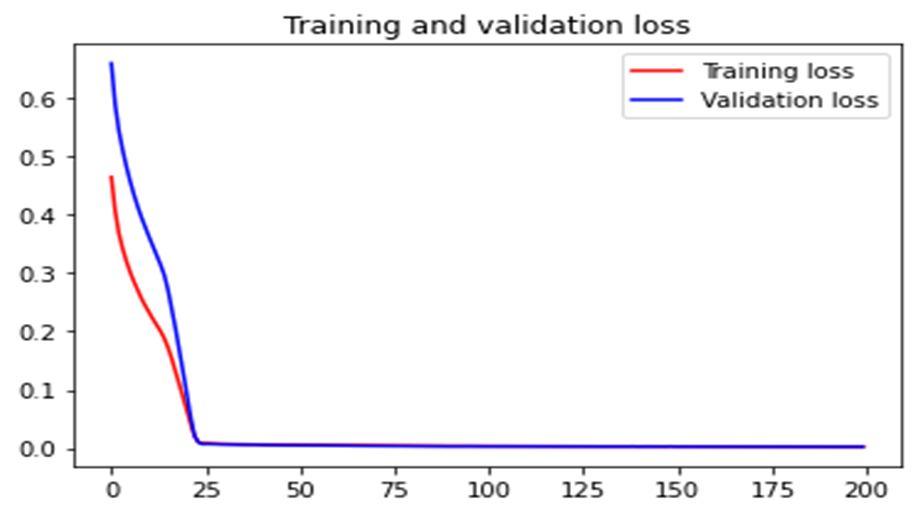
6) Generating the epochs : From the callback module of the keras library we are importing the callbacks: ModelCheckpoint, and EarlyStopping. These callbacks are used as a best practice to save the model at various checkpoints or after each epoch.
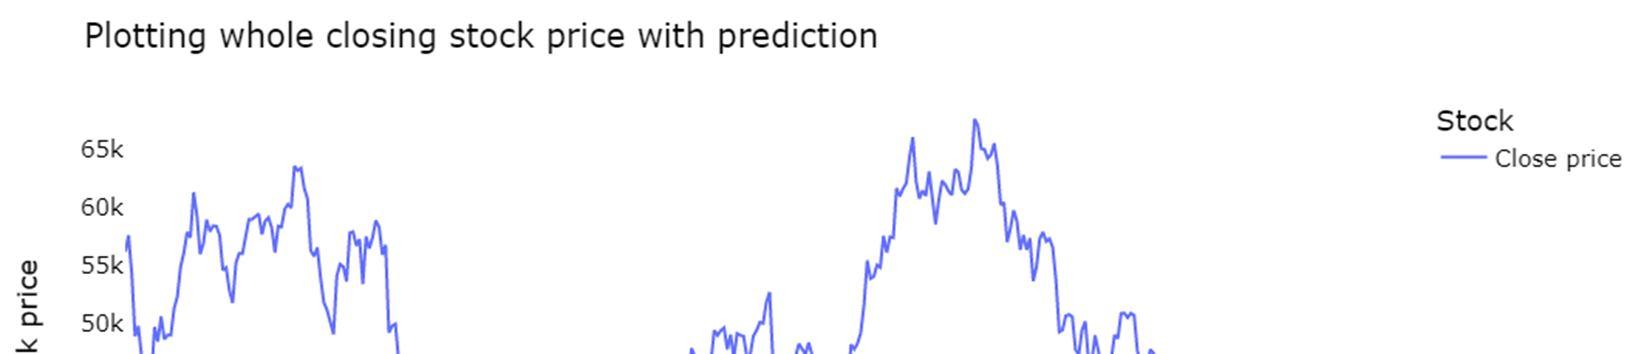
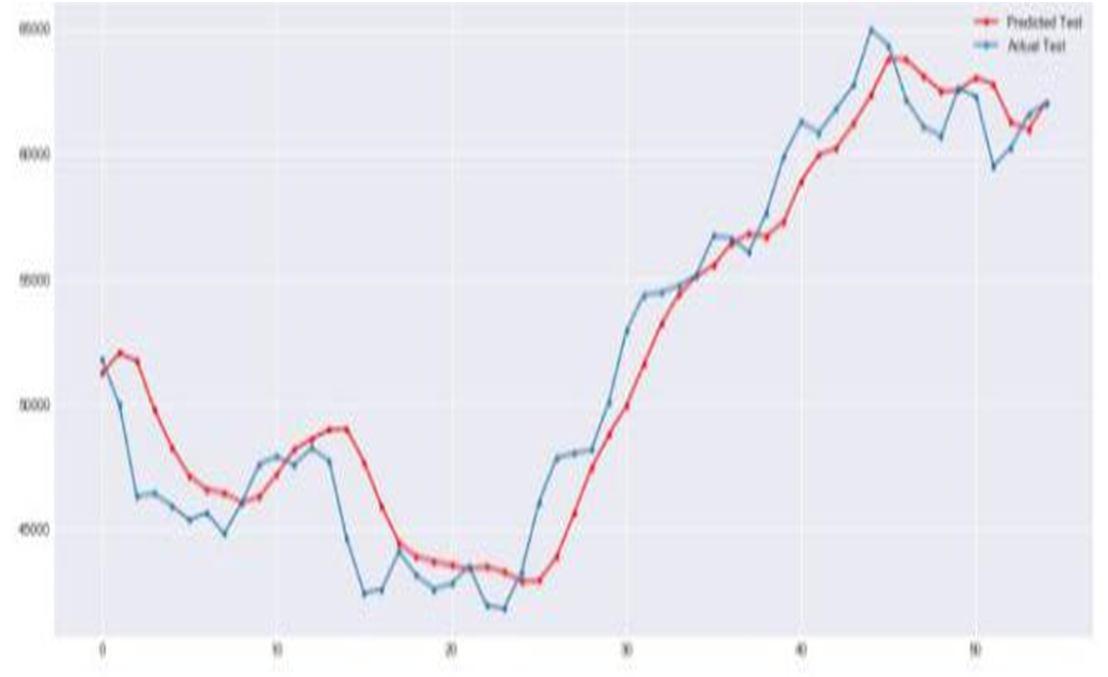
7) LSTM Prediction using testX and plotting line graph against actual testY : Due to scaling done earlier with the help of MinMaxScaler, the predicted scale will be between zero and one. We have to transfer this scale to the original data scale. Thus, we are going to use inverse transformation to scale back the data to the original presentation.
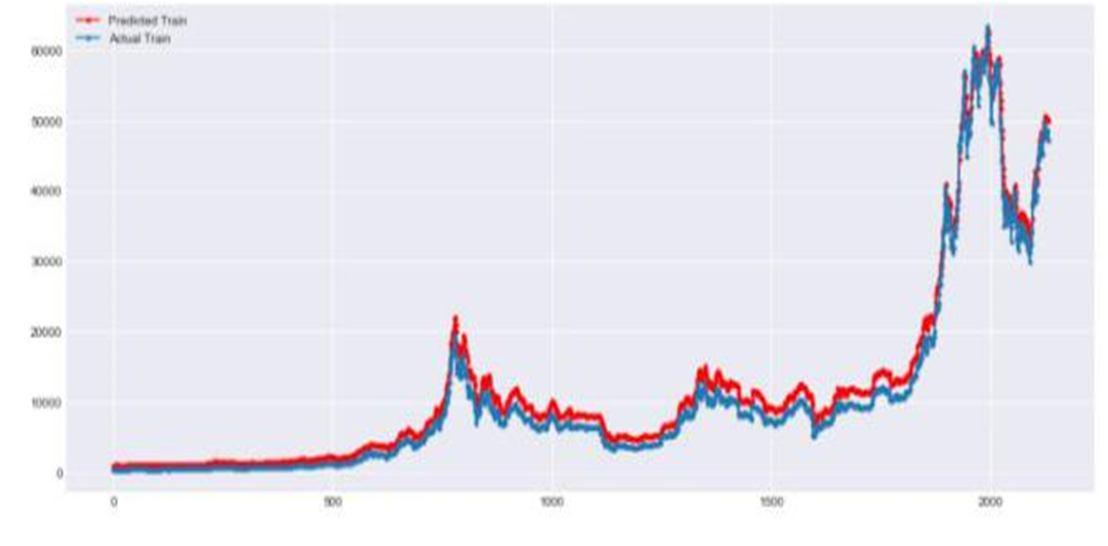
8) LSTM Prediction using trainX and plotting line graph against actual trainY: This step is similar to the previous step, except the fact that we are performing inverse transformations on the train data.
ISSN: 2321-9653; IC Value: 45.98; SJ Impact Factor: 7.538
Volume 11 Issue III Mar 2023- Available at www.ijraset.com
9) Root Mean Square Error: Finally, we will be generating the root mean square error (RMSE) for both the test and the train data. RMSE is the measure of how well a regression line will fit the data points. The RMSE loss achieved for train data is much lesser compared to the RMSE loss for test data, because the whole training and fit function was run on the training data set.
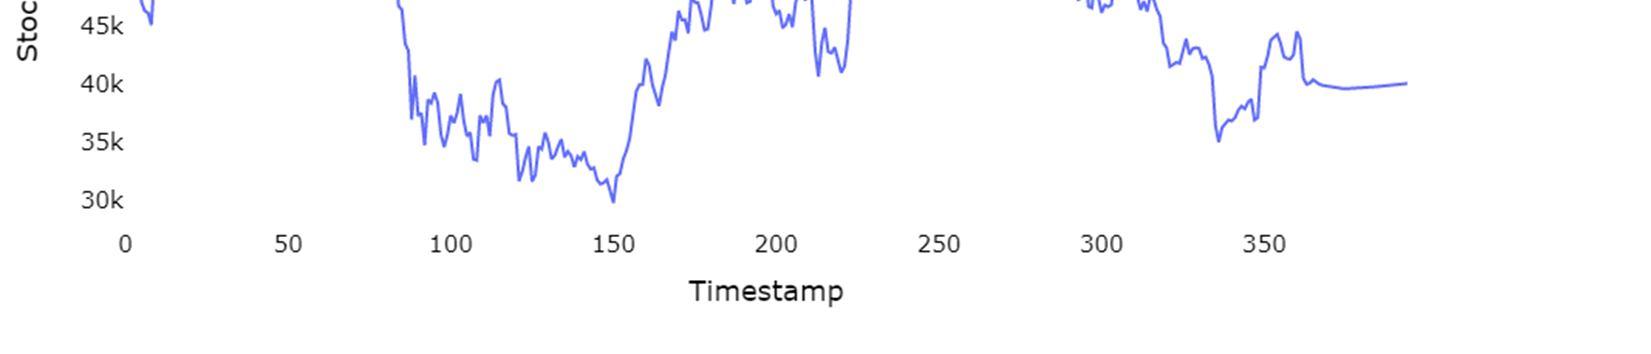
A. Results
Now, we have a trained LSTM model on historical data, we are generating predictions on Bitcoin prices for the future 30 days. From the dataset that we use for the model, the Bitcoin price on 5th January 2022 is the last historical price that we are having. Thus now, we are going beyond that date to predict the Bitcoin prices for the next 30 days.