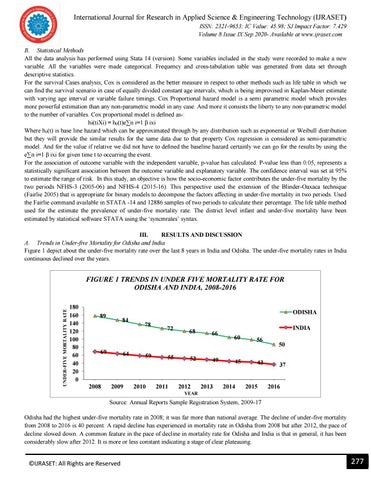
International Journal for Research in Applied Science & Engineering Technology (IJRASET) ISSN: 2321-9653; IC Value: 45.98; SJ Impact Factor: 7.429 Volume 8 Issue IX Sep 2020- Available at www.ijraset.com B. Statistical Methods All the data analysis has performed using Stata 14 (version). Some variables included in the study were recorded to make a new variable. All the variables were made categorical. Frequency and cross-tabulation table was generated from data set through descriptive statistics. For the survival Cases analysis, Cox is considered as the better measure in respect to other methods such as life table in which we can find the survival scenario in case of equally divided constant age intervals, which is being improvised in Kaplan-Meier estimate with varying age interval or variable failure timings. Cox Proportional hazard model is a semi parametric model which provides more powerful estimation than any non-parametric model in any case. And more it consists the liberty to any non-parametric model to the number of variables. Cox proportional model is defined as-: hi(tiXi) = h0(t)e∑n i=1 β ixi Where h0(t) is base line hazard which can be approximated through by any distribution such as exponential or Weibull distribution but they will provide the similar results for the same data due to that property Cox regression is considered as semi-parametric model. And for the value if relative we did not have to defined the baseline hazard certainly we can go for the results by using the e∑n i=1 β ixi for given time t to occurring the event. For the association of outcome variable with the independent variable, p-value has calculated. P-value less than 0.05, represents a statistically significant association between the outcome variable and explanatory variable. The confidence interval was set at 95% to estimate the range of risk. In this study, an objective is how the socio-economic factor contributes the under-five mortality by the two periods NFHS-3 (2005-06) and NFHS-4 (2015-16). This perspective used the extension of the Blinder-Oaxaca technique (Fairlie 2005) that is appropriate for binary models to decompose the factors affecting in under-five mortality in two periods. Used the Fairlie command available in STATA -14 and 12886 samples of two periods to calculate their percentage. The life table method used for the estimate the prevalence of under-five mortality rate. The district level infant and under-five mortality have been estimated by statistical software STATA using the ‘syncmrates’ syntax. III. RESULTS AND DISCUSSION A. Trends in Under-five Mortality for Odisha and India Figure 1 depict about the under-five mortality rate over the last 8 years in India and Odisha. The under-five mortality rates in India continuous declined over the years.
UNDER-FIVE MORTALITY RATE
FIGURE 1 TRENDS IN UNDER FIVE MORTALITY RATE FOR ODISHA AND INDIA, 2008-2016 180 160 140 120 100 80 60 40 20 0
ODISHA
89
84
69
2008
64
2009
78
59
2010
72
55
2011
68
52
2012
INDIA 66
49
2013
60
45
2014
56
43
2015
50 37
2016
YEAR
Source: Annual Reports Sample Registration System, 2009-17 Odisha had the highest under-five mortality rate in 2008; it was far more than national average. The decline of under-five mortality from 2008 to 2016 is 40 percent. A rapid decline has experienced in mortality rate in Odisha from 2008 but after 2012, the pace of decline slowed down. A common feature in the pace of decline in mortality rate for Odisha and India is that in general, it has been considerably slow after 2012. It is more or less constant indicating a stage of clear plateauing.
©IJRASET: All Rights are Reserved
277

