RETIREES
Chart 1: Australian and Global Equities Portfolio – Historical Income
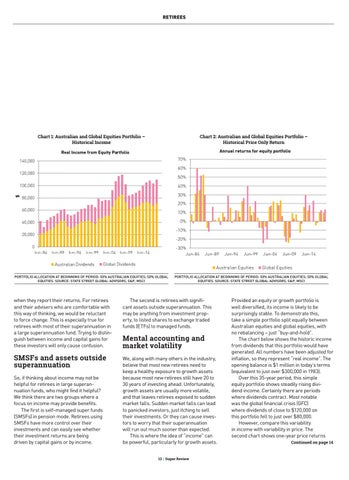
Chart 2: Australian and Global Equities Portfolio – Historical Price Only Return
PORTFOLIO ALLOCATION AT BEGINNING OF PERIOD: 50% AUSTRALIAN EQUITIES; 50% GLOBAL EQUITIES. SOURCE: STATE STREET GLOBAL ADVISORS, S&P, MSCI
when they report their returns. For retirees and their advisers who are comfortable with this way of thinking, we would be reluctant to force change. This is especially true for retirees with most of their superannuation in a large superannuation fund. Trying to distinguish between income and capital gains for these investors will only cause confusion.
SMSFs and assets outside superannuation So, if thinking about income may not be helpful for retirees in large superannuation funds, who might find it helpful? We think there are two groups where a focus on income may provide benefits. The first is self-managed super funds (SMSFs) in pension mode. Retirees using SMSFs have more control over their investments and can easily see whether their investment returns are being driven by capital gains or by income.
PORTFOLIO ALLOCATION AT BEGINNING OF PERIOD: 50% AUSTRALIAN EQUITIES; 50% GLOBAL EQUITIES. SOURCE: STATE STREET GLOBAL ADVISORS, S&P, MSCI
The second is retirees with significant assets outside superannuation. This may be anything from investment property, to listed shares to exchange traded funds (ETFs) to managed funds.
Mental accounting and market volatility We, along with many others in the industry, believe that most new retirees need to keep a healthy exposure to growth assets because most new retirees still have 20 to 30 years of investing ahead. Unfortunately, growth assets are usually more volatile, and that leaves retirees exposed to sudden market falls. Sudden market falls can lead to panicked investors, just itching to sell their investments. Or they can cause investors to worry that their superannuation will run out much sooner than expected. This is where the idea of “income” can be powerful, particularly for growth assets.
Provided an equity or growth portfolio is well diversified, its income is likely to be surprisingly stable. To demonstrate this, take a simple portfolio split equally between Australian equities and global equities, with no rebalancing – just “buy-and-hold”. The chart below shows the historic income from dividends that this portfolio would have generated. All numbers have been adjusted for inflation, so they represent “real income”. The opening balance is $1 million in today’s terms (equivalent to just over $300,000 in 1983). Over this 35-year period, this simple equity portfolio shows steadily rising dividend income. Certainly there are periods where dividends contract. Most notable was the global financial crisis (GFC) where dividends of close to $120,000 on this portfolio fell to just over $80,000. However, compare this variability in income with variability in price. The second chart shows one-year price returns Continued on page 14
13 | Super Review
02SR230420_01-16.indd 13
15/04/2020 4:03:25 PM

